Sample Category Title
Canada CPI slowed to 5.9% yoy in Jan, Ex food and energy down to 4.9% yoy
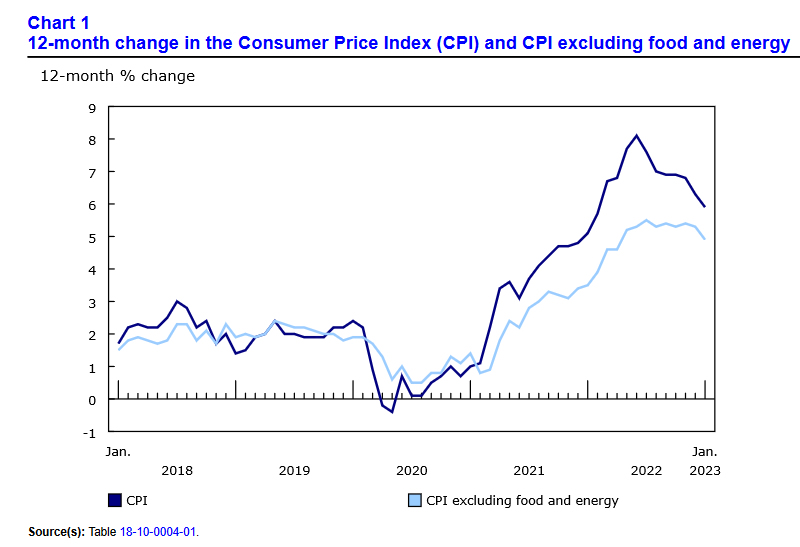
Canada CPI slowed from 6.3% yoy to 5.9% yoy in Jan. StatsCan noted that "Prices for cellular services and passenger vehicles contributed to the deceleration in the all-items CPI. However, mortgage interest cost and prices for food continue to rise." Excluding food and energy, CPI also slowed to 4.9% yoy while ex-mortgage CPI slowed to 5.4% yoy.
CPI median was unchanged at 5.0% yoy. CPI trimmed slowed form 5.3% yoy to 5.1% yoy. CPI common was unchanged at 6.6% yoy.
On a monthly basis, CPI rose 0.5% mom. Higher gasoline prices contributed the most to the month-over-month increase, followed by a rise in mortgage interest cost and meat prices.
EUR/GBP Daily Outlook
Daily Pivots: (S1) 0.8867; (P) 0.8879; (R1) 0.8888; More...
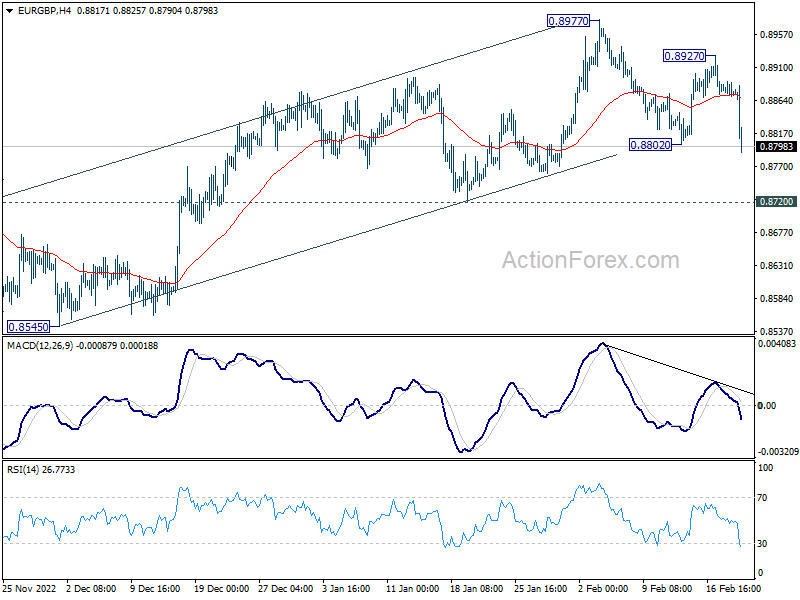
EUR/GBP's fall from 0.8977 resumed by breaking through 0.8802 today. The development now argues that whole rebound from 0.8545 has completed. Intraday bias is back on the downside for 0.8720 support first. Break there will bring deeper decline to retest 0.8545. For now, risk will stay on the downside as long as 0.8927 resistance holds, in case of recovery.
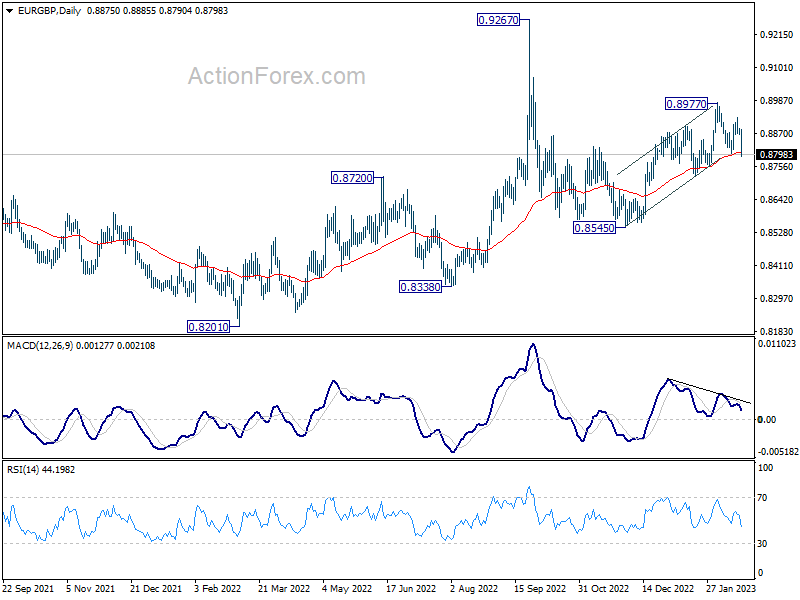
In the bigger picture, focus is back on 55 day EMA (now at 0.8804). Sustained trading below there will argue that fall from 0.9267 is in progress. Such decline is seen as a leg inside long term range pattern from 0.9499 (2020 high). Break of 0.8545 will pave the way back to 0.8201 (2022 low).
GBP/JPY Mid-Day Outlook
Daily Pivots: (S1) 161.32; (P) 161.53; (R1) 161.88; More...
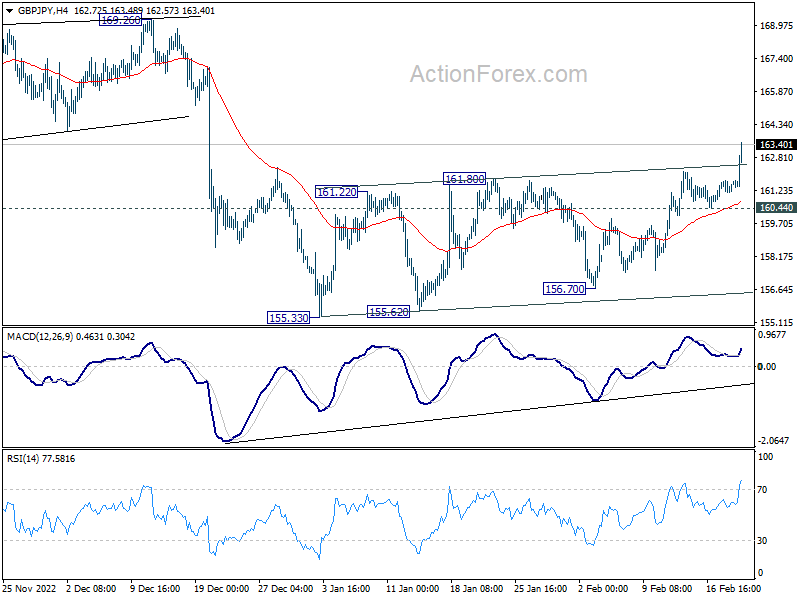
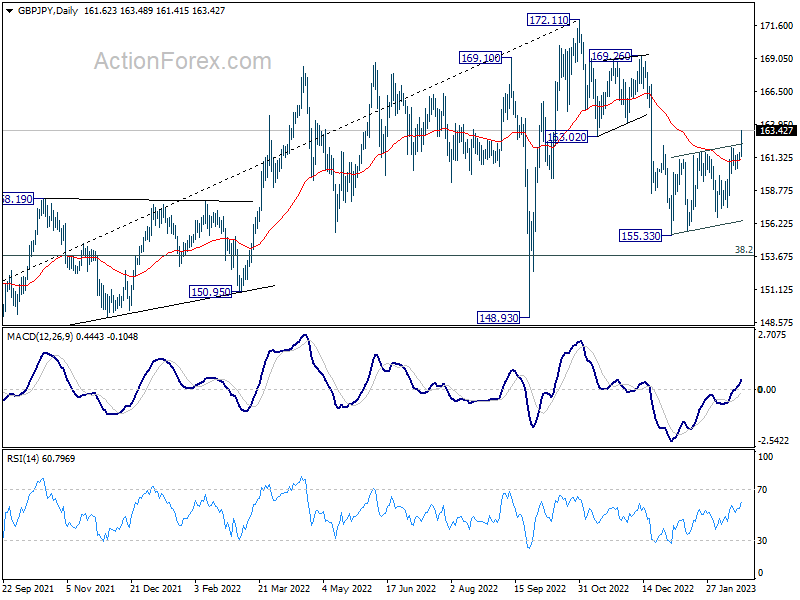
GBP/JPY's rebound from 155.33 finally accelerates higher and the development argues that whole correction from 172.11 has completed with three waves down to 155.33. 163.02 support turned resistance was taken out too. Intraday bias is back on the upside for 169.26/172.11 resistance zone. For now, further rally will remain in favor as long as 160.44 minor support holds, in case of retreat.
In the bigger picture, corrective decline from 172.11 medium term should have completed at 155.33. With 38.2% retracement of 123.94 to 172.11 at 153.70 intact, medium term bullishness is retained. That is, larger up trend from 123.94 (2020 low) is still in progress. Break of 172.11 high to resume such up trend is expected at a later stage.
Australian Dollar Dips after RBA Minutes
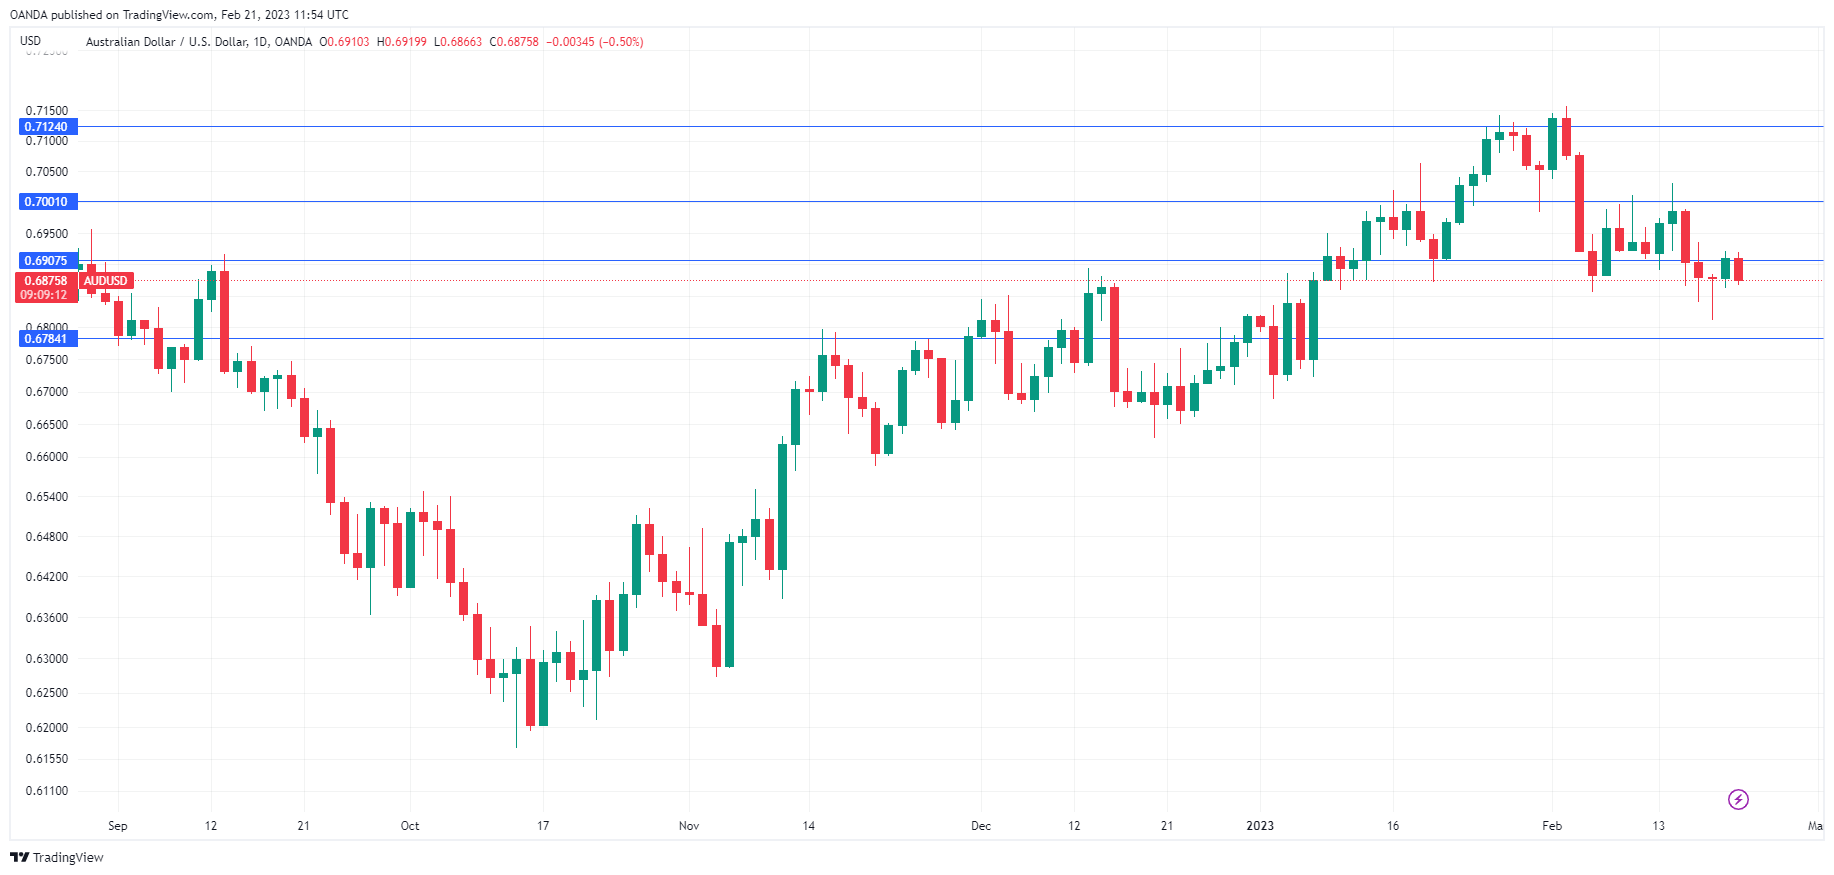
The Australian dollar is in negative territory on Tuesday. In European trade, AUD/USD is trading at 0.6876, down 0.50%.
RBA minutes indicate concern over inflation
The Reserve Bank of Australia keeps getting in the way of the Australian dollar. RBA Governor Lowe appeared before a parliamentary committee last Wednesday and confirmed that further rate hikes were on the way as inflation was still unacceptably high. The Aussie responded by dropping 1.1%. The RBA minutes were released today and members expressed concern at the upside risk to inflation, noting that there was “more breadth and persistence” in inflation. The hawkish tone of the minutes has boosted rate-hike bets but the Australian dollar remains under pressure over concerns that the RBA is having trouble getting a handle on inflation, despite its aggressive rate-tightening cycle. Again, the Aussie has responded with losses.
How much higher will interest rates go? That will depend to a large extent on upcoming data, starting with Wednesday’s Wage Price Index for Q4. Wages are expected to have climbed 3.5% y/y in Q4, up from 3.1% and the highest level since September 2012. Wages are an important driver of inflation and higher wages will make it more difficult for the Bank to curb inflation.
The RBA minutes also indicated that members debated whether to raise rates by 25 or 50 basis points. Ultimately, the RBA opted for a modest 25-bp increase, which brought the cash rate to 3.35%. The money markets are projecting a terminal cash rate of 4.25% by August, which means that the RBA will likely be busy in the coming months.
We’ll also hear from the Federal Reserve on Wednesday, with the release of the minutes from the February meeting. The Fed didn’t have any surprises and raised rates by 25 basis points. The markets will be looking to see how close the Fed was to hiking by 50 basis points. If the rate decision was a close call, the US dollar could continue to rally.
AUD/USD Technical
- AUD/USD is testing support at 0.6907. Below, there is support at 0.6784
- There is resistance at 0.7001 and 0.7124
Gold: End of correction or new downturn?
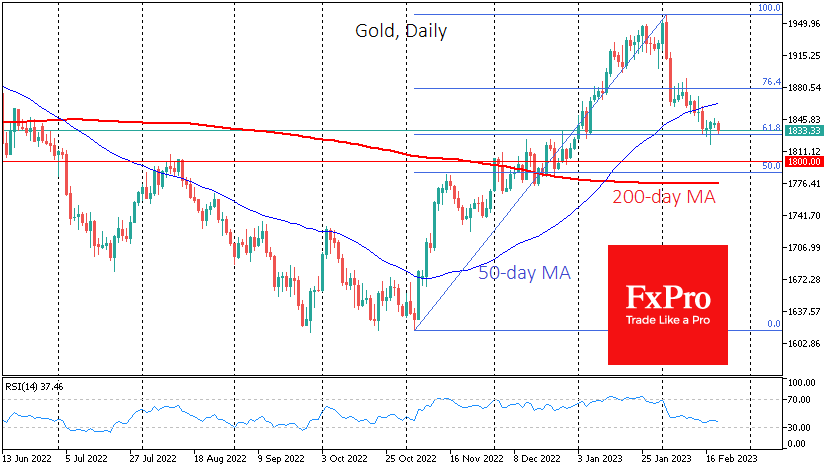
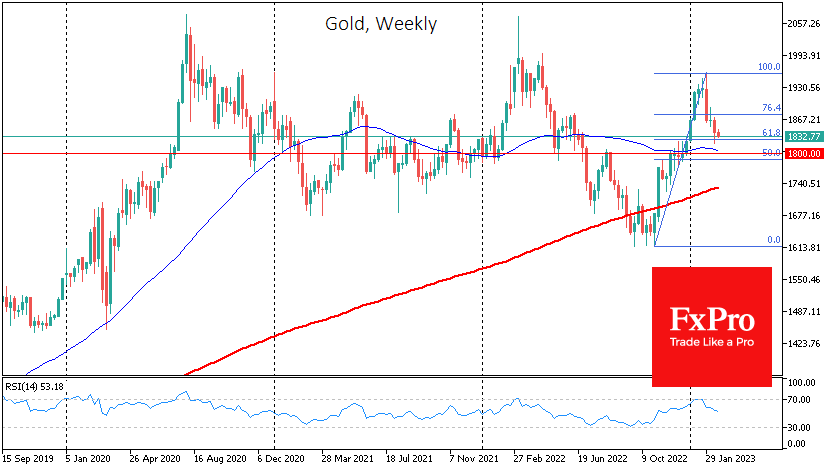
Gold has lost more than 6.5% from its early February highs, correcting the November-January rally. Now it’s time to decide on the next trend. The coming days should show whether we will see a new wave of growth in gold or whether the decline will continue.
From the beginning of November to the first days of February, gold gained more than 21%. The February declines stabilised the price at 61.8% of the initial rally, a classic retracement. This pattern suggests buyers are returning and opens the potential for a rally to $2170 (161.8% of the initial rally). A more conservative view suggests that the path to new highs will only open up after a sharp rise above previous highs at $1960.
Another indicator, the Relative Strength Index (RSI) on the daily timeframe, suggests that there is still room for a decline. According to this indicator, gold has been overbought for most of January and has yet to reach the oversold zone.
On the weekly timeframe, the reversal in February coincided with a touch of overbought conditions, and so far, the indicator remains above 50, indicating the potential for further declines.
In addition, we note that mid-month gold fell below the 50-day moving average, which has worked well as a short-term trend indicator over the past year. When gold breaks below this moving average without any resistance from buyers, it looks like a signal that bearish sentiment is prevailing.
It is worth being prepared for the fact that gold’s decline has paused but not ended. Up to the $1775-1800 area, we do not see any significant barriers to the fall. A break there would also allow the overbought RSI to correct fully. Gold has reversed several times near $1800, especially last year.
GBP/USD: Cable Surges after Upbeat UK PMI Data
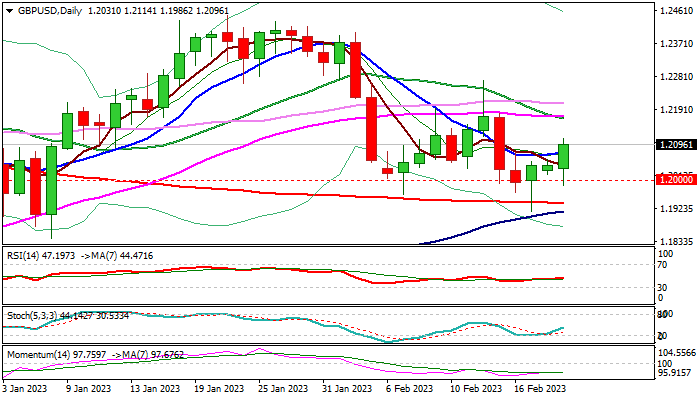
Cable jumped over one full figure and ticked above 1.21 mark on Tuesday, following upbeat Feb UK PMI data.
Report from UK economy’s dominant services sector showed PMI jumping to 53.3 in February (the highest since July) from 48.7 previous month and strongly beating 49.2 forecast.
Composite PMI which tracks the activity in both, services and manufacturing sectors and provides more details about the health of the economy, rose to 53.0 in February from 48.5 in January and well above 49.0 consensus. Both indicators establish above 50 threshold which divides growth from contraction, generating positive signals.
Manufacturing PMI also made a significant gains (Feb 49.2 vs Jan 47.0 and 47.5 f/c), although remains below 50 level.
Much better than expected PMI reports boost optimism about the economy’s performance in the first quarter and also contribute to Bank of England’s hawkish shift in interest rate expectations.
Technical picture on daily chart is improving after larger bears repeatedly failed to register clear break below psychological 1.20 support, as today’s bullish acceleration added to signal of bear-trap under 200DMA (1.1935).
Fresh rally probed above the top of daily Ichimoku cloud (1.2107), with close above the cloud (also near 50% retracement of 1.2269/1.1914 bear-leg) to firm near-term structure and add to reversal signals, opening way for further recovery.
Also, daily 100 and 200 moving averages are converging and on track to form a bull-cross, which would additionally support the action and contribute to positive signals from north-heading RSI and stochastic.
However, 14-d momentum indicator is still in negative territory that partially offsets bullish signals.
The near-term price action needs to hold above 1.2050, which is the minimum requirement to keep bullish bias, however, repeated failure to clear pivotal 1.2100 zone would signal weakening and keep the downside vulnerable.
Loss of 1.2050 support would risk renewed probe through 1.20 level and 200DMA.
Res: 1.2114; 1.2134; 1.2185; 1.2200.
Sup: 1.2075; 1.2050; 1.2000; 1.1935.
NZD/USD Eyes Central Bank Meeting
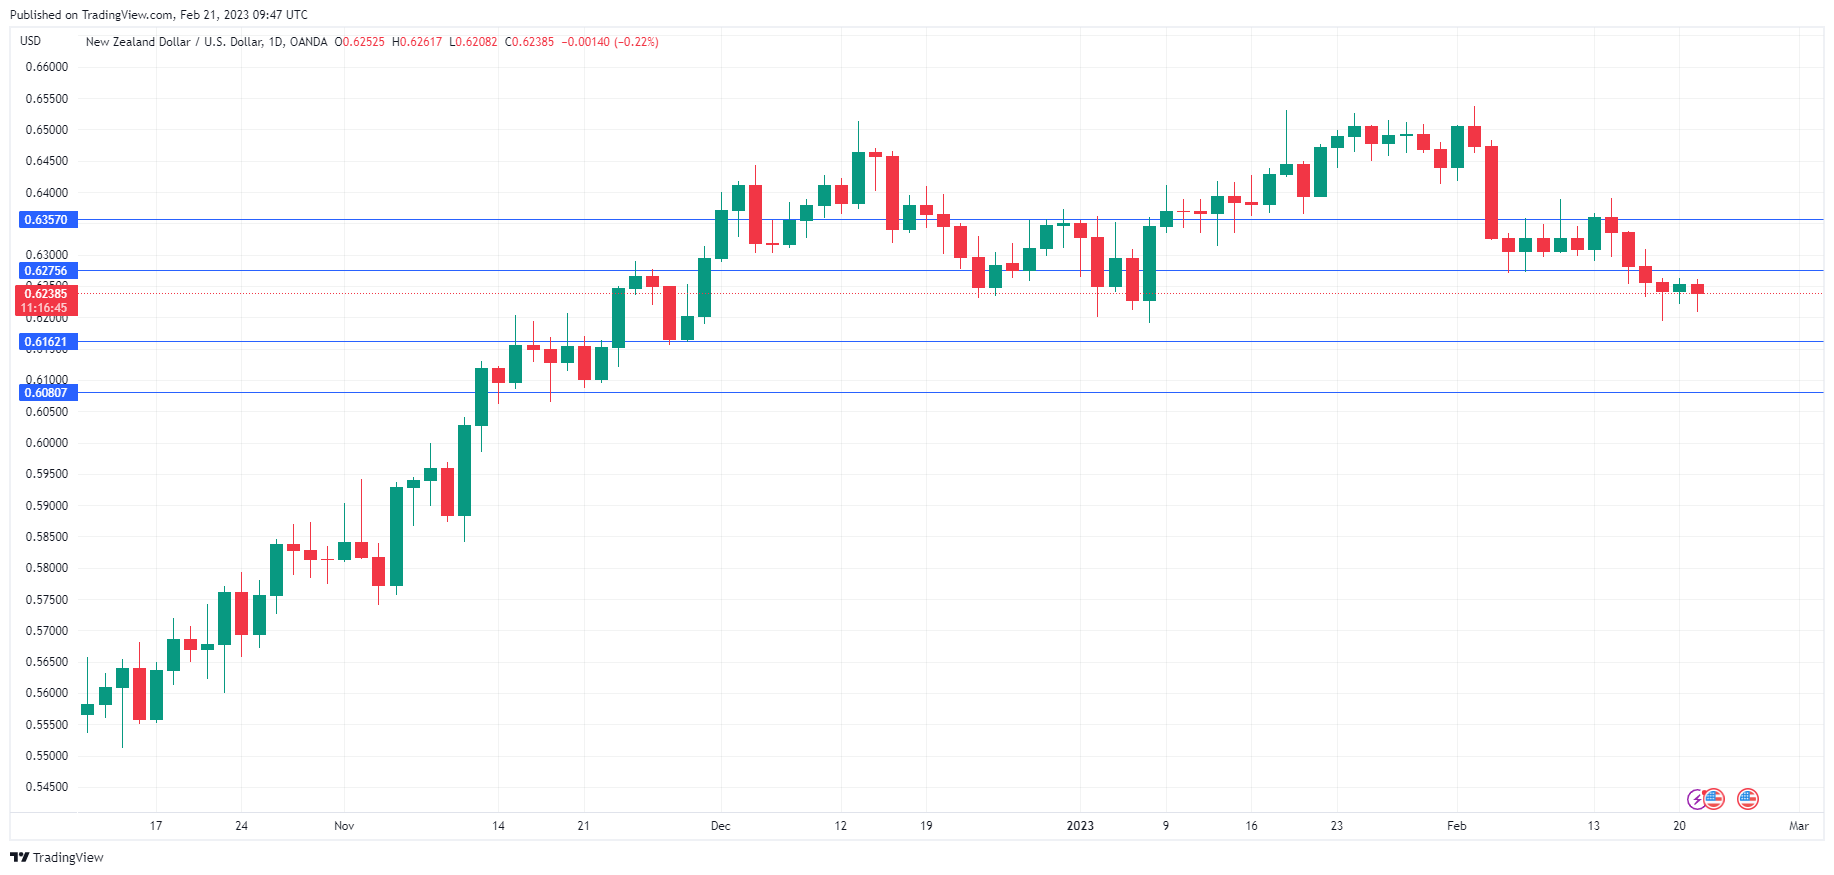
The New Zealand dollar is slightly lower on Tuesday. NZD/USD declined over 0.50% earlier but has pared most of these losses and is trading at 0.6240, down 0.20%.
RBNZ expected to hike by 50 bp
The Reserve Bank of New Zealand will meet on Wednesday, its first policy meeting this year. The Bank last met in November, at which time it hiked rates by a record 75 basis points, bringing the cash rate to 4.25%. There had been expectations of another 75-bp increase at tomorrow’s meeting, but Cyclone Gabrielle has thrown a monkey wrench into the decision. The cyclone, which caused damage in the billions of dollars, has raised concerns about the economy and the RBNZ is widely expected to lower gears and deliver a 50-bp increase. In the short term, the major disruptions from the cyclone are projected to raise inflation, which is already running at 7.2%, its highest level since 1990.
Aside from Gabrielle, there are signs that inflation may have peaked. Inflation Expectations eased in Q1 to 3.3%, down from 3.6% in Q4 2022. Inflation hit 7.2% in the final quarter of 2022, lower than the RBNZ’s forecast of 7.5%. The RBNZ still has its foot on the brake, but if inflation continues to head lower, we can expect the Bank to ease up on the pace of rates in the coming meetings.
In the US, we’ll get a look at the February PMI reports. Recent US numbers have beaten expectations, including employment growth, retail sales, and inflation. This is not a complete picture of the economy, as the services and manufacturing sectors have been in contraction territory for months, with readings below the 50.0 level. This negative trend is expected to continue, with Manufacturing PMI expected at 47.3 and Services PMI at 47.2 points.
NZD/USD Technical
- There is resistance at 0.6275 and 0.6357
- 0.6162 and 0.6080 are providing support
EURJPY May Close at Higher Levels; 144.00 in Focus
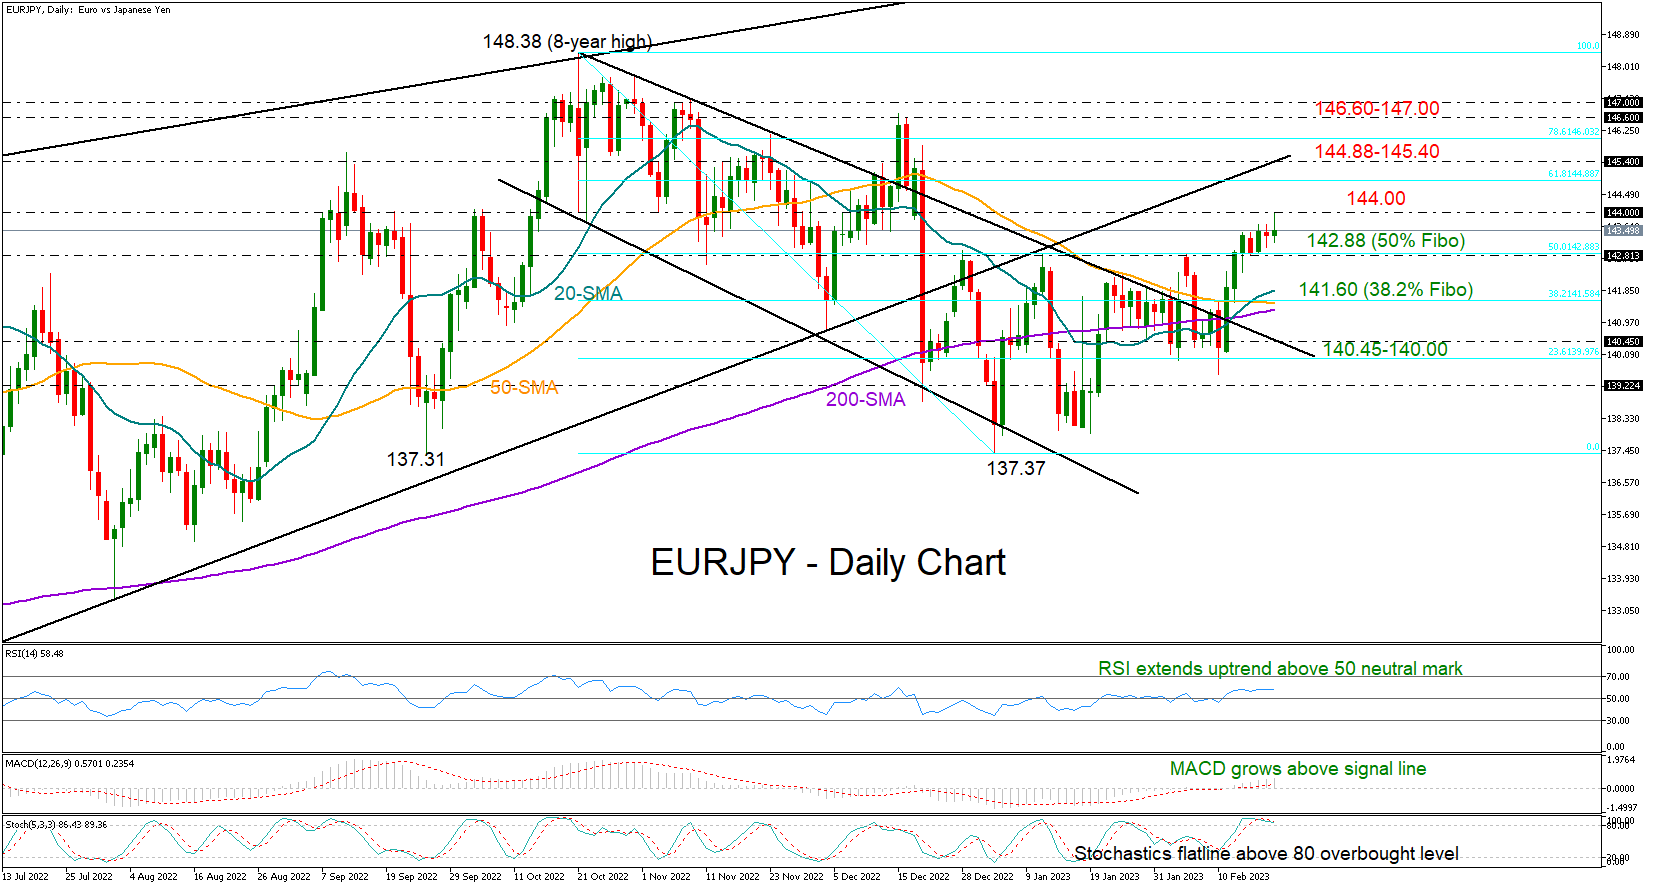
EURJPY gained new traction on Tuesday, breaking its short-term consolidation phase to print a new two-month high of 143.98.
There is more room for improvement according to the technical oscillators as the RSI is expanding above its 50 neutral mark and the MACD continues to strengthen above its red signal line. Meanwhile, the stochastic oscillator has already entered the overbought region above 80 but has yet to show any convincing signs of weakness, keeping the bias on the bullish side as well.
A decisive close above the 144.00 round-level is expected to bolster buying pressures towards the support-turned-resistance trendline from March 2022 seen around 145.40, while slightly lower the 61.8% Fibonacci retracement of the 148.38-137.37 downleg at 144.88 may attempt to pause the rally beforehand. Additional gains from here may then challenge the 146.60-147.00 ceiling ahead of the eight-year high of 148.38 registered last October.
On the downside, the pair seems to have established a floor around 142.88. If sellers press the price beneath that base, which coincides with the 50% Fibonacci level, the spotlight will fall on the 38.2% Fibonacci zone of 141.60. A steeper decline could squeeze the pair below its simple moving averages (SMAs) and towards the surface of the broken bearish channel seen around 140.45. The 23.6% Fibonacci area of 140.00 may be the last opportunity to change direction before a new bearish wave starts again within the channel.
Summing up, the recovery in EURJPY is expected to continue in the short term once the price peaks above 144.00. Alternatively, a step below 142.88 may shift attention back to the downside.
GBP/USD Muted Between SMAs as Rebound Falters
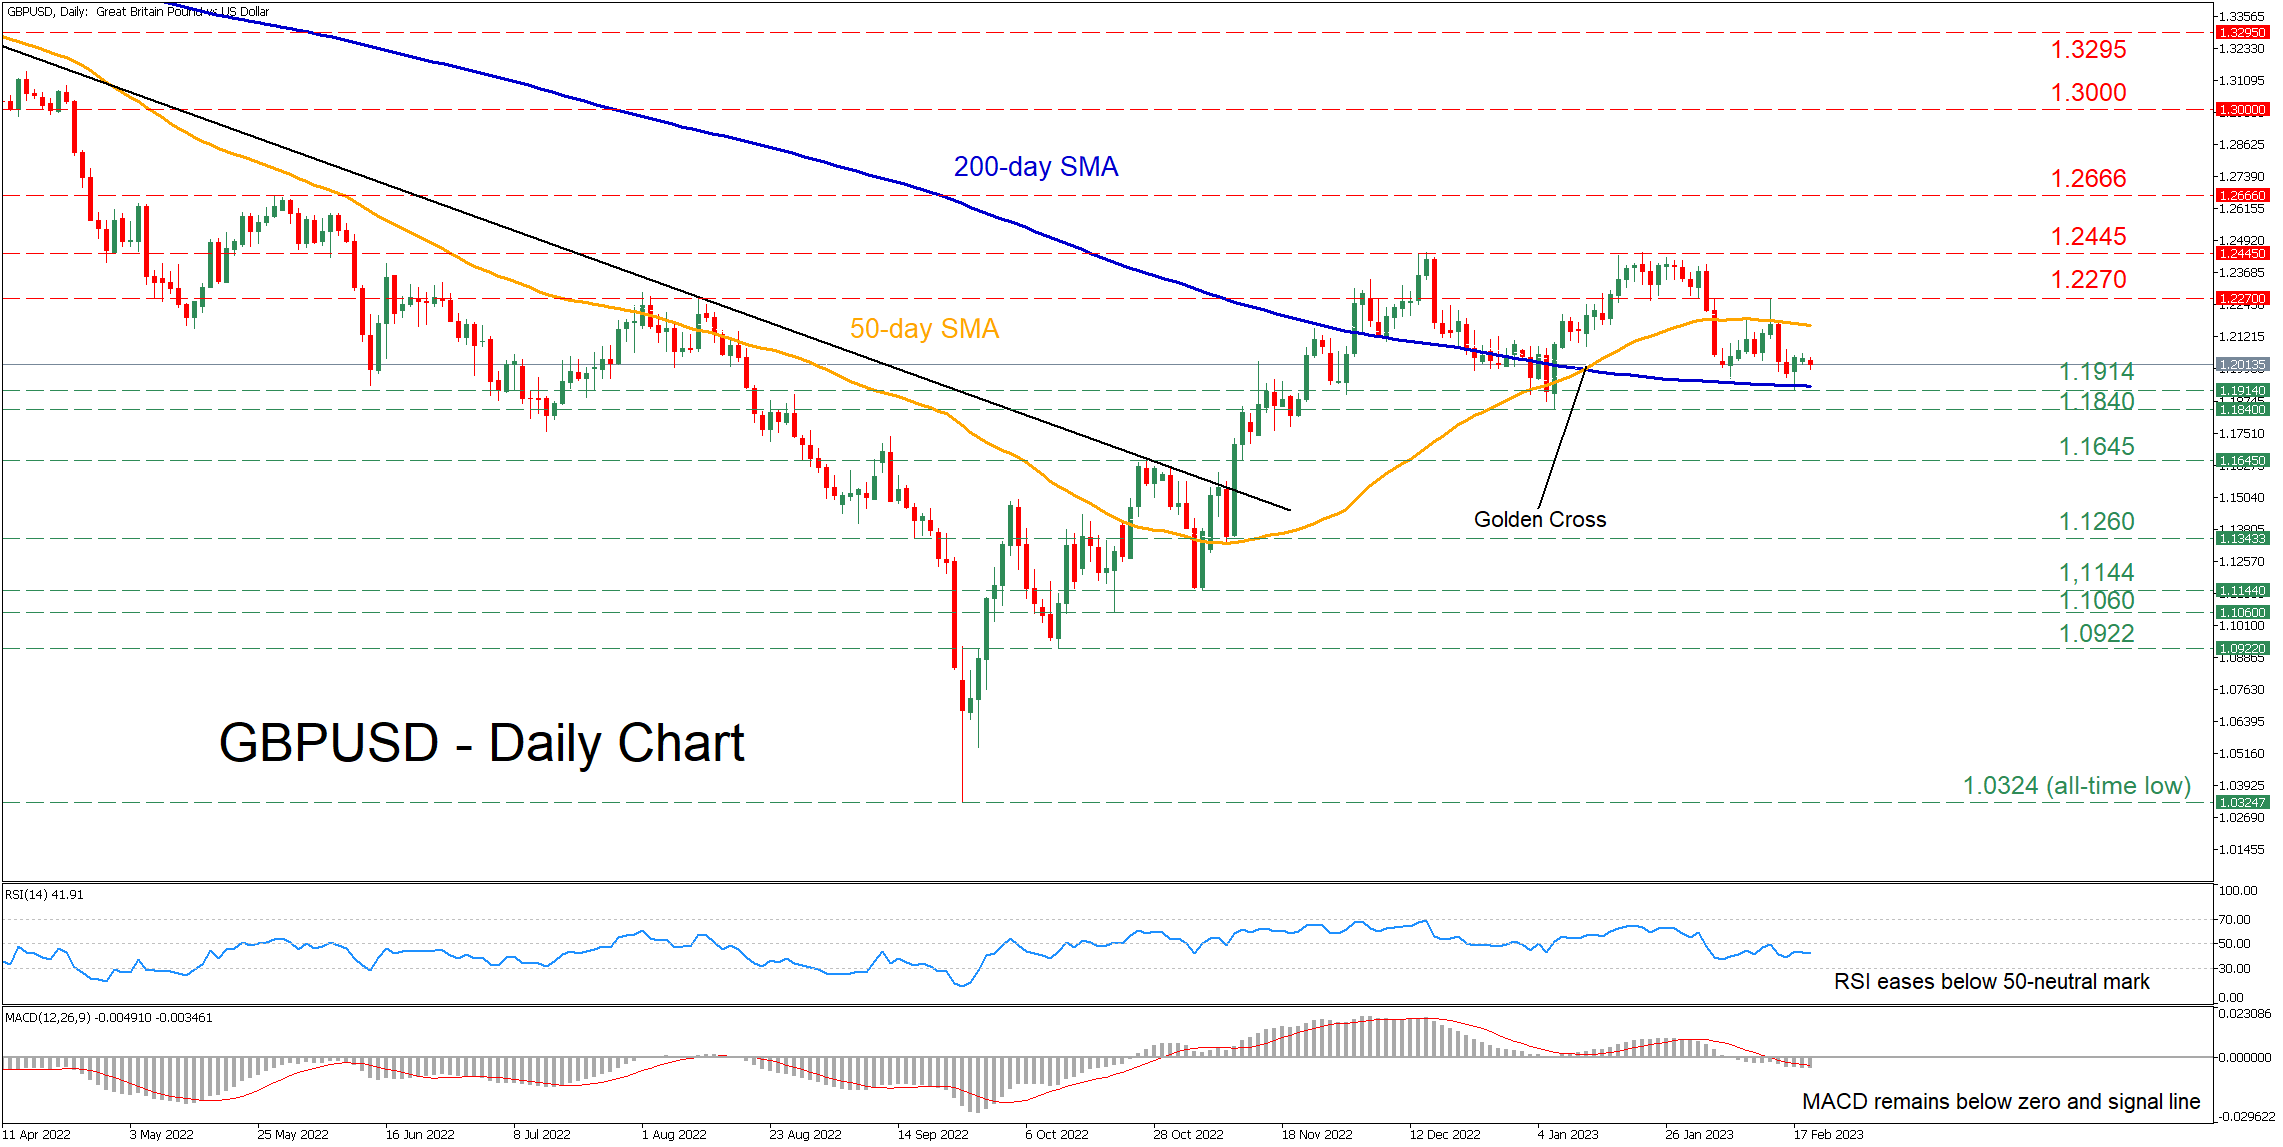
GBPUSD has been attempting a solid recovery since September when the pair fell to an all-time low of 1.0324. However, this latest advance appears to be fading after being rejected twice at the 1.2445 region, while the price has been trading sideways between the 50- and 200-day simple moving averages (SMAs) in the past three weeks.
Despite the latest consolidation, the momentum indicators currently suggest that bearish forces have taken control. Specifically, the RSI is pointing downwards below the 50-neutral mark and the MACD histogram is currently found below both zero and its red signal line.
To the downside, if the pair extends its recent downside correction, the congested region between the 200-day SMA and the recent low of 1.1914 could act as the first line of defence. Should that floor collapse, the January low of 1.1840 might come under examination. Even lower, the pair may face the October resistance of 1.1645, which could act as support in the future.
Alternatively, should buyers re-emerge and push the price above its 50-day SMA, initial resistance may be met at the recent peak of 1.2270. Breaking above that zone, the price could ascend to test the crucial 1.2445 territory, which rejected the pair’s rebound twice. Failing to halt there, further advances could come to a halt at the May high of 1.2666.
In brief, GBPUSD remains stuck in a rangebound pattern as its 50- and 200-day SMAs have repeatedly capped both its upside and downside. Therefore, a break above or below this tight range is likely to be followed by a significant move in the same direction.
Macros Continue to Weigh on Crude Oil
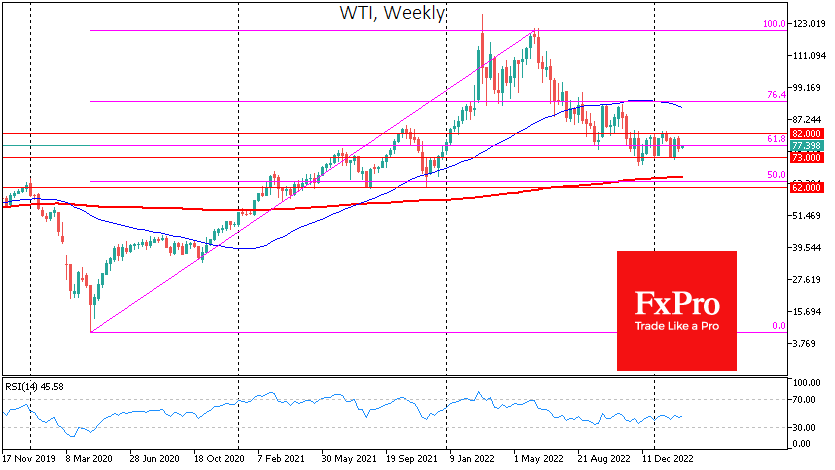
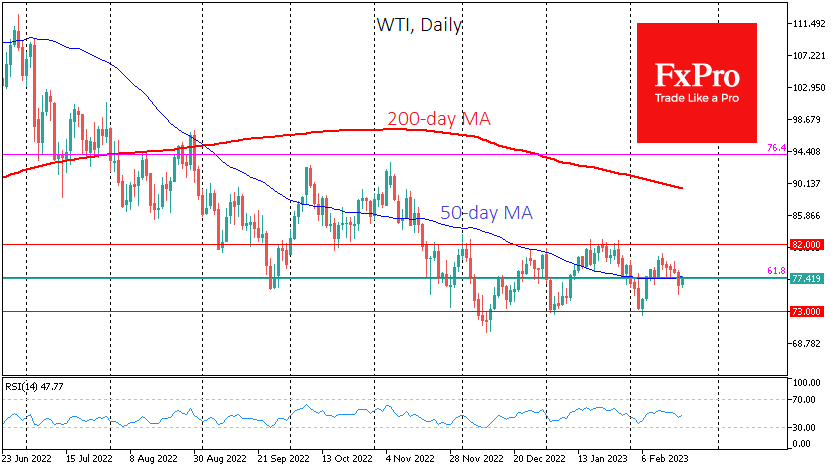
For the third month, oil has barely moved out of its wide range of $73-82 for WTI barrel and $78-88 for Brent. This is not a balance and equilibrium of supply and demand forces but a tug of war.
This does not often happen in large liquid markets, but the range movement has more to do with political actions and statements than the market’s technical picture. The recent reversal from the upper end of the range coincided with the US postponing the start of the renewal of the strategic reserve. A move closer to the lower boundary in early February coincided with comments from Russian officials that production would be cut by 500K barrels per day.
The sideways movement forms a stable reflex for traders, but it is important to understand that this trading mode only lasts for a while. This is a case when macroeconomics can determine the exit direction from the range. And the current data snapshot suggests an exit from this sideways range.
The strong US labour market has not led to a significant increase in oil demand, and commercial inventories have risen from 420M to 471M in recent weeks. This is 14.6% higher than in the same week a year ago. Inventory levels above 500m have coincided with periods of extreme market tightness (March 2016, February 2017 and April 2020) associated with price falls before or after. More recently, the idea that the US government is acting as a strong potential buyer has temporarily supported prices.
It is worth being prepared that the fight against inflation is still ongoing, so it would be wise to expect oil purchases for reserves to start any time soon, as this would send a counterproductive signal. Regardless, it is worth remembering that the recent robust labour market data and inflation surprises increase the chances that the Fed will go further in its rate hikes than previously hoped. The latter is bad news for oil, which is very sensitive to the dollar and interest rate movements.
A hypothetical bearish scenario looks viable if prices fall below $72 in the coming weeks. A consolidation would open the way to $62, where oil bottomed out several times since April 2021.
Conversely, a move above $83 would signal that a correction from the global lows of April 2020 to the highs of June 2022 has occurred and that a new mega-wave of growth awaits oil. This scenario is hard to believe, given that prices have dragged global economic growth over the past year.