Sample Category Title
EUR/USD Trading in the Middle of a Correction
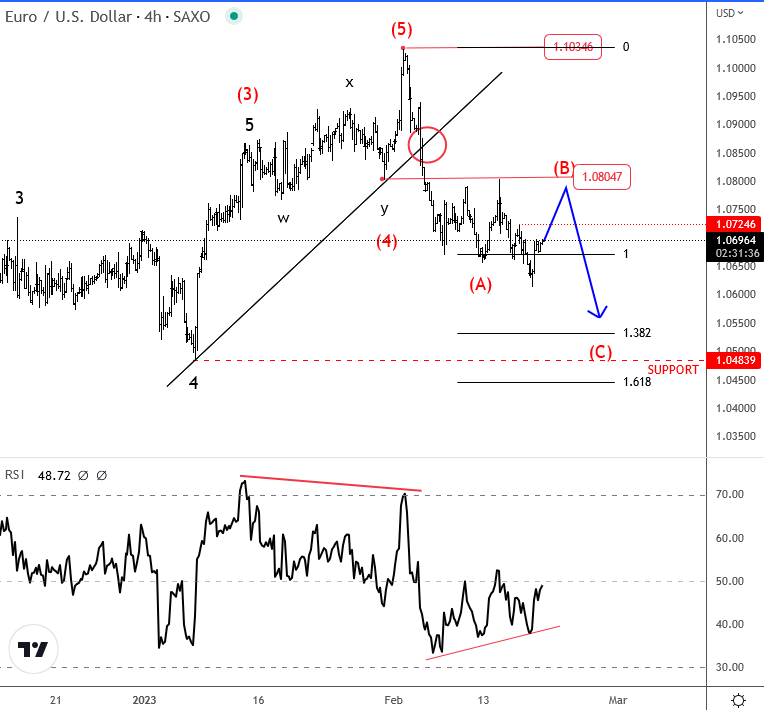
EURUSD reversed sharply to the downside in February, with price falling through the rising trendline support after strong US jobs numbers were reported for January. We saw a perfect reaction down from 1.08 resistance after US CPI came out worse than expected. Pair hit a new low but notice that decline is not progressing at this stage, ahead of holidays in the US. As such, we can see some slow down and choppy price action before downtrend resumes, so ideally that's still wave (B) now in progress. 1.08 remains an important resistance for a turn down into (C) wave.
BoJ Amamiya: Difficult challenge is to determine whether exit conditions are in place
BoJ Deputy Governor Masayoshi Amamiya told the parliament that the central bank has already shifted to a "sustainable monetary easing framework". Thus, it is "appropriate to maintain current policy given underlying price moves."
But he also noted that BoJ has "sufficient operational tools" to achieve a smooth exit from ultra-loose monetary policy.
"The difficult challenge for the BOJ is to determine whether conditions have fallen in place to exit, and how to communicate (its policy intention) to the market," Amamiya added.
Gold’s Decline Takes a Breather; Caution Remains
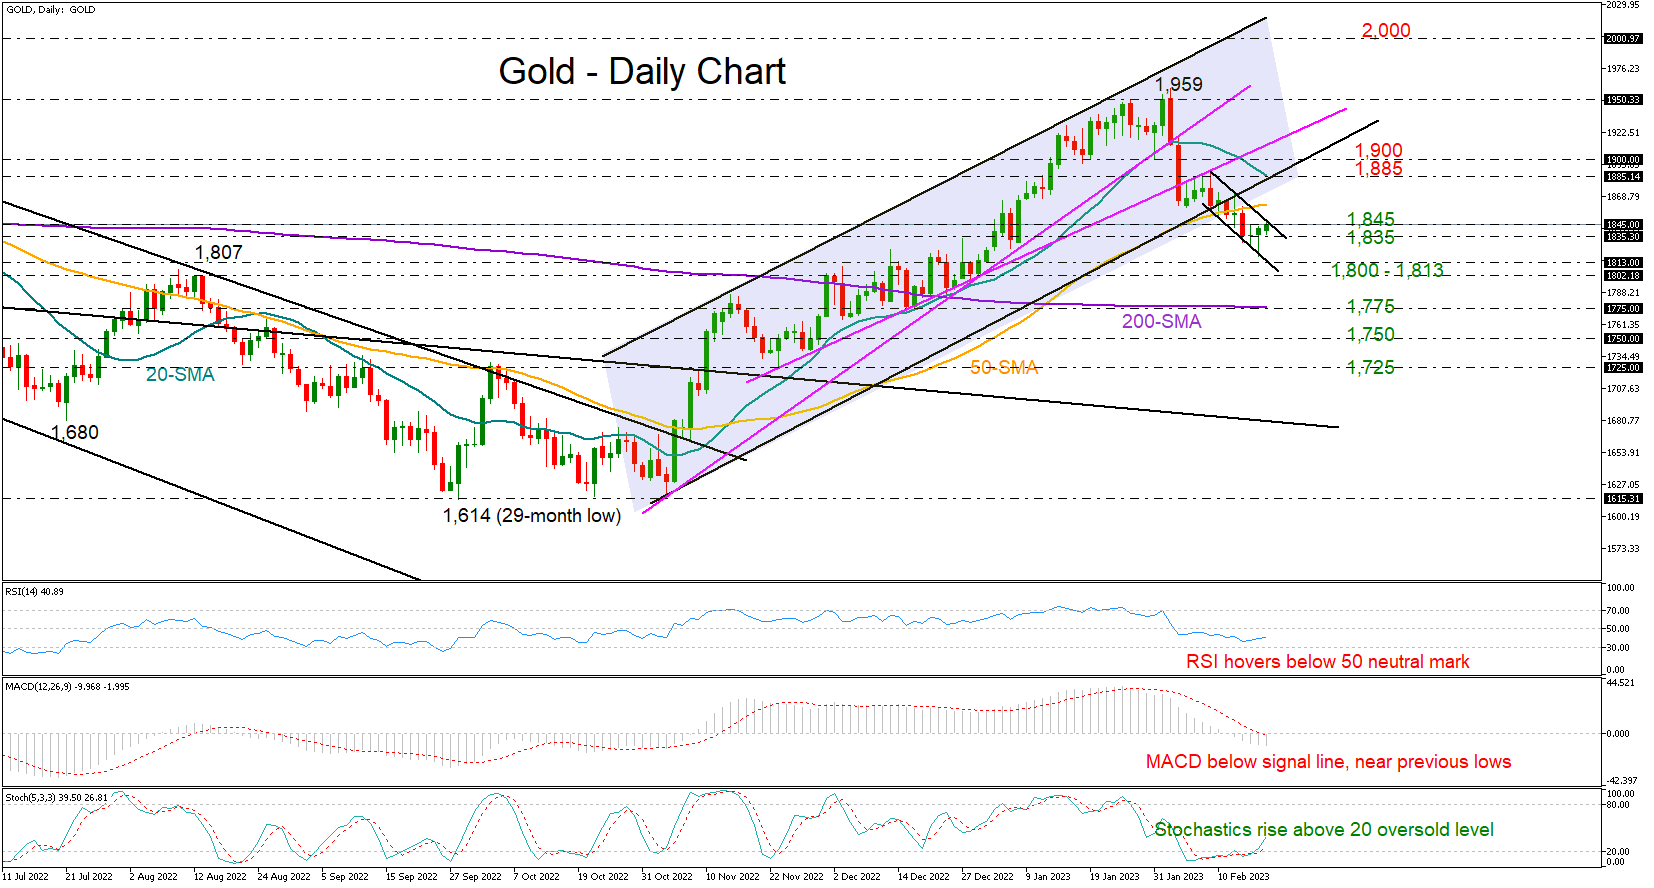
Gold slid to a seven-week low of 1,818 last Friday before closing narrowly back above the 1,835 support for the third consecutive day.
The precious metal was trying to extend its minor gains above the 1,835 base during Monday’s early trading hours. But excluding the upside reversal in the Stochastic oscillator, the RSI and the MACD did not show any meaningful reaction, with the former remaining below its 50 neutral mark and the latter hovering within the negative area and near its previous lows. With the price having exited the bullish channel, retreating below the 50-day simple moving average (SMA) too, sellers will probably keep the upper hand in the short term.
Should the price close below the former 1,835 support area, all eyes will turn to the 1,800 psychological mark as another defeat here would neutralize the broad outlook. A continuation lower could challenge the flattening 200-day SMA at 1,775, a break of which could initially pause around 1,750 before stretching towards the 1,725 low from November 23.
In the event the recovery gains fresh impetus above the upper boundary of the tight bearish short-term channel at 1,845, the door will open for the 50-day SMA at 1,862. A successful move higher could then face strong resistance around the 1,885 region, where the 20-day SMA and the lower band of the broken bullish channel are converging. The 1,900 round level could be the next target.
In a nutshell, gold’s short-term outlook has deteriorated following last week’s channel breakout. The technical signals are not very encouraging at the moment, though a close above 1,845 could allow for some extra recovery.
EURUSD Extends Pullback Below 50-day SMA
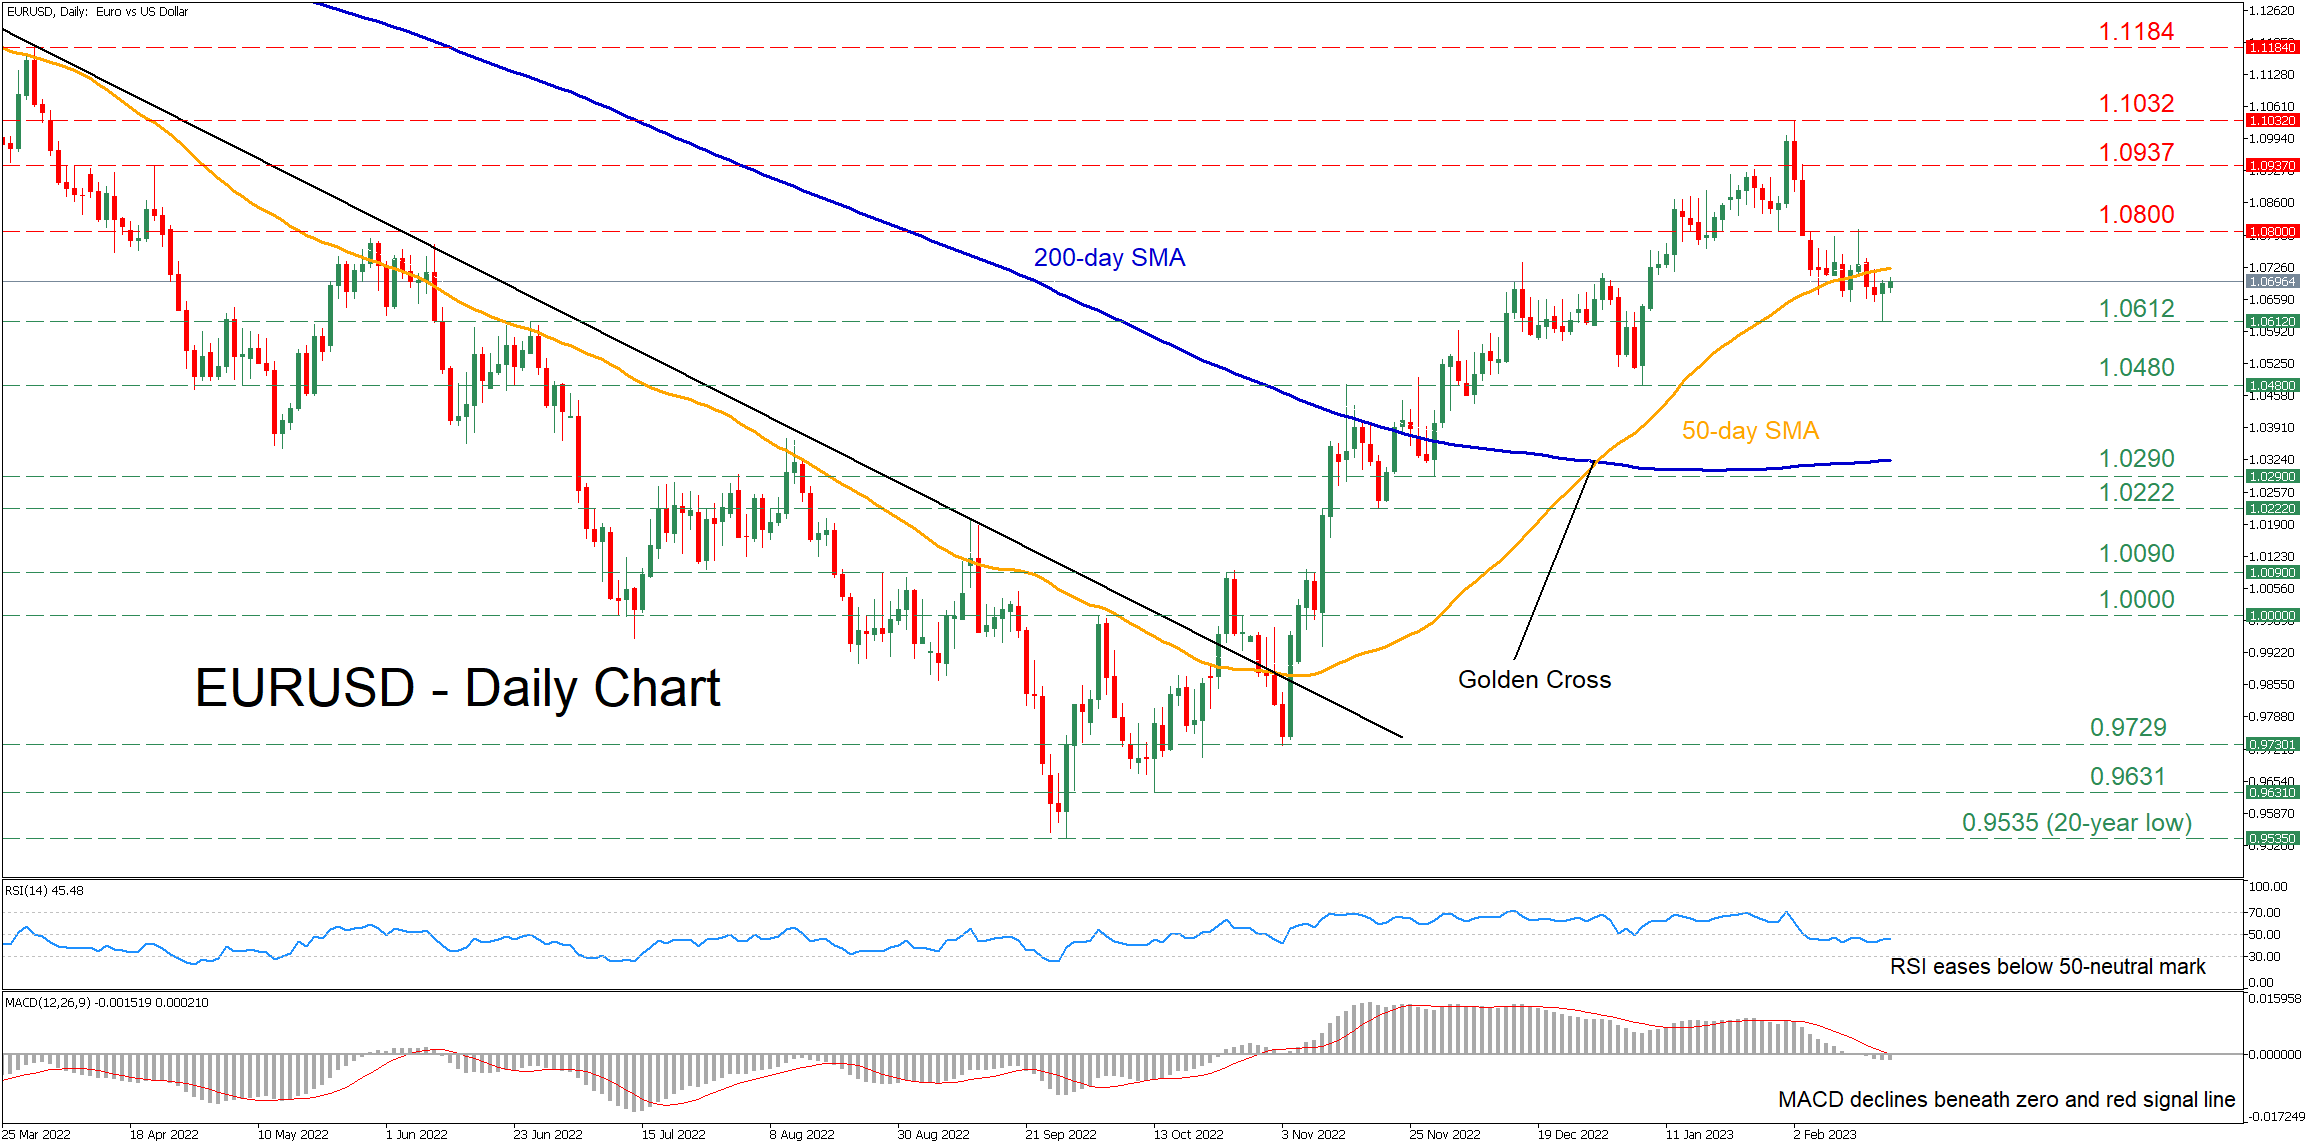
EURUSD has been on a steep uptrend after finding its feet at the 20-year low of 0.9535, storming to a fresh 10-month high in early February. However, the pair experienced a moderate downside correction, with the price diving below its 50-day simple moving average (SMA) in the last couple of daily sessions.
The momentum indicators currently suggest that bearish forces have gained the upper hand. Specifically, the RSI has flatlined beneath its 50-neutral mark, while the MACD histogram is weakening further below both zero and its red signal line.
Should selling pressures persist, the pair could test its recent support region of 1.0612. Sliding beneath that floor, further declines could cease at the January bottom of 1.0480. Even lower, a violation of the November support of 1.0290, which lies very close to the 200-day SMA, might shift the technical picture back to bearish.
On the flipside, if buyers re-emerge and manage to push the price above its 50-day SMA, initial resistance could be met at the 1.0800 hurdle. Conquering this barricade, the bulls could aim for the crucial 1.0937 region, which also provided strong resistance in April 2022. A break above that zone could open the door for the 10-month peak of 1.1032.
In brief, EURUSD has been under some selling pressure lately, dropping beneath its 50-day SMA for the first time since early November. Therefore, the downside move could extend in the case that the pair fails to reclaim this crucial barrier.
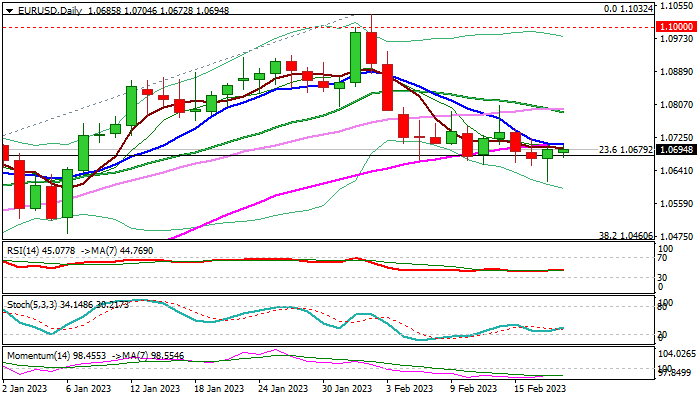
EUR/USD: Key Economic Events this Week Eyed for Fresh Direction Signals
The Euro is trading within a narrow range in early Monday, keeping near-term action in directionless mode for almost two weeks.
Multiple failure at pivotal Fibo support at 1.0679 (23.6% of 0.9535/1.1032) points to strong bids, with Friday’s long-tailed daily candle adding to signals of downside rejection, with the action being underpinned by thick rising daily cloud.
On the other hand, near-term action remains limited by falling 10DMA, with long upper shadows of daily candles, pointing to increased pressure, along with prevailing bearish tone of daily studies (strong negative momentum / MA’s in bearish configuration).
Two strong opposite forces keep the pair in directionless mode and awaiting direction signals.
A number of key economic releases EU and Germany are in focus this week and expected to provide fresh signals and push the Euro out of current range.
Res: 1.0705; 1.0787; 1.0822; 1.0872.
Sup: 1.0679; 1.0612; 1.0519; 1.0483.
Crypto Market Stalls after Pump
Market picture
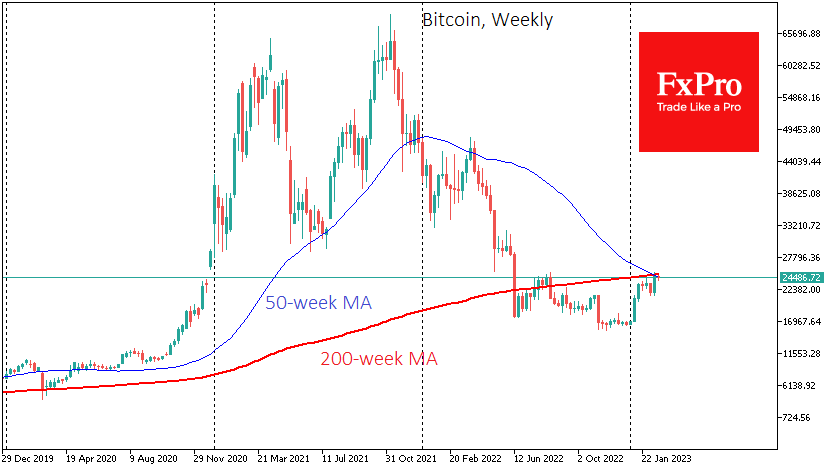
Bitcoin gained 11.5% last week to close at $24.5K. The price stabilised near this level at the start of the new week. The cryptocurrency’s market capitalisation rose 9.3% last week to $1.12 trillion. Almost all of the growth came in the first half of the week, with smaller gains in the final days.
Sunday saw a fresh attempt to push BTCUSD above $25K. However, the bulls failed to form a nice weekly candle to close above a significant level, leaving the rate below the 200-week average and touching the 50-week. Buyers may be more cautious in the coming days as a death cross formed on the weekly timeframes last week, although it should not be taken as a sell signal.
Ethereum grew 9.5% to $1680. Other leading altcoins in the top 10 gained between 1.2% (XRP) and 16.7% (Polygon). The exception was BNB (-2.3%).
News background
US authorities continue their “cryptocurrency crusade”. The US Securities and Exchange Commission (SEC) has charged Terraform Labs (TFL) and its CEO, Do Kwon, with running a multi-billion-dollar securities fraud scheme. The SEC charged TerraUSD (UST) and the LUNA token with algorithmic stablecoin.
US Senate Banking Committee Chairman Sherrod Brown called for a comprehensive regulatory framework for cryptocurrencies to protect investors from losing money. The congressman recalled that the digital asset market lost $1.46 trillion in capitalisation in 2022 and that cryptocurrencies have cut more than 1,600 jobs.
The Wall Street Journal wrote that banks are ending partnerships with crypto firms for fear of reprisals from regulators threatening to separate digital assets from the traditional financial system.
Platypus, a decentralised financial protocol based on the Avalanche blockchain, suffered an attack in which a hacker stole around $8.5 million in crypto assets. However, Chainalysis estimated that during 2022, the total amount of money raised by cryptocurrency fraudsters fell from $10.9 billion to $5.9 billion.
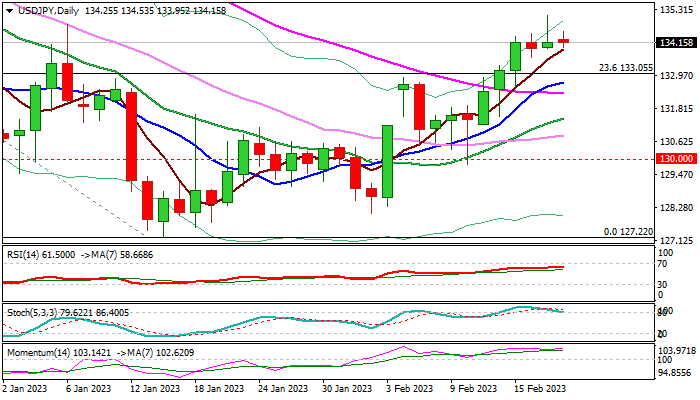
USD/JPY: Recovery Losing Traction But Bias Remains With Bulls Above 10DMA
The USDJPY is holding in sideways mode for the third consecutive day and looking for fresh direction signal.
Recovery from 127.22 (2023 low of Jan 6) peaked at 135.11 on Friday (two-month high), but subsequent easing left a daily candle with long upper shadow, signaling that bulls might be running out of steam.
Daily studies remain in bullish setup, but stochastic is about to emerge from overbought territory and warning extended consolidation or correction.
Pivotal supports at 133.05/132.72 (broken Fibo 23.6% of 151.94/127.22 / 10DMA) are in focus and should contain dips to keep bulls in play for fresh push higher.
Conversely, clear break of these supports would weaken near-term structure and risk deeper pullback towards key supports at 132.08/131.84 (Fibo 38.2% of 127.22/135.11 recovery leg / daily cloud) loss of which would signal reversal.
Res: 135.11; 136.66; 136.94; 137.54.
Sup: 133.60; 133.05; 132.72; 132.08.
Gold Price Started a Recovery Wave from $1,830
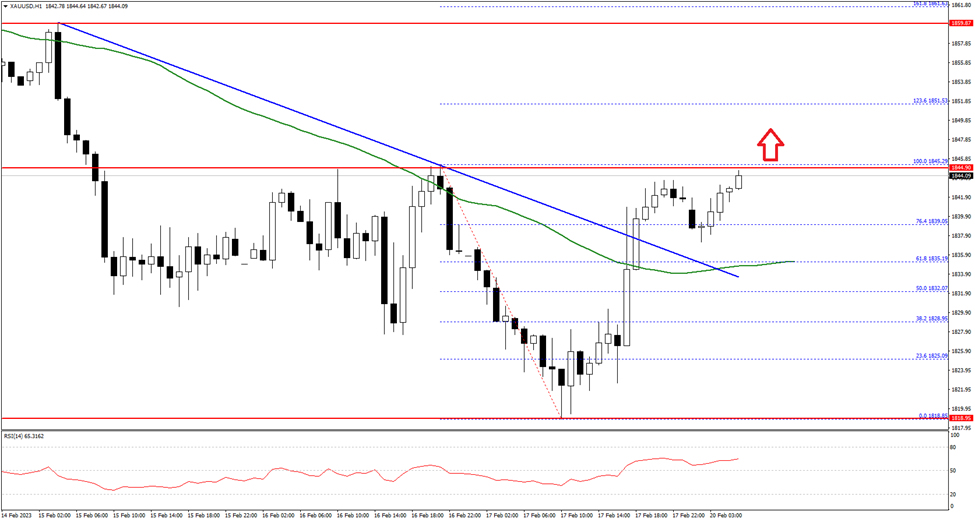
Gold price started a decent increase from the $1,820 zone against the US Dollar. The price moved above the $1,830 resistance zone to start a recovery wave.
The bulls even pushed the pair above the $1,835, a bearish trend line on the hourly chart, and the 50 hourly simple moving average. The price is now showing a few positive signs above the $1,840 level. An immediate resistance on the upside is near the $1,845 level.
The first major resistance is near $1,850 on FXOpen. The next main resistance could be near the $1,860 level, above which the price could start a steady increase towards the $1,880 level.
On the downside, an immediate support is near the $1,835 level. The next major support is near the $1,820 level, below which the price might decline towards the $1,800 support level in the near term.
AUD/USD: High Probability Price Will Fall Again to a Minimum of 0.617
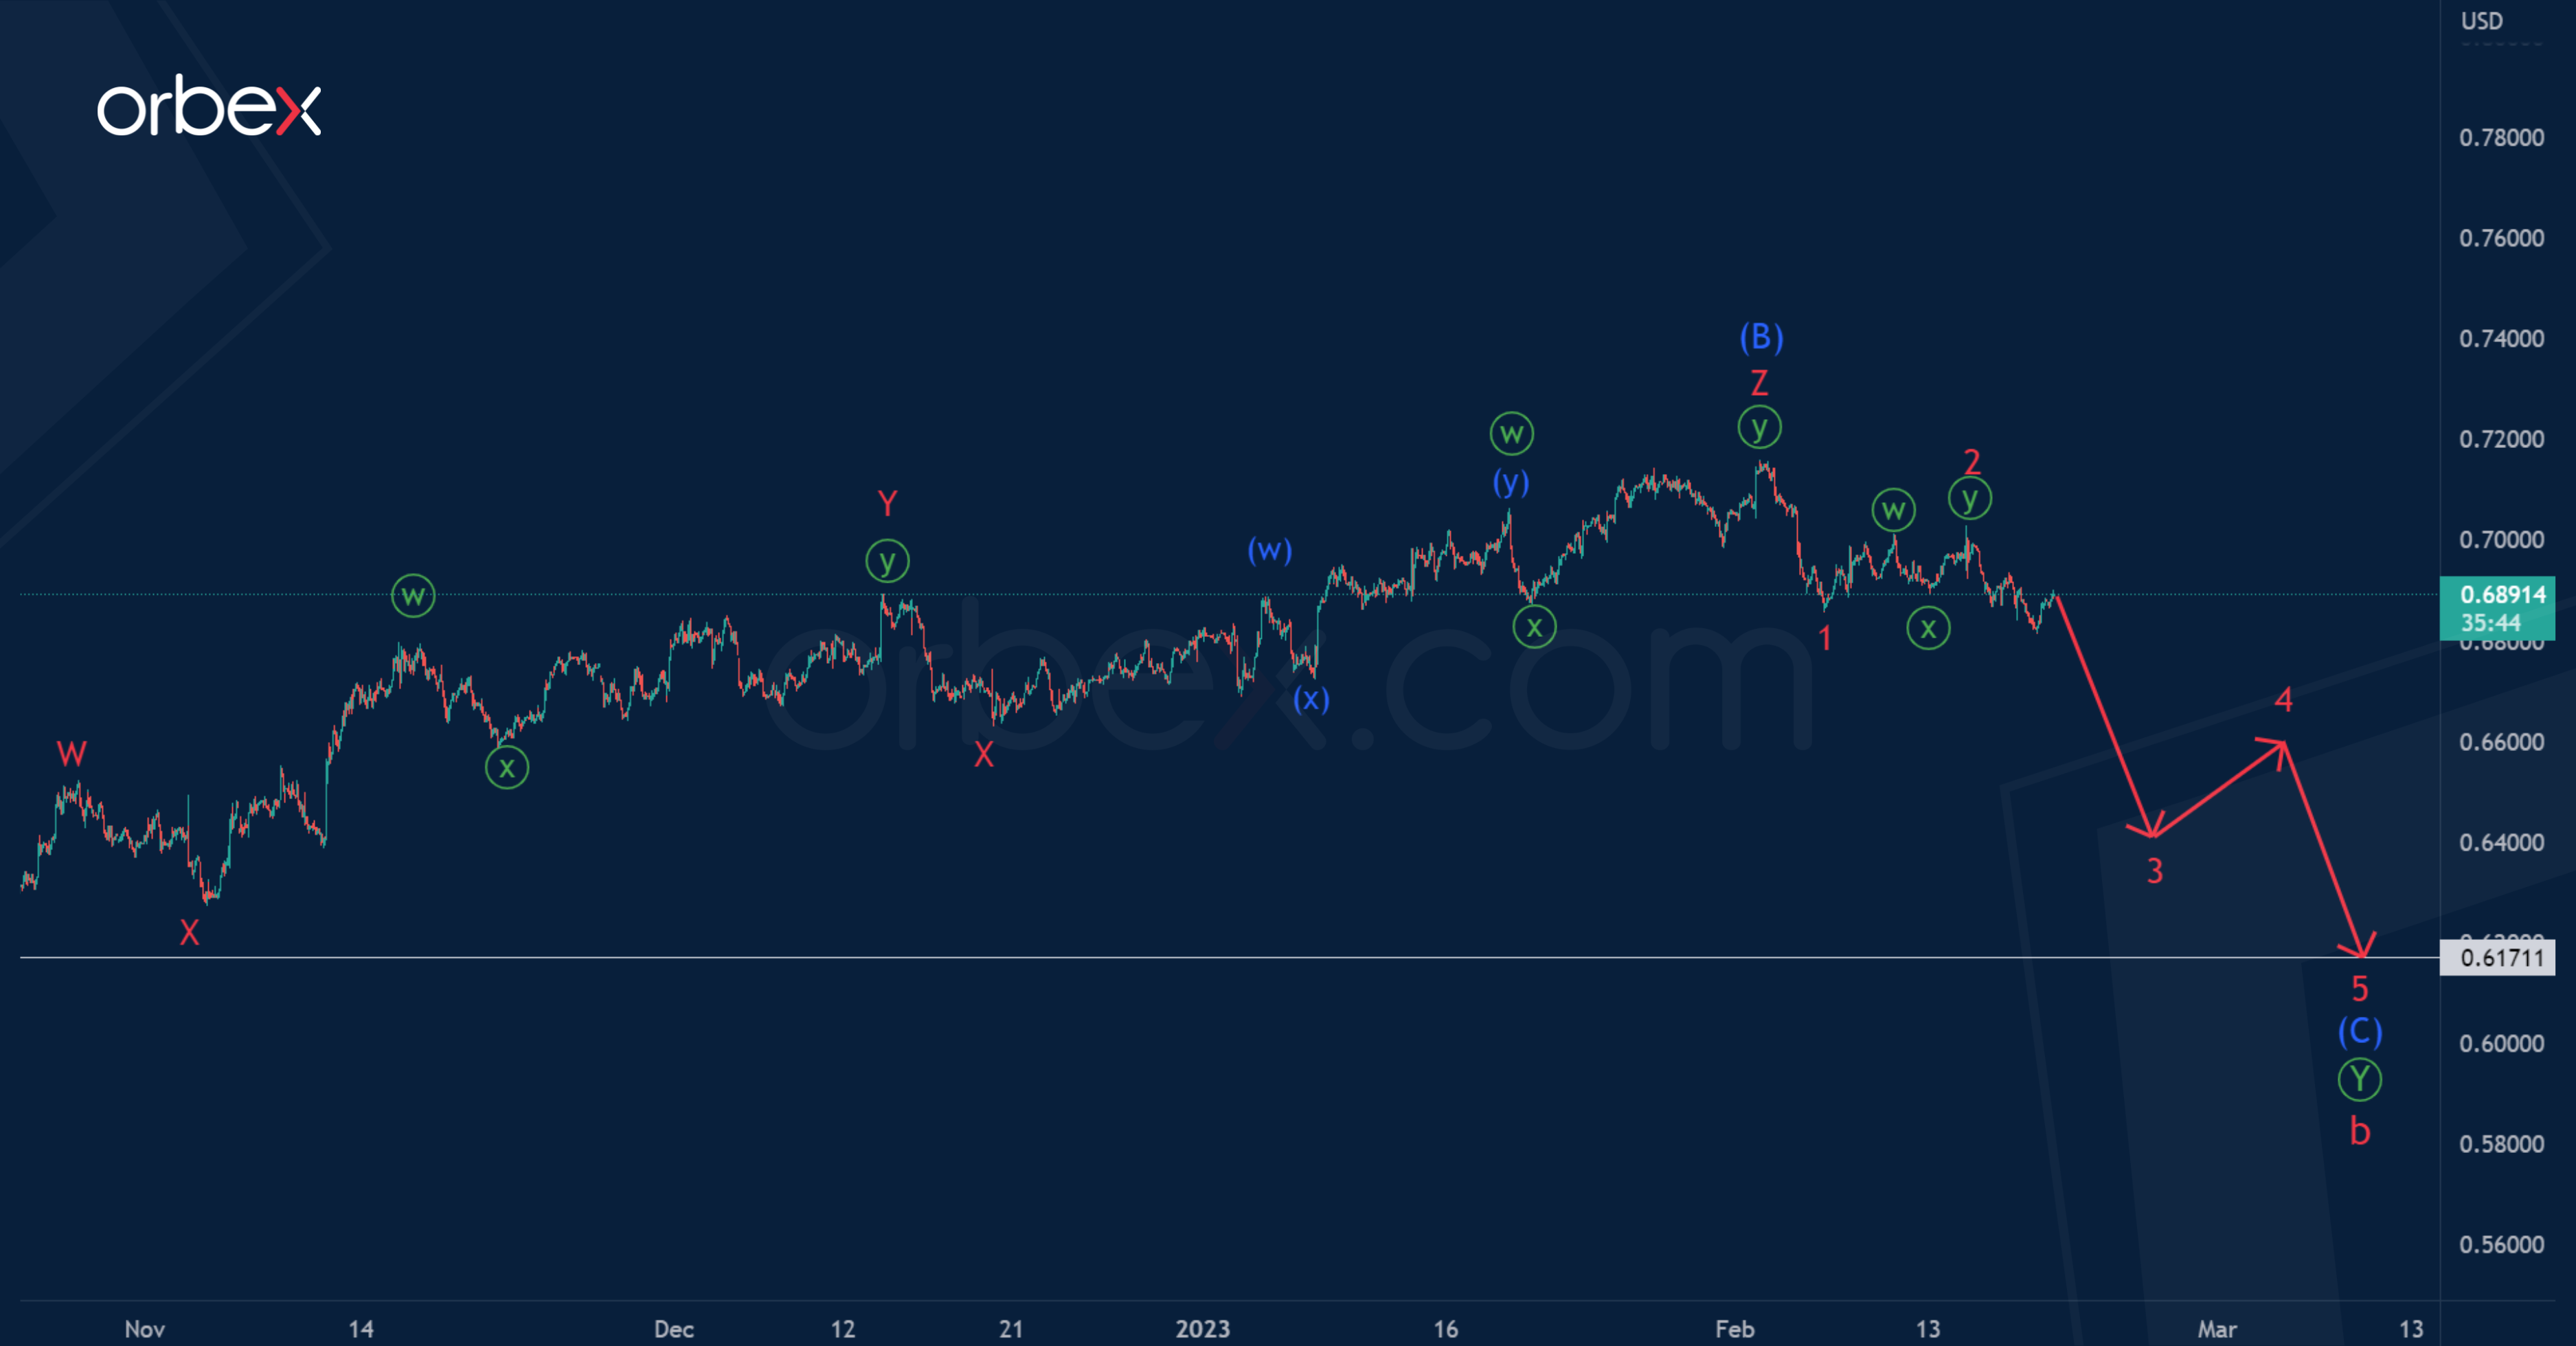
In the long run, AUDUSD seems to be forming a global correction b of the cycle degree, which may soon end in the form of a primary double zigzag Ⓦ-Ⓧ-Ⓨ.
In a zigzag actionary wave, two parts can be completed – an impulse (A) and an intermediate correction (B) in the form of a triple zigzag.
In the last section of the chart, the initial part of the final impulse (C) can develop, the structure of which is schematically shown by trend lines.
There is a high probability that impulse (C), like the previous impulse (A), will end at a minimum of 0.617.
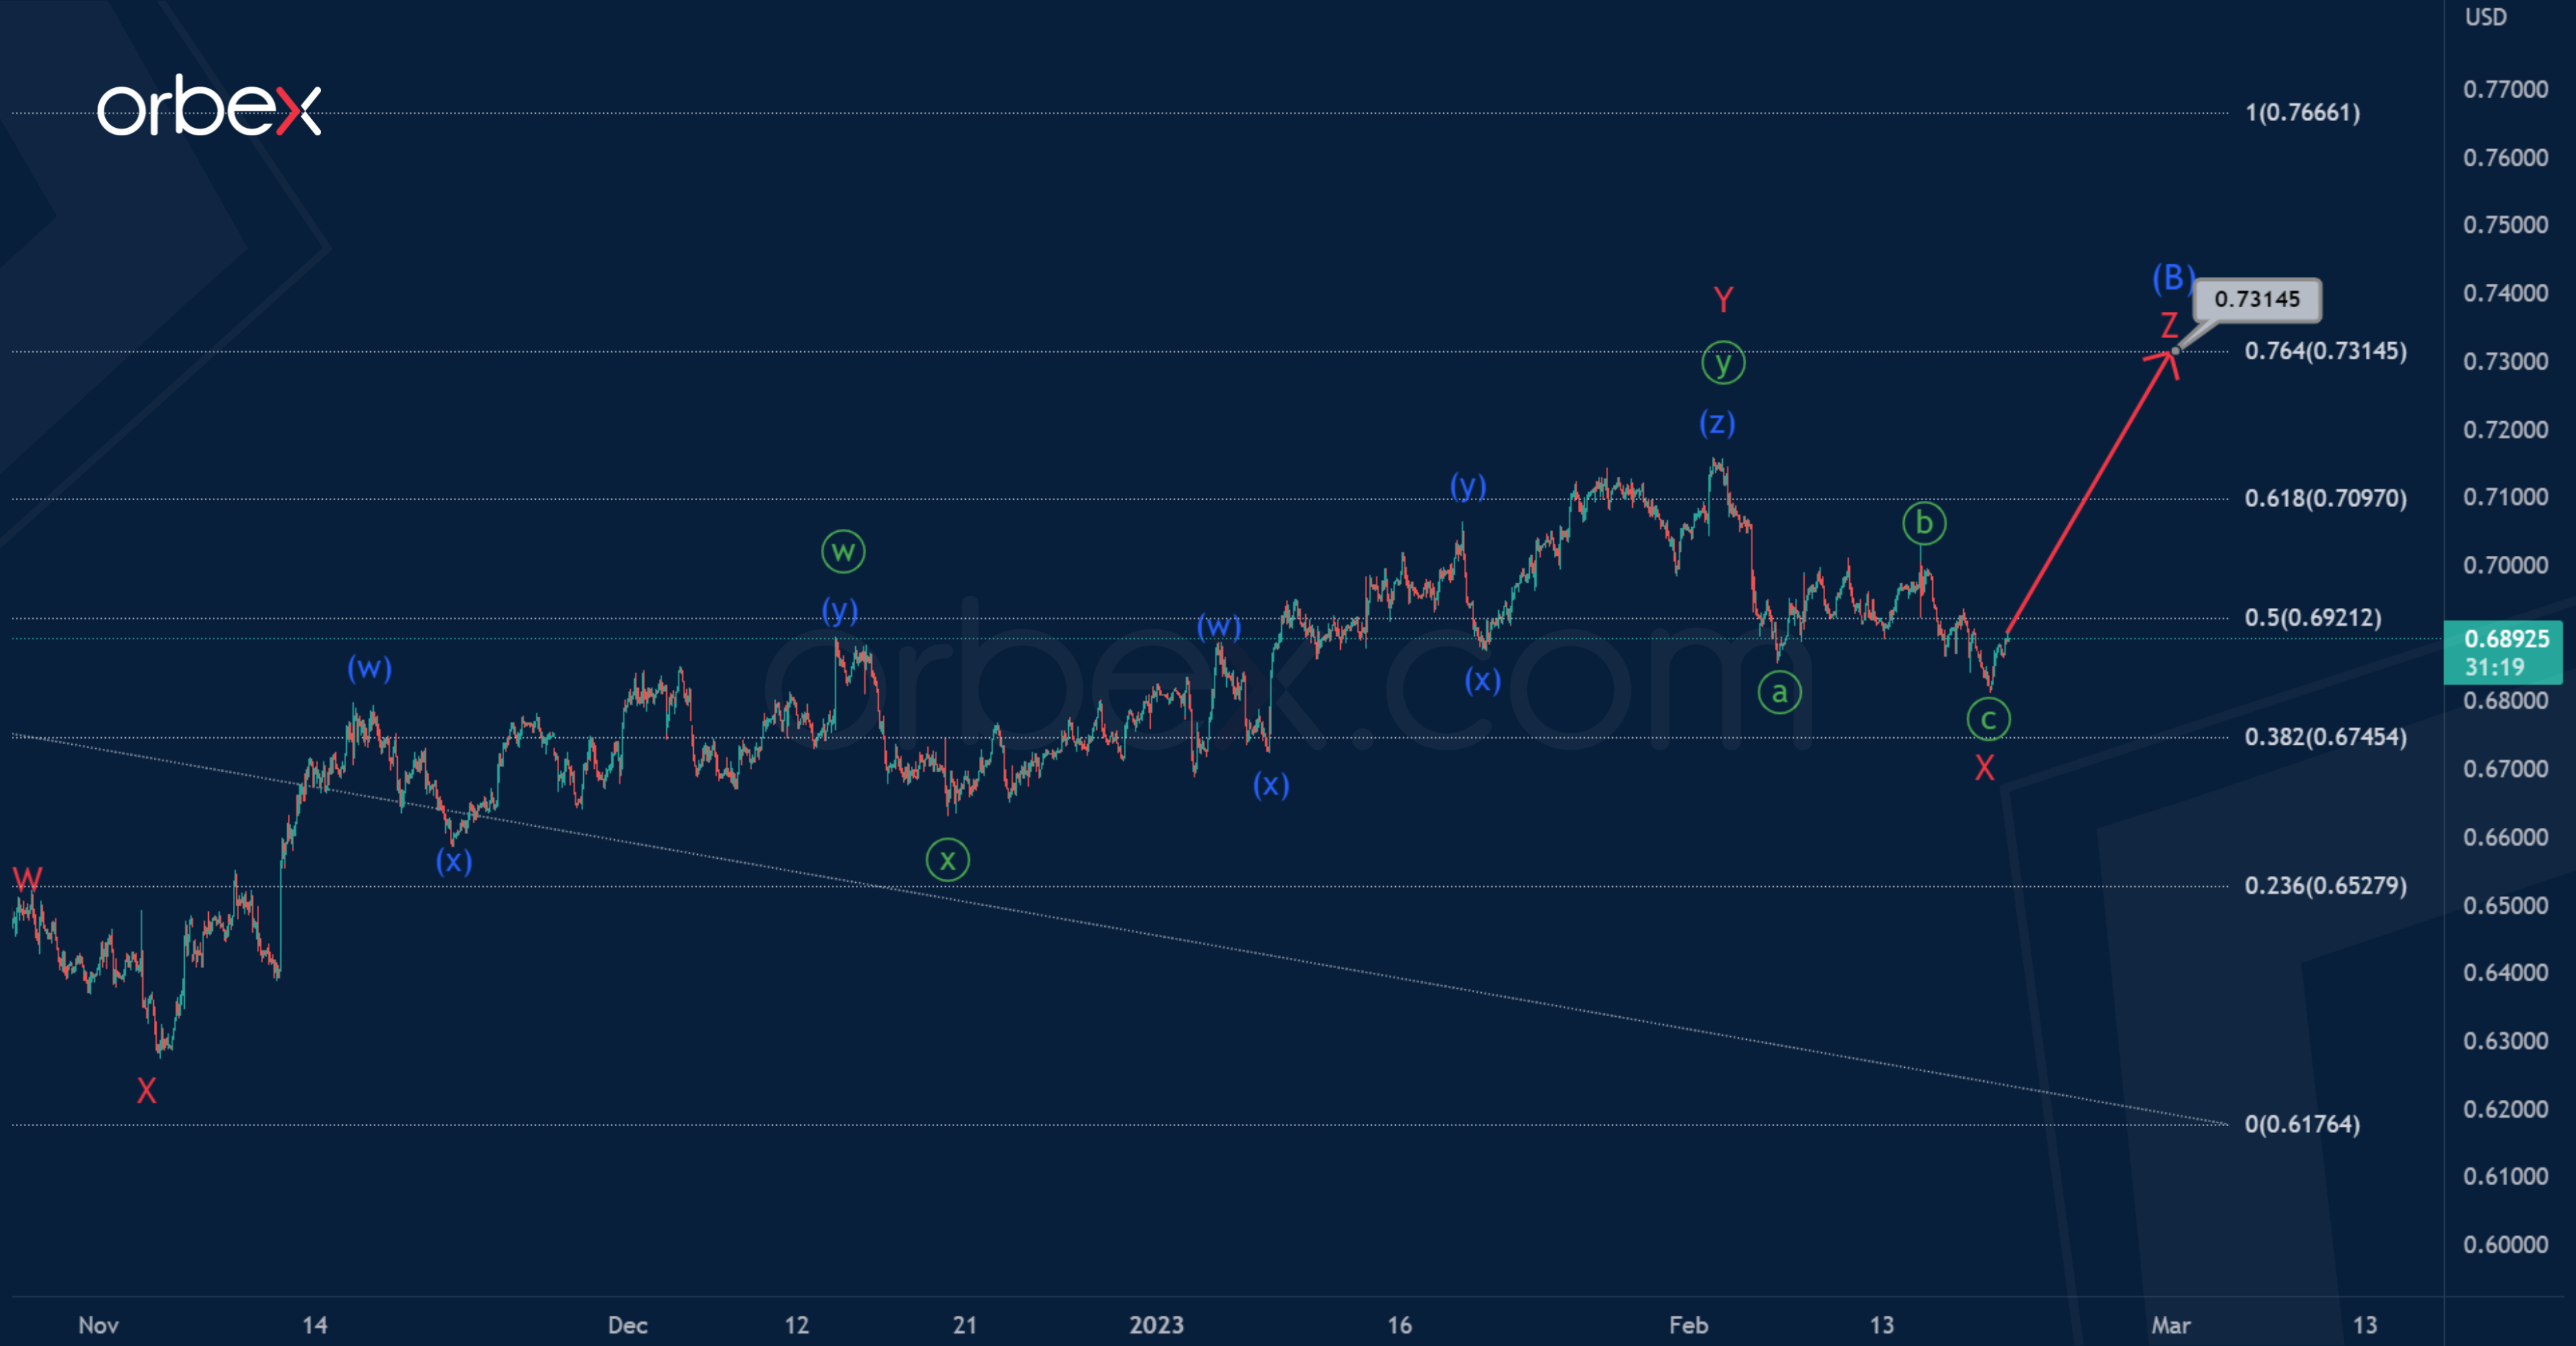
An alternative scenario is indicative of the continuation of price growth in the intermediate correction (B).
Perhaps it will take the form of a triple zigzag W-X-Y-X-Z, as in the first scenario, however, its end is expected a little higher.
Most likely, after the end of the zigzag intervening wave X in the form of a minute zigzag, the price will continue to rise in the final minor wave Z to 0.731.
At that level, correction (B) will be at 76.4% of impulse (A).
Dax 40 Finds Support
The Dax 40 whipsaws on concerns about more interest rate hikes. The price action previously failed to clear the high of 15650, forming a double top as it pulls below 15380. A bounce off 15300 right above the swing low of 15250 on the 30-day SMA, suggests a strong enough follow-through to keep the short-term bullish momentum intact. A close back above 15650 would nip the selling in the bud and resume the uptrend while a bearish breakout would cause a correction to the previous consolidation range above 15000.