Sample Category Title
AUD/USD Daily Report
Daily Pivots: (S1) 0.6833; (P) 0.6858; (R1) 0.6905; More...
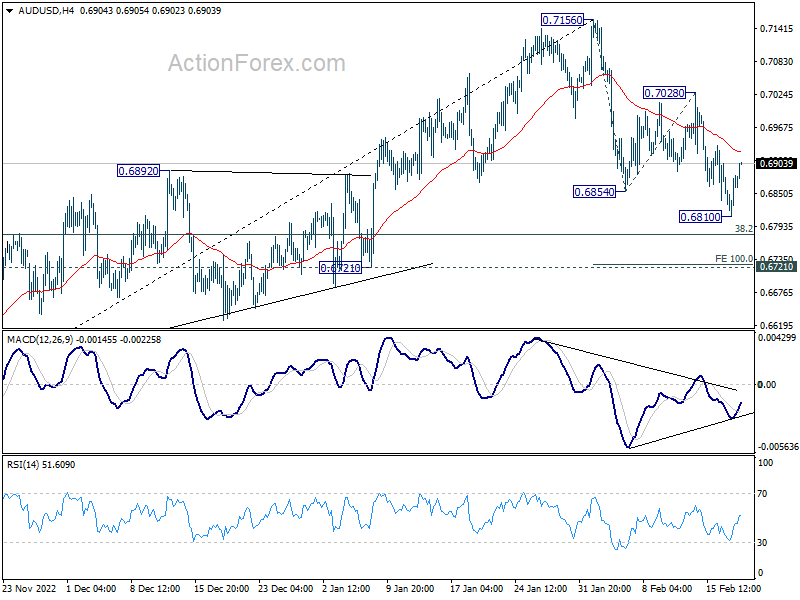
Intraday bias in AUD is turned neutral as recovery from 1.6810 extends. Risk will stay mildly on the downside as long as 0.7028 resistance holds. Below 0.6180 will resume the corrective fall from 0.7156, and target 100% projection of 0.6854 to 0.7028 from 0.6854 at 0.6736, which is close to 0.6721 key structural support. Strong support is expected there to bring rebound.
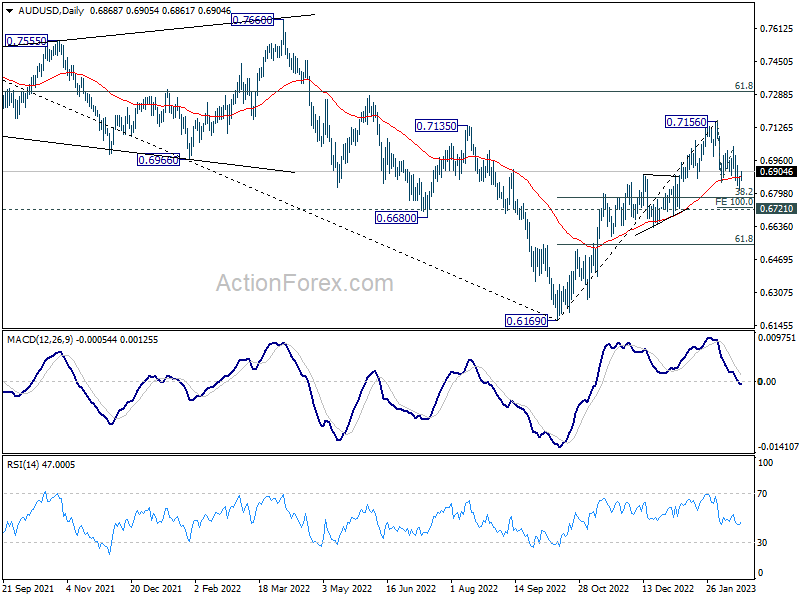
In the bigger picture, corrective decline from 0.8006 (2021 high) should have completed with three waves down to 0.6169 (2022 low). Further rally should be seen to 61.8% retracement of 0.8006 to 0.6169 at 0.7304. Sustained break there will pave the way to retest 0.8006. This will now remain the favored case as long as 0.6721 support holds.
USD/CAD Daily Outlook
Daily Pivots: (S1) 1..3437; (P) 1.3487; (R1) 1.3525; More....
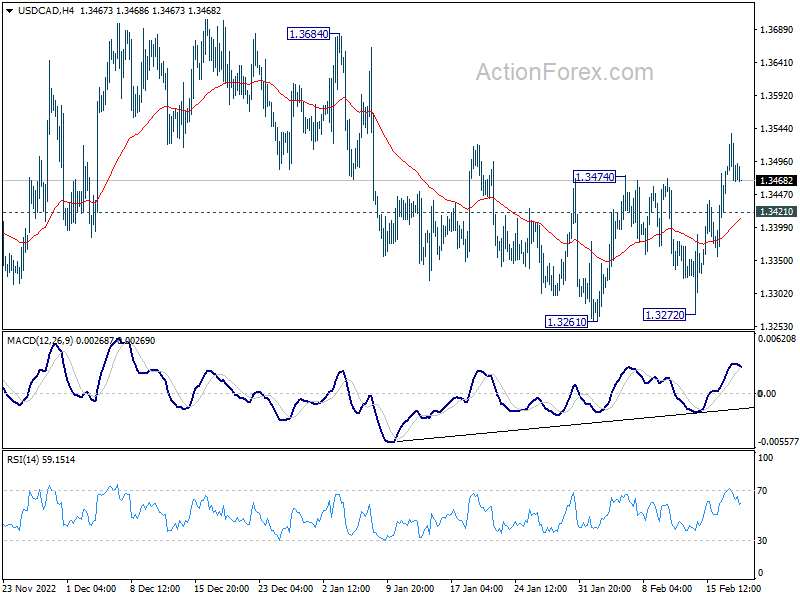
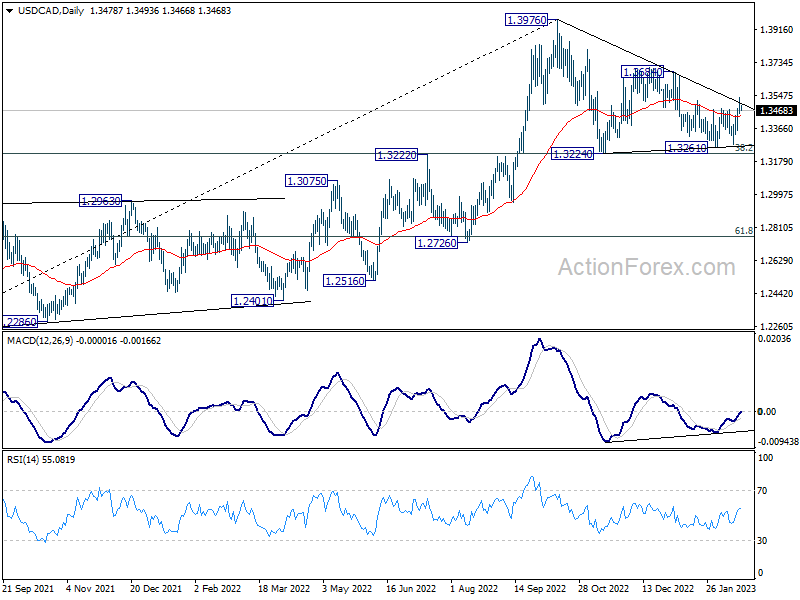
Intraday bias in USD/CAD remains on the upside for the moment. Corrective pattern from 1.3976 should have completed at 1.3261. Further rise should be seen to 1.3684 resistance. Firm break there will bring retest 1.3976 high. Nevertheless, break of 1.3421 minor support will dampen this bullish case and turn intraday bias neutral again.
In the bigger picture, as long as 1.3222 cluster support (38.2% retracement of 1.2005 to 1.3976 at 1.3223) holds, larger up trend from 1.2005 (2021 low) is still expected to resume through 1.3976 high at a later stage. However, firm break of 1.3222/3 will indicate that the trend might have reversed. Deeper fall would be seen to next cluster support at 1.2726 (61.8% retracement at 1.2758).
GBP/JPY Daily Outlook
Daily Pivots: (S1) 160.81; (P) 161.23; (R1) 161.96; More...
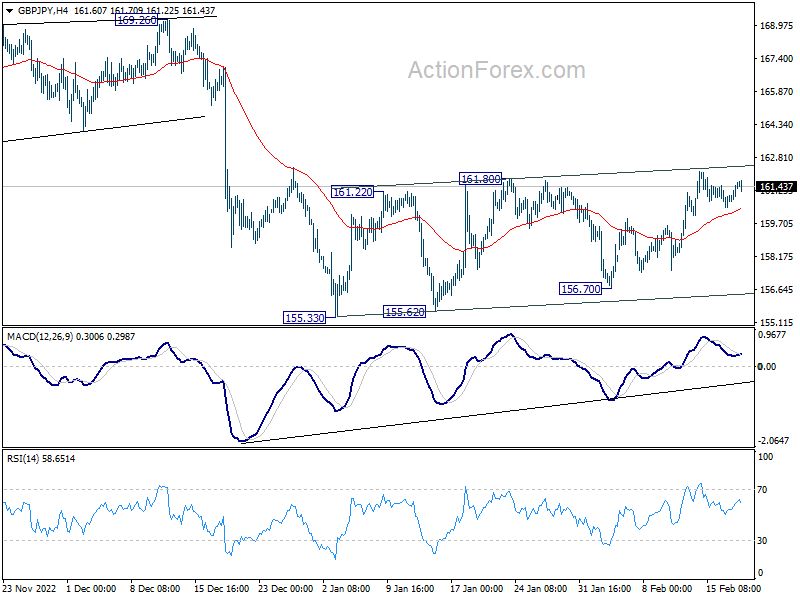
Intraday bias in GBP/JPY remains neutral at this point. On the upside, decisive break of 161.80 will argue that whole correction from 172.11 has completed at 55.33. Further rally should be seen back to 169.26/172.11 resistance zone. On the downside, break of 155.33 low will resume the fall from 172.11 to 153.70 fibonacci level next.
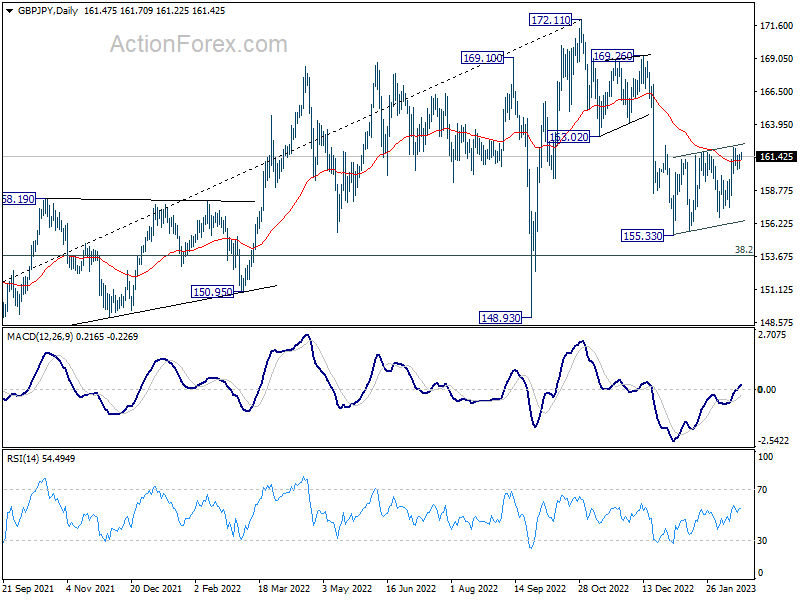
In the bigger picture, as long as 163.02 support turned resistance holds, decline from 172.11 medium term top is expected to continue to 38.2% retracement of 123.94 to 172.11 at 153.70. Sustained break there will raise the change of trend reversal and target 61.8% retracement at 142.34. Nevertheless, break of 163.02 support turned resistance will argue that the decline has completed, and retain medium term bullishness.
EUR/JPY Daily Outlook
Daily Pivots: (S1) 143.04; (P) 143.36; (R1) 143.79; More....
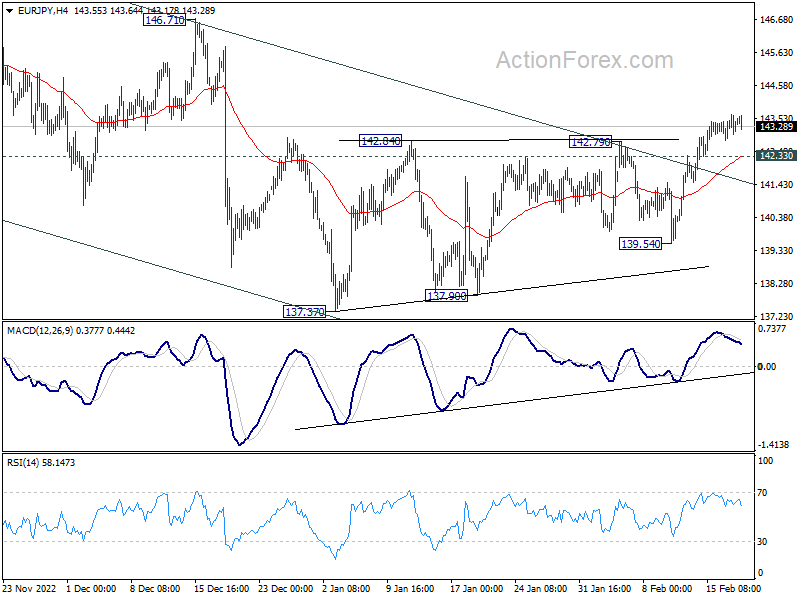
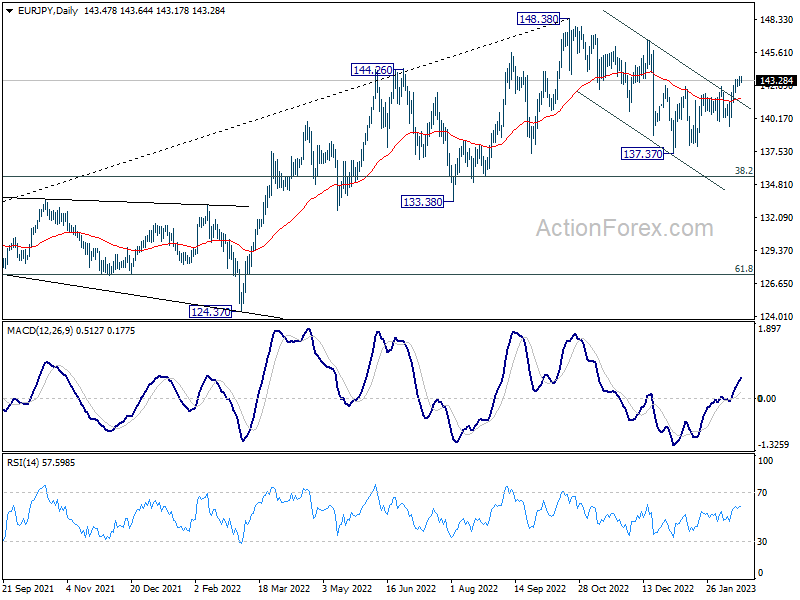
Intraday bias in EUR/JPY stays on the upside despite some loss of momentum. Corrective fall from 148.38 should have completed at 137.37. Further rally should be seen to 146.71 resistance. On the downside, though, below 142.33 minor support will dampen this bullish view, and turn intraday bias neutral again.
In the bigger picture, as long as 55 week EMA (now at 139.03) holds, larger up trend from 114.42 (2020 low) is still in progress for 149.76 long term resistance. However, firm break of 55 week EMA will bring deeper fall to 38.2% retracement of 114.42 to 148.38 at 135.40. Sustained break there will raise the chance of trend reversal, and target 61.8% retracement at 127.39.
EUR/GBP Daily Outlook
Daily Pivots: (S1) 0.8860; (P) 0.8895; (R1) 0.8916; More...
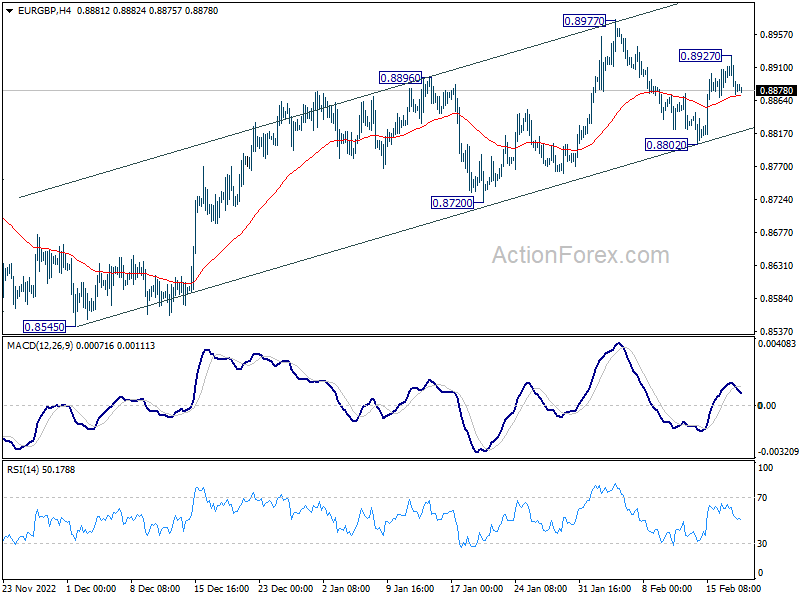
Intraday bias in EUR/GBP remains neutral for the moment. Further rally is expected as long as 0.8802 support holds. Above 0.8927 will target 0.8977 resistance. Firm break there will confirm resumption of whole rally from 0.8545. However, break of 0.8802 will now be a sign of reversal and turn bias back to 0.8720 support instead.
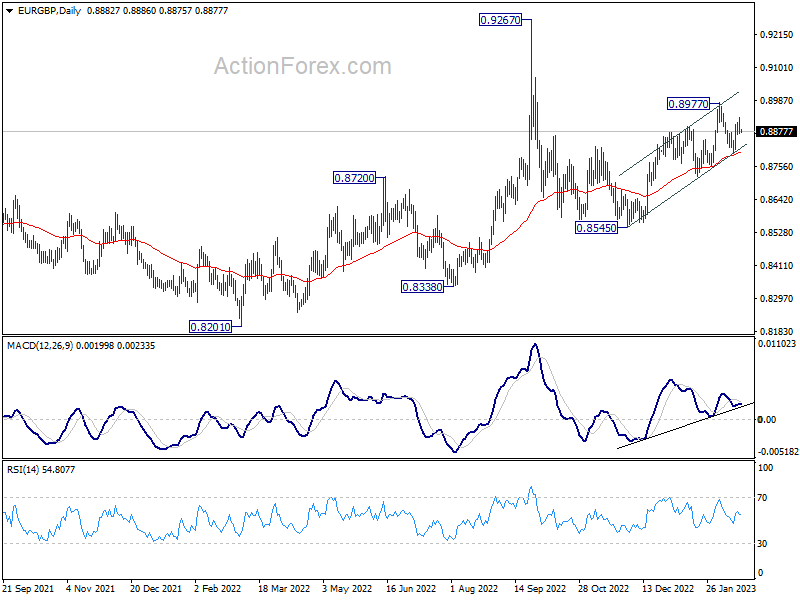
In the bigger picture, the notable support from 55 day EMA (now at 0.8804) retains near term bullishness. Break of 0.8977 should target 0.9267 (2022 high) and possibly above, to resume whole up trend from 0.8201 (2022 low). However, sustained trading below 55 day EMA will set the stage for 0.8545 and below.
EUR/AUD Daily Outlook
Daily Pivots: (S1) 1.5503; (P) 1.5556; (R1) 1.5601; More...
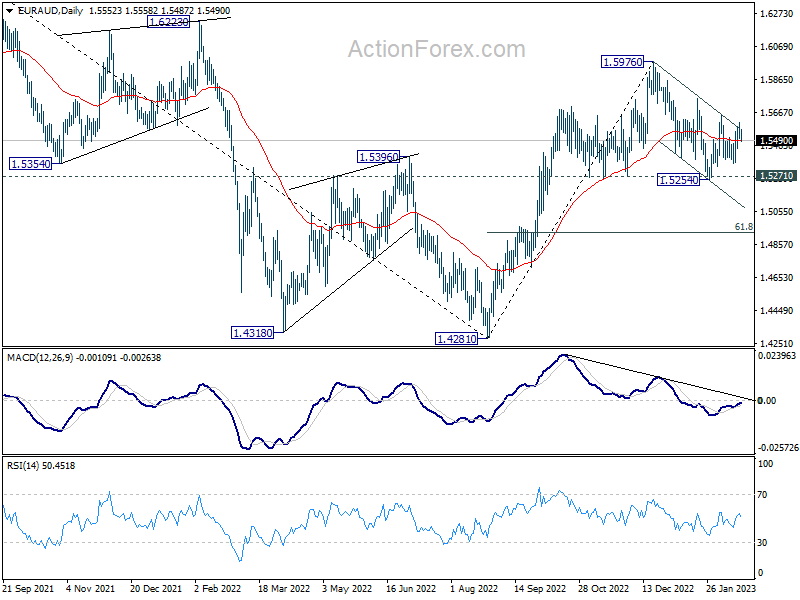
Intraday bias in EUR/AUD stays neutral at this point. On the upside, break of 1.5650 will revive that case that correction from 1.5976 has completed at 1.5254. Intraday bias will be back on the upside for 1.5749 resistance first. On the downside, firm break of 1.5254/71 will carry larger bearish implication and resume the fall from 1.5976.
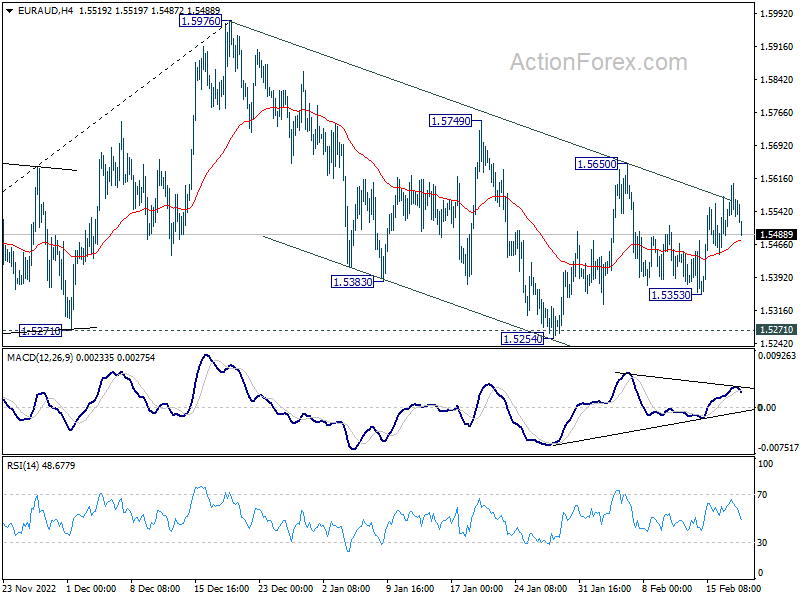
In the bigger picture, it's still early to confirm if rise from 1.4281 represents bullish trend reversal. But as long as 1.5271 support holds, such rally is in favor to continue. Break of 1.5976 will target 1.6434 key resistance next. On the other hand, firm break of 1.5271 will retain medium term bearishness instead.
EUR/CHF Daily Outlook
Daily Pivots: (S1) 0.9866; (P) 0.9895; (R1) 0.9914; More....
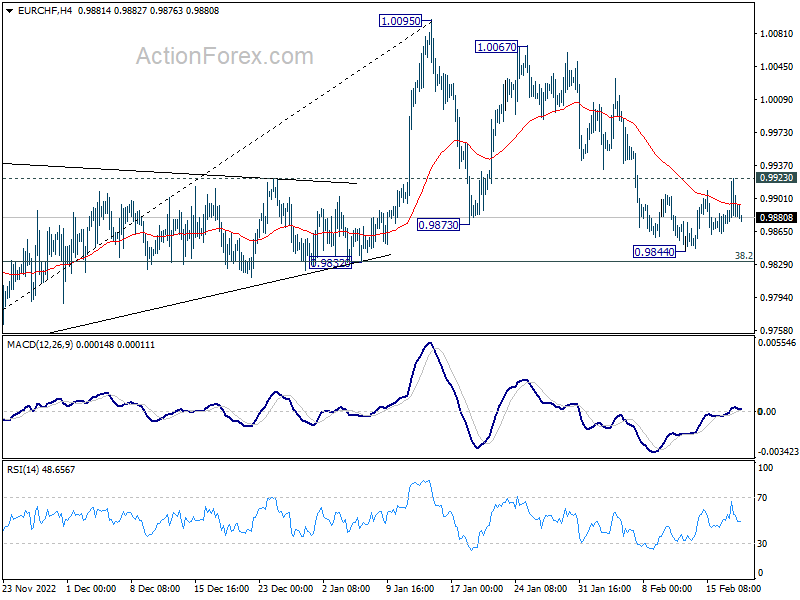
Intraday bias in EUR/CHF remains neutral for the moment. In cas of another fall, downside should be contained by 38.2% retracement of 0.9407 to 1.0095 at 0.9832, to complete the corrective pattern from 1.0095. Break of 0.9923 will turn bias back to the upside for stronger rebound towards 1.0067/0095 resistance zone.
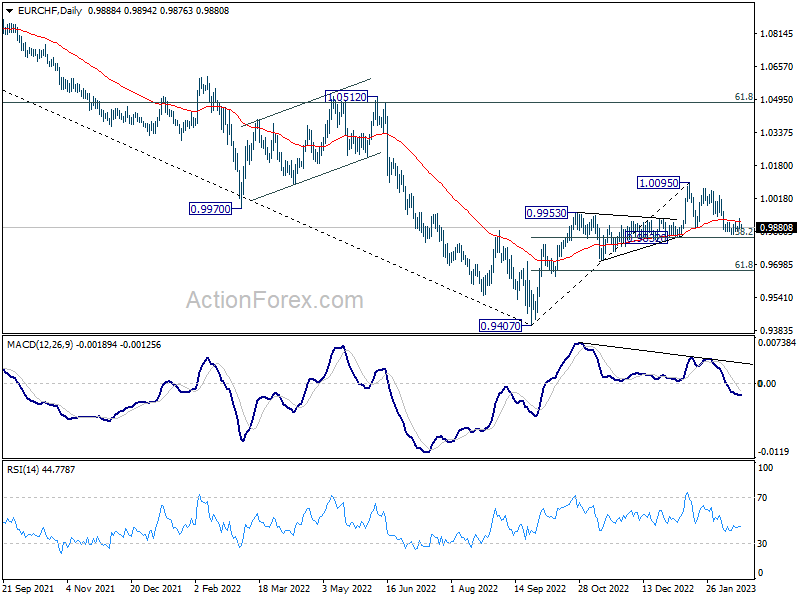
In the bigger picture, the rejection by 55 week EMA (now at 1.0025) mixed up the outlook. On the upside, sustained trading above 55 week EMA will raise the chance of bullish trend reversal. Rise from 0.9407 should then target 1.0505 cluster resistance (2020 low at 1.0505, 61.8% retracement of 1.1149 to 0.9407 at 1.1484). However, firm break of 0.9832 support will revive medium term bearishness and bring retest of 0.9407 low instead.
Technical Outlook and Review
USD/JPY:
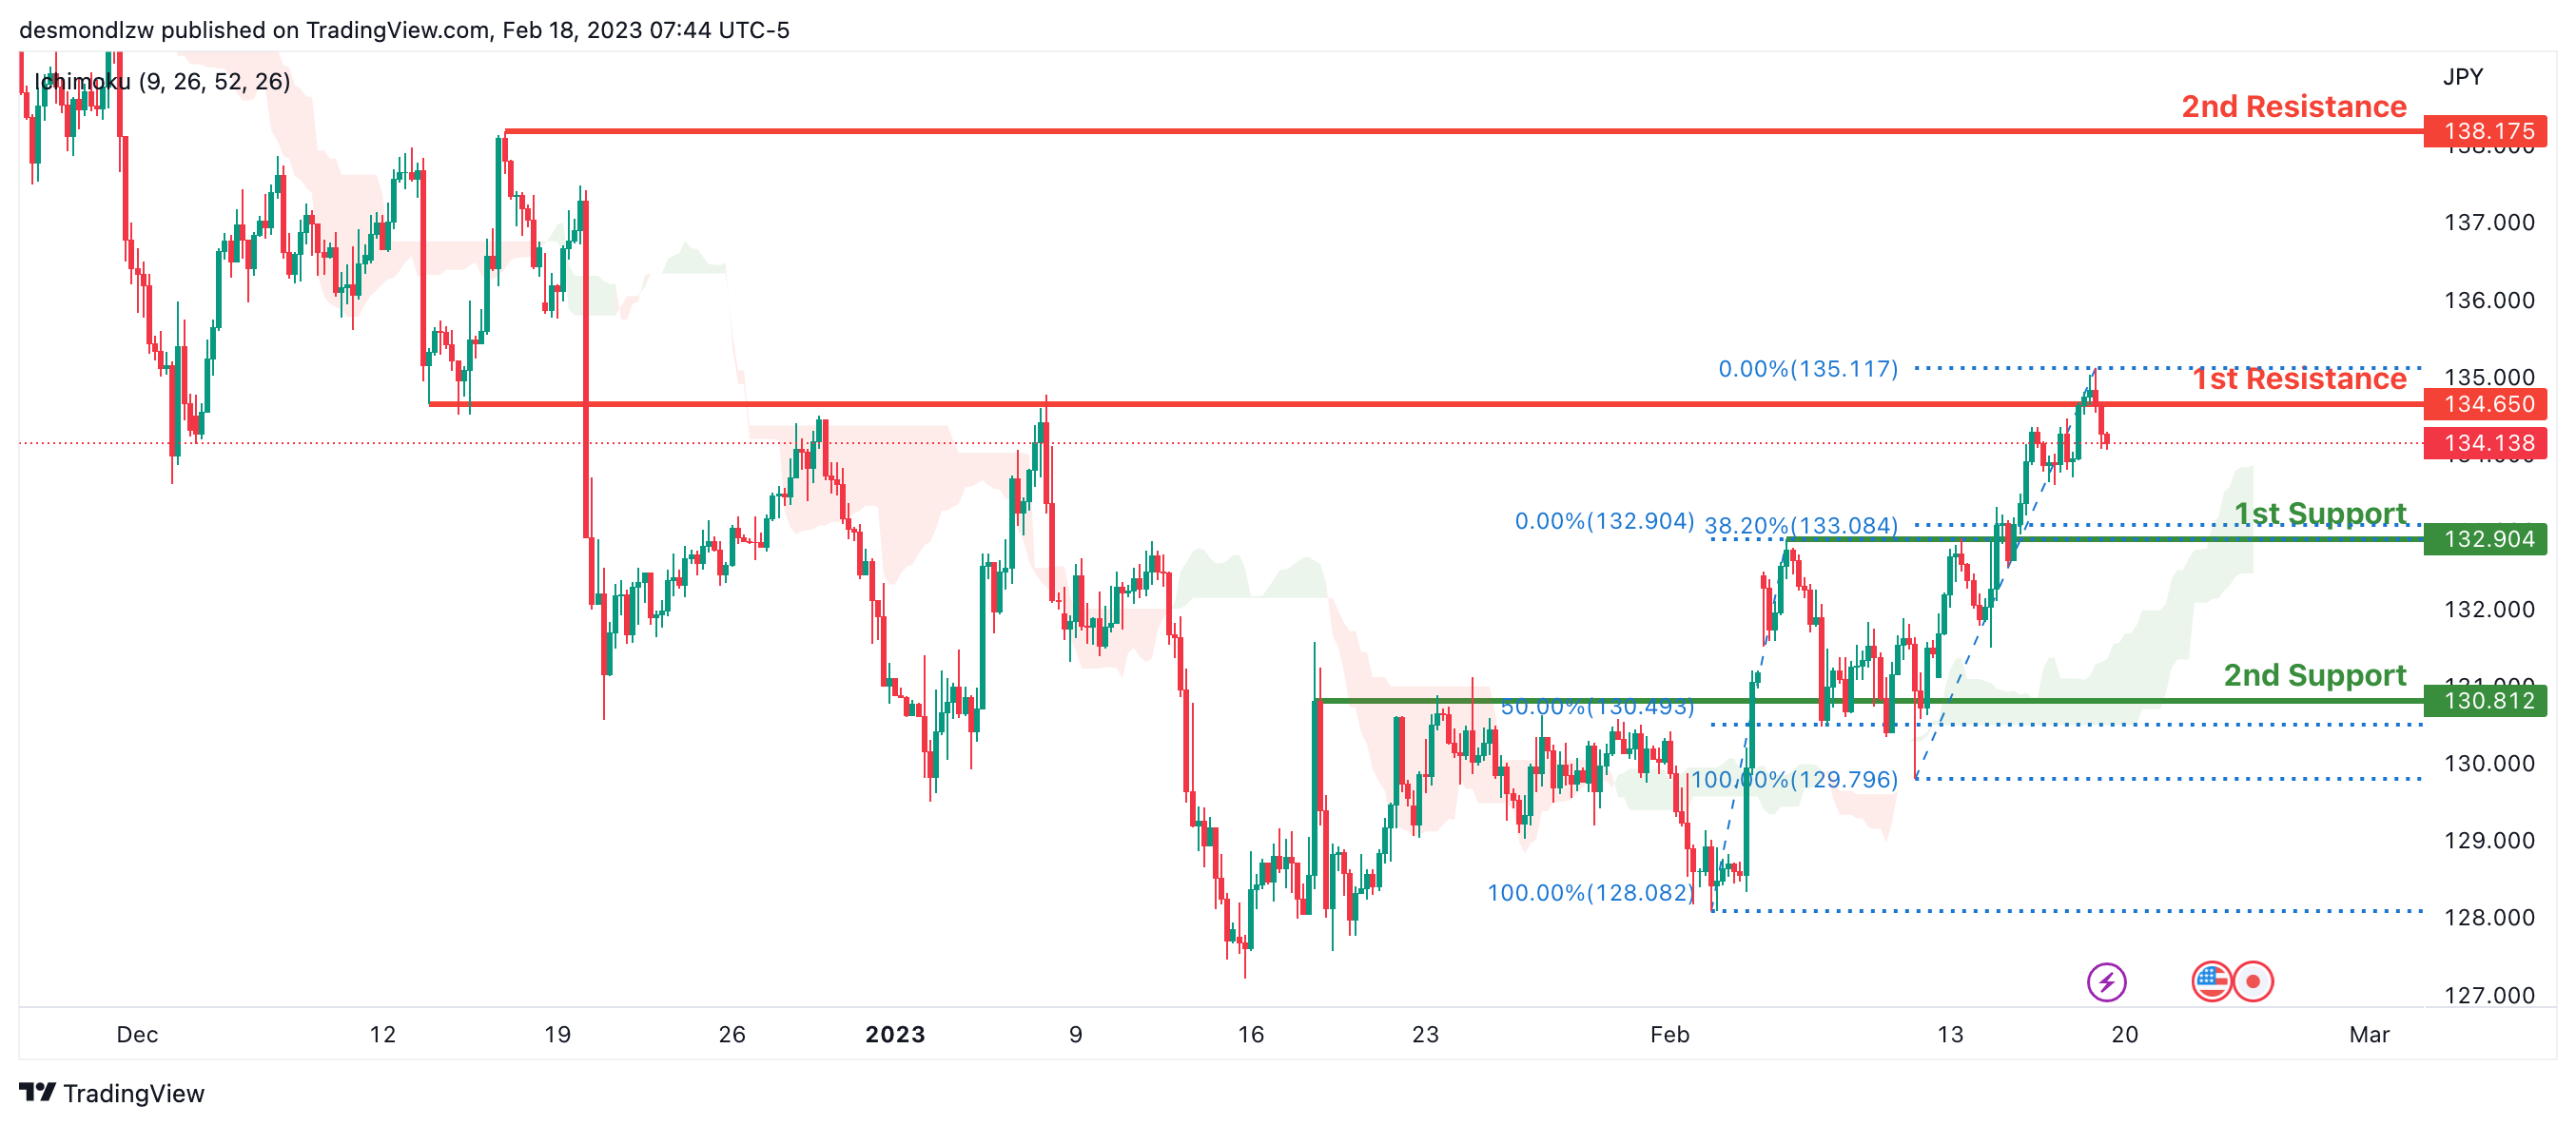
Looking at the H4 chart, my overall bias for USDJPY is bullish due to the current price being above the Ichimoku cloud, indicating a bullish market. If this bullish momentum continues, expect the price to possibly break the 1st resistance at 134.650, where the overlap resistance is before heading towards the 2nd resistance at 138.175, where the previous swing high is.
In an alternate scenario, price could possibly head back down to retest the 1st support at 132.904, where the overlap support and 38.2% Fibonacci line is.
Areas of consideration:
- H4 time frame, 1st resistance at 134.650
- H4 time frame, 2nd resistance at 138.175
- H4 time frame, 1st support at 132.904
DXY:
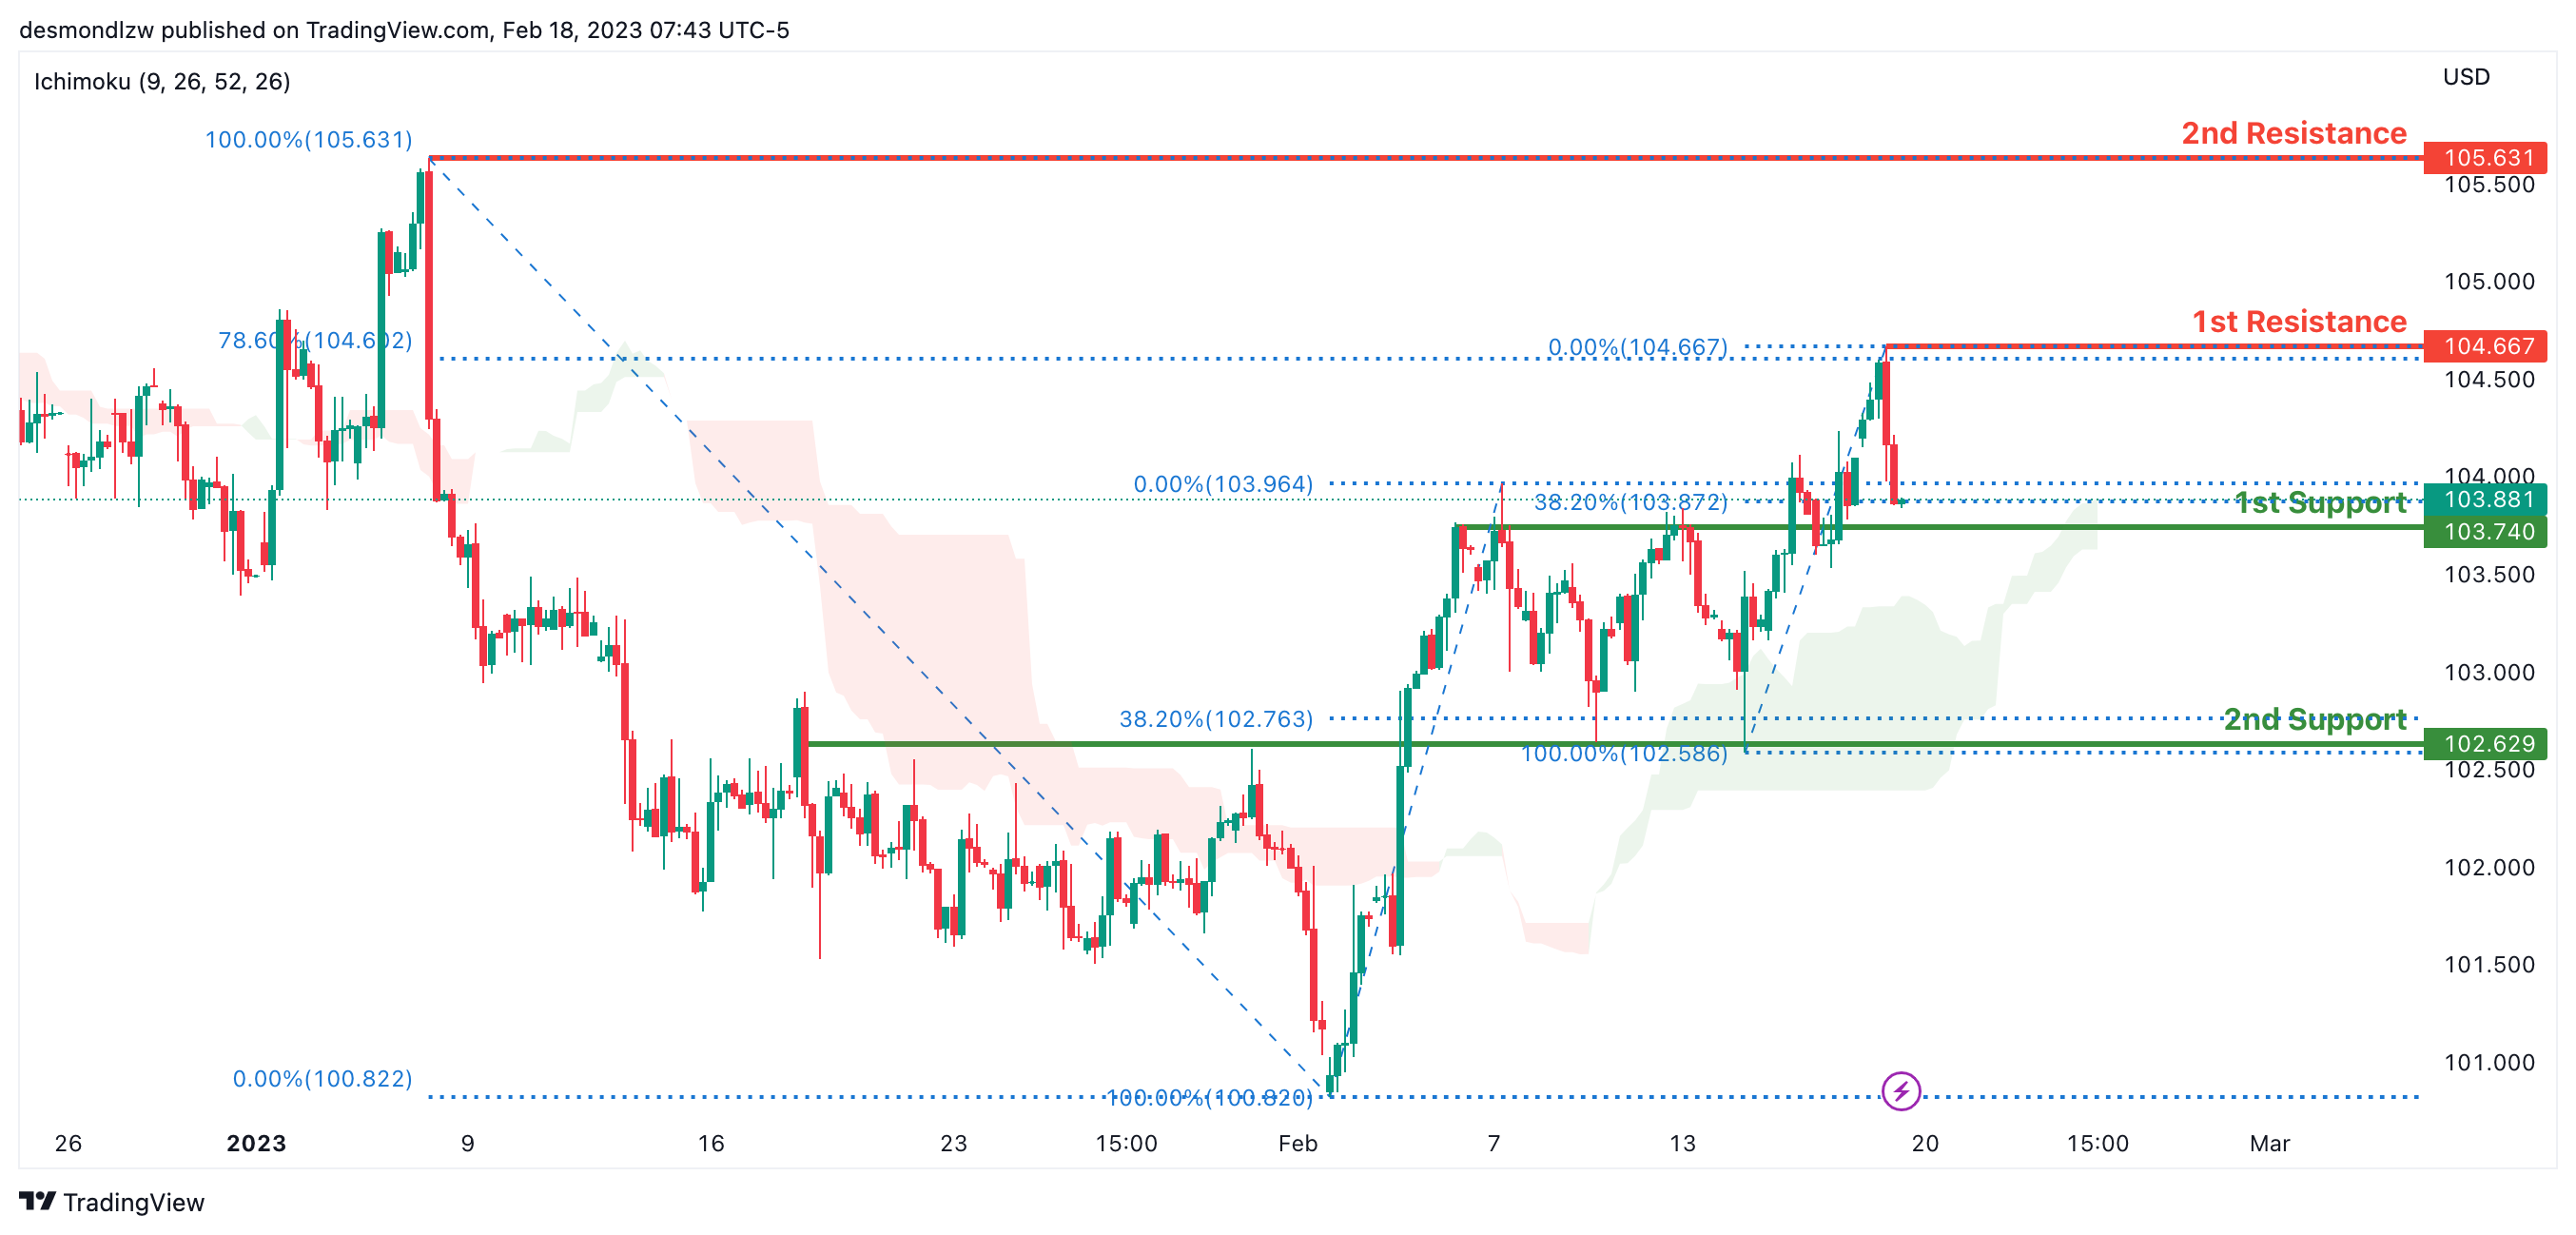
Looking at the H4 chart, my overall bias for DXY is bullish due to the current price crossing above the Ichimoku cloud, indicating a bullish market. If this bullish momentum continues, expect the price to possibly continue heading towards the 1st resistance at 104.667, where the recent high and 78.6% Fibonacci line is.
In an alternative scenario, price could head back down to retest the 1st support at 103.740, where the overlap support and 38.2% Fibonacci line is.
Areas of consideration:
- H4 time frame, 1st resistance at 104.667
- H4 time frame, 1st support at 103.740
EUR/USD:
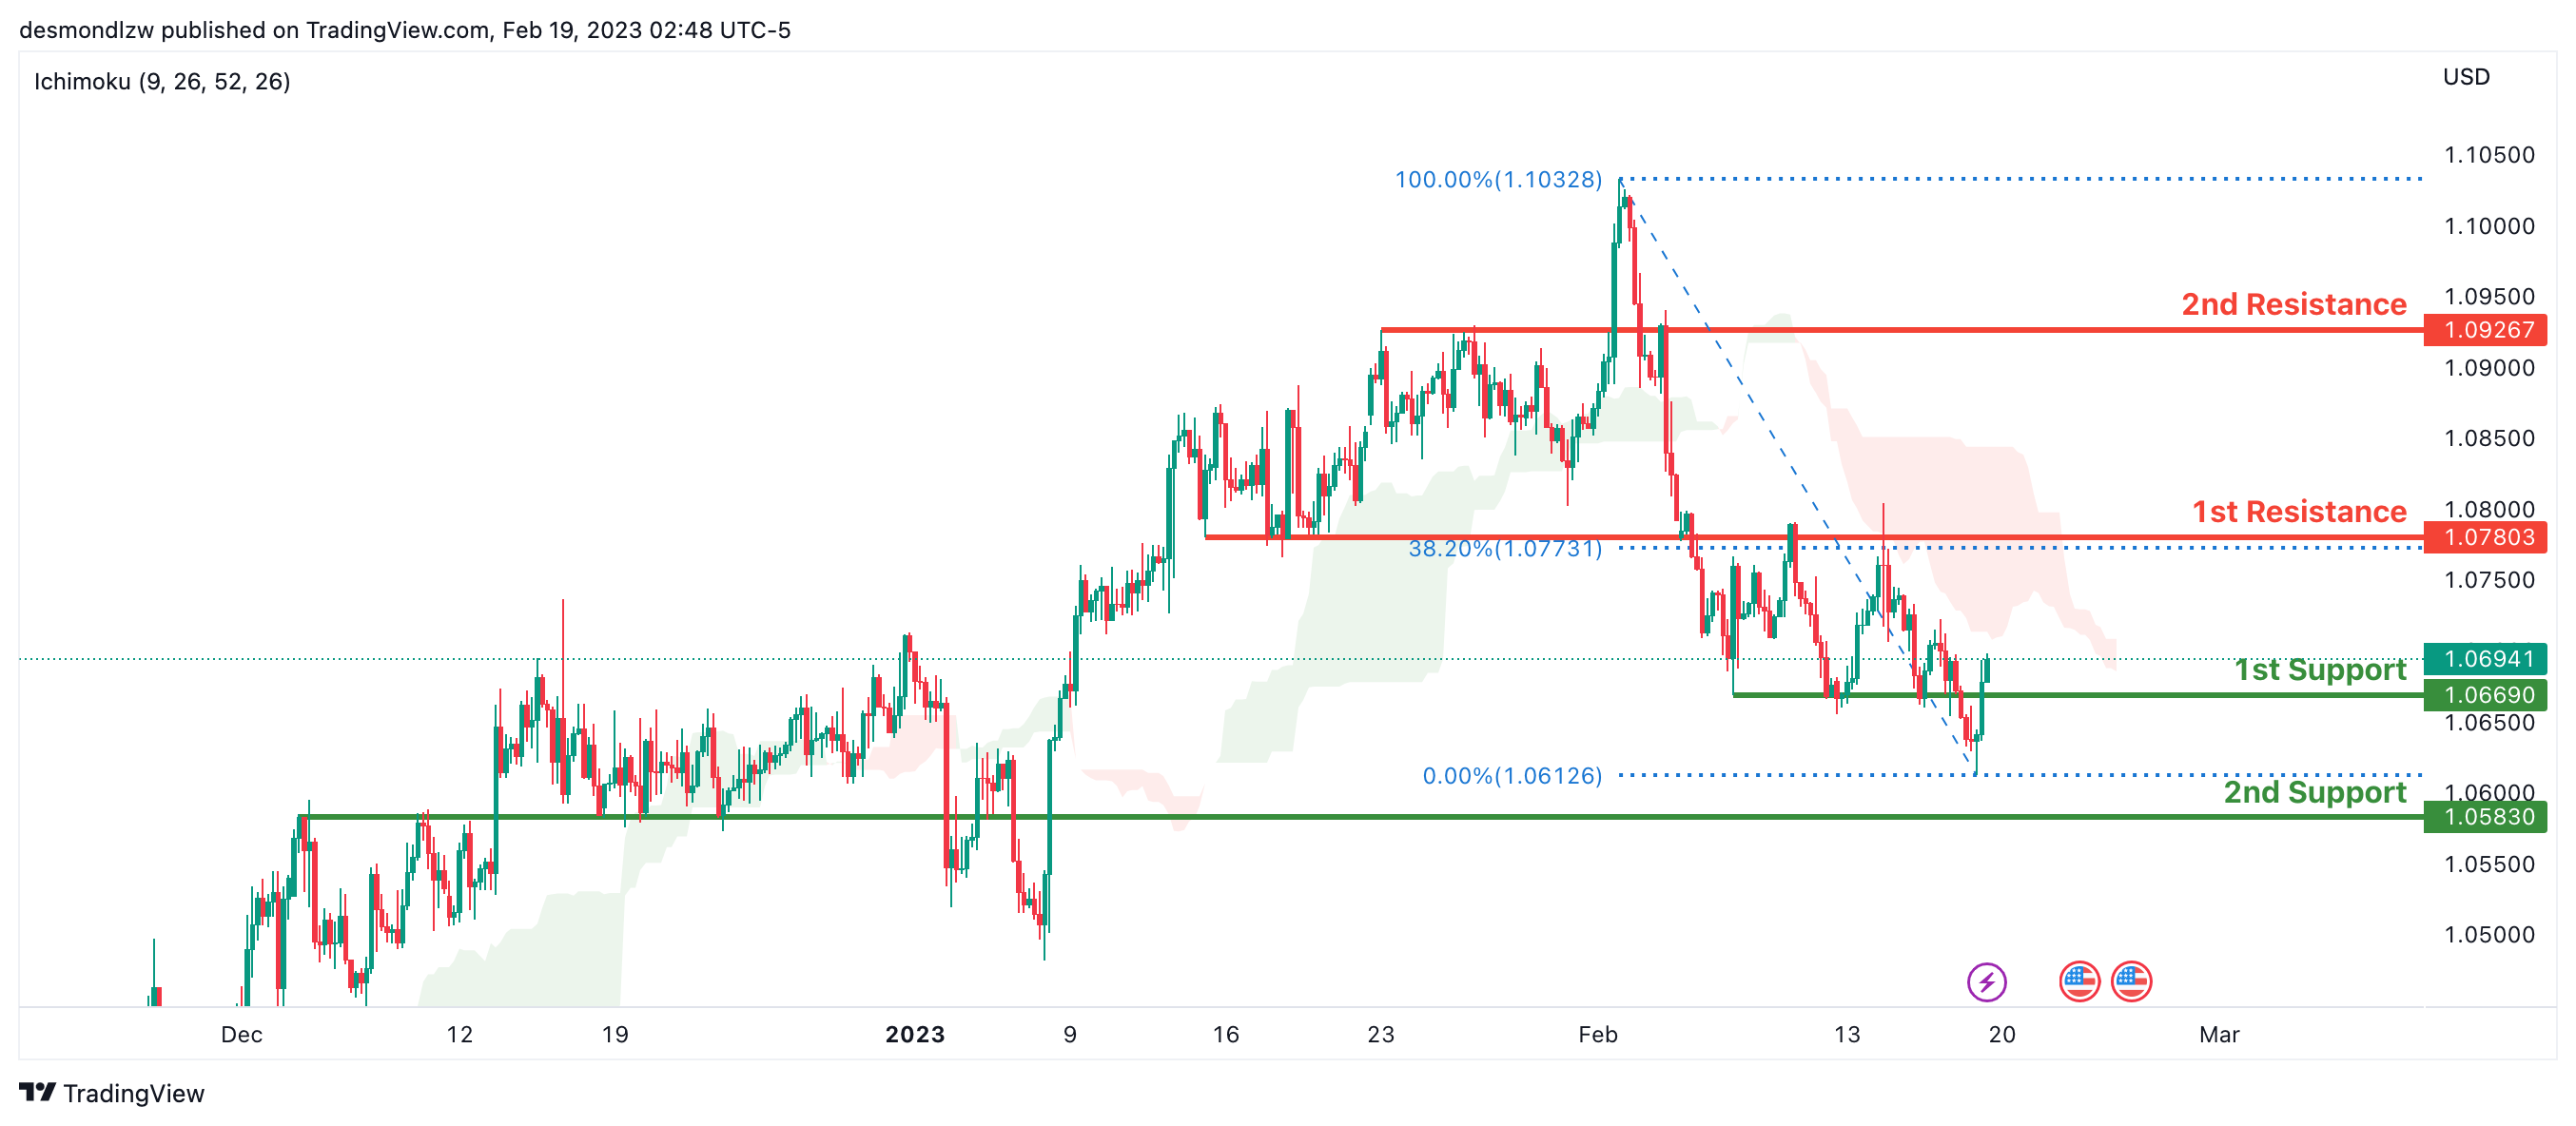
Looking at the H4 chart, my overall bias for EURUSD is bearish due to the current price crossing below the Ichimoku cloud, indicating a bearish market structure. If this bearish momentum continues, expect the price to possibly break the 1st support at 1.06690, where the overlap support is, before heading towards the 2nd support at 1.05830 which is the overlap support.
In an alternate scenario, price could possibly head back up to retest the 1st resistance at 1.07803, where the overlap resistance and 38.2% Fibonacci line is.
Areas of consideration :
- H4 1st resistance at 1.07803
- H4 1st support at 1.06690
- H4 2nd support at 1.05830
GBP/USD:
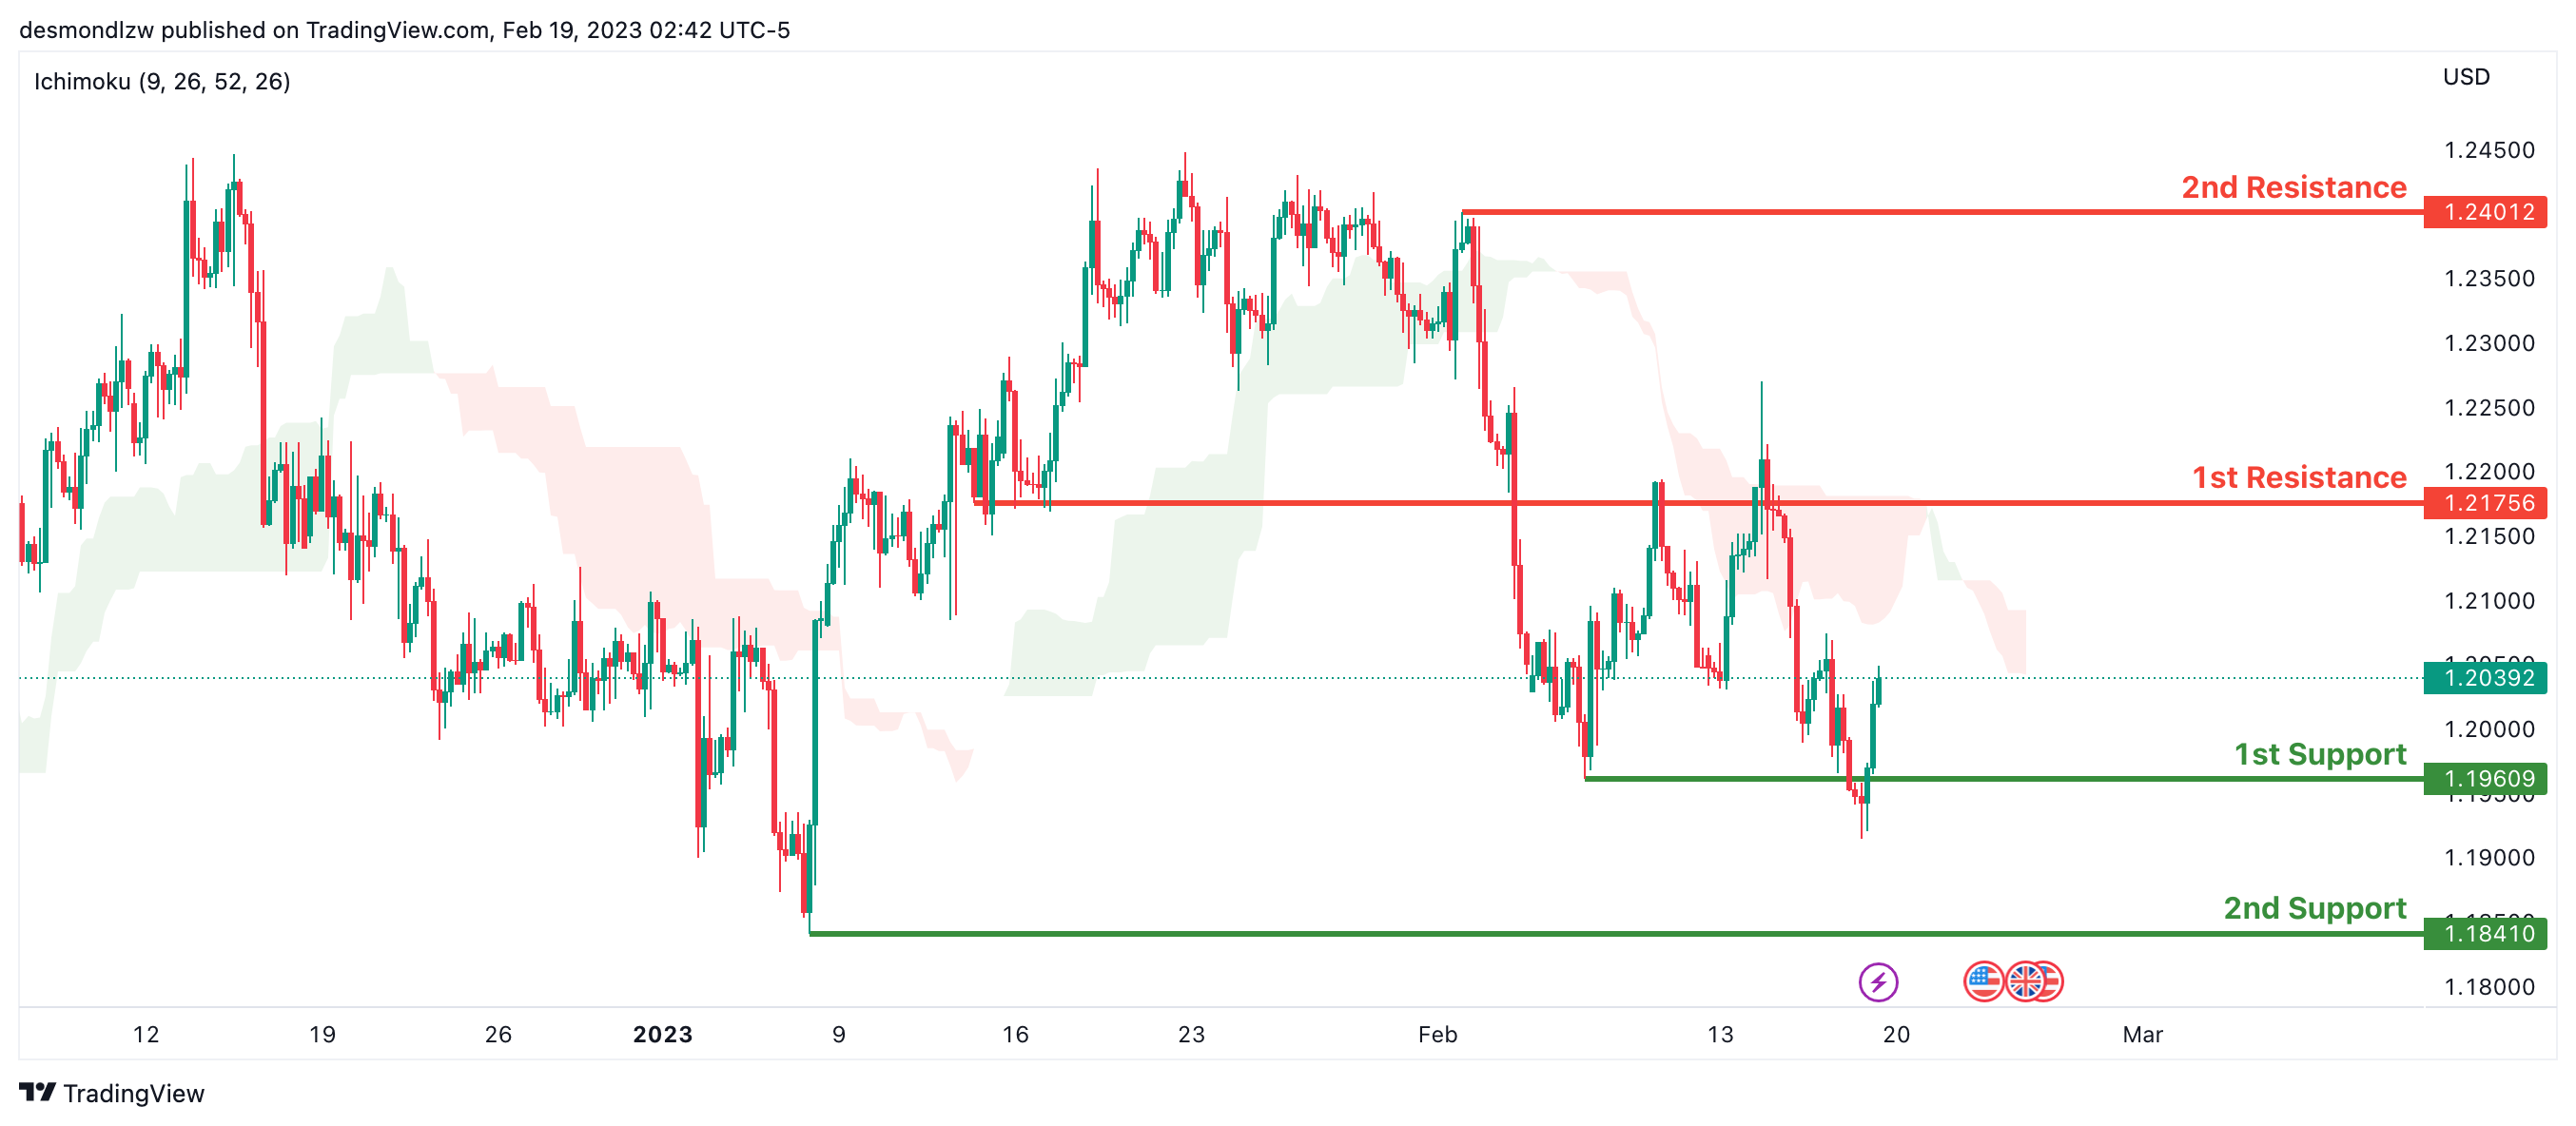
Looking at the H4 chart, my overall bias for GBPUSD is bearish due to the current price crossing below the Ichimoku cloud, indicating a bearish market. If this bearish momentum continues, expect the price to possibly break the 1st support at 1.19609, where the recent swing low is, before heading towards the 2nd support at 1.18410, where the previous swing low is.
In an alternate scenario, price could head back up to retest the 1st resistance line at 1.21756 where the overlap resistance is.
Areas of consideration:
- H4 1st resistance at 1.21756
- H4 1st support at 1.19609
- H4 2nd support at 1.18410
USD/CHF:
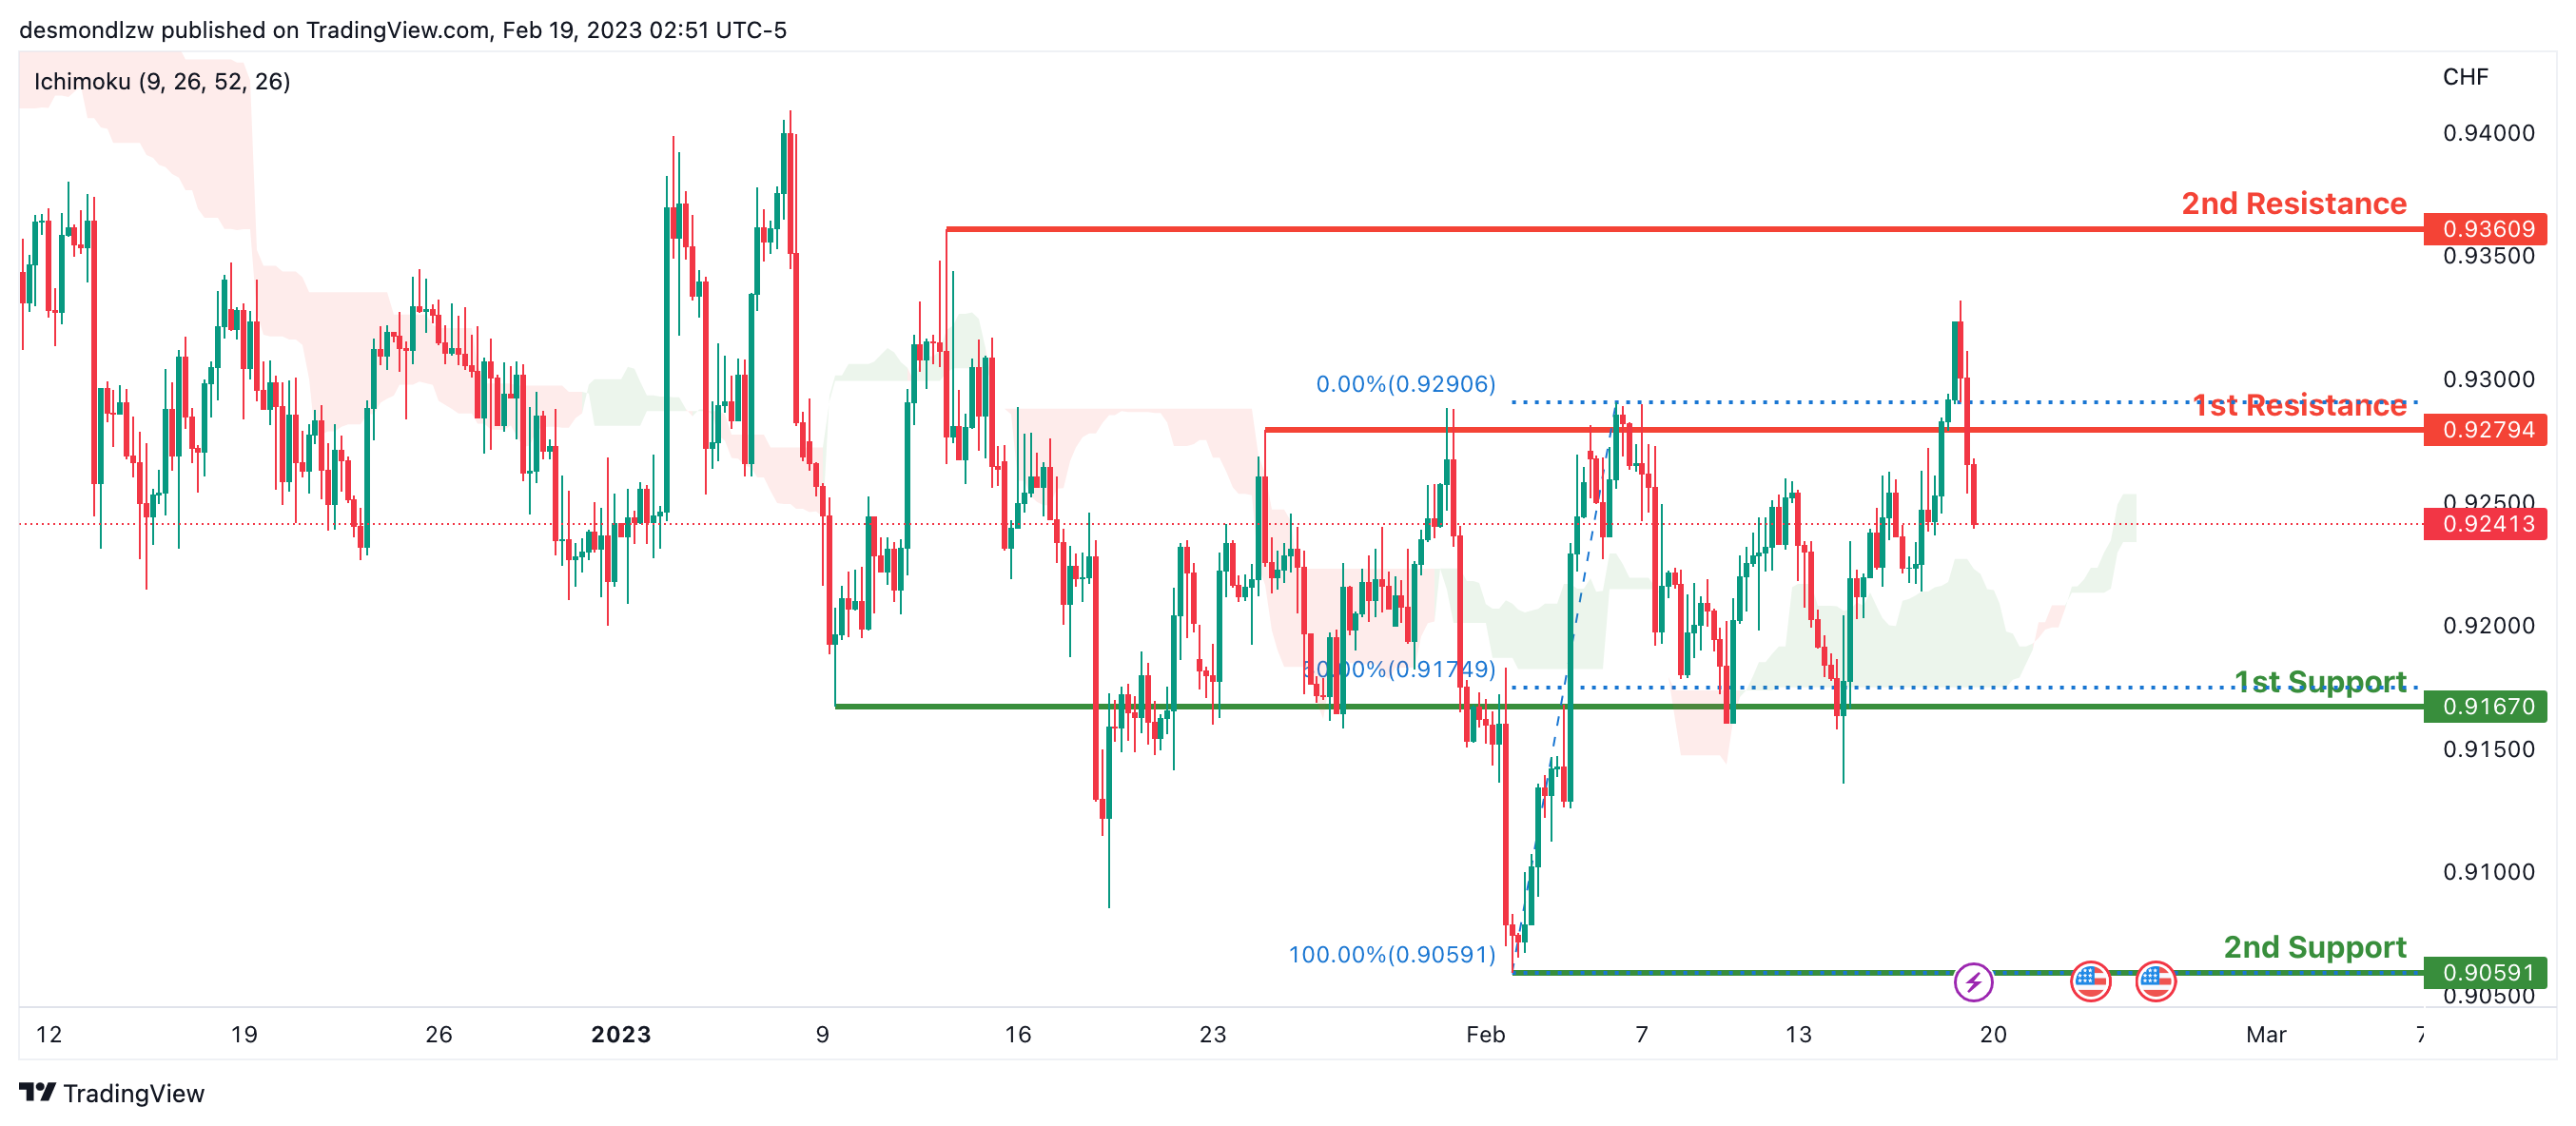
Looking at the H4 chart, my overall bias for USDCHF is bullish due to the current price being above the Ichimoku cloud, indicating a bullish market. If the current bullish trend continues, expect the price to possibly break the 1st resistance at 0.92794, where the previous swing high is, before heading towards the 2nd resistance at 0.93609 where the intermediate high is.
In an alternative scenario, price could possibly head back down to retest the 1st support at 0.91670, where the recent swing low and 50% Fibonacci line is.
Areas of consideration
- H4 1st support at 0.91670
- H4 1st resistance at 0.92794
- H4 2nd resistance at 0.93609
XAU/USD (GOLD):
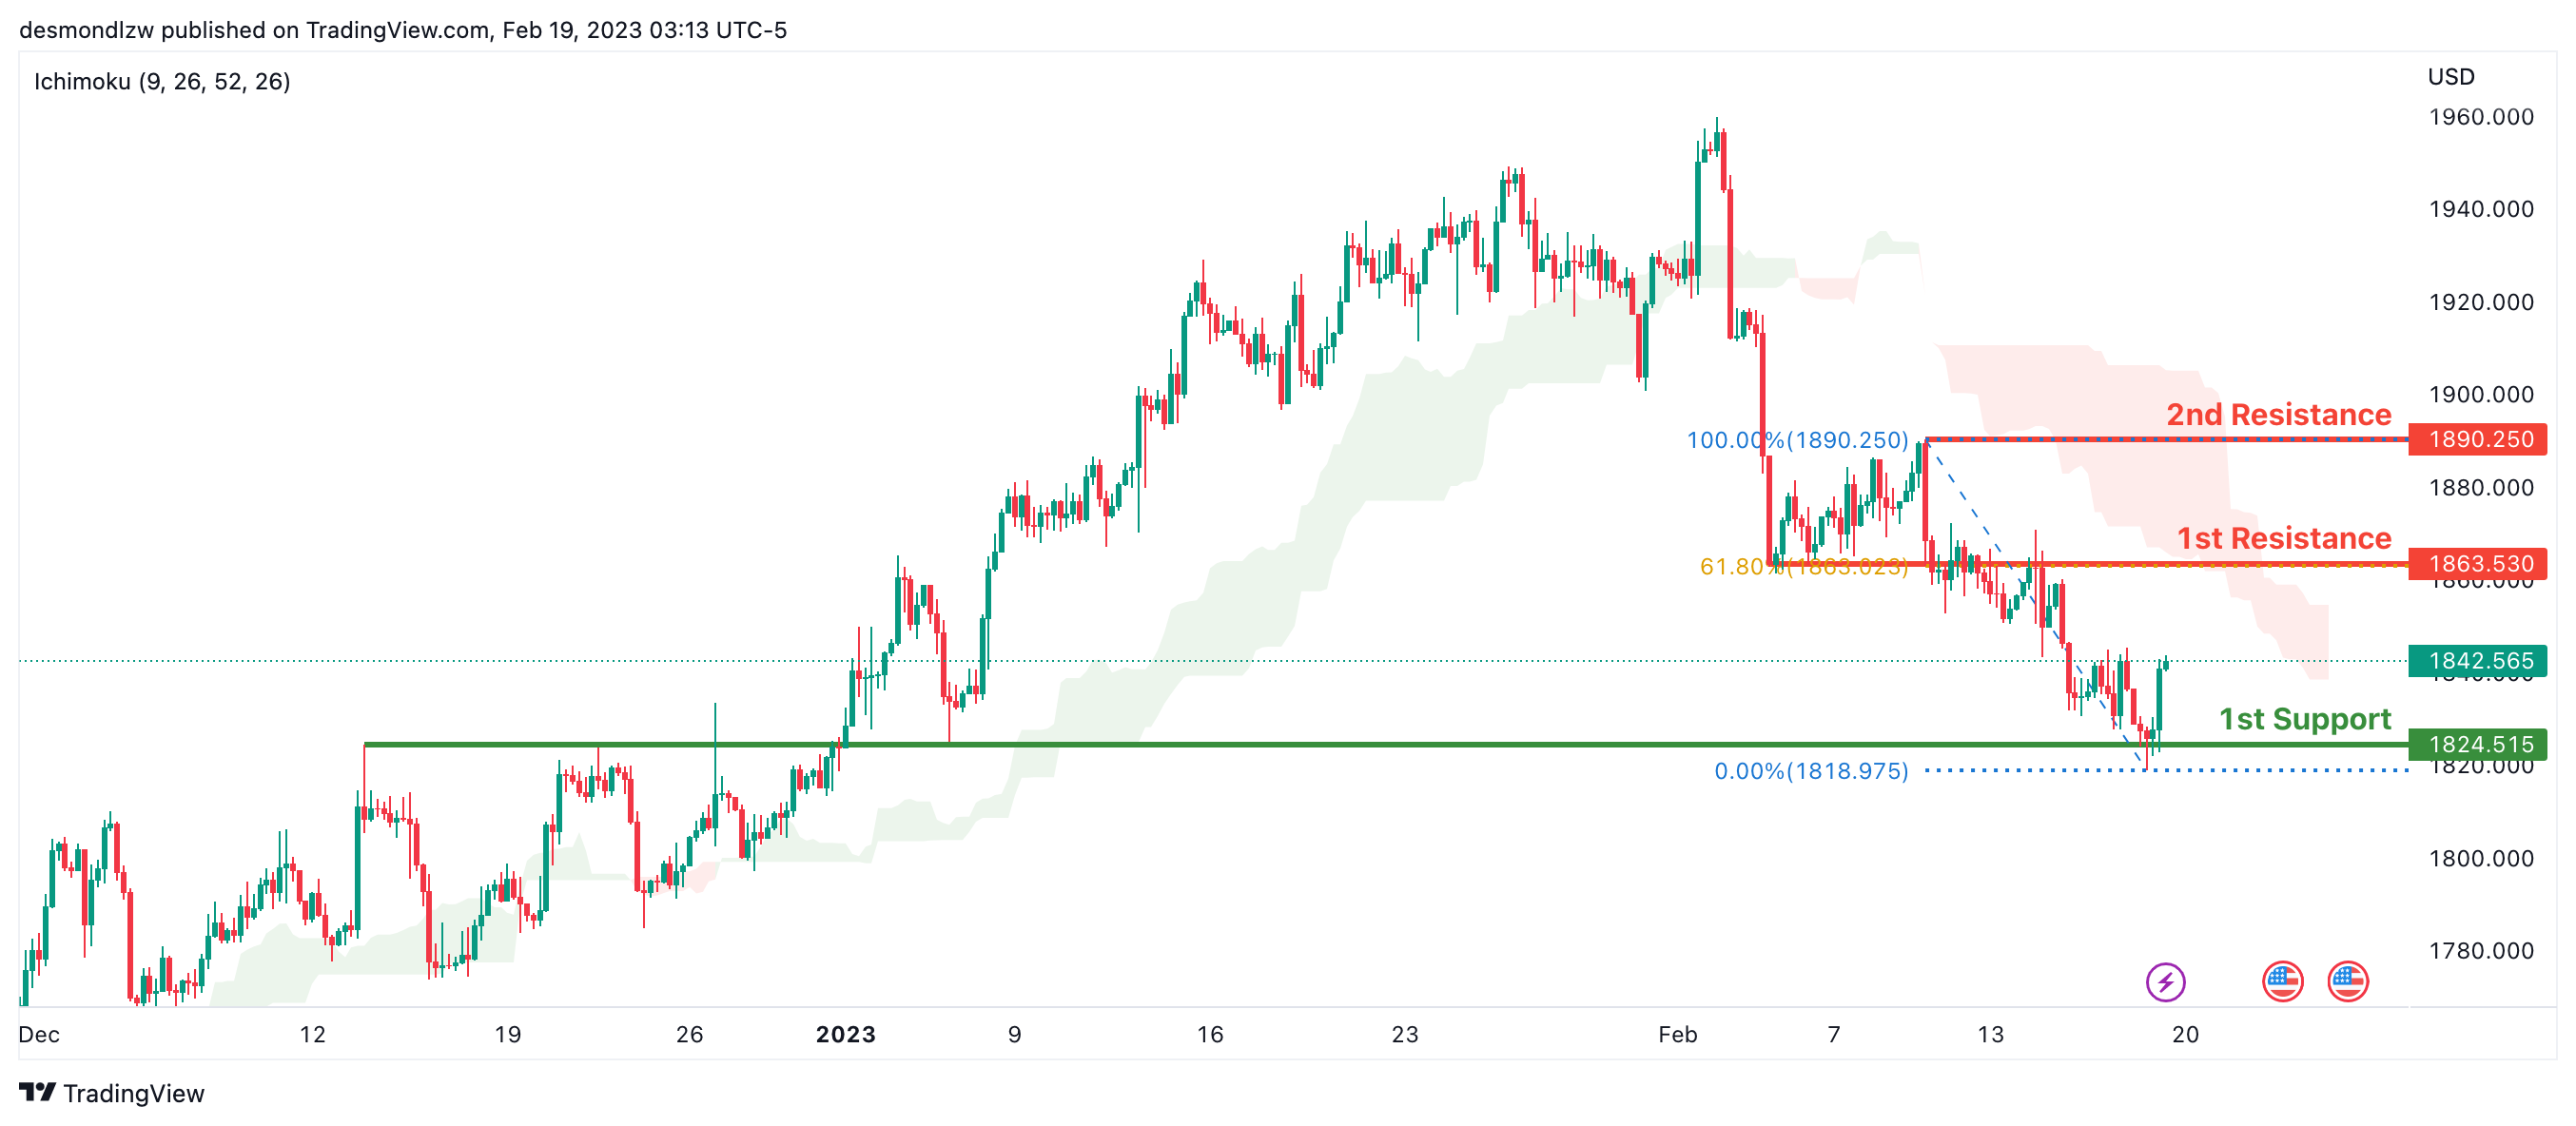
Looking at the H4 chart, my overall bias for XAUUSD is bearish due to the current price being below the Ichimoku cloud, indicating a bearish market. If this bearish momentum continues, expect the price to possibly continue heading towards the 1st support at 1824.515 where the overlap support is.
In an alternative scenario, price could possibly head back up to retest the 1st resistance at 1863.530, where the overlap resistance and 61.8% Fibonacci line is.
Areas of consideration:
- H4 time frame, 1st resistance at 1863.530
- H4 time frame, 1st support at 1824.515
AUD/USD:
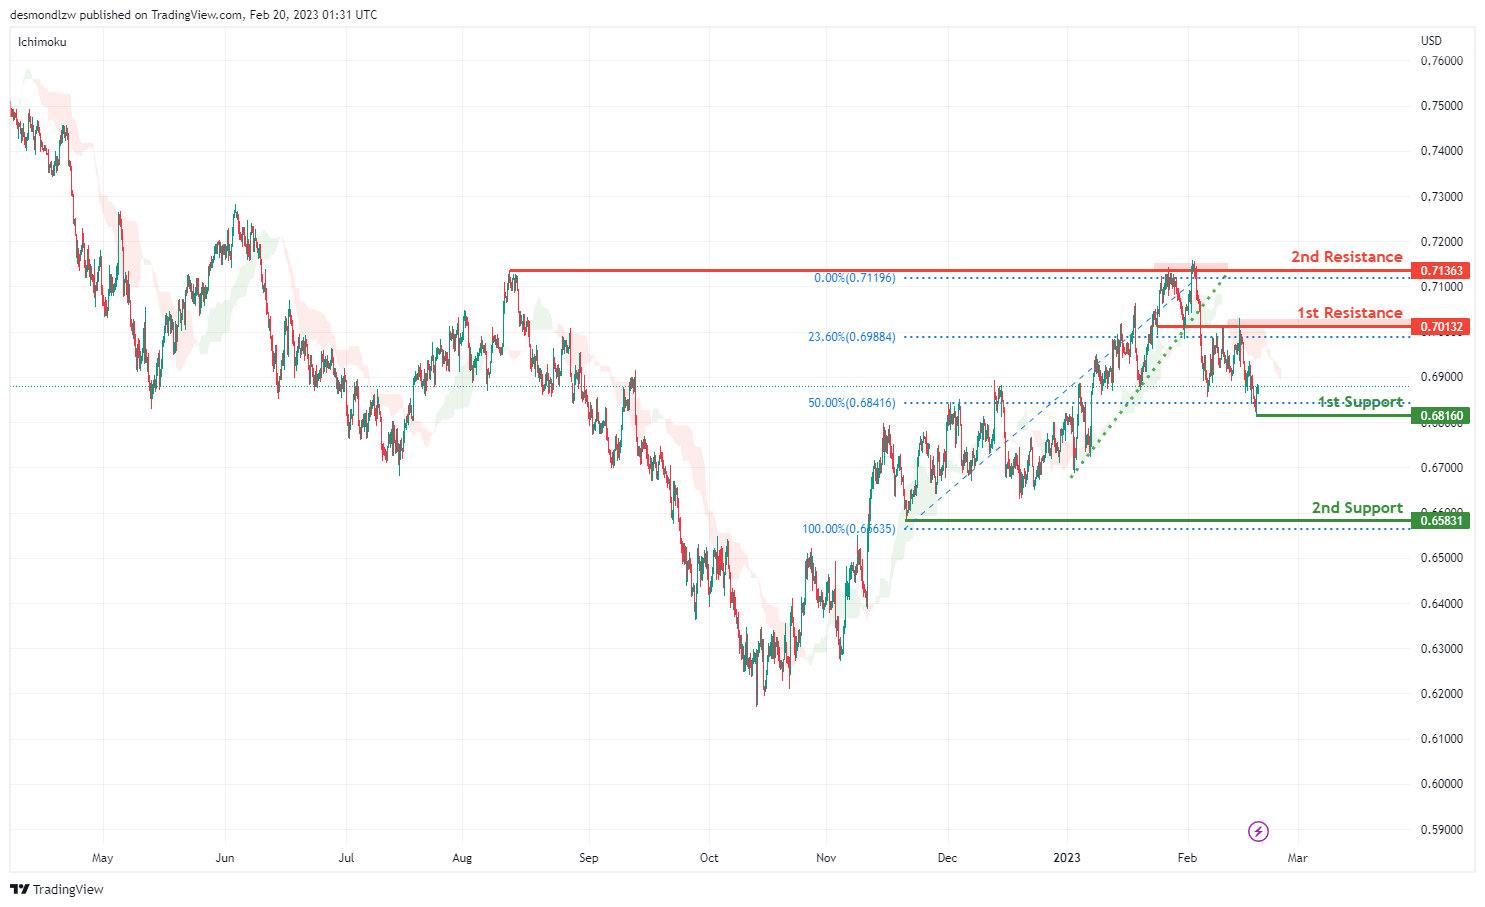
Looking at the H4 chart, my overall bias for AUDUSD is bearish due to the current price being below the Ichimoku cloud, and the ascending trend line has been broken, indicating a change in market structure.
The 1st support is at 0.68160 which is the recent swing high and in line with the 50% Fibonacci retracement. The 2nd support is at 0.65831 which is the recent swing low.
In an alternate scenario, the price could possibly go back up towards the 1st resistance level at 0.70132 which is the recent swing high and in line with the 23.6% Fibonacci retracement. There is 2nd resistance at 0.71363 which is the previous swing high.
Areas of consideration
- H4. 2nd resistance at 0.71363
- H4. 1st resistance at 0.70132
- H4, 1st support at 0.68160
- H4, 2nd support at 0.65831
NZD/USD:
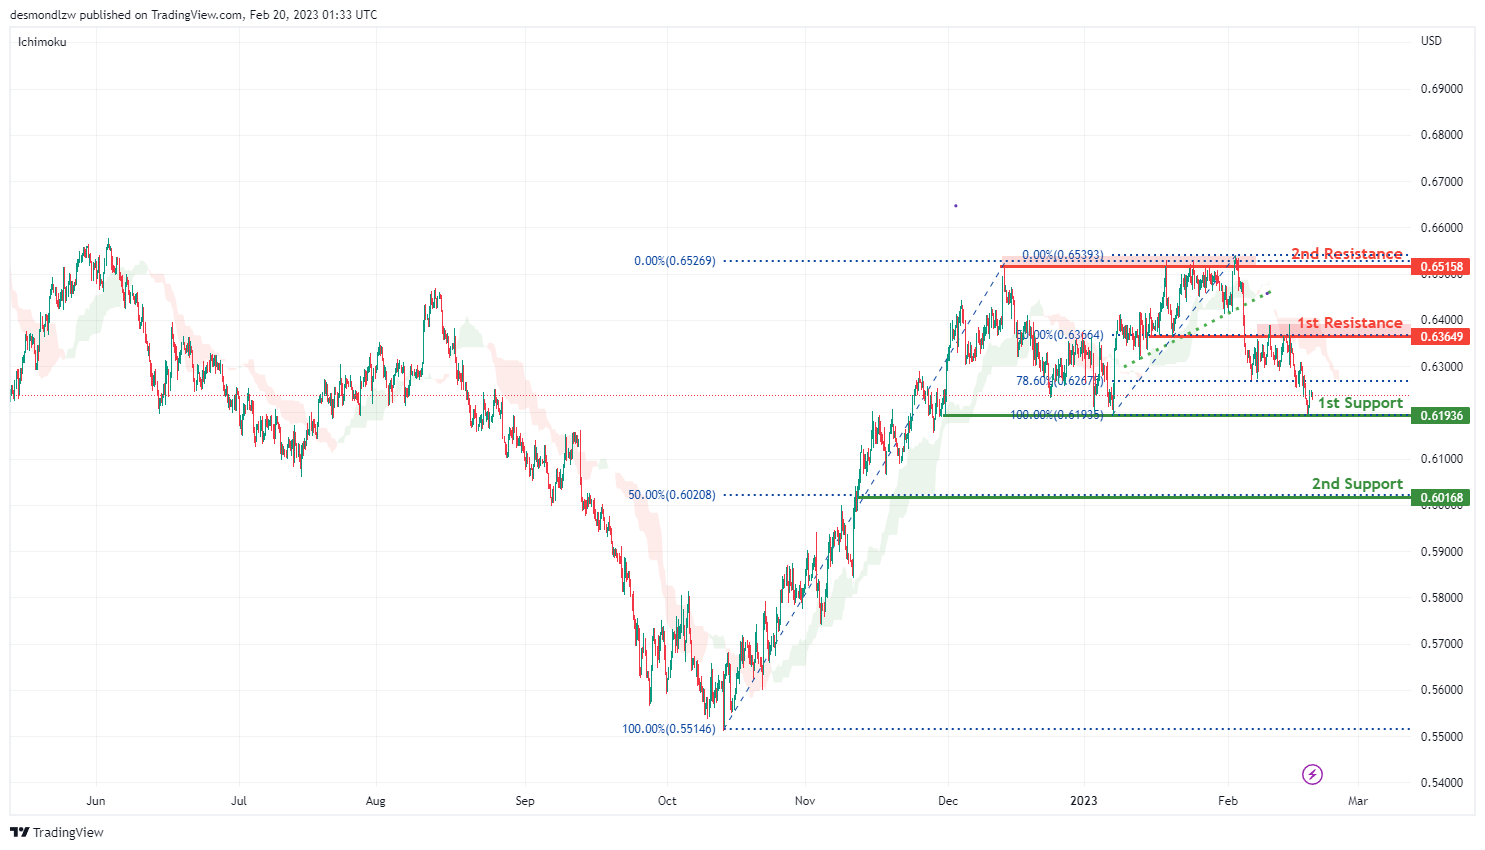
Looking at the H4 chart, my overall bias for NZDUSD is bearish, as the current price is below the Ichimoku Cloud.
Expecting the price to go down towards the 1st support at 0.61936 which is the overlap swing low. The 2nd support is at 0.60168 where the 50% Fibonacci line is.
In an alternate scenario, price could possibly go up towards the 1st resistance level at 0.63649 which is the recent overlap swing high and in line with 50% Fibonacci retracement. There is a 2nd resistance at 0.65158.
Areas of consideration:
- H4 time frame, 2nd resistance at 0.65158
- H4 time frame, 1st resistance at 0.63649
- H4 time frame, 1st support at 0.61936
- H4 time frame, 2nd support at 0.60168
USD/CAD:
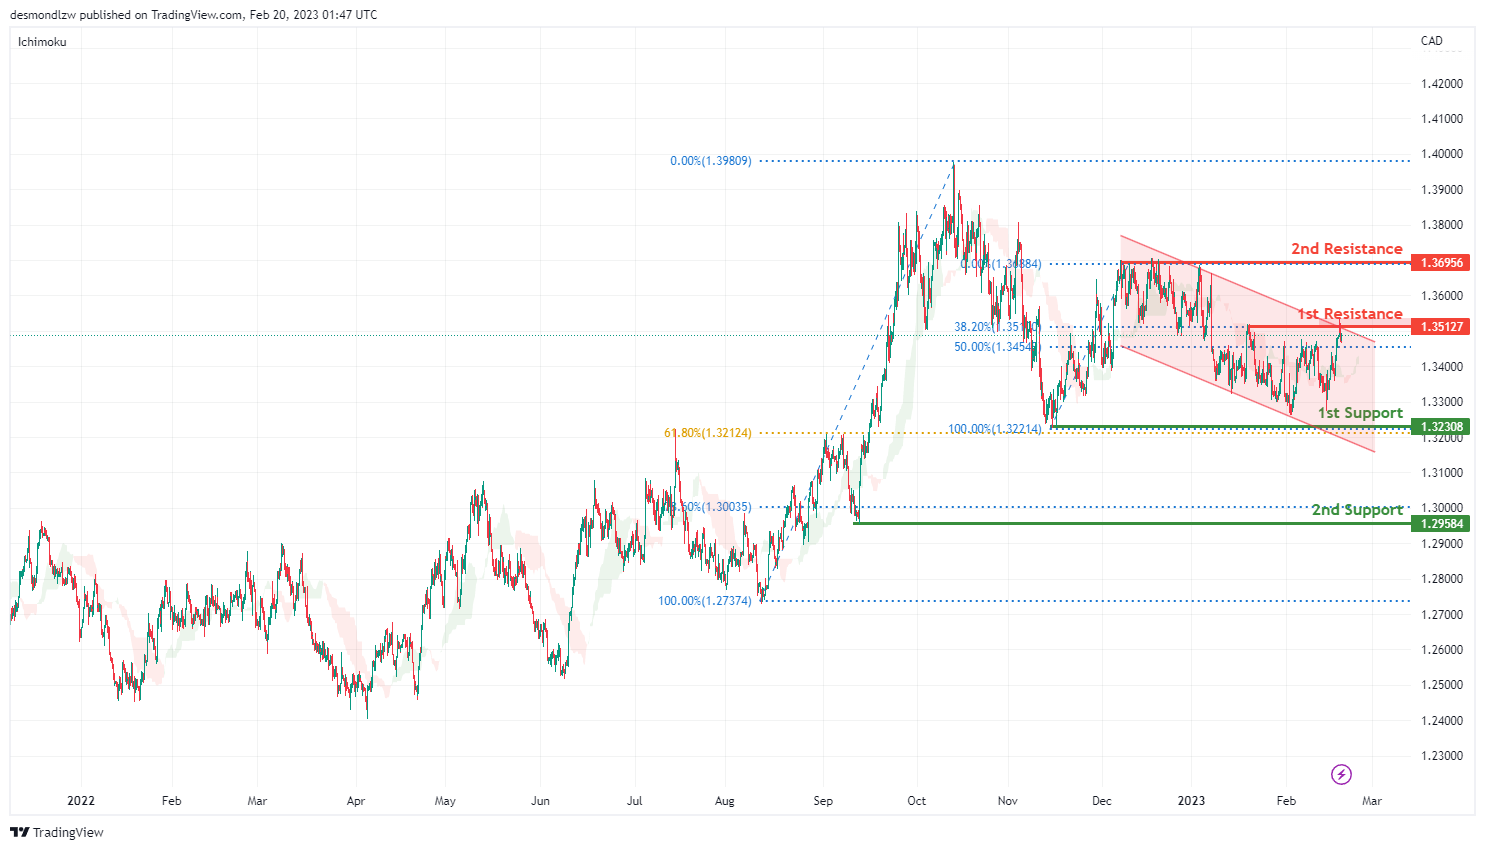
Looking at the H4 chart, my overall bias for USDCAD is bearish , as there is descending chanel. Expecting the current price possibly down to the 1st support at 1.32308 which is the previous swing low and also in line with the 61.8% Fibonacci retracement. The 2nd support is at 1.29584 where the 78.6% Fibonacci line is .
In an alternative scenario, the price could possibly break the 1st resistance at 1.35127 which is the recent swing high and in line with 38.2% Fibonacci retracement, before heading to the 2nd resistance at 1.36956 which is the overlap previous swing high.
Areas of consideration:
- H4 time frame, 2nd resistance at 1.36956
- H4 time frame, 1st resistance at 1.35127
- H4 time frame, 1st support at 1.32308
- H4 time frame, 2nd support at 1.29584
OIL:
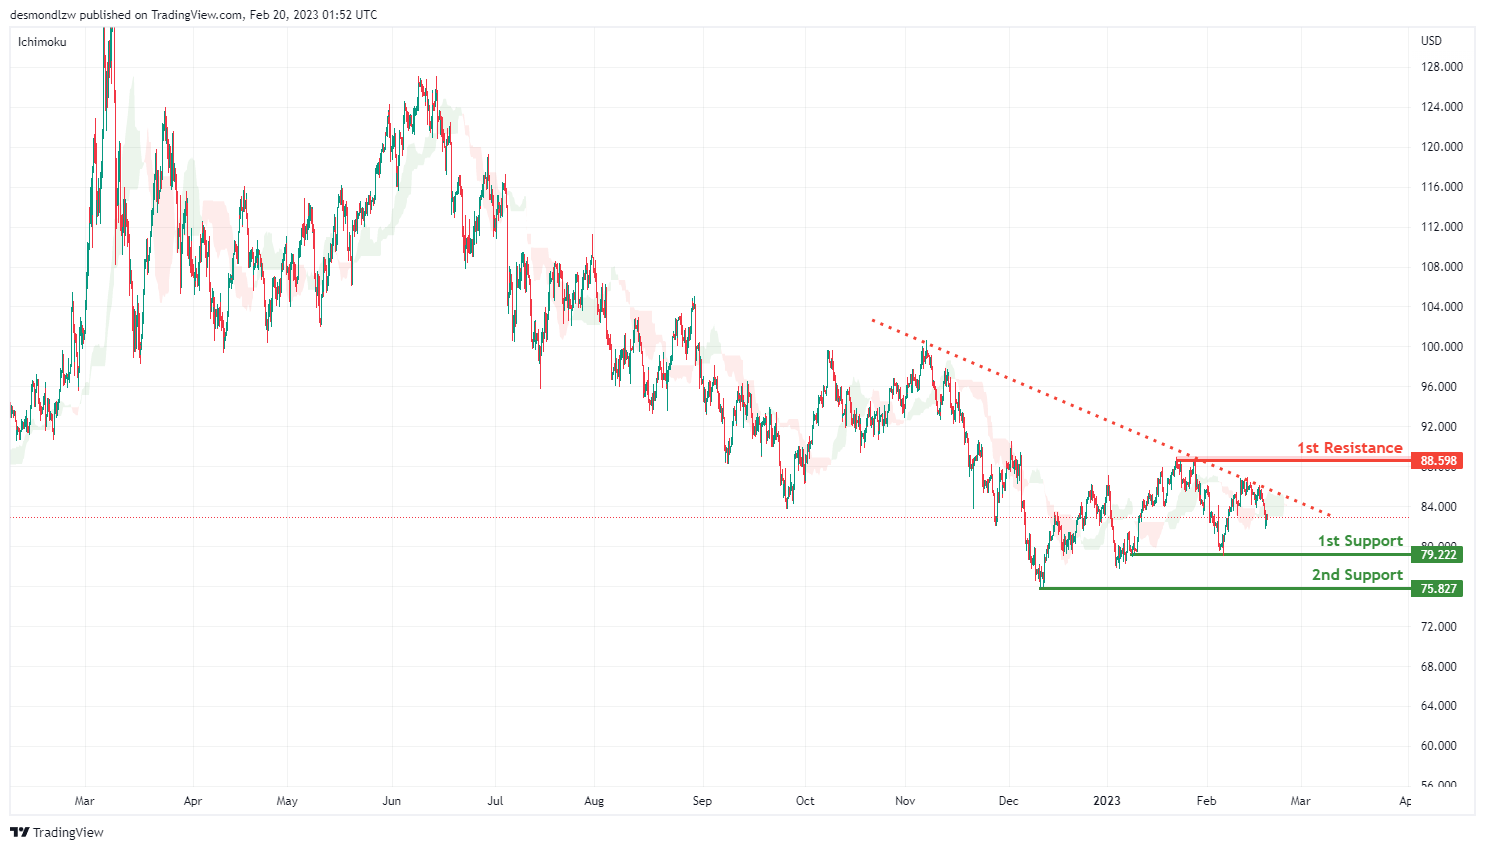
Looking at the H4 chart, my overall bias for BOC is bearish as the current price acrossing the Ichimoku cloud, and there is an descending trend line. Expecting the price to head down towards the 1st support level at 79.222 which is the recent overlap swing low, before the price drops to the 2nd support at 75.827.
In an alternate scenario, the price could possibly head up towards the 1st resistance level at 88.598 which is the recent swing high.
Areas of consideration:
- H4 time frame, 1st resistance at 88.598
- H4 time frame,1st support at 79.587
- H4 time frame, 2nd support at 75.827
Dow Jones Industrial Average:
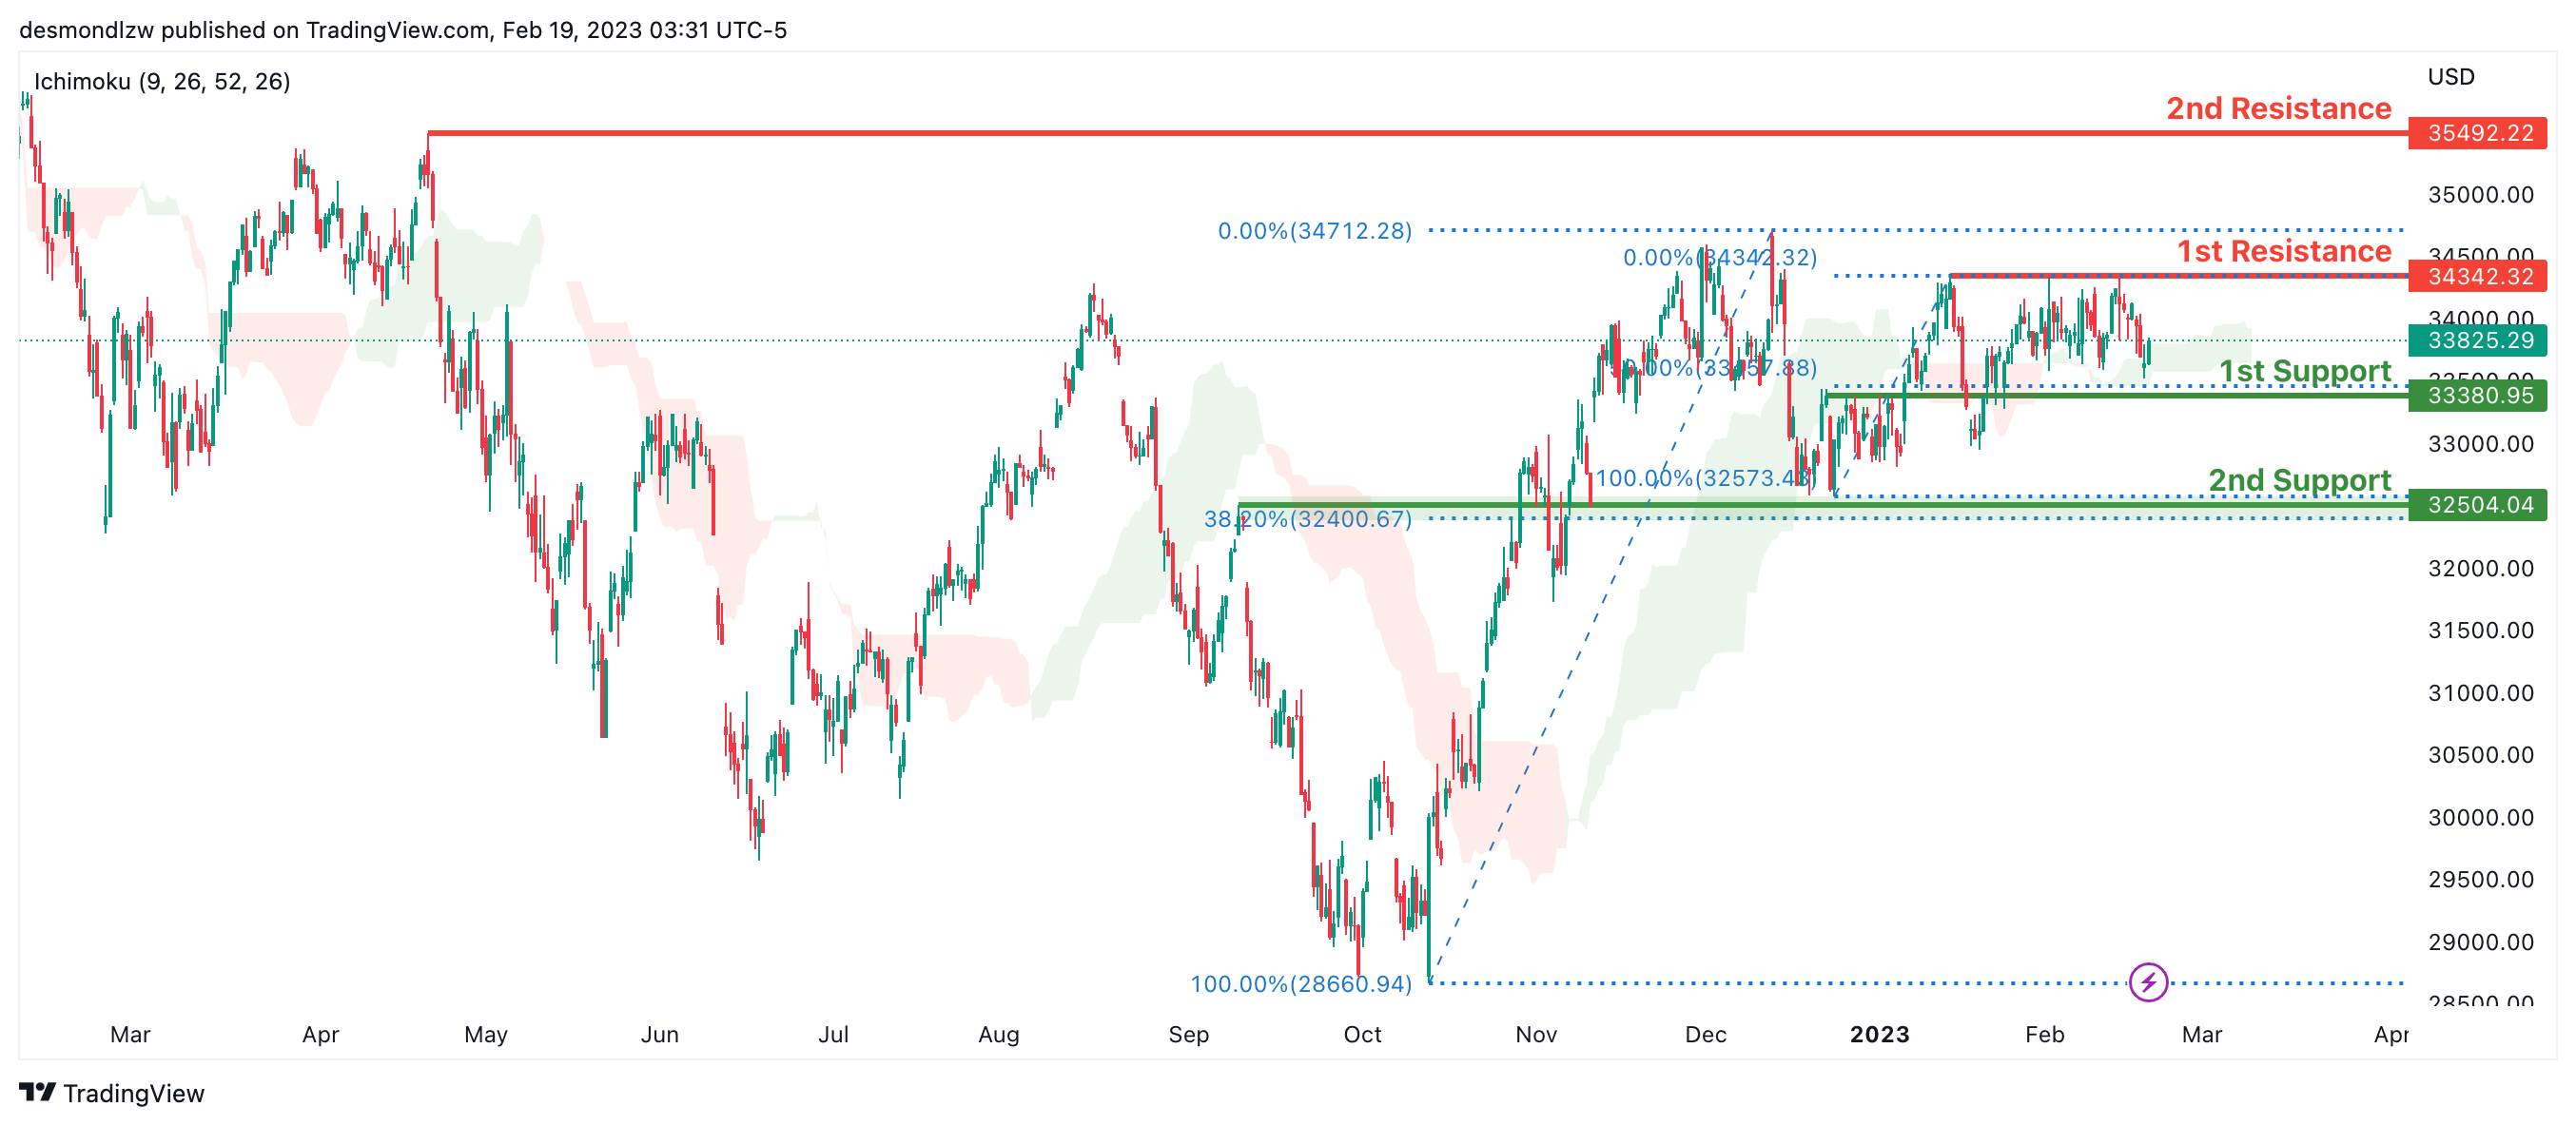
On the H4 chart, the overall bias for DJI is bullish. To add confluence to this, the price is crossing above the Ichimoku cloud which indicates a bullish market. If this bullish momentum continues, expect the price to possibly continue heading towards the 1st resistance line at 34342.32, where the recent swing high is.
In an alternative scenario, price could possibly head back down towards the 1st support at 33380.95, where the 50% Fibonacci line is.
Areas of consideration:
- H4 time frame, 1st support at 33380.95
- H4 time frame, 1st Resistance at 34342.32
DAX:
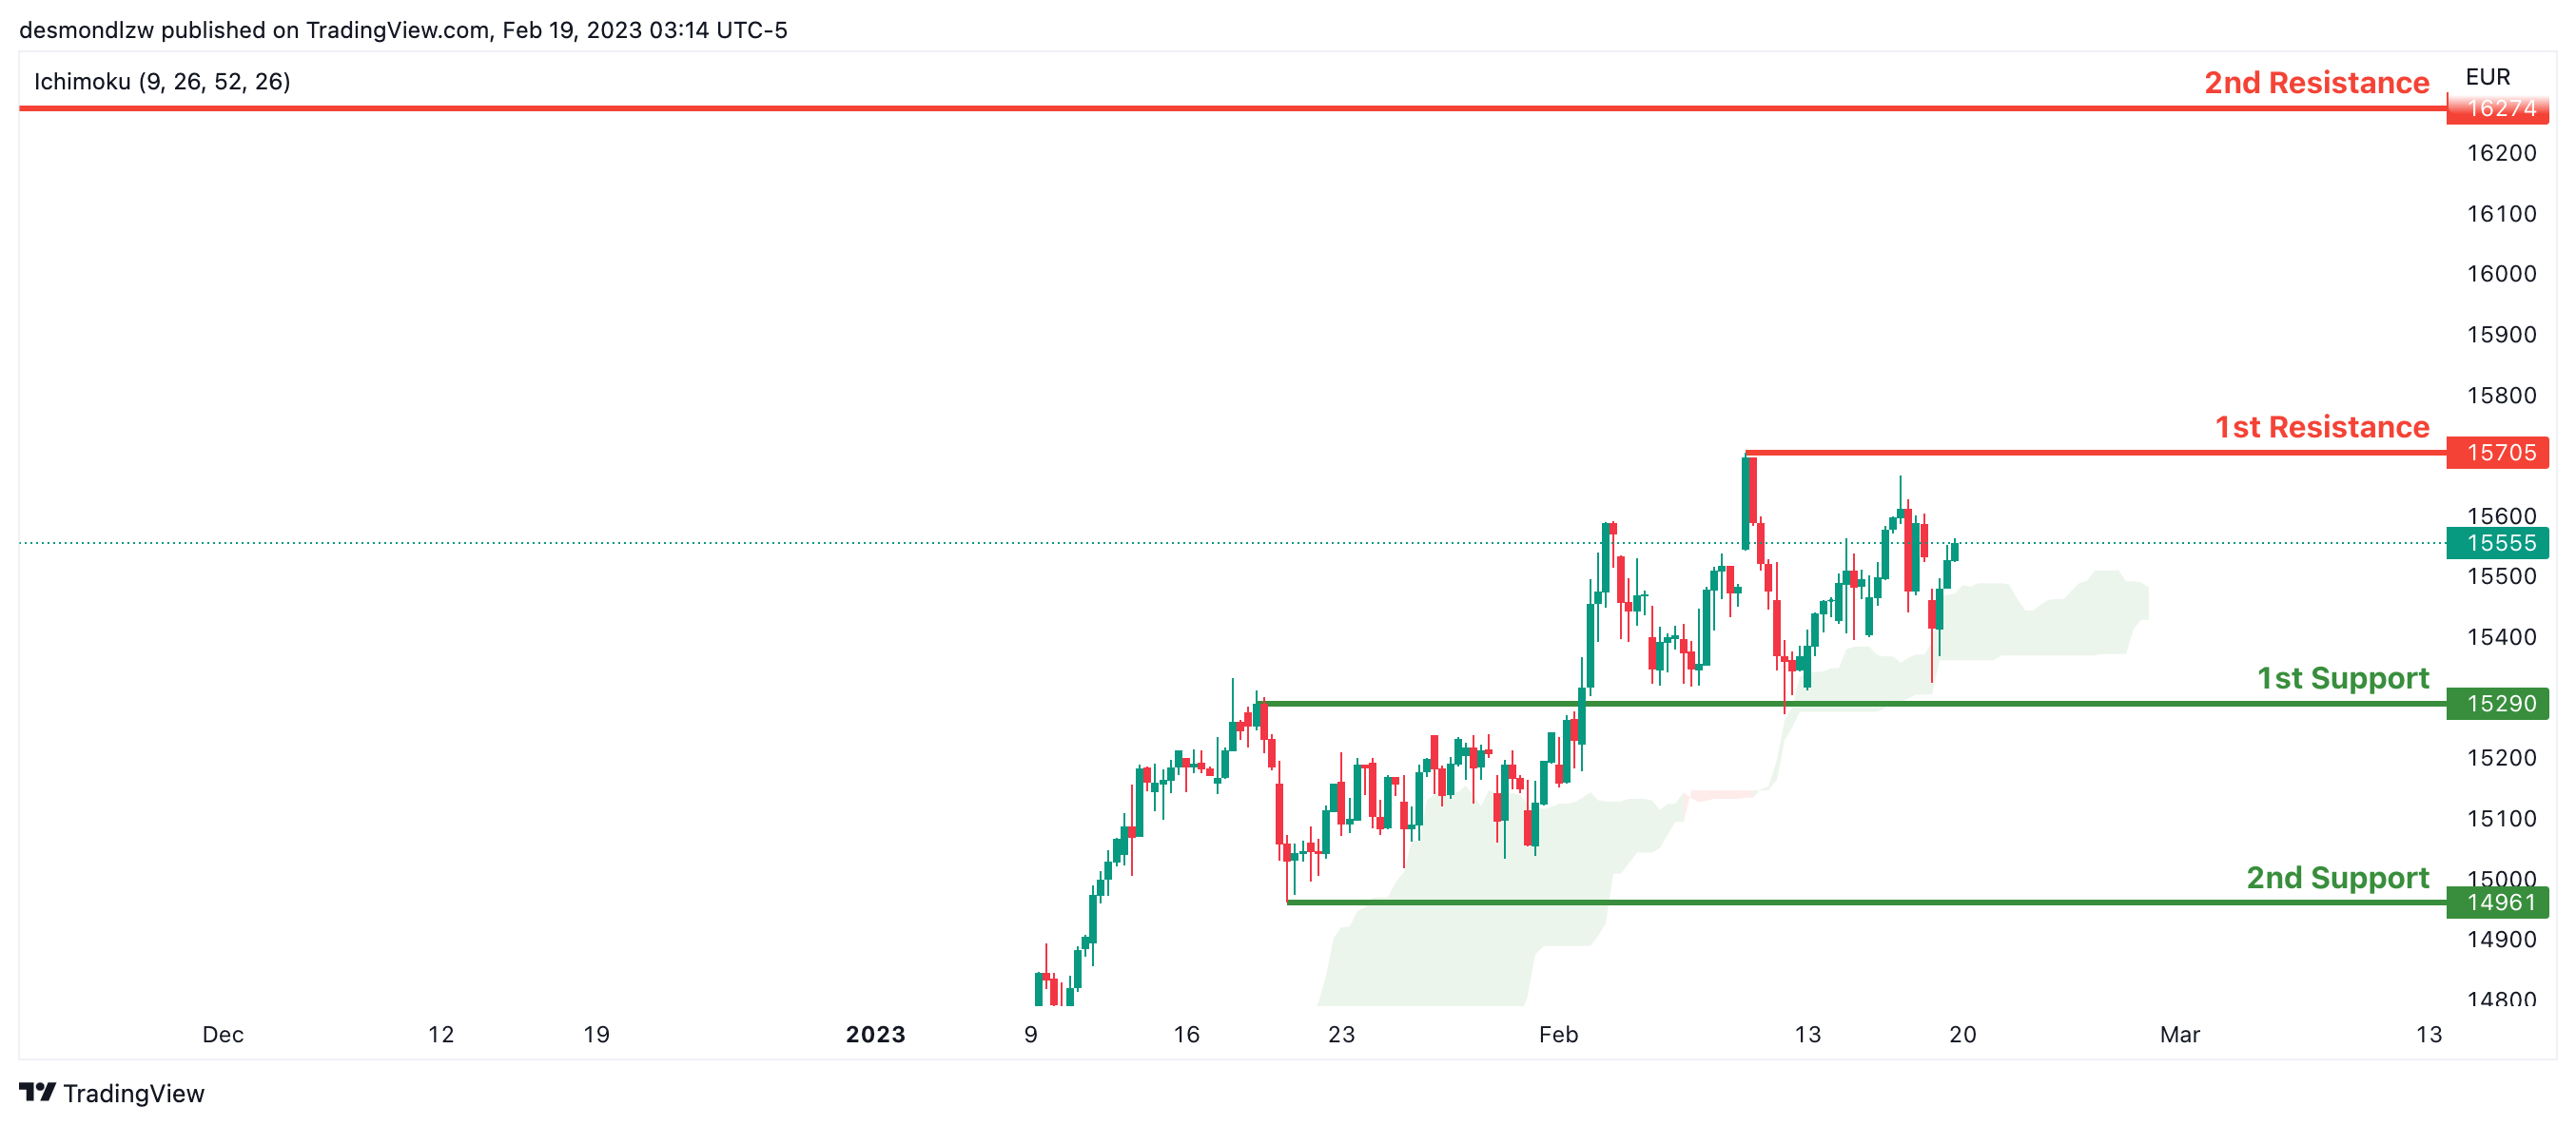
Looking at the H4 chart, my overall bias for DAX is bullish due to the current price crossing above the Ichimoku cloud, indicating a bullish market. If this bullish momentum continues, expect the price to possibly head towards the 1st resistance line at 15705, where the recent high is.
In an alternative scenario, price could possibly head down to retest the 1st support at 15290, where the overlap support is.
Areas of consideration:
- H4 time frame, 1st resistance is at 15705
- H4 time frame, 1st support is at 15290
ETHUSD:
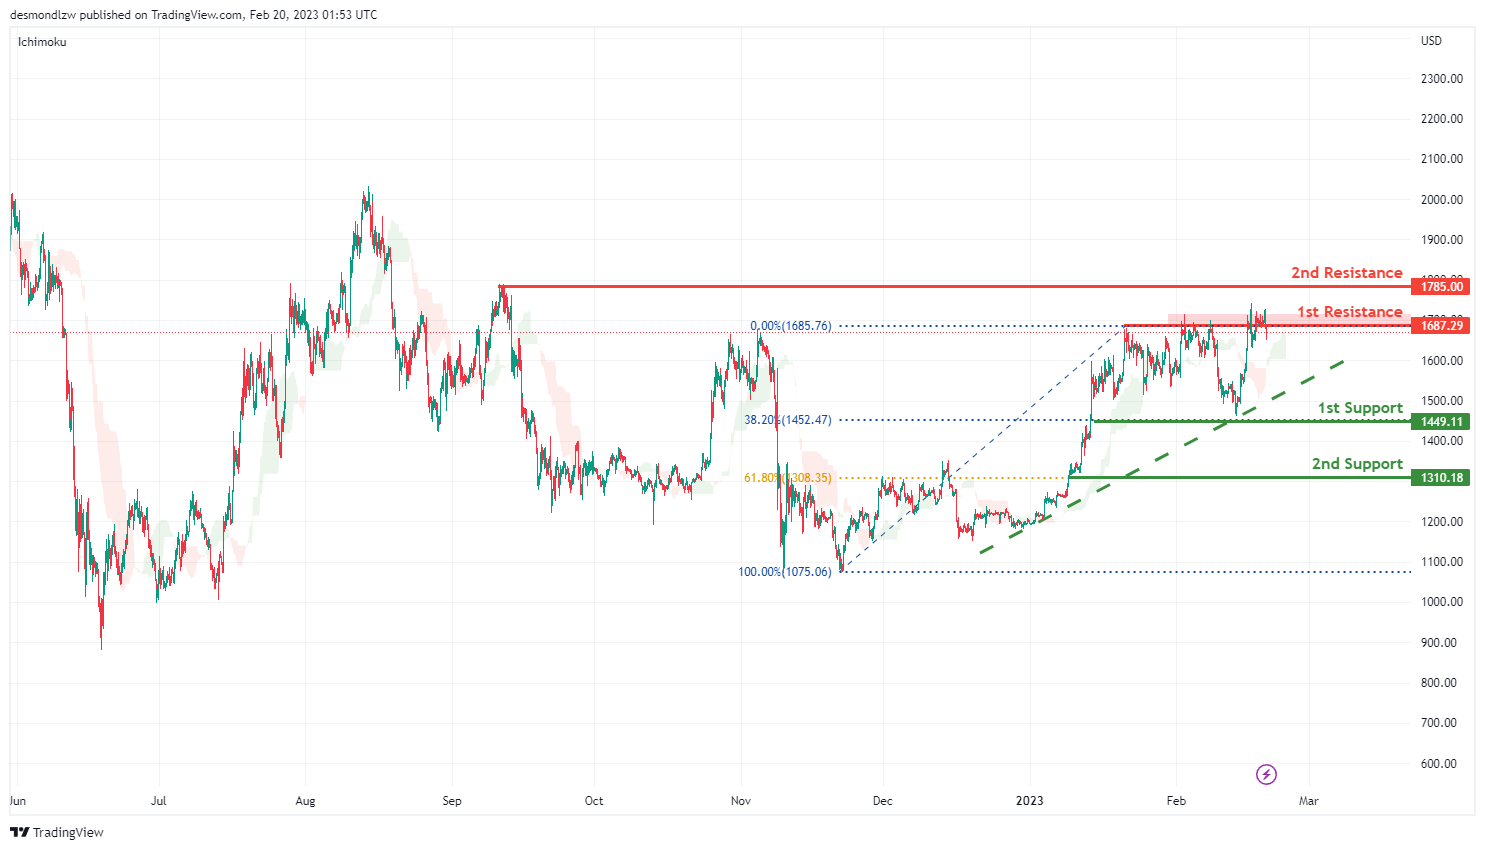
Looking at the H4 chart, my overall bias for ETHUSD is bullish, as there is a strong ascending trend line. The price may go up and break the 1st resistance line at 1685.76 before breaking the 2nd resistance line at 1785.00 which is the previous swing high.
In an alternate scenario, the price may retrace back to the 1st support line at 1449.11 which is in line with 38.2% Fibonacci retracement, before it heads towards the 2nd support at 1310.18 which is in line with 61.8% Fibonacci retracement.
Areas of consideration:
- H4 time frame, 2nd resistance of 1785.00
- H4 time frame, 1st resistance of 1685.76
- H4 time frame, 1st support at 1449.11
- H4 time frame, 2nd support at 1310.18
BTCUSD:
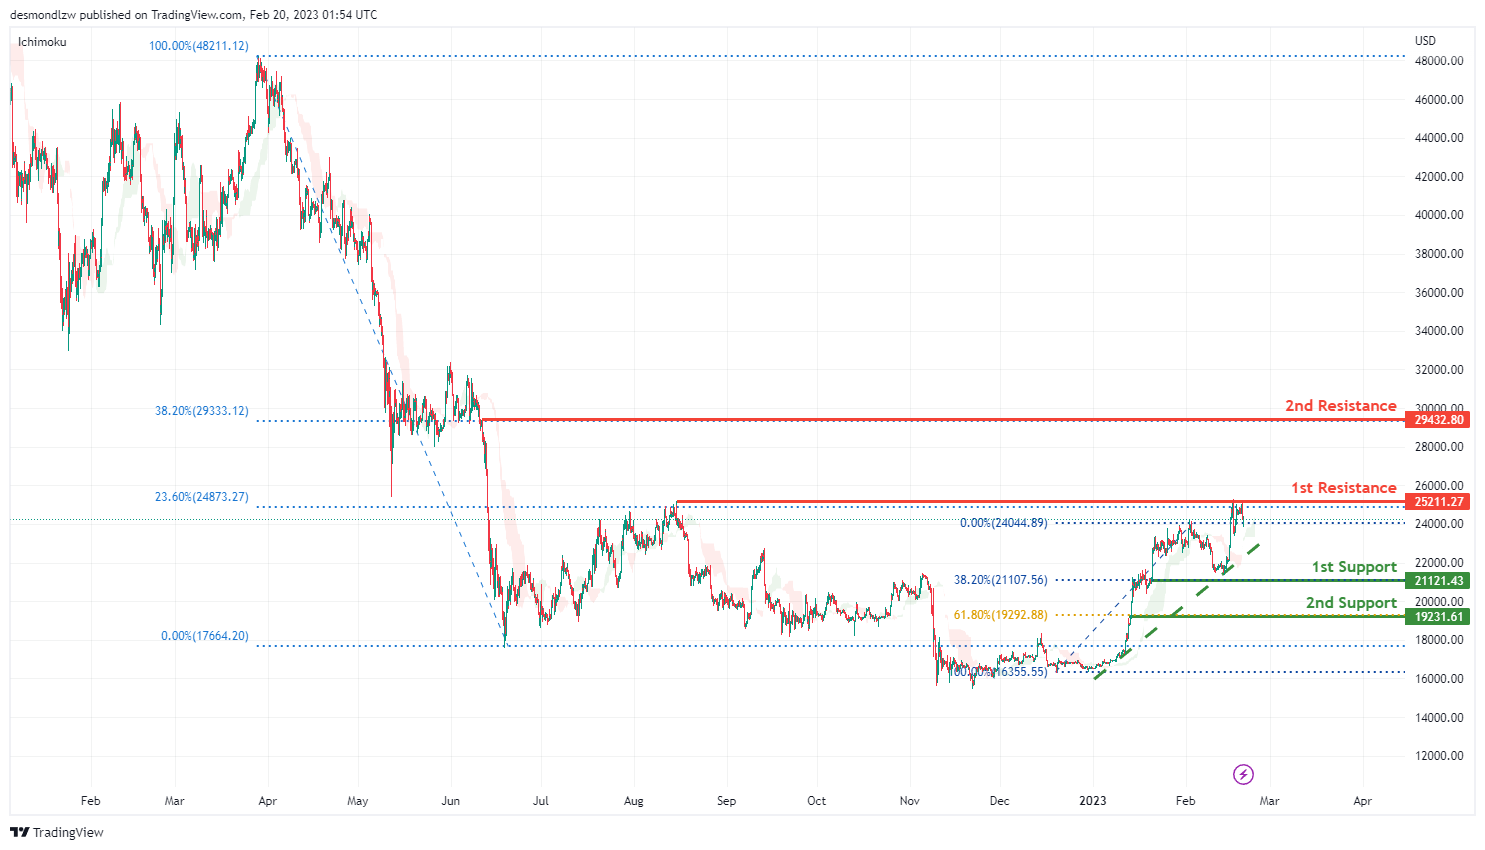
Looking at the H4 chart, my overall bias for BTCUSD is bearish. As there is an ascending trend line, expect the price could possibly head up to the 1st resistance at 25211.27 which is the overlap recent swing high, before it head up to the 2nd resistance 29432.80 where the 38.2% Fibonacci retracemnt is.
The 1st support line at 21121.43 which is in line with 38.2% Fibonacci retracement, before heading down towards the 2nd support at 19231.61 which is in line with 61.8% Fibonacci retracement.
Areas of consideration:
- H4 time frame, 2nd resistance 29432.80
- H4 time frame, 1st resistance 25211.27
- H4 time frame, 1st support at 21121.43
- H4 time frame, 2nd support at 19231.61
S&P 500:
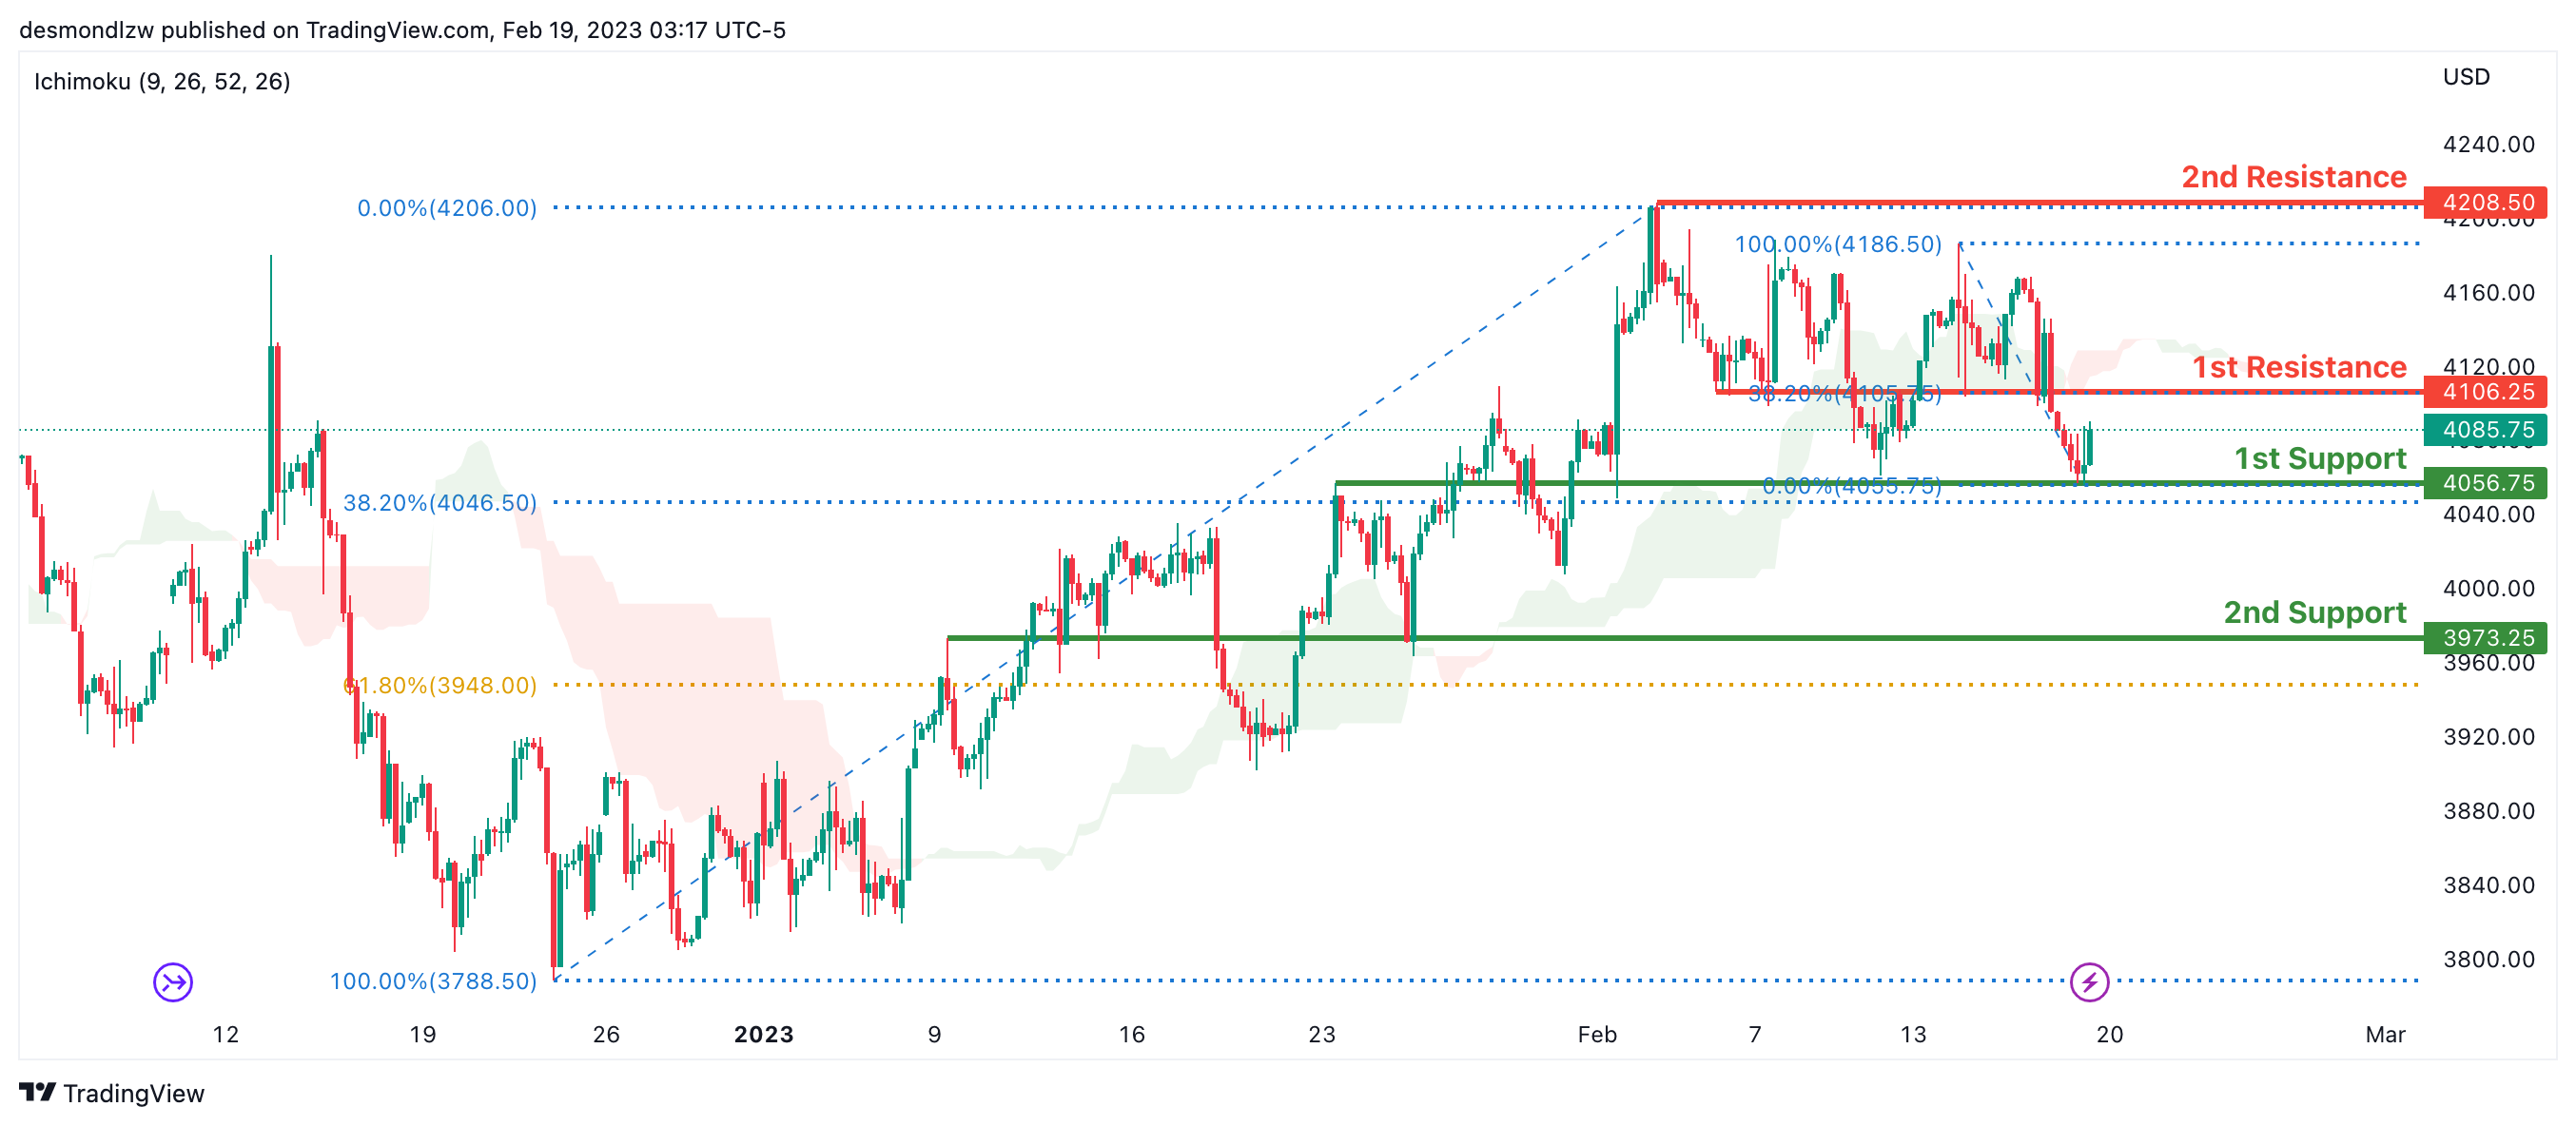
Looking at the H4 chart, my overall bias for S&P500 is bearish due to the current price being below the Ichimoku cloud, indicating a bearish market. If this bearish momentum continues, expect the price to possibly break the 1st support at 4056.75, where the overlap support and 38.2% Fibonacci line is, before heading towards the 2nd support at 3973.25 which is the overlap support and slightly above where the 61.8% Fibonacci line is.
In an alternative scenario, price could possibly head back up to retest the 1st resistance at 4106.25, where the overlap resistance and 38.2% Fibonacci line is.
Areas of consideration:
- H4 time frame, 1st support at 4056.75
- H4 time frame, 2nd support at 3973.25
- H4 time frame, 1st resistance at 4106.25
EUR/USD Recovery Attempt Could Face Hurdles
Key Highlights
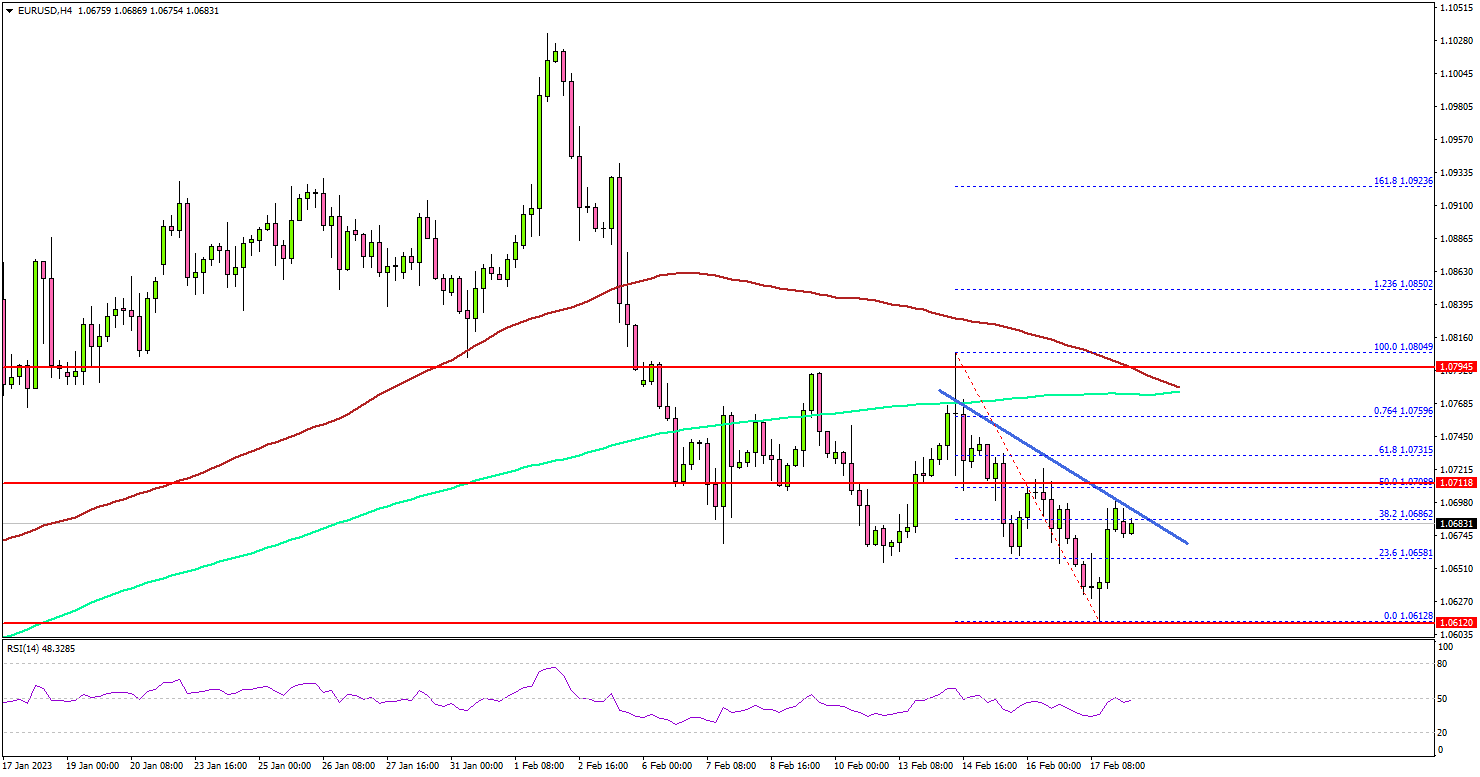
- EUR/USD traded as low as 1.0612 and is currently correcting losses.
- A key bearish trend line is forming with resistance near 1.0685 on the 4-hours chart.
- GBP/USD is struggling below the 1.2120 resistance zone.
- Gold price is attempting an upside break above the $1,840 resistance.
EUR/USD Technical Analysis
The Euro remained in a bearish zone below 1.0800 against the US Dollar. EUR/USD extended its decline below the 1.0700 level to move further into a bearish zone.
Looking at the 4-hours chart, the pair settled below the 1.0700 level, the 100 simple moving average (red, 4-hours), and the 200 simple moving average (green, 4-hours).
There was a clear move below the 1.0650 support zone. The pair traded as low as 1.0612 and is currently correcting losses. There was a minor increase above the 1.0640 and 1.0650 resistance levels.
However, the pair is now facing resistance near the 1.0685 level. There is also a key bearish trend line forming with resistance near 1.0685 on the same chart. The next major resistance is near the 1.0720 level.
A clear move above the 1.0720 resistance might start a steady increase towards the 1.0780 resistance zone. Any more gains could open the doors for a move towards the 1.0800 level, above which the bulls may perhaps aim a move towards the 1.0880 resistance.
On the downside, an immediate support is near the 1.0620 level. The next major support is near the 1.0600 level, below which there is a risk of a move towards the 1.0550.
Looking at GBP/USD, the pair is also trading in a similar fashion and might face a strong resistance near the 1.2120 and 1.2150 levels.
Economic Releases
Euro Zone Consumer Confidence for Feb 2023 (Preliminary) – Forecast -18.3, versus -20.9 previous.
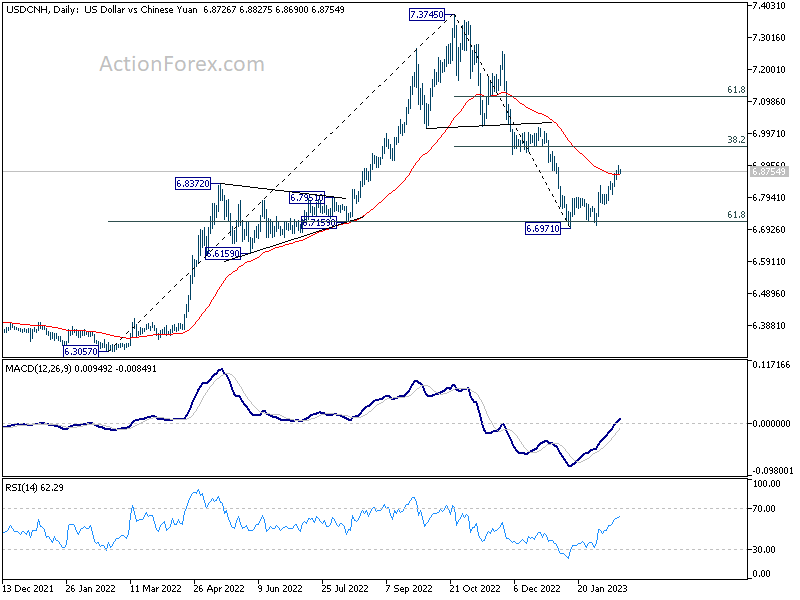
USD/CNH extending rebound towards 6.9559 fibonacci level
Chinese Yuan weakened notably last week as the dispute with US over "spy balloons" continued. The meeting between US Secretary of State Antony Blinken and China's top diplomat Wang Yi in Munich yielded no results.
In a separate statement, China warned "If the U.S. insists on taking advantage of the (spy balloon) issue, escalating the hype, and expanding the situation, China will follow through to the end, and the U.S. will bear all the consequences."
In an interview with NBC, Blinken said "there was no apology" from China. "I told him quite simply that that was unacceptable and can never happen again," he said.
USD/CNH's down leg from 7.3745 should have completed at 6.6971. Further rebound should be seen to 38.2% retracement of 7.3745 to 6.6971 at 6.9559. Reaction from there would reveal whether USD/CNH is heading for another down leg through 6.6971, or stronger rise to 61.8% retracement at 7.1157.