Sample Category Title
Dollar Breaking to the Upside, Europeans Relatively Resilient
Dollar appears to be finally staging a broad based upside breakout today, with help from mild risk aversion. This week's inflation and retail sales data suggested that risk to Fed tightening is more on the upside, and interest rate would at least stay high for longer. For now, Euro is following Dollar as the strongest for the week, then Swiss Franc and Sterling. Yen is the worst performer, followed by commodity currencies.
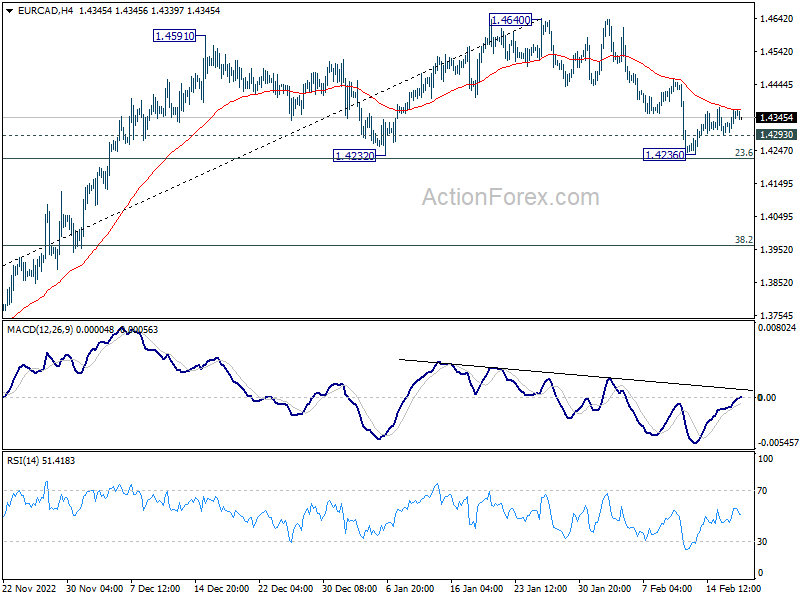
Technically, current development argues that Dollar's strength is going to extend for a while. The question is which currencies would be the main casualties. EUR/CAD's correction from 1.4640 might have completed just ahead of 1.4232 support. Sustained trading above 4 hour 55 EMA (now at 1.4368) could prompt upside acceleration to retest 1.4640 high. However, rejection by 4 hour 55 EMA, followed by break of 1.4293 minor support could resume the decline through 1.4232/6.
In Asia, at the time of writing, Nikkei is down -0.73%. Hong Kong HSI is down -0.72%. China Shanghai SSE is down -0.31%. Singapore Strait Times is up 0.36%. Japan 10-year JGB yield is down -0.0001 at 0.507. Overnight, DOW dropped -1.26%. S&P 500 dropped -1.38%. NASDAQ dropped -1.78%. 10-year yield rose 0.034 to 3.843.
Fed Bullard: Continued policy rate increases can lock in disinflationary trend
St. Louis Fed President James Bullard said yesterday, "I was an advocate for a 50-basis-point hike and I argued that we should get to the level of rates the committee viewed as sufficiently restrictive as soon as we could."
Bullard said "inflation remains too high but has declined," adding that "continued policy rate increases can help lock in a disinflationary trend during 2023, even with ongoing growth and strong labor markets."
BoE Pill: MPC needs to ensure it does either too much or too little
BoE Chief Economist Huw Pill said in a speech yesterday, "recognising that its earlier actions are now gaining traction, the MPC needs to ensure that it does enough to return inflation to target, while guarding against the possibility that it does either too much or – for that matter – too little."
"Finding that balance is the central challenge for monetary policy at present," he said.
Pill also noted, "continuing to raise rates at the pace and magnitude seen over the past year would eventually – and perhaps soon – imply that monetary policy had cumulatively been tightened too much."
Yet, "the MPC's need to be watchful for signs of greater-than-expected persistence in inflationary pressure," he emphasized. "I would flag the need for the Committee to maintain a readiness to act to address any such persistence should it emerge."
On the economy, Pill said Tuesday's labor market data "pointed to signs that the UK labour market loosened a little in the fourth quarter". But, "these indicators suggest the labour market remains tight in an absolute sense relative to historical experience."
CPI data showed inflation fell to 10.1% in January, from 10.5% in December. "On the month, this mainly owed to an easing in services and fuel price inflation, although developments in historically very volatile components such as airfares counted for a large part of the former."
BoC Macklem: Additional monetary tightening if inflation gets stuck above 2% target
BoC Tiff Macklem told a parliament committee yesterday, "we expect CPI inflation to fall to around 3% in the middle of this year and reach the 2% target in 2024."
"For inflation to get back to 2%, the effects of higher interest rates need to work through the economy and restrain spending enough for supply to catch up."
"The tightness in the labour market needs to ease, wage growth needs to moderate, and service price inflation needs to cool."
"Inflation expectations also need to come down and businesses return to more normal pricing behaviour."
"If those things don't happen, inflation will get stuck above our 2% target, and additional monetary tightening will be required."
RBA Lowe: We need to make clear to the community we were not done yet
In the second parliamentary grilling today, RBA Governor Philip Lowe said, "based on the currently available information, the board expect that further increases will be needed over the months ahead to ensure that inflation returns to target."
"Given there is a significant demand element to inflation, we need to respond to that with further monetary policy and we need to make that clear to the community that we were not done yet," Lowe said.
"The RBA and many other central banks are managing two risks," he said. "One is the risk of not doing enough, which would result in high inflation persisting and then later proving very costly to get down. The other is the risk that we move too fast, or too far."
Looking ahead
UK retail sales is the main focus today. Eurozone current account, Canada IPPI and RMPI, and US import price index will be released too.
AUD/USD Daily Report
Daily Pivots: (S1) 0.6835; (P) 0.6885; (R1) 0.6930; More...
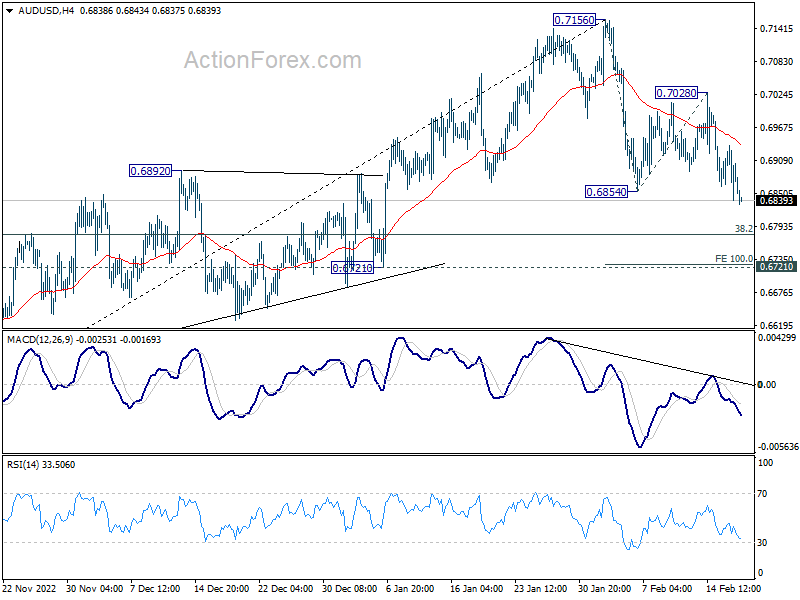
AUD/USD's break of 0.6854 support confirms resumption of corrective decline from 0.7156. Intraday bias is back on the downside. Next target is 100% projection of 0.6854 to 0.7028 from 0.6854 at 0.6736, which is close to 0.6721 key structural support. Strong support is expected there to bring rebound. But still, break of 0.7028 resistance is needed to confirm completion of the correction. Otherwise, further fall is in favor in case of recovery.
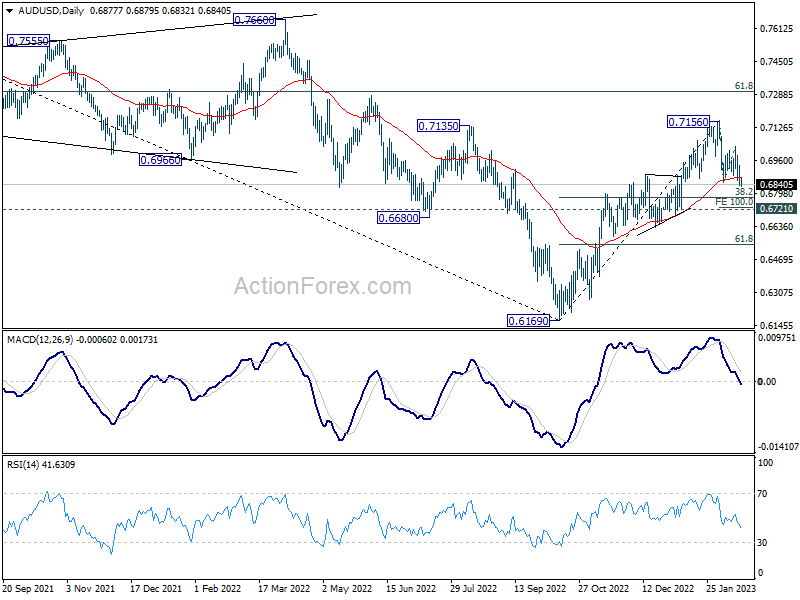
In the bigger picture, corrective decline from 0.8006 (2021 high) should have completed with three waves down to 0.6169 (2022 low). Further rally should be seen to 61.8% retracement of 0.8006 to 0.6169 at 0.7304. Sustained break there will pave the way to retest 0.8006. This will now remain the favored case as long as 0.6721 support holds.
Economic Indicators Update
| GMT | Ccy | Events | Actual | Forecast | Previous | Revised |
|---|---|---|---|---|---|---|
| 07:00 | GBP | Retail Sales M/M Jan | -0.20% | -1.00% | ||
| 07:00 | GBP | Retail Sales Y/Y Jan | 1.80% | -5.80% | ||
| 07:00 | GBP | Retail Sales ex-Fuel M/M Jan | 0.00% | -1.10% | ||
| 07:00 | GBP | Retail Sales ex-Fuel Y/Y Jan | -4.40% | -6.10% | ||
| 09:00 | EUR | Eurozone Current Account (EUR) Dec | 5.1B | 13.6B | ||
| 13:30 | CAD | Industrial Product Price M/M Jan | -0.10% | -1.10% | ||
| 13:30 | CAD | Raw Material Price Index Jan | -0.20% | -3.10% | ||
| 13:30 | USD | Import Price Index M/M Jan | -0.10% | 0.40% |
Technical Outlook and Review
USD/JPY:
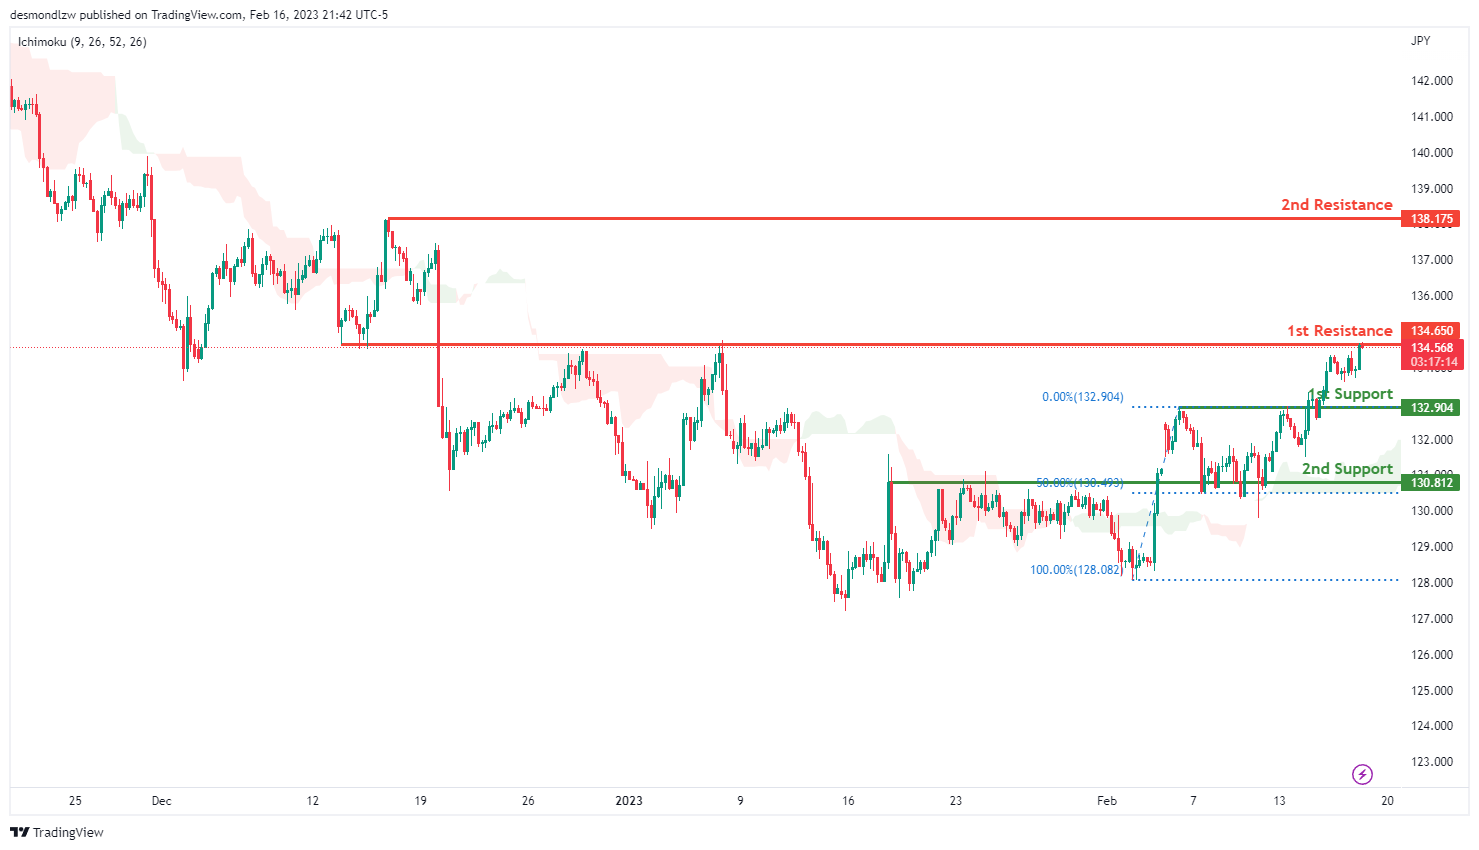
Looking at the H4 chart, my overall bias for USDJPY is bullish due to the current price crossing above the Ichimoku cloud, indicating a bullish market. If this bullish momentum continues, expect the price to possibly continue heading towards the 1st resistance at 134.650, where the overlap resistance is. In an alternate scenario, price could possibly head back down to retest the 1st support at 132.904, where the overlap support is.
Areas of consideration:
- H4 time frame, 1st resistance at 134.650
- H4 time frame, 1st support at 132.904
DXY:
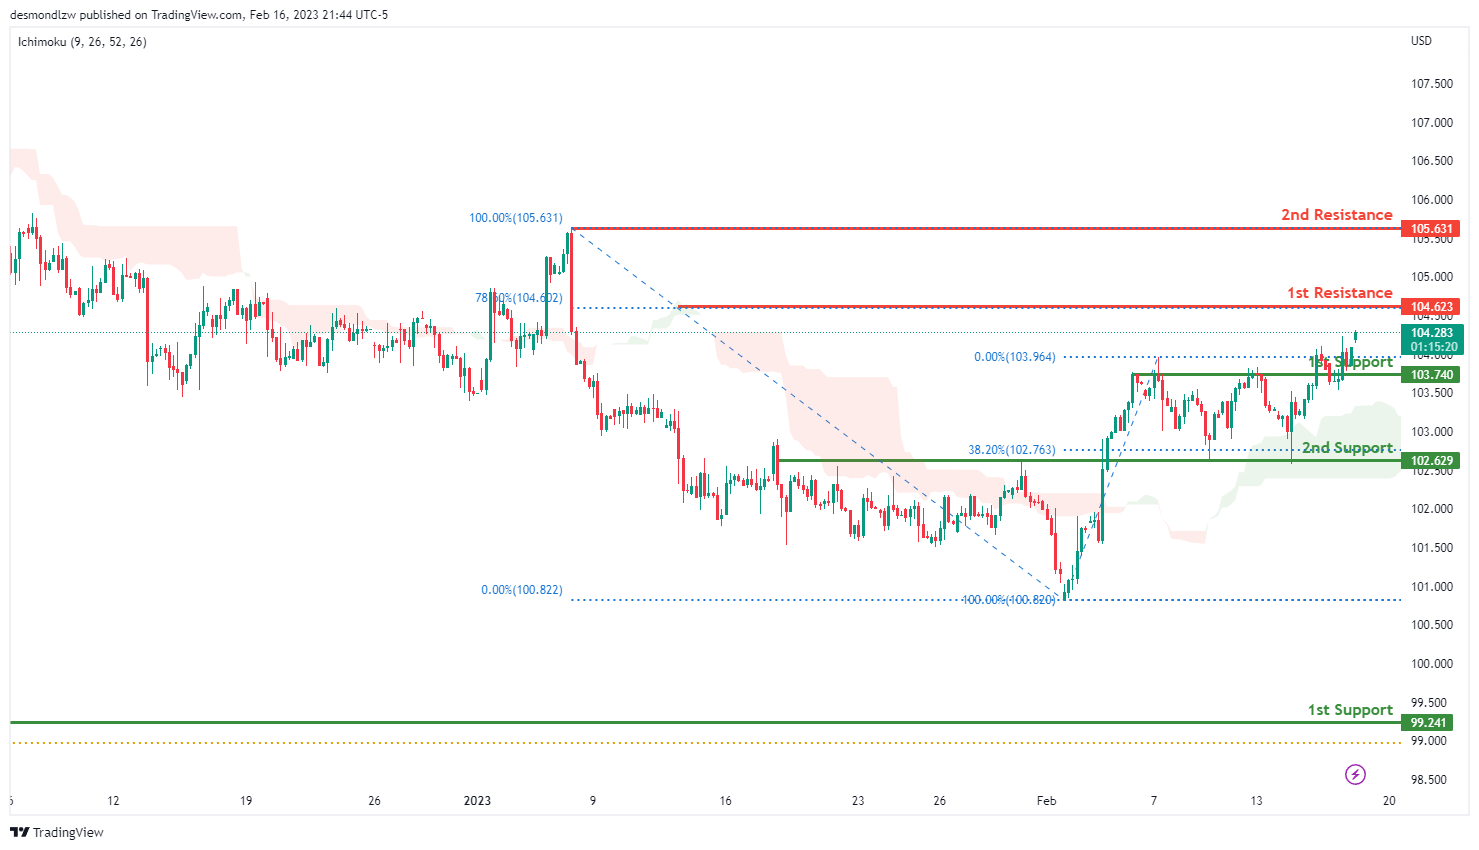
Looking at the H4 chart, my overall bias for DXY is bullish due to the current price crossing above the Ichimoku cloud, indicating a bullish market. If this bullish momentum continues, expect the price to possibly continue heading towards the 1st resistance at 104.623, where the 78.6% Fibonacci line is.
In an alternative scenario, price could head back down to retest the 1st support at 103.740, where the overlap support is.
Areas of consideration:
- H4 time frame, 1st resistance at 104.110
- H4 time frame, 1st support at 103.740
EUR/USD:
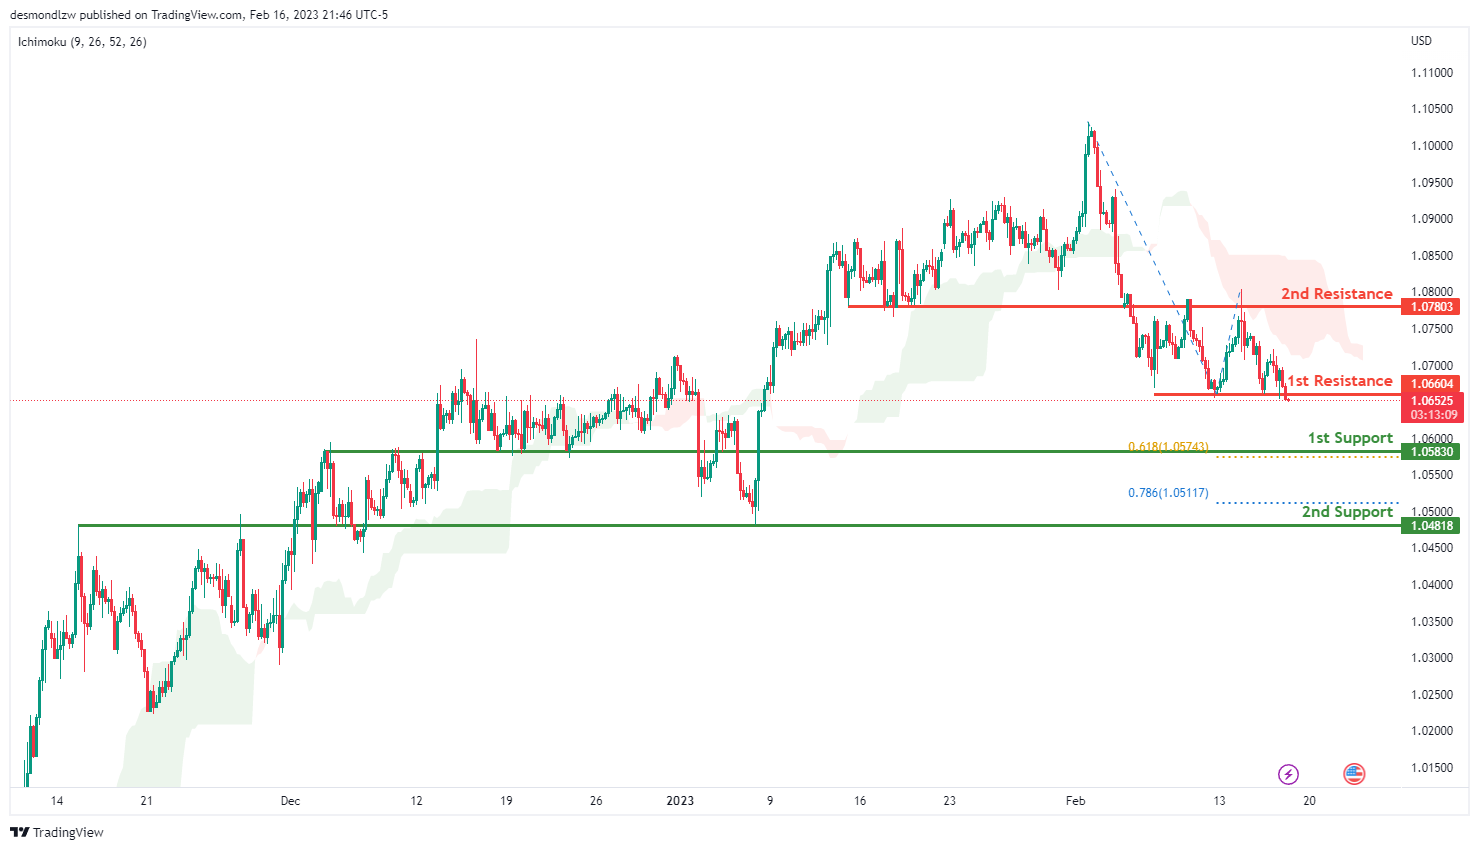
Looking at the H4 chart, my overall bias for EURUSD is bearish due to the current price crossing below the Ichimoku cloud, indicating a bearish market structure. If this bearish momentum continues, expect the price to possibly continue heading towards the 1st support at 1.05830, where the overlap support and 61.8% Fibonacci projection line is.
In an alternate scenario, price could possibly head back up to retest the 1st resistance at 1.06604, where the overlap resistance is.
Areas of consideration :
- H4 1st resistance at 1.06952
- H4 1st support at 1.05830
GBP/USD:
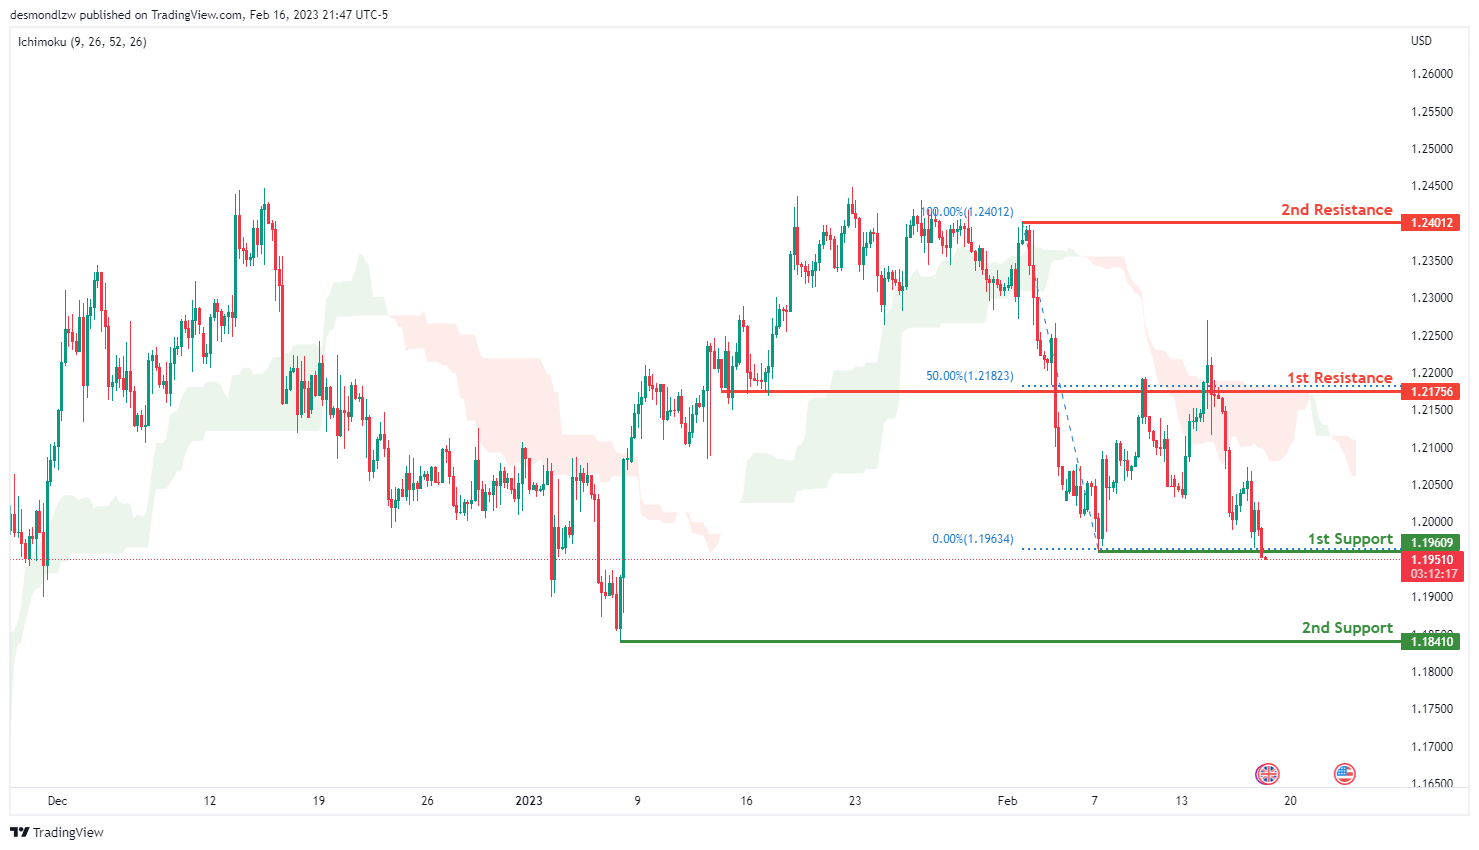
Looking at the H4 chart, my overall bias for GBPUSD is bearish due to the current price crossing below the Ichimoku cloud, indicating a bearish market. If this bearish momentum continues, expect the price to possibly to break the 1st support at 1.19609, where the recent swing low is.
In an alternate scenario, price could head back up to retest the 1st resistance line at 1.21756 where the overlap resistance and 50% Fibonacci line is.
Areas of consideration:
- H4 1st resistance at 1.21756
- H4 1st support at 1.19609
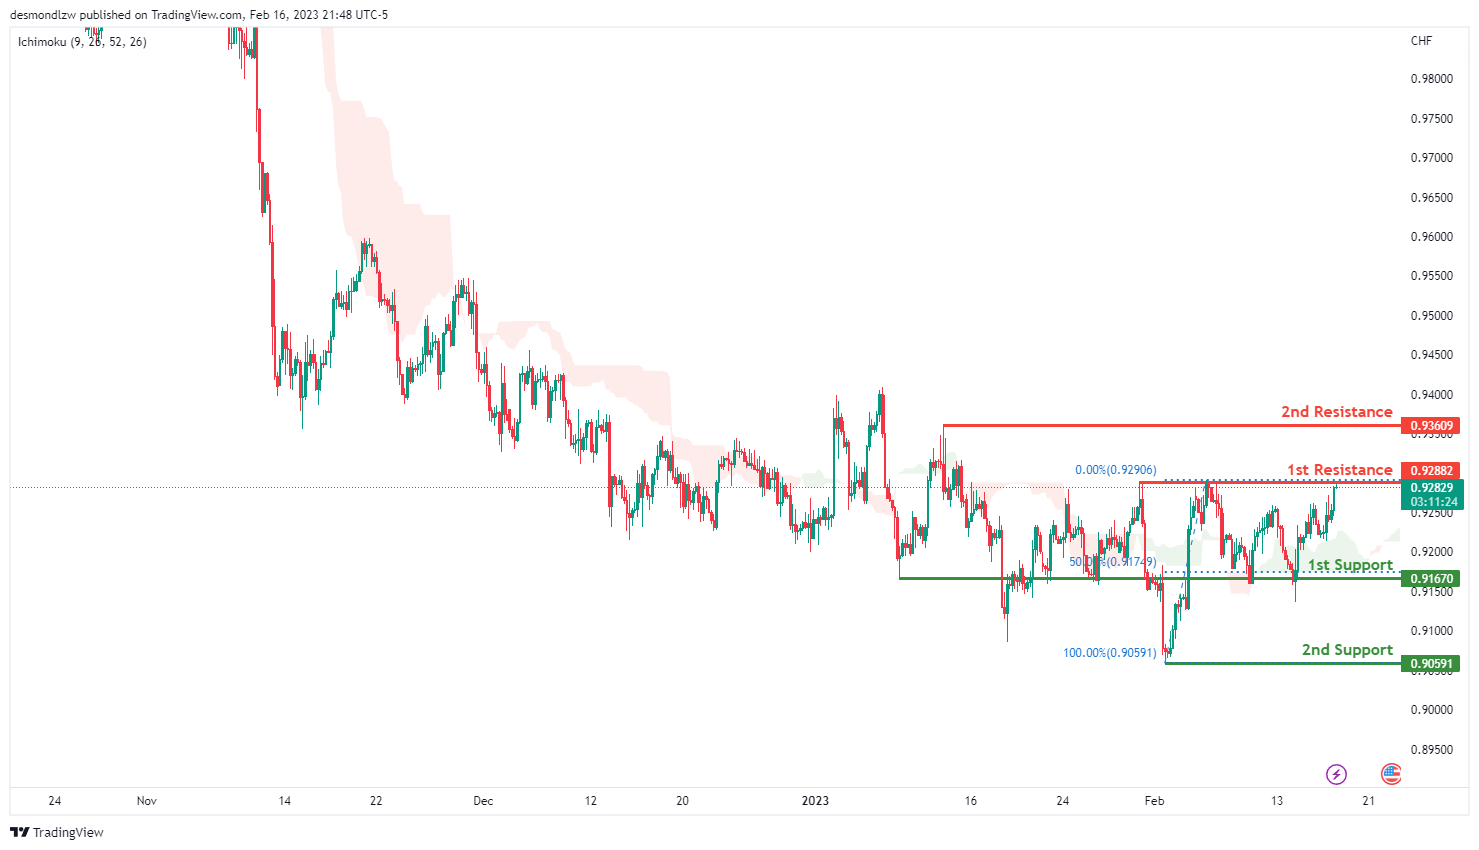
USD/CHF:
Looking at the H4 chart, my overall bias for USDCHF is bullish due to the current price being above the Ichimoku cloud, indicating a bullish market. If the current bullish trend continues, expect the price to possibly break the 1st resistance at 0.92882, where the previous swing high is, before heading towards the 2nd resistance at 0.93609 where the intermediate high is.
In an alternative scenario, price could possibly head back down to retest the 1st support at 0.90591, where the recent swing low and 50% Fibonacci line is.
Areas of consideration
- H4 1st support at 0.90591
- H4 1st resistance at 0.92882
- H4 2nd resistance at 0.93609
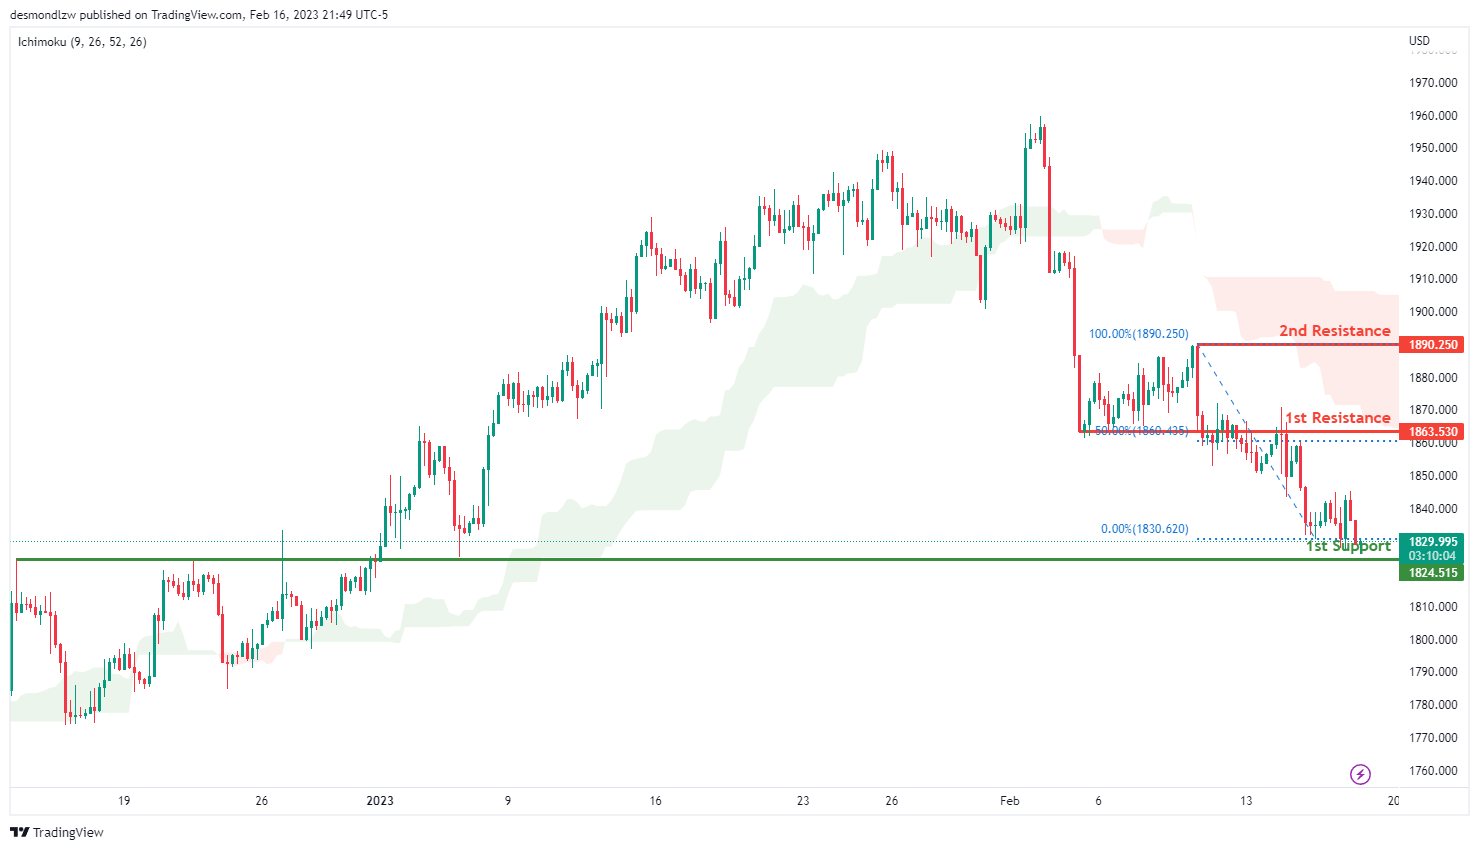
XAU/USD (GOLD):
Looking at the H4 chart, my overall bias for XAUUSD is bearish due to the current price being below the Ichimoku cloud, indicating a bearish market. If this bearish momentum continues, expect the price to possibly continue heading towards the 1st support at 1824.515 where the overlap support and -61.8% Fibonacci expansion line is.
In an alternative scenario, price could possibly head back up to retest the 1st resistance at 1863.530, where the previous swing low and 50% Fibonacci line is.
Areas of consideration:
- H4 time frame, 1st resistance at 1863.530
- H4 time frame, 1st support at 1824.515
AUD/USD:
Looking at the H4 chart, my overall bias for AUDUSD is bearish due to the current price being below the Ichimoku cloud, and the ascending trend line has been broken, indicating a change of market structure.
The 1st support is at 0.68479 which is the overlap support and in line with the 50% Fibonacci retracement. The 2nd support is at 0.65831 which is the recent swing low.
In an alternate scenario, the price could possibly go back up towards the 1st resistance level at 0.70132 which is the recent swing high and in line with the 23.6% Fibonacci retracement. There is 2nd resistance at 0.71363 which is the previous swing high.
Areas of consideration
- H4. 2nd resistance at 0.71363
- H4. 1st resistance at 0.70132
- H4, 1st support at 0.68479
- H4, 2nd support at 0.65831

NZD/USD:
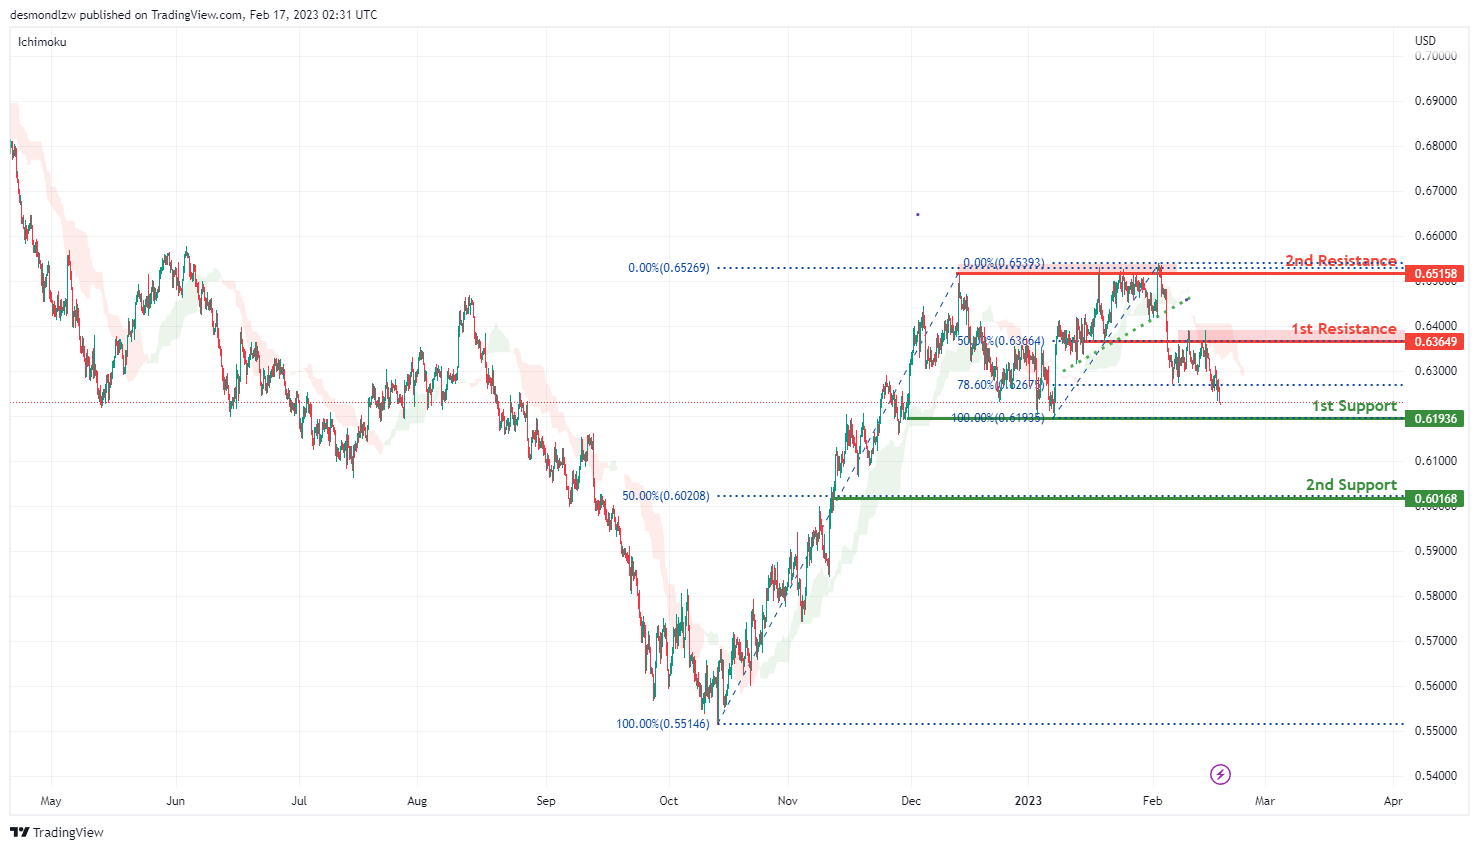
Looking at the H4 chart, my overall bias for NZDUSD is bearish, as the current price is below the Ichimoku Cloud, and the ascending trend line has been broken, indicating a change of market structure. Expecting the price to go down towards the 1st support at 0.61936 which is the overlap swing low. The 2nd support is at 0.60168 where the 50% Fibonacci line is.
In an alternate scenario, price could possibly go up towards the 1st resistance level at 0.63649 which is the recent overlap swing high and in line with 50% Fibonacci retracement. There is a 2nd resistance at 0.65158.
Areas of consideration:
- H4 time frame, 2nd resistance at 0.65158
- H4 time frame, 1st resistance at 0.63649
- H4 time frame, 1st support at 0.61936
- H4 time frame, 2nd support at 0.60168
USD/CAD:
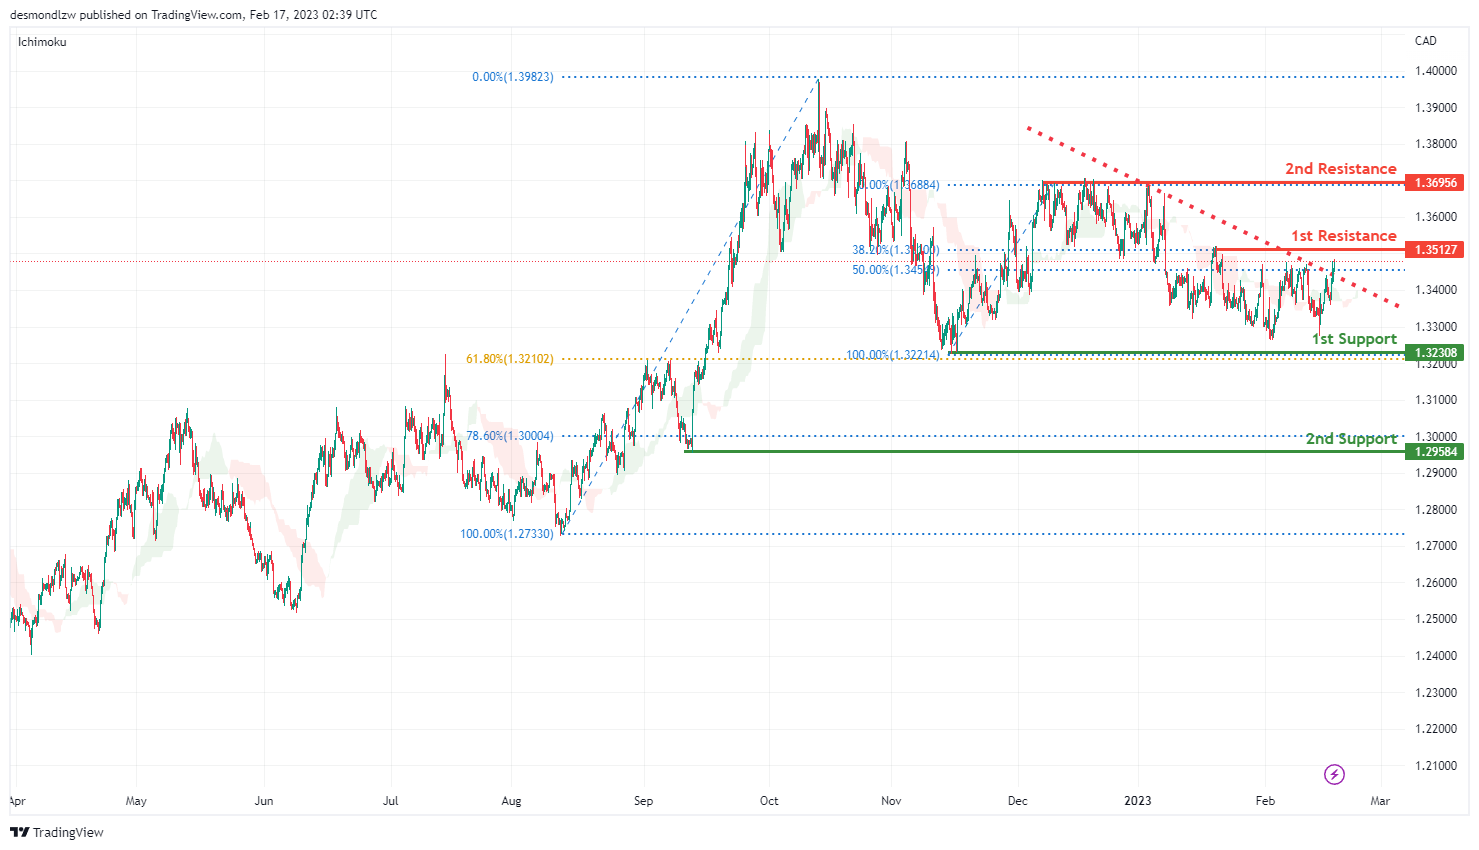
Looking at the H4 chart, my overall bias for USDCAD is slightly bullish , as there is a ascending trend line has bene broken. Expecting the current price is head up towards the 1st resistance at 1.35127 which is the recent swing high and in line with 38.2% Fibonacci retracement. The 2nd resistance is at 1.36933 which is the previous swing high.
In an alternative scenario, the price could possibly down to the 1st support at 1.32308 which is the previous swing low and also in line with the 61.8% Fibonacci retracement. The 2nd support is at 1.29584 where the 78.6% Fibonacci line is .
Areas of consideration:
- H4 time frame, 2nd resistance at 1.36933
- H4 time frame, 1st resistance at 1.35127
- H4 time frame, 1st support at 1.32308
- H4 time frame, 2nd support at 1.29584
OIL:
Looking at the H4 chart, my overall bias for BOC is bullish.as the current price is above the Ichimoku cloud, Expecting the price head up towards the 1st resistance level at 88.598 which is the recent swing high.
In an alternate scenario, the price could possibly head down towards the 1st support level at 79.222 which is the recent overlap swing low, before the price drops to the 2nd support at 75.827.
Areas of consideration:
- H4 time frame, 1st resistance at 88.598
- H4 time frame,1st support at 79.587
- H4 time frame, 2nd support at 75.827

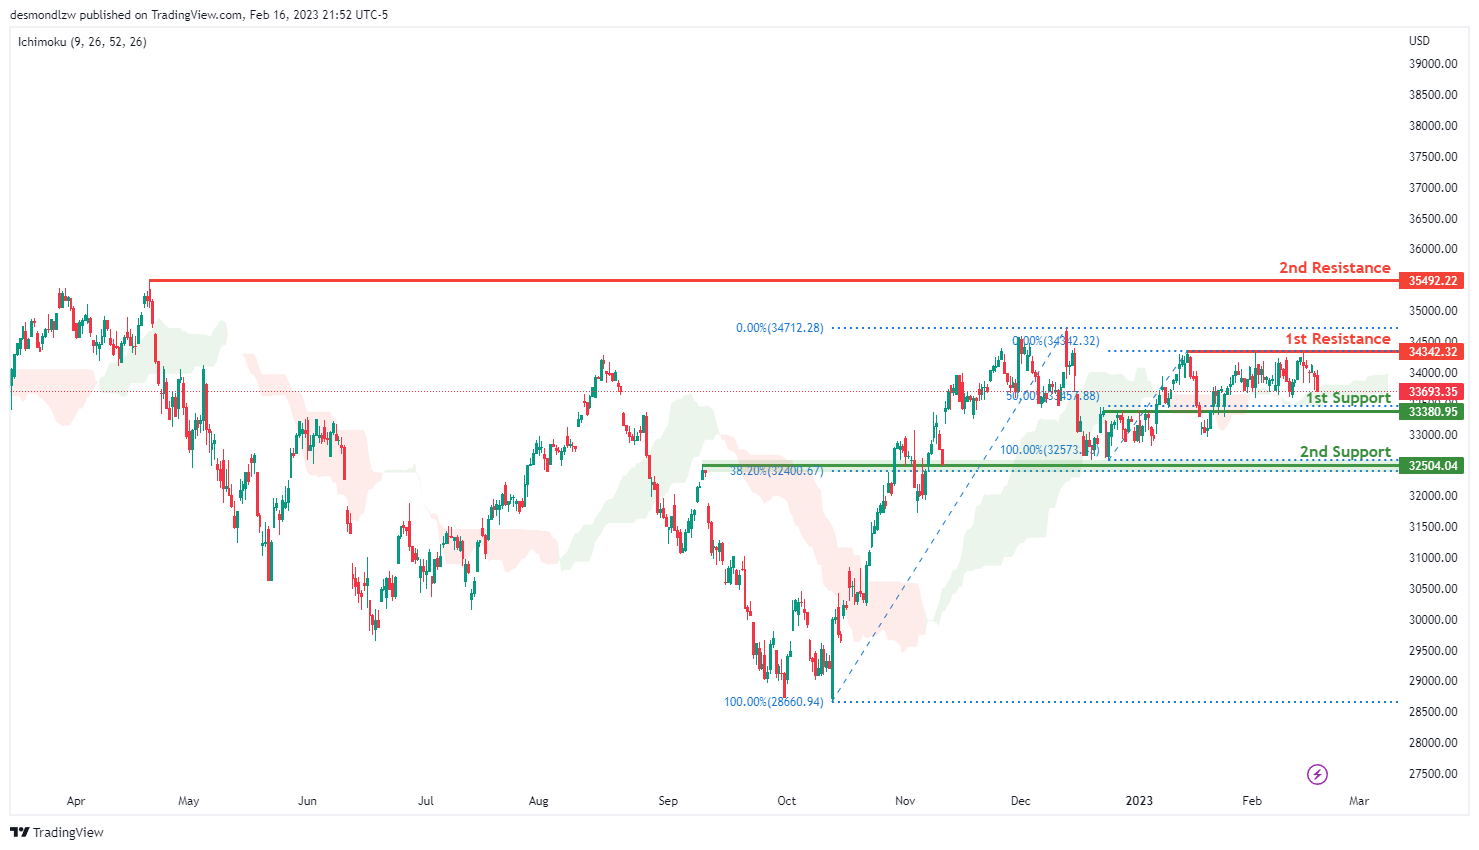
Dow Jones Industrial Average:
On the H4 chart, the overall bias for DJI is bullish. To add confluence to this, the price is crossing above the Ichimoku cloud which indicates a bullish market. If this bullish momentum continues, expect the price to possibly continue heading towards the 1st resistance line at 34342.32, where the recent swing high is.
In an alternative scenario, price could possibly head back down towards the 1st support at 33380.95, where the 50% Fibonacci line is.
Areas of consideration:
- H4 time frame, 1st support at 33380.95
- H4 time frame, 1st Resistance at 34342.32
DAX:
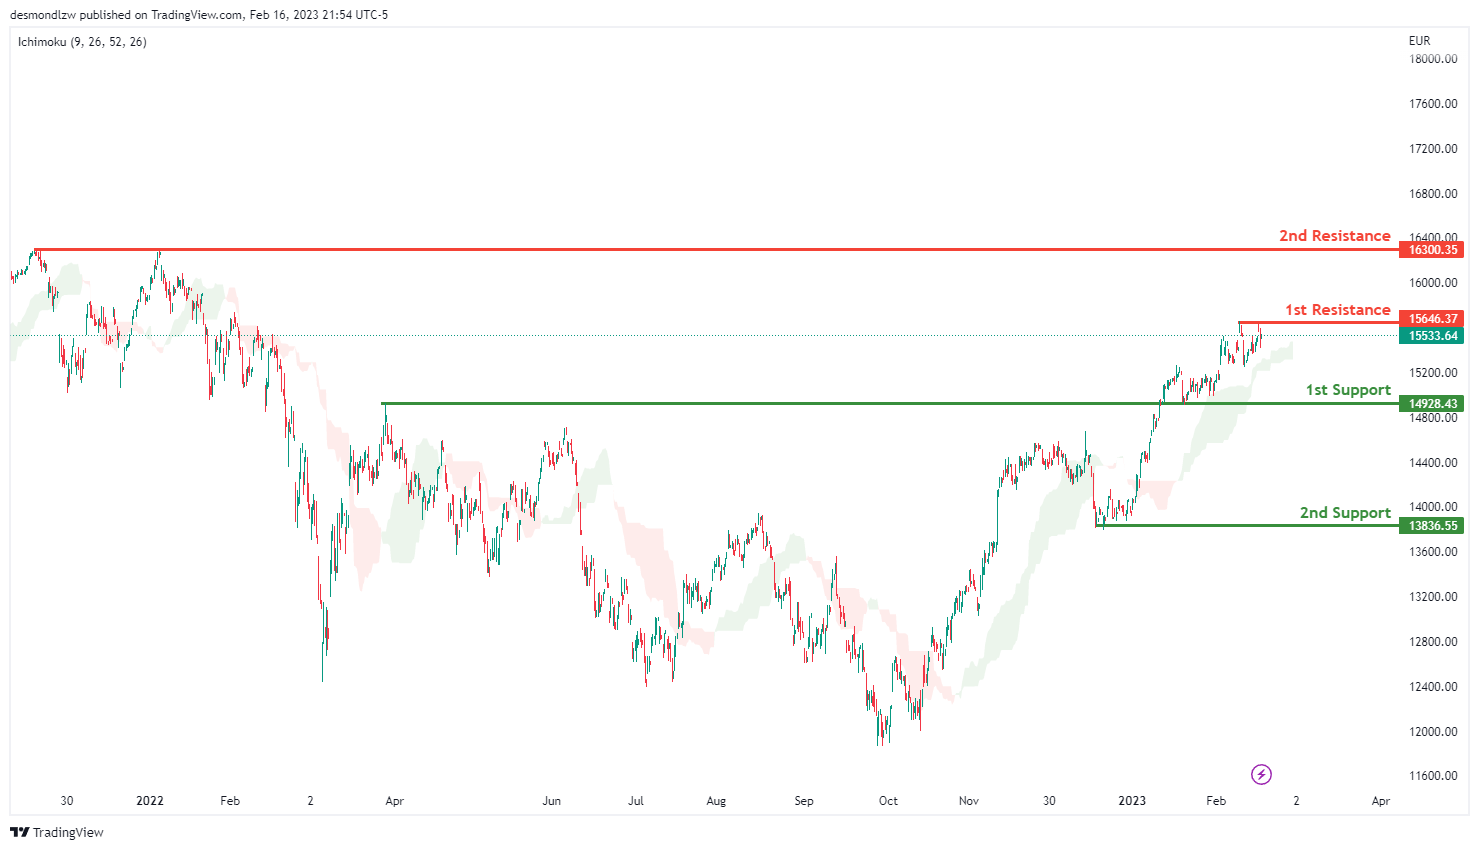
Looking at the H4 chart, my overall bias for DAX is bullish due to the current price crossing above the Ichimoku cloud, indicating a bullish market. If this bullish momentum continues, expect the price to possibly head towards the 1st resistance line at 15646.37, where the recent high is.
In an alternative scenario, price could possibly head down to retest the 1st support at 14928.43, where the overlap support is.
Areas of consideration:
- H4 time frame, 1st resistance is at 15646.37
- H4 time frame, 1st support is at 14928.43
ETHUSD:
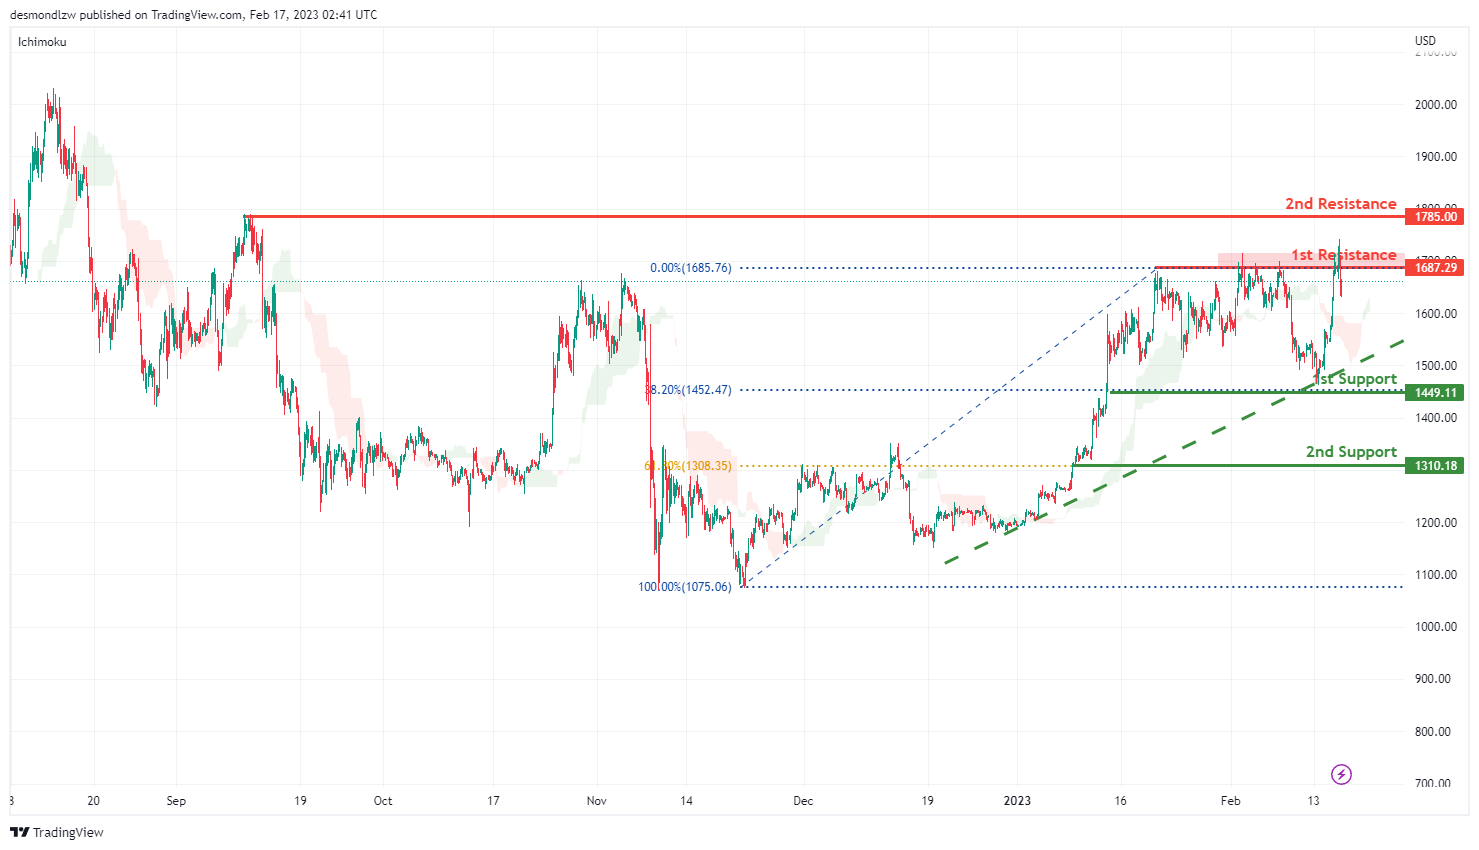
Looking at the H4 chart, my overall bias for ETHUSD is bullish, as there is a strong ascending trend line. The price may go up and break the 1st resistance line at 1685.76 before breaking the 2nd resistance line at 1785.00 which is the previous swing high.
In an alternate scenario, the price may retrace back to the 1st support line at 1449.11 which is in line with 38.2% Fibonacci retracement, before it heads towards the 2nd support at 1310.18 which is in line with 61.8% Fibonacci retracement.
Areas of consideration:
- H4 time frame, 2nd resistance of 1785.00
- H4 time frame, 1st resistance of 1685.76
- H4 time frame, 1st support at 1449.11
- H4 time frame, 2nd support at 1310.18
BTCUSD:
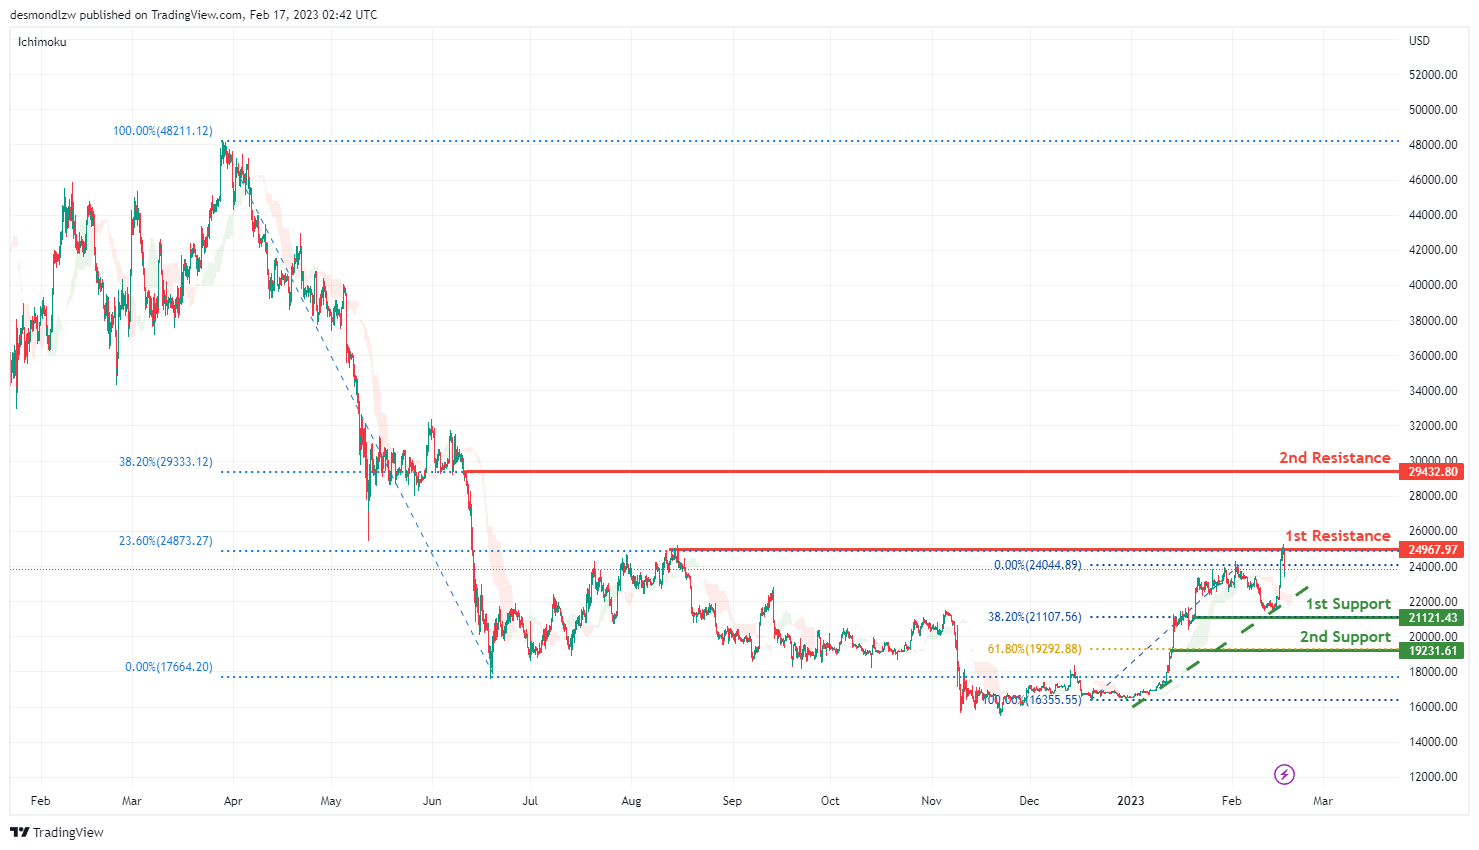
Looking at the H4 chart, my overall bias for BTCUSD is bearish. As there is an ascending trend line, expecting the price could possibly head up to the 1st resistance at 24234.83 which is the previous swing high, before it head up to the 2nd resistance 29432.80 where the 38.2% Fibonacci retracemnt is.
The 1st support line at 21121.43 which is in line with 38.2% Fibonacci retracement, before heading down towards the 2nd support at 19231.61 which is in line with 61.8% Fibonacci retracement.
Areas of consideration:
- H4 time frame, 2nd resistance 29432.80
- H4 time frame, 1st resistance 24234.83
- H4 time frame, 1st support at 21121.4321121.43
- H4 time frame, 2nd support at 19231.61
S&P 500:
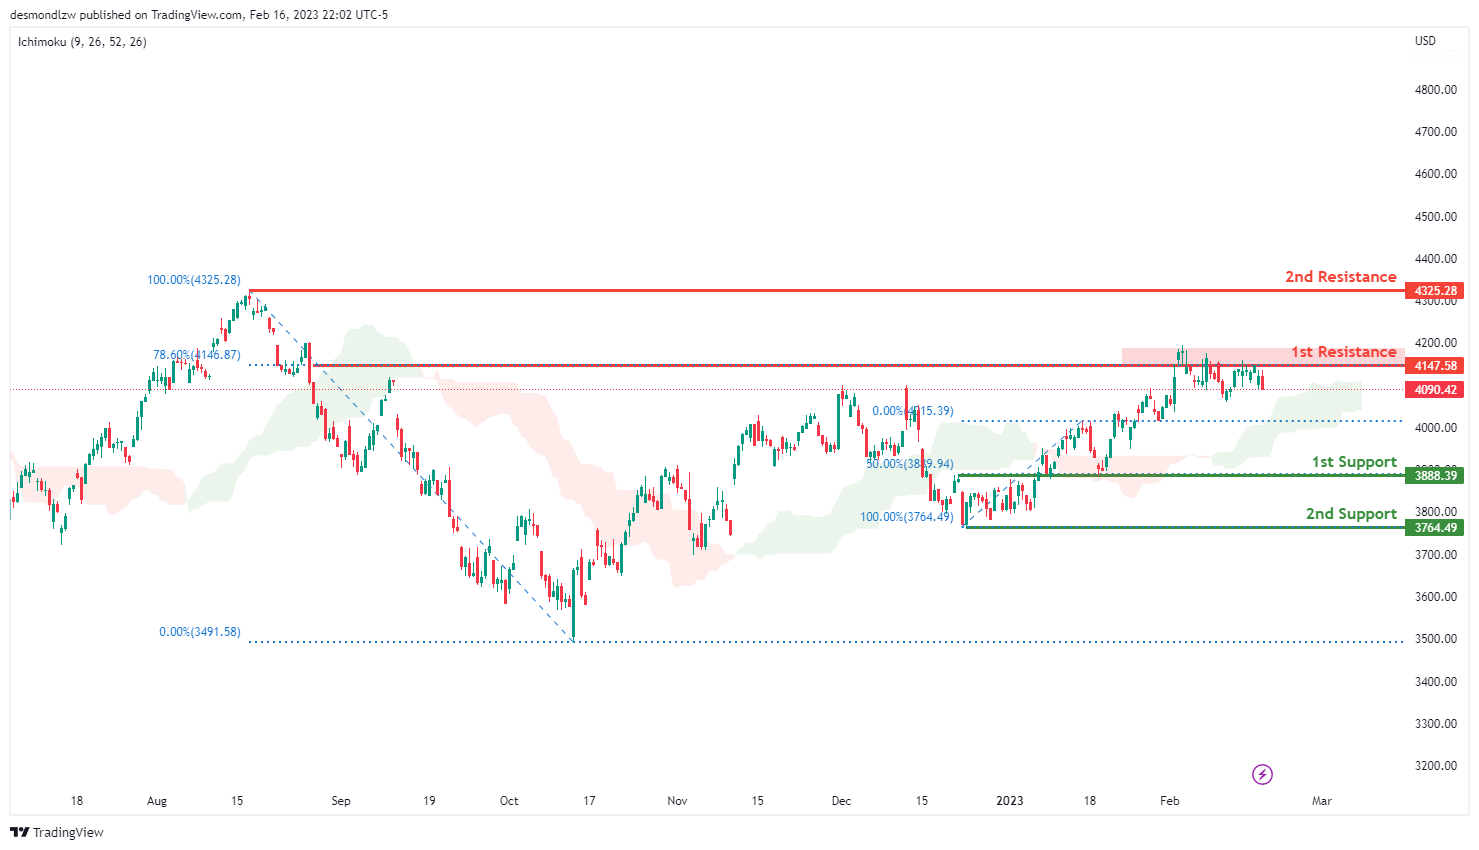
Looking at the H4 chart, my overall bias for S&P500 is bullish due to the current price being above the Ichimoku cloud, indicating a bullish market. If this bullish momentum continues, expect the price to possibly break the 1st resistance at 4147.58, where the 78.6% Fibonacci line is, before heading towards the 2nd resistance at 4325.28 where the previous swing high is.
In an alternative scenario, price could possibly head back down to retest the 1st support at 3888.39, where the 50% Fibonacci line is.
Areas of consideration:
- H4 time frame, 1st support at 3888.39
- H4 time frame, 1st resistance at 4147.58
- H4 time frame, 2nd resistance at 4325.28
RBA Lowe: We need to make clear to the community we were not done yet
In the second parliamentary grilling today, RBA Governor Philip Lowe said, "based on the currently available information, the board expect that further increases will be needed over the months ahead to ensure that inflation returns to target."
"Given there is a significant demand element to inflation, we need to respond to that with further monetary policy and we need to make that clear to the community that we were not done yet," Lowe said.
"The RBA and many other central banks are managing two risks," he said. "One is the risk of not doing enough, which would result in high inflation persisting and then later proving very costly to get down. The other is the risk that we move too fast, or too far."
Fed Bullard: Continued policy rate increases can lock in disinflationary trend
St. Louis Fed President James Bullard said yesterday, "I was an advocate for a 50-basis-point hike and I argued that we should get to the level of rates the committee viewed as sufficiently restrictive as soon as we could."
Bullard said "inflation remains too high but has declined," adding that "continued policy rate increases can help lock in a disinflationary trend during 2023, even with ongoing growth and strong labor markets."
BoE Pill: MPC needs to ensure it does either too much or too little
BoE Chief Economist Huw Pill said in a speech yesterday, "recognising that its earlier actions are now gaining traction, the MPC needs to ensure that it does enough to return inflation to target, while guarding against the possibility that it does either too much or – for that matter – too little."
"Finding that balance is the central challenge for monetary policy at present," he said.
Pill also noted, "continuing to raise rates at the pace and magnitude seen over the past year would eventually – and perhaps soon – imply that monetary policy had cumulatively been tightened too much."
Yet, "the MPC's need to be watchful for signs of greater-than-expected persistence in inflationary pressure," he emphasized. "I would flag the need for the Committee to maintain a readiness to act to address any such persistence should it emerge."
On the economy, Pill said Tuesday's labor market data "pointed to signs that the UK labour market loosened a little in the fourth quarter". But, "these indicators suggest the labour market remains tight in an absolute sense relative to historical experience."
CPI data showed inflation fell to 10.1% in January, from 10.5% in December. "On the month, this mainly owed to an easing in services and fuel price inflation, although developments in historically very volatile components such as airfares counted for a large part of the former."
Cliff Notes: Consumers Bearing the Brunt of Inflation’s Cost
Key insights from the week that was.
This week, updates on sentiment and the labour market put the Australian consumer in the spotlight. The US CPI report meanwhile again highlighted the challenge the FOMC face in bringing down services inflation.
The Westpac-MI Consumer Sentiment survey delivered a sour update on confidence. After earning some reprieve through the Christmas/New Year period, the headline index fell by 6.9% in February. At 78.5, confidence has returned to the lows seen last November, and before that the onset of the pandemic and the GFC. Households are clearly unnerved by the persistence of widespread inflationary pressures and the hawkish shift in the RBA’s guidance in early 2023. The survey’s sub-indexes clearly highlight both the fragile state of family finances and the likely implications for spending, with family finances versus a year ago 30% below long-run average levels and ‘time to buy a major household item’ 38% below average. For a detailed analysis of these topics, see this week’s video update by Senior Economist Matthew Hassan and/or our February Market Outlook in conversation podcast.
Of the data received domestically this week, the January labour force survey was most significant. Over the last two months, total employment has declined by 35.5k and the unemployment rate has risen 0.2ppts to 3.7% – results that are typically consistent with a softening trend emerging in the labour market. However, it is important to recognise that the survey also reported a rise in the number of unemployed people who have lined up a job in the near feature similar to the rise in unemployment. Additionally, the 2.1% decline in seasonally adjusted hours worked indicates a higher-than-usual number of people taking annual leave in January. Taken together, this suggests that some caution should be applied to recent labour force data, especially given that business (see below) and household surveys (see above) are still pointing to robust labour demand. Slack in the labour market will begin to emerge more clearly in time but we do not expect this to occur until H2 2023, with the unemployment rate forecast to rise to 4.6% by year-end.
The recovery in immigration flows has led to robust growth in the working age population, holding firmly above pre-pandemic levels at 2.1%yr. Indeed, there has been a surge in overseas arrivals and departures over the Christmas/New Year period, with seasonally adjusted estimates indicating that this strength is close to patterns seen during the pre-pandemic years. Although travel by Australian residents constitutes the bulk of this, it was promising to see the recovery in net visitor arrivals strengthen over the course of 2022, lifting from 420k in H1 to 675k in H2. The return of international visitors from China – a segment that has lagged the broader recovery to date – will be a key support over the coming year; however, broader strength in visitor flows will need to be sustained through 2023 before overseas travel can return to pre-pandemic levels.
Before moving offshore, a quick note on businesses. The latest NAB business survey suggests that business conditions and confidence were supported by robust consumer spending. Results from consumer segments have remained broadly constructive, with the large swings in overall conditions over the last two months (-8pts in Dec; +5pts in Jan) the result of extreme volatility within the mining, manufacturing and construction segments over a tricky survey period impacted by holidays. The +6pt bounce in confidence was also associated with the continued easing in labour costs and overall upstream price pressures, although mounting headwinds around the interest rate outlook and prospective weakness in consumption will likely dominate over 2023.
The key release in the US this week was the January CPI report. The 0.5% headline and 0.4% core results were as expected, as was the detail of the release. Core goods prices were little changed in the month, with a decline in used vehicle prices offsetting robust gains for apparel and medical care commodities. Core services inflation remained strong however, with prices up 0.5%. Within services, rent inflation continues to crest at a historically high rate, the downtrend reported for market measures of rents yet to flow through; also supporting the 0.7% total shelter gain in January was a strong rise in the cost of short-term accommodation (1.2%), arguably a consequence of demand from both US and international holiday makers.
While in line with expectations, the January CPI release is notable because it again highlights the stickiness of services inflation and consequently the challenge before the FOMC to return headline inflation to target. We still expect this to occur, but not until late-2023, necessitating a lengthy pause in FOMC policy once the peak rate is reached.
On demand, US January retail sales were also released this week. At +3.0%, the headline result was a material upside surprise to the 2.0% consensus view. Stripping out the monthly volatility and looking at the control group measure, spending growth was still strong at 1.7% and also ahead of the market’s expectation of 1.0%. Prices were supportive in the month, but the principal driver of the outsized gain is instead the weak results of late-2022, with the level in January only 0.4% higher than October in nominal terms. This multi-month result speaks to our expectation that the US economy will stagnate through 2023, albeit with volatility seen quarter to quarter.
Across in Europe, Q4 GDP was meanwhile confirmed at +0.1%, signalling the Euro Area is also likely to experience economic stagnation versus recession. However, as laid out on the Europe page of our February Market Outlook, the caveat to this view is that, in Q4, the country outcomes offset one another bar Ireland’s 3.5% gain. This result is not a one off, but with annual growth now at 15.7%yr, Ireland’s momentum seems unlikely to sustain for much longer. If the other Euro Area economies remain weak, a run of negatives is still a distinct possibility for Euro Area GDP, although the scale of cumulative decline is likely to be small given the strength of their labour market.
With the Euro Area now likely to outperform the US in 2023, and most certainly market expectations from 2022, Euro is expected to continue its uptrend during H2 2023 and 2024. Asian currencies are expected to be stronger still, outperforming the US dollar trend as they benefit not only from a sustainable growth advantage but also retreating inflation and rate risks. Australia’s dollar should follow the example of Asia, rising to USD0.74 end-2023 and USD0.77 end-2024.
USD/JPY Gains Bullish Momentum, Dollar Extends Increase
Key Highlights
- USD/JPY climbed higher above the 133.50 resistance zone.
- A major bullish trend line is forming with support near 133.30 on the 4-hours chart.
- EUR/USD extended losses and traded below the 1.0700 level.
- Bitcoin price outperformed before it faced sellers near $25,000.
USD/JPY Technical Analysis
The US Dollar started a steady increase from the 129.80 zone against the Japanese Yen. USD/JPY climbed higher above the 131.20 and 132.00 resistance levels.
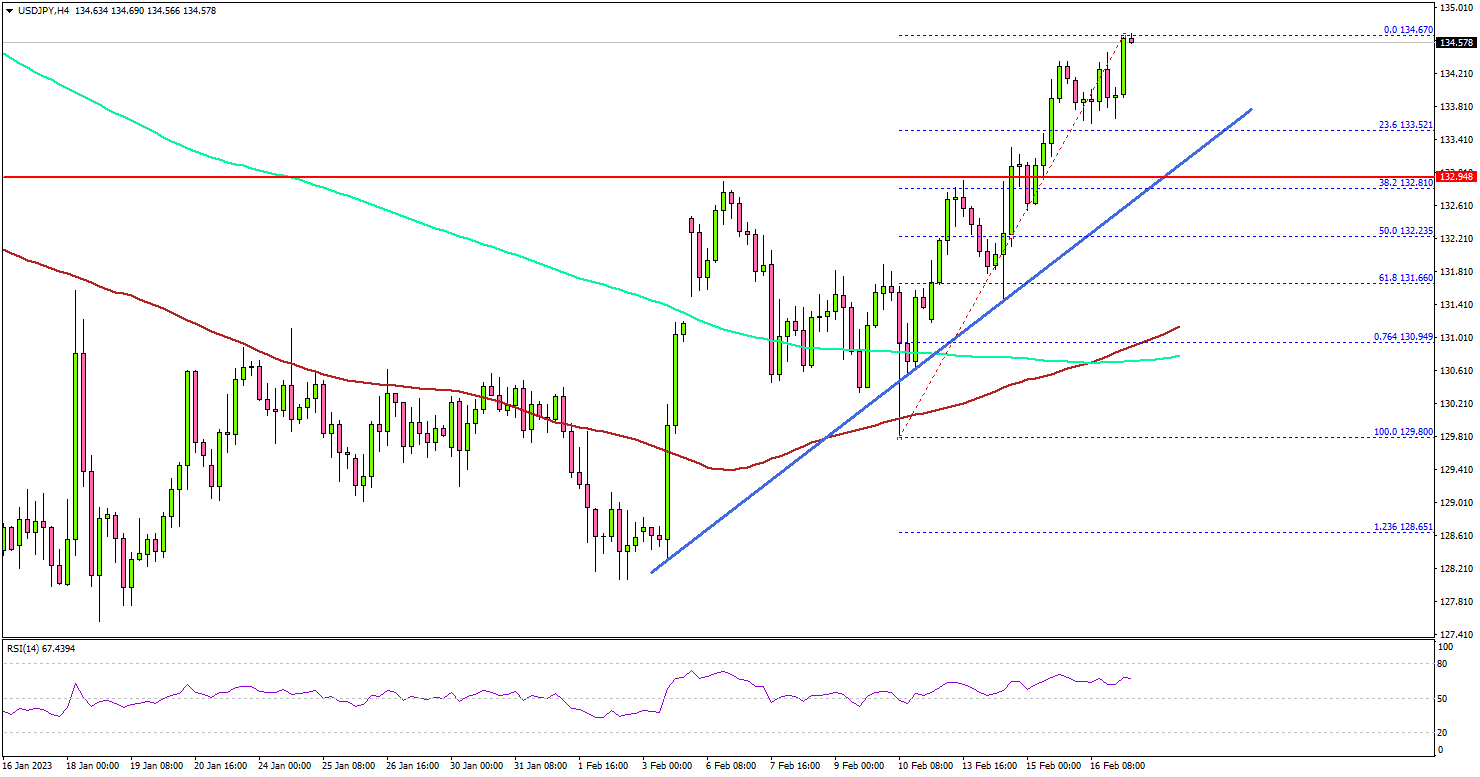
Looking at the 4-hours chart, the pair even gained pace above the 133.00 level, the 100 simple moving average (red, 4-hours), and the 200 simple moving average (green, 4-hours).
The upward move was such that the pair traded to a new monthly high above 134.00. The next major resistance is near the 134.80 level. A clear move above the 134.80 resistance might start a steady increase towards the 135.50 resistance zone.
Any more gains could open the doors for a move towards the 136.20 level, above which the bulls may perhaps aim a move towards the 138.00 resistance.
On the downside, there is a decent support forming near the 133.30 level. There is also a major bullish trend line forming with support near 133.30 on the 4-hours chart.
The next major support is near the 132.60 level, below which there is a risk of a move towards the 100 simple moving average (red, 4-hours) at 130.80 in the coming days.
Looking at EUR/USD, the pair remained in a bearish zone and there was a clear move below the 1.0700 support zone.
Economic Releases
- UK Retail Sales for Jan 2023 (YoY) - Forecast -5.5%, versus -5.8% previous.
- UK Retail Sales for Jan 2023 (MoM) - Forecast -0.3%, versus -1.0% previous.
- US Import Price Index for Jan 2023 (MoM) – Forecast -0.2%, versus +0.4% previous.
EURCAD Wave Analysis
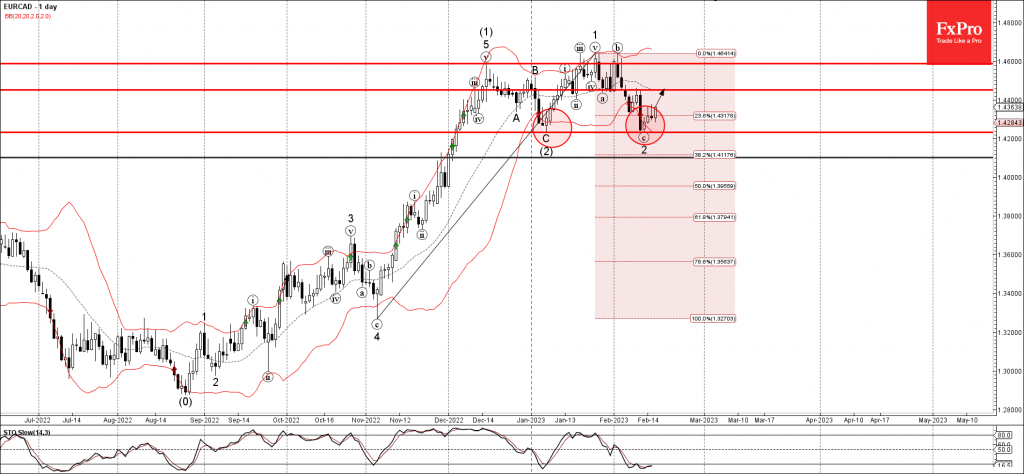
- EURCAD reversed from support level 1.445
- Likely to rise to resistance level 4200.00
EURCAD currency pair recently reversed up from the support level 1.423 (previous monthly low from January), standing near the lower daily Bollinger Band.
The upward reversal from the support level 1.423 stopped the previous short-term ABC correction 2.
Given the clear daily uptrend, EURCAD can be expected to rise further toward the next resistance level 1.445 (previous minor high from the start of this month).
Strong US PPI Pushing Fed to Do More
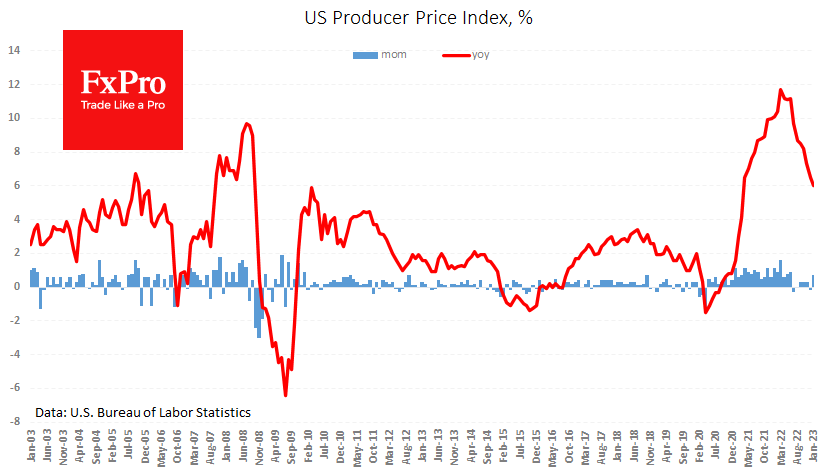
After consumer prices, US producer prices delivered another hawkish surprise. PPI rose by 0.7% in January, impressively stronger than the expected +0.4%. The annual price growth rate slowed from 6.5% to 6.0%, against expectations of 5.4%.
It is worth disregarding the slowdown in the annual inflation rate, as it is due to the high base effect of the previous year, while the monthly increase remains above the historical average.
Producer prices are a couple of months ahead of consumer prices, so today’s release is a crucial hawkish signal for the Fed to continue raising rates without letting inflation expectations hang in the balance.
Aside from high inflation, the labour market also needs more reasons to take a breather. Initial jobless claims remained below 200k for the fifth week in a row, complementing the 3% rise in retail sales in January.
Overall, this mix of data suggests that the economy is in good shape. Still, it now risks triggering a reassessment of the monetary policy outlook, which is harmful to the markets.