Sample Category Title
More upside still in favor in sluggish ethereum and bitcoin
Crytocurrencies have been rather sluggish since the near term rebound lost momentum in late January. Yet, for now, there is no clear sign of a bearish reversal.
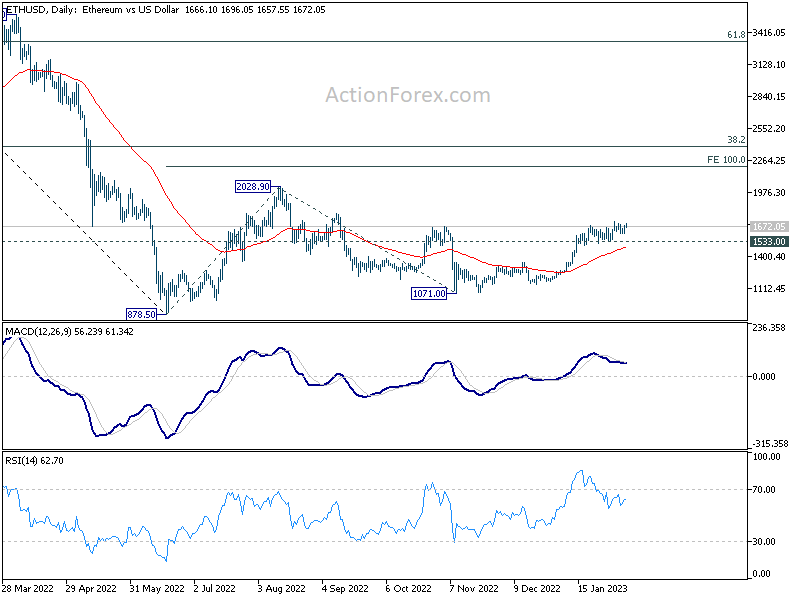
For Ethereum, further rally is expected as long as 1533 support holds. Current rise from 1071 is seen as the third leg of the pattern from 878.5. It might eventually turn out too be a sideway consolidation pattern. But stronger raise to 2028.9 resistance could be seen, or even further to 100% projection of 878.5 to 2028.9 from 1071.0 at 2221.4. But of course, break of 1533.0 will indicate short term topping. Further break of 55 day EMA would pave the way back to 1071 or even to 878.5.
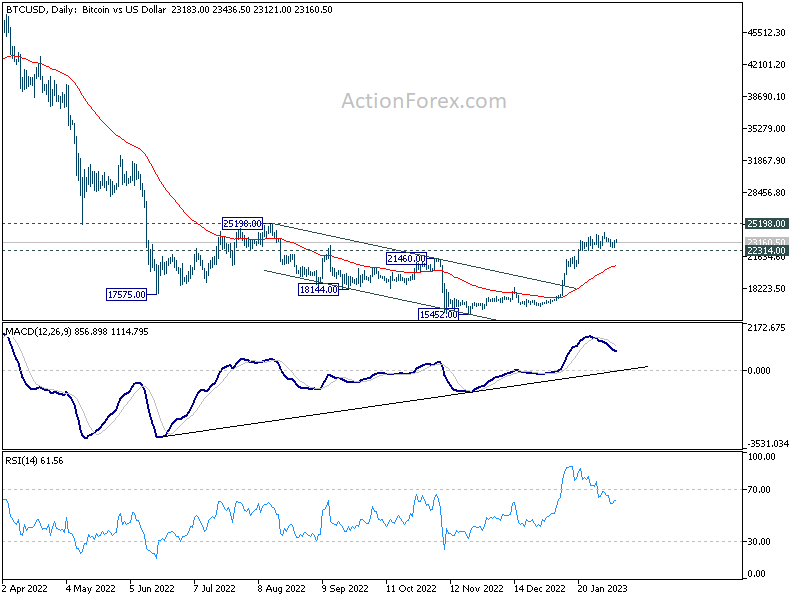
As for Bitcoin, further rally is expected as long as 22314 resistance support holds. Rise from 15452 would target 25198. Strong resistance might be seen there to cap upside, at least on first attempt. On the downside, break of 22314 support will suggest short term topping and bring pull back to 55 day EMA.
GBPCAD Wave Analysis
- GBPCAD reversed from support level 1.6120
- Likely to rise to resistance level 1.6400
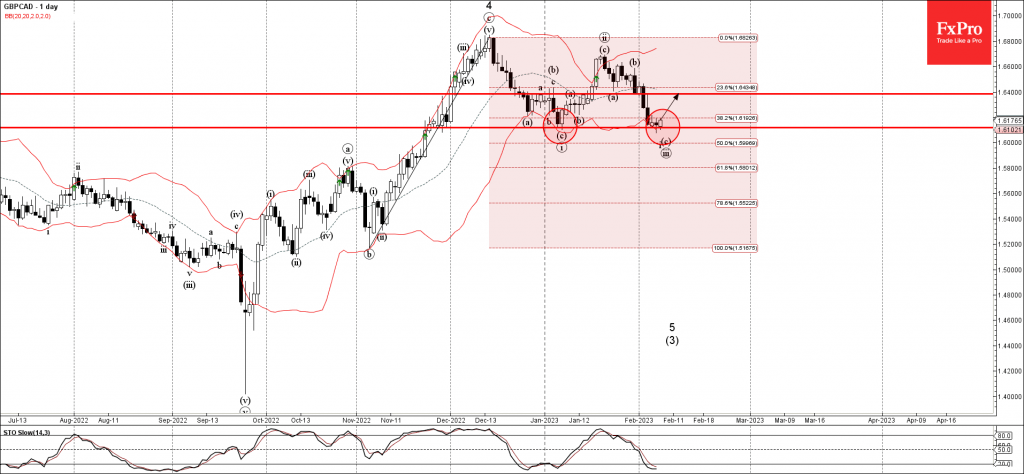
GBPCAD currency pair earlier reversed up from the key support level 1.6120, which stopped the previous minor impulse wave (i) at the start of last month.
The upward reversal from the support level 1.6120 stopped the previous minor impulse wave (iii), which belongs to wave 5 from December.
Given the oversold daily Stochastic, GBPCAD can be expected to rise further toward the next resistance level 1.6400.
USDCHF Wave Analysis
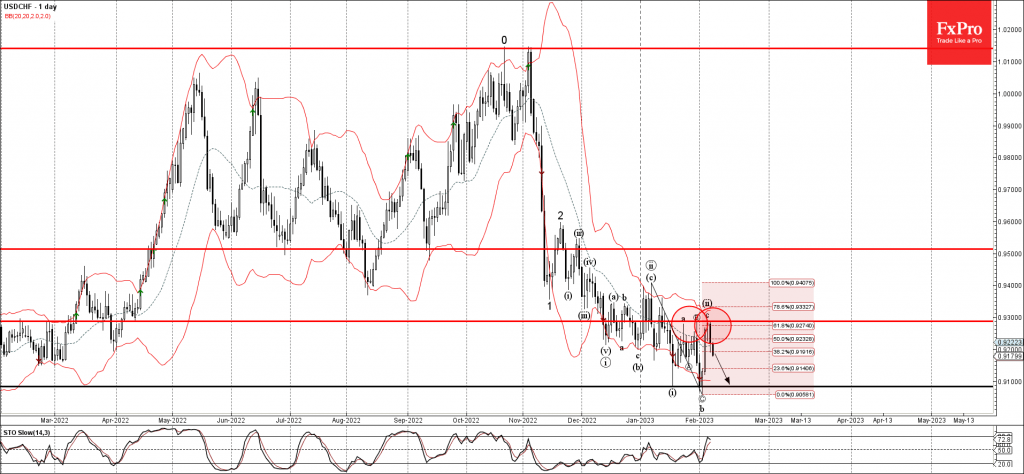
- USDCHF reversed from resistance level 0.92865
- Likely to fall to support level 0.9100
USDCHF continues to fall after the price reversed down from the resistance level 0.92865, which stopped the previous waves (a), (b).
The resistance level 0.92865 was further strengthened by the upper daily Bollinger Band and by the 61.8% Fibonacci retracement of the previous downer impulse from last month.
Given the clear daily downtrend, USDCHF can be expected to fall further toward the next support level 0.9100.
GBP/USD Pair Moved into a Short-term Bearish Zone Below 1.2365
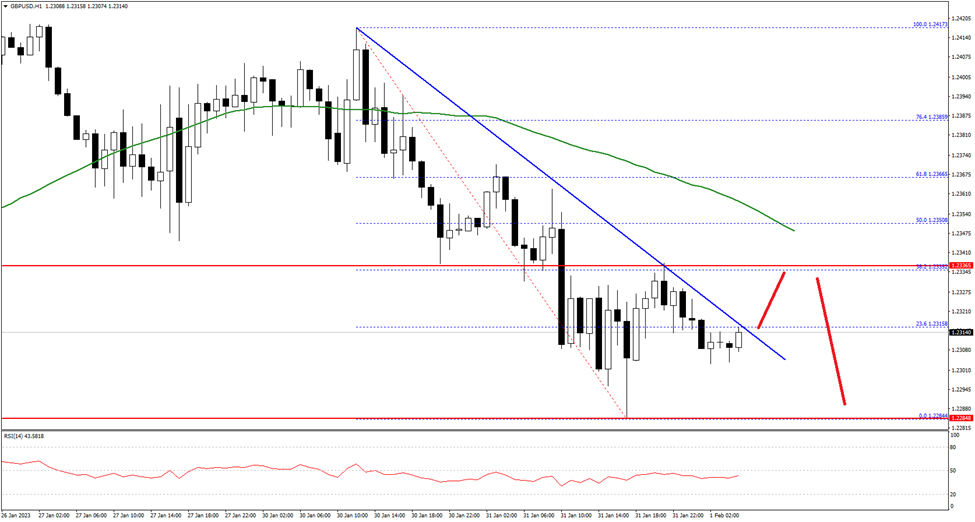
The British Pound started a bearish reaction from the 1.2420 resistance zone against the US Dollar. The GBP/USD pair declined below the 1.2365 level to move into a short-term bearish zone.
There was a close below the 1.2350 level and the 50 hourly simple moving average. It is now consolidating near the 1.2315 level, with an immediate resistance at 1.2320 and a connecting bearish trend line on the hourly chart.
The first major resistance is near the 1.2350 level. If there is a clear upside break above the 1.2350 resistance, the pair could rise steadily towards the 1.2400 level in the near term. The next major resistance sits near 1.2420 on FXOpen.
On the downside, the first major support is near the 1.2300 level. The main support is forming near the 1.2285 level. A break below the 1.2285 support could push the pair towards the 1.2240 support.
USDJPY Returns to Losses; Fragile Below 50-SMA
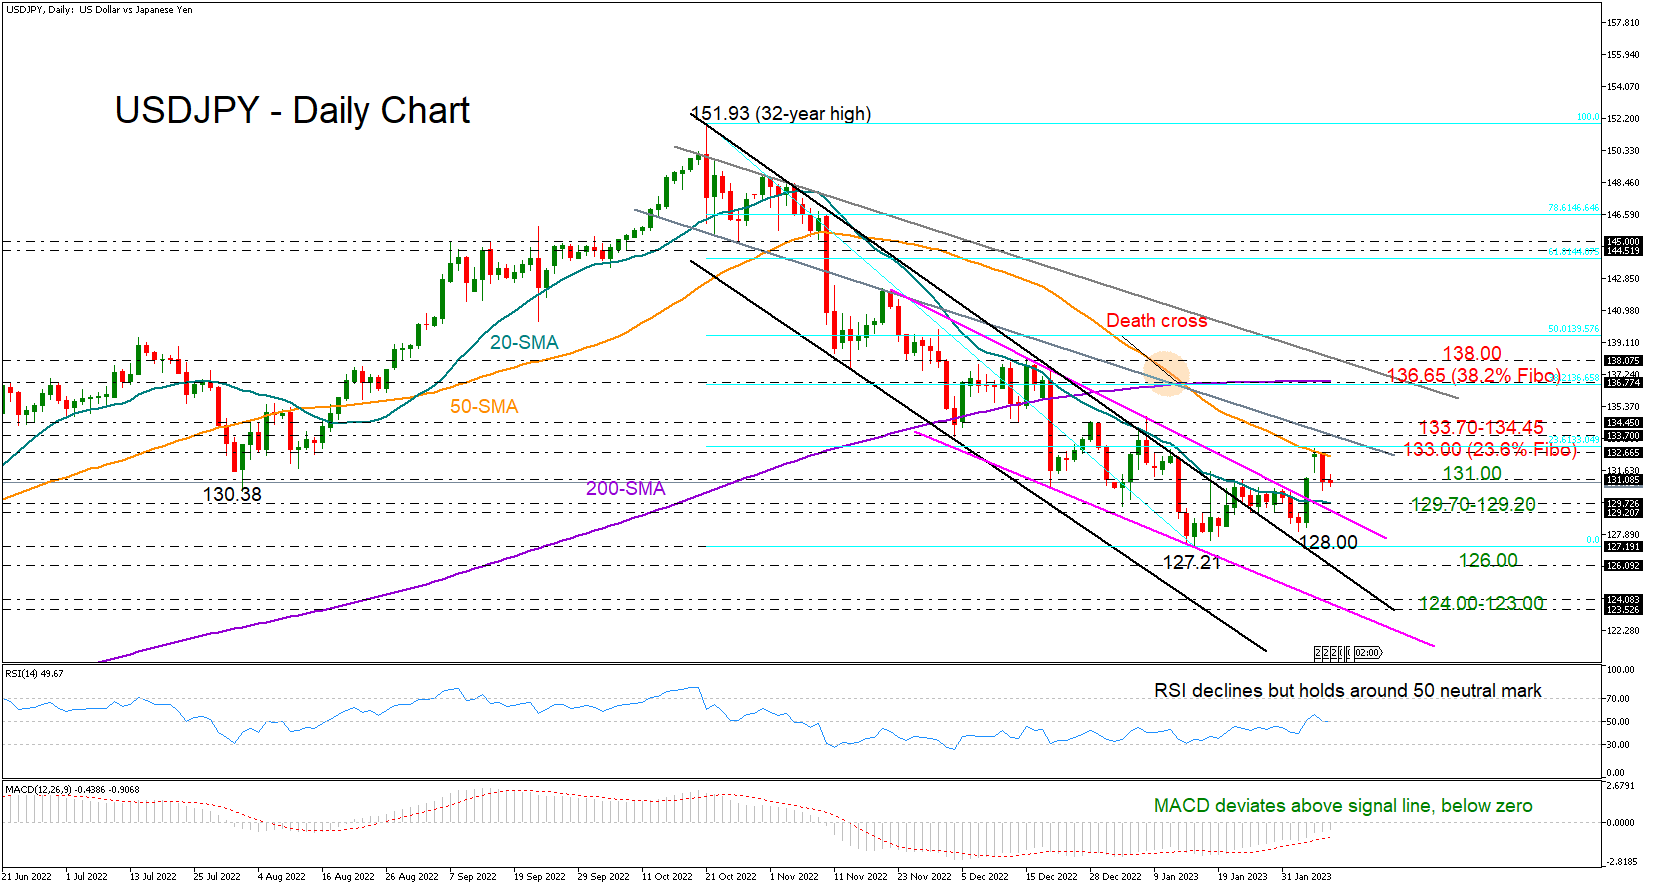
USDJPY closed Monday’s positive gap by rapidly falling to 131.00 on Tuesday after hitting a wall near the 50-day simple moving average (SMA) at 133.60.
Another leg down would ruin the bull’s efforts for a trend reversal, but the pair could still maintain the soft ascent from 127.21 if it pivots within the 129.70-129.20 region represented by the 20-day SMA and the surface of the shorter-term bearish channel respectively. If not, the sell-off may continue towards the previous low of 127.21, while lower, some consolidation may occur near 126.00 before the way clears towards the channel’s lower boundary currently seen within the 124.00-123.50 area.
The technical indicators, however, have yet to confirm a bearish bias. Despite the latest downturn in the price, the RSI managed to hold above its 50 neutral mark, whilst the MACD has barely been affected, gradually extending its recovery within the negative zone.
Nevertheless, the 50-day SMA and the 133.00 zone, where the 23.6% Fibonacci retracement of the 151.93-127.21 downleg is placed, will pose a threat to upside movements in the short term. Buyers would also like to see a higher high above the 133.70-134.45 area before boosting the price up to the 200-day SMA and the 38.2% Fibonacci level of 136.65.
In brief, the sideways move in USDJPY may continue in the coming sessions as buying interest looks conditional. The pair will need to stay above its 20-day SMA to sustain hopes for a bullish trend reversal, though only a rally above 134.45 would confirm that case.
EUR/USD: Weakness Can Resume from 1.08
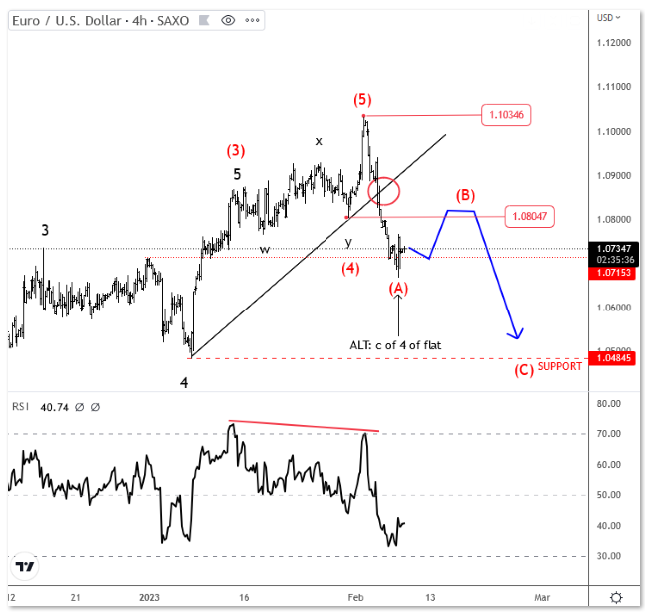
EURUSD is coming sharply down since last week, following FED; ECB and BoE policy decisions. We can see strong sell-off through the rising trendline support which looks like an impulse so ideally there will be more weakness coming. An RSI divergence also suggests that bulls are tired and bears are ready to take control. However, we will be tracking only a three-wave drop; ideally, an A-B-C pullback, currently with wave (A) is at the support, so more weakness can be seen after wave (B) rally. Perfect resistance for the next sell-off is at 1.08.
NZDUSD Points Marginally Up Within Trading Range
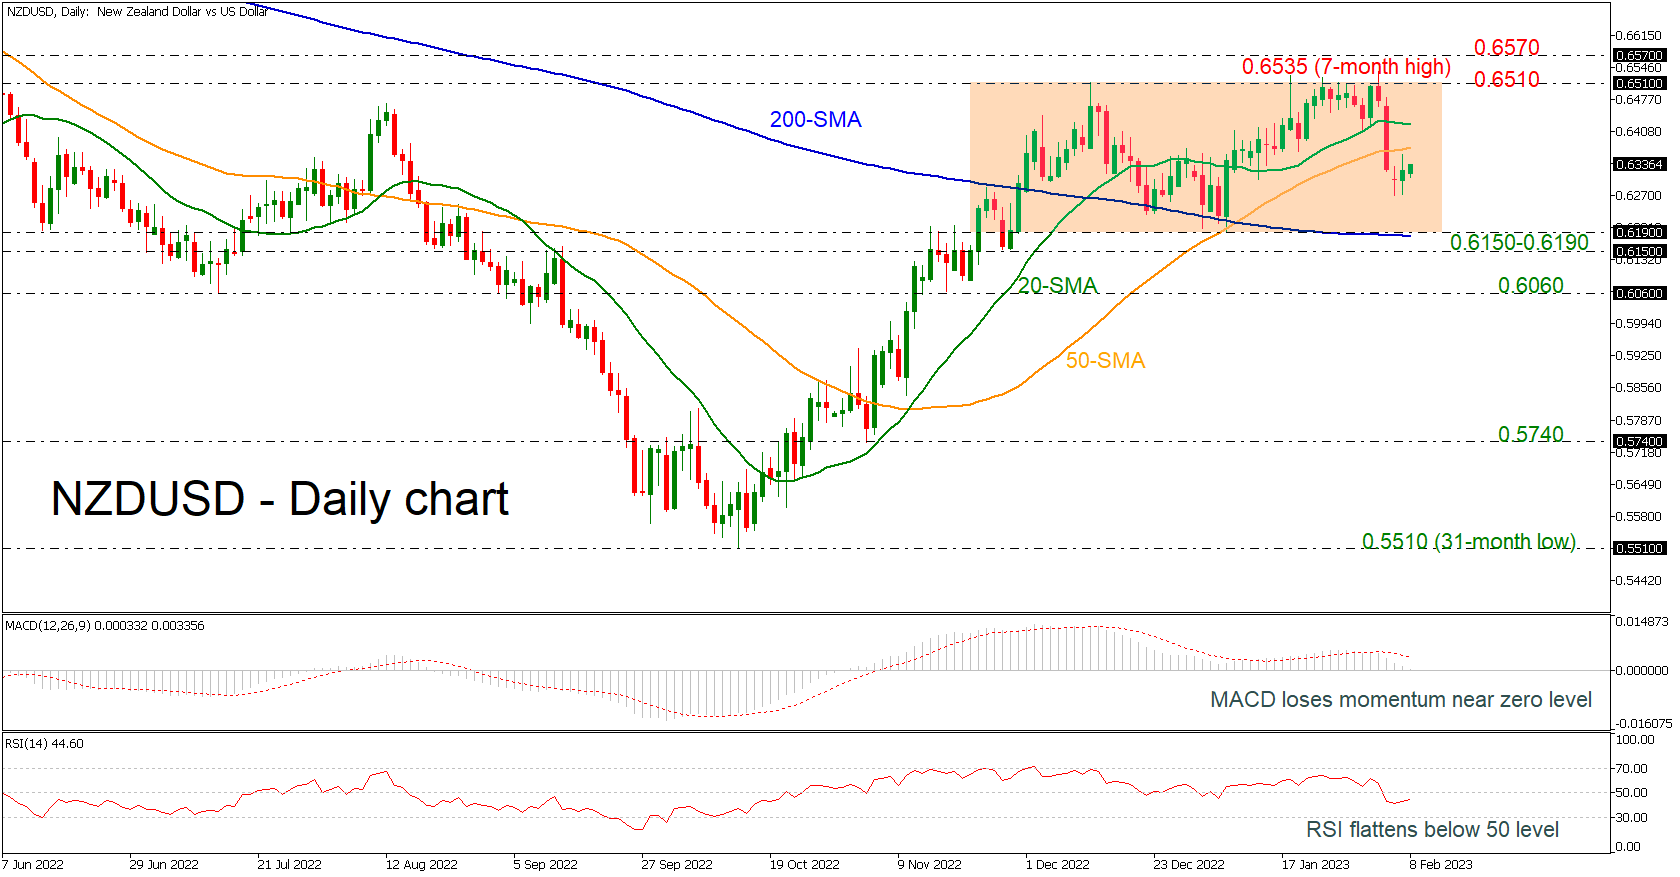
NZDUSD is ticking slightly higher, remaining within a medium-term consolidation area with upper boundary the 0.6510 resistance and lower boundary the 0.6190 support. The technical oscillators are confirming this sideways move on price as the MACD is standing near the zero level, while the RSI is flattening in the negative region.
Should selling forces strengthen, the 200-day simple moving average (SMA), which overlaps with the lower boundary of the channel at 0.6190 will come under the spotlight. The 0.6150 could initially turn into support to keep the bias on the positive side. Moving lower, the 0.6060 could next add some footing ahead of the 0.5740 barrier.
Alternatively, a close above the short-term SMAs could push the price towards the 0.6510 resistance, which has been frequently tested during the previous week. Beyond that, the rally may gear up to 0.6570 before meeting the next obstacle of the 200-weekly SMA at 0.6060.
In brief, EURJPY is facing a weakening bullish bias in the medium-term, where a drop below 0.6510 is expected to enhance selling interest.
XAU/USD: Incomplete Triple Zigzag Hints at Further Growth
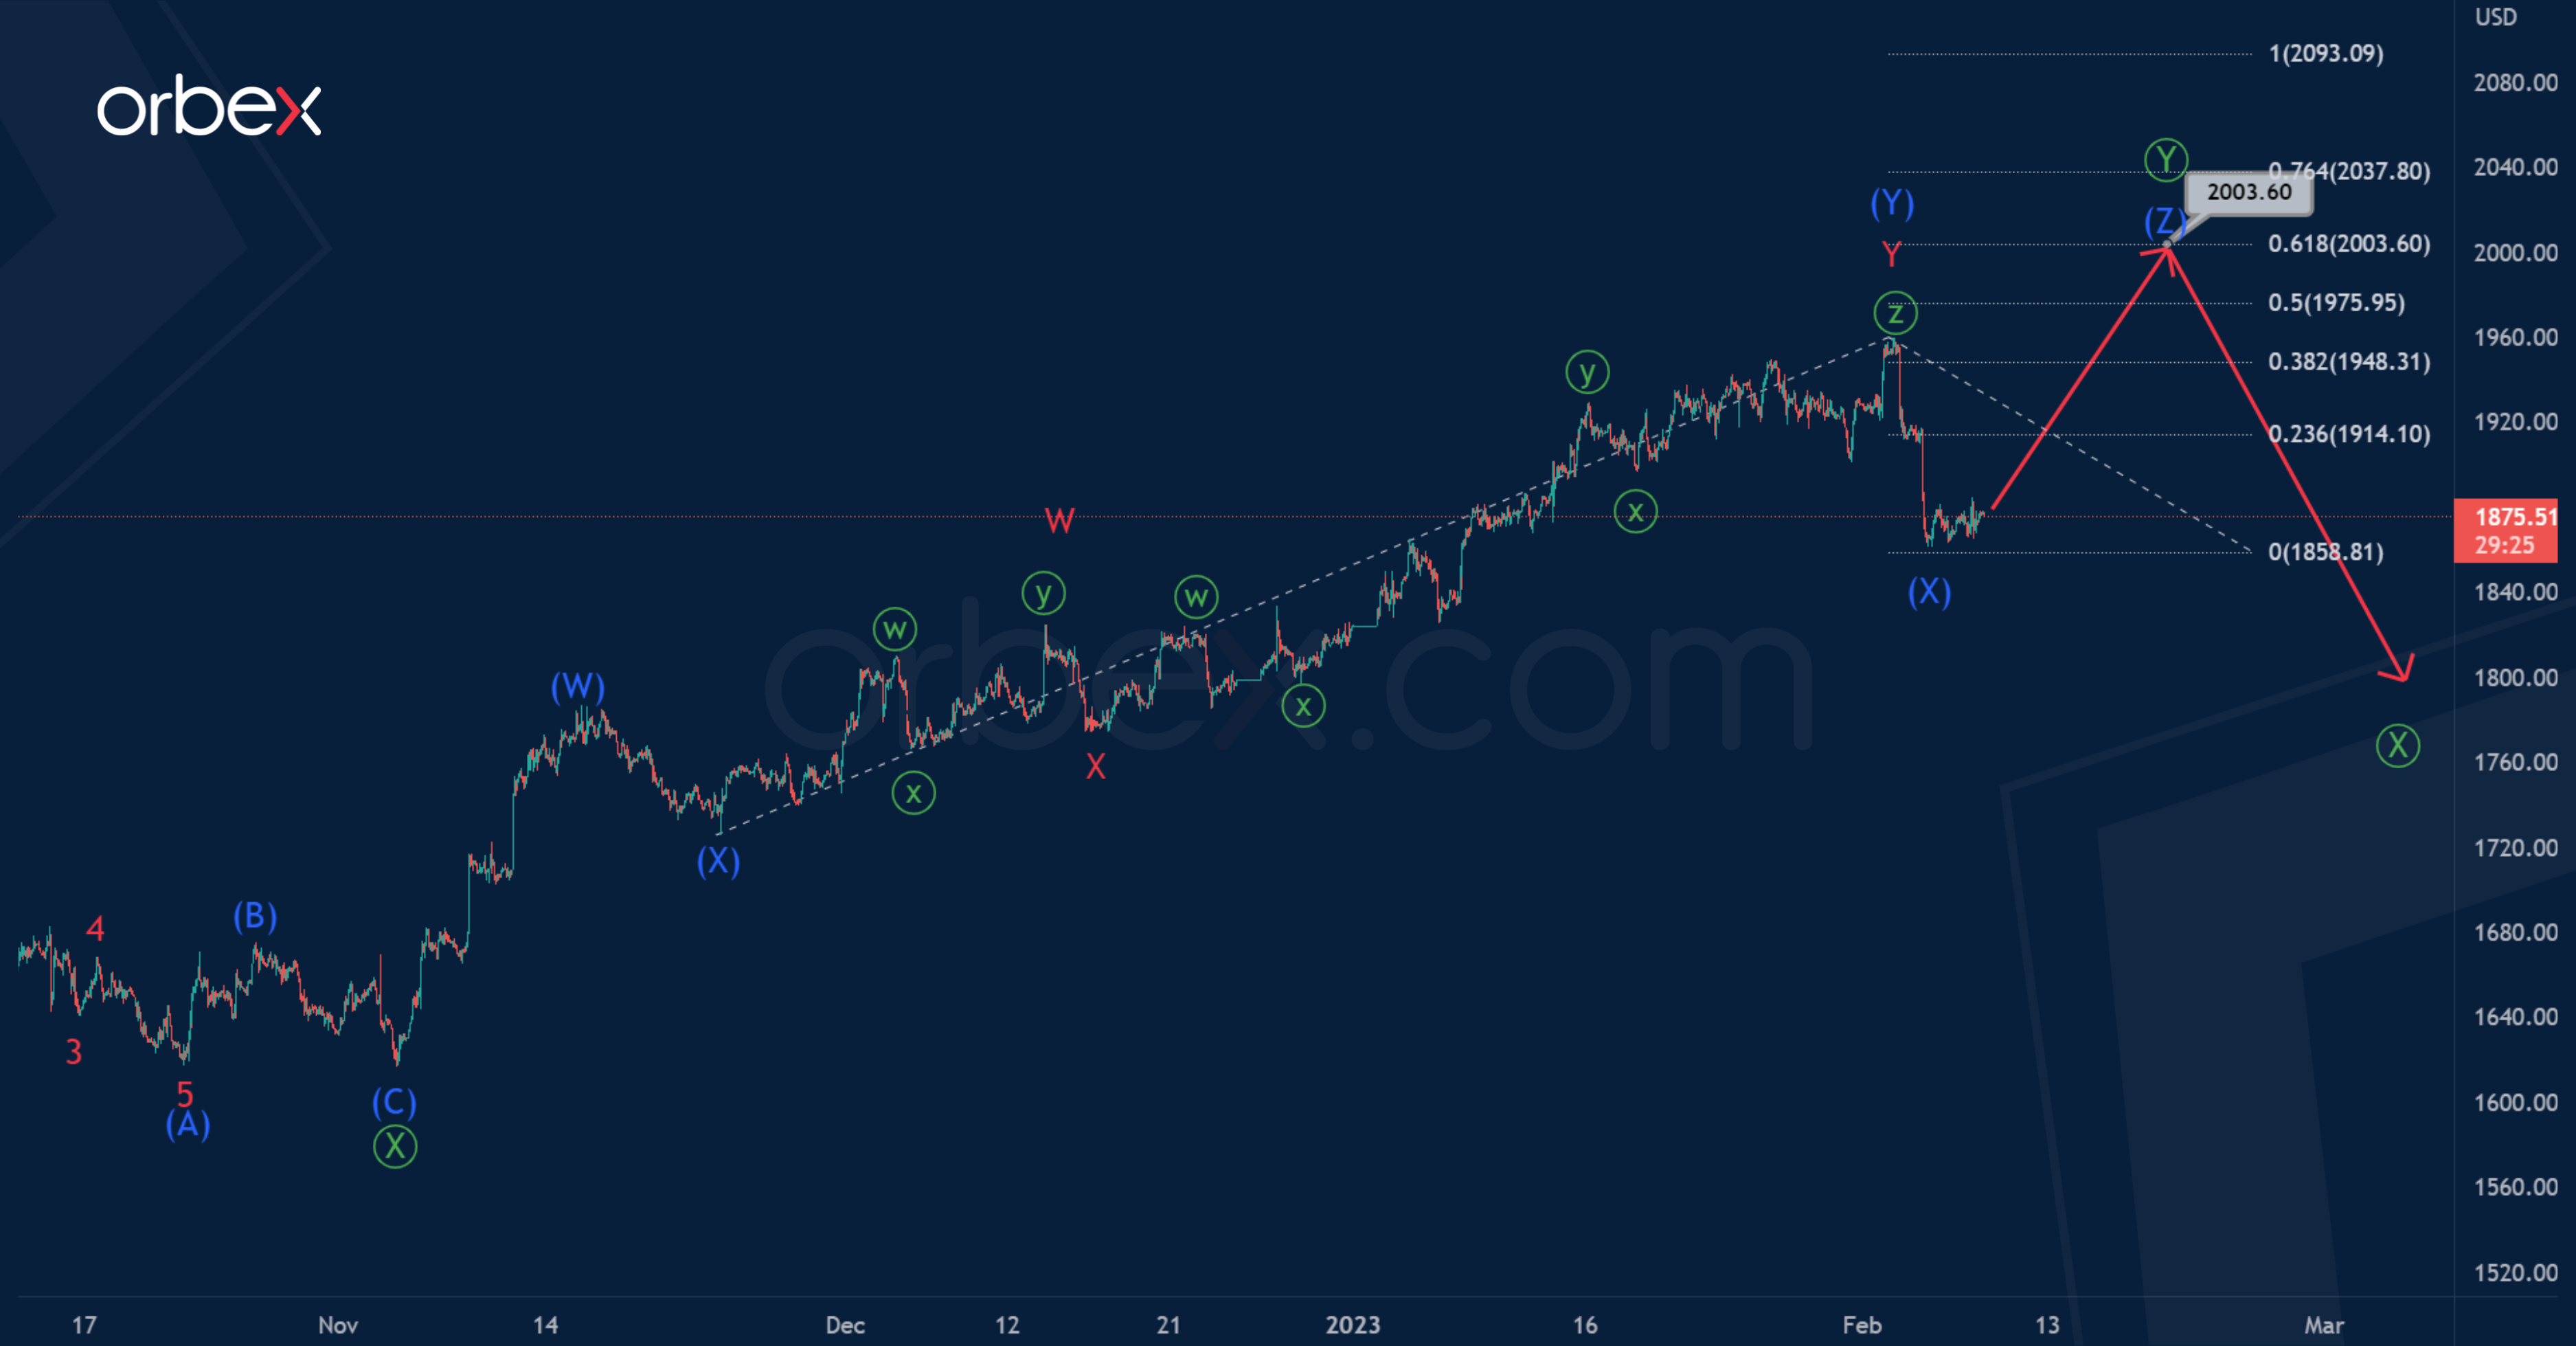
It is assumed that in the long term, a triple zigzag pattern is formed for gold, which consists of five main sub-waves Ⓦ-Ⓧ-Ⓨ-Ⓧ-Ⓩ.
Perhaps the first two sub-waves Ⓦ-Ⓧ have already been formed, and the third sub-wave Ⓨ is under development.
The internal structure suggests that the wave Ⓨ takes the form of an intermediate triple zigzag, in which we can notice complete sub-waves (W)-(X)-(Y)-(X).
Thus, in the near future we can expect a possible price rise and the development of the final intermediate wave (Z). Its end can be expected near 2003.60. At that level, it will be at 61.8% of previous actionary wave (Y).
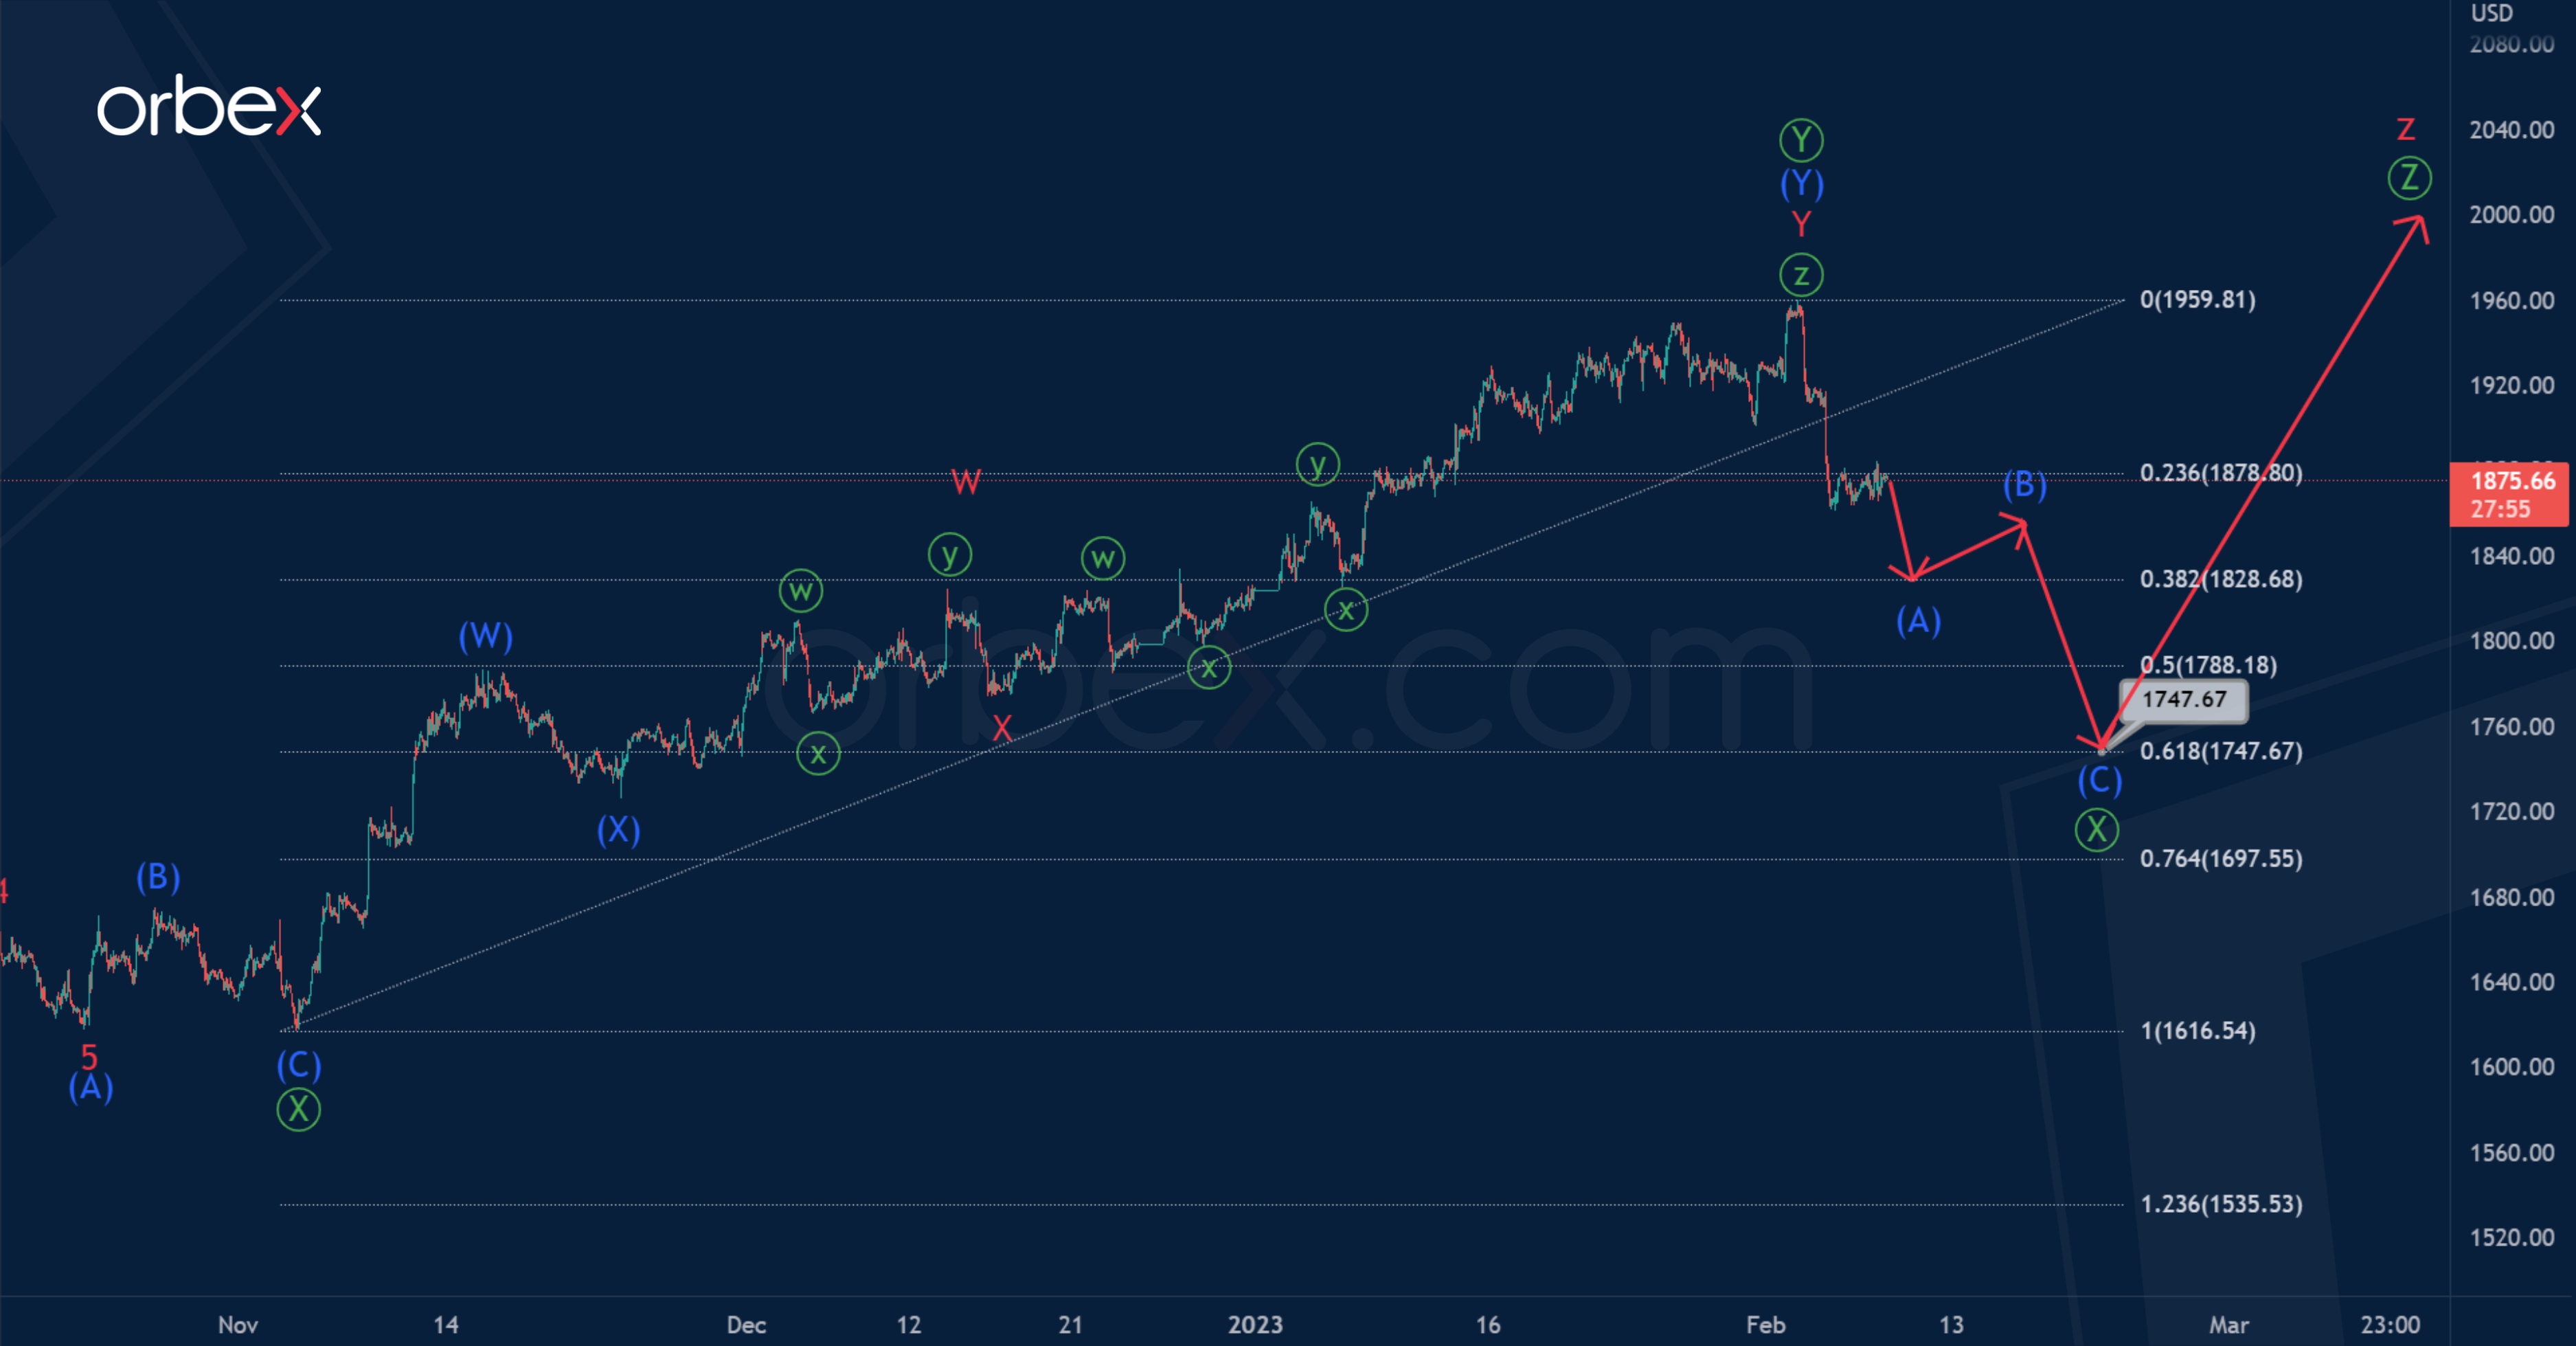
However, the primary actionary wave Ⓨ could have ended, it is a double zigzag (W)-(X)- (Y).
Thus, in the near future, the price may move down, forming a primary intervening wave Ⓧ. Perhaps it takes the form of an intermediate zigzag (A)-(B)-(C).
We will probably observe the end of the wave Ⓧ near 1747.67. At that level, it will be at 61.8% of wave Ⓨ.
FTSE 100 Bounces off Support
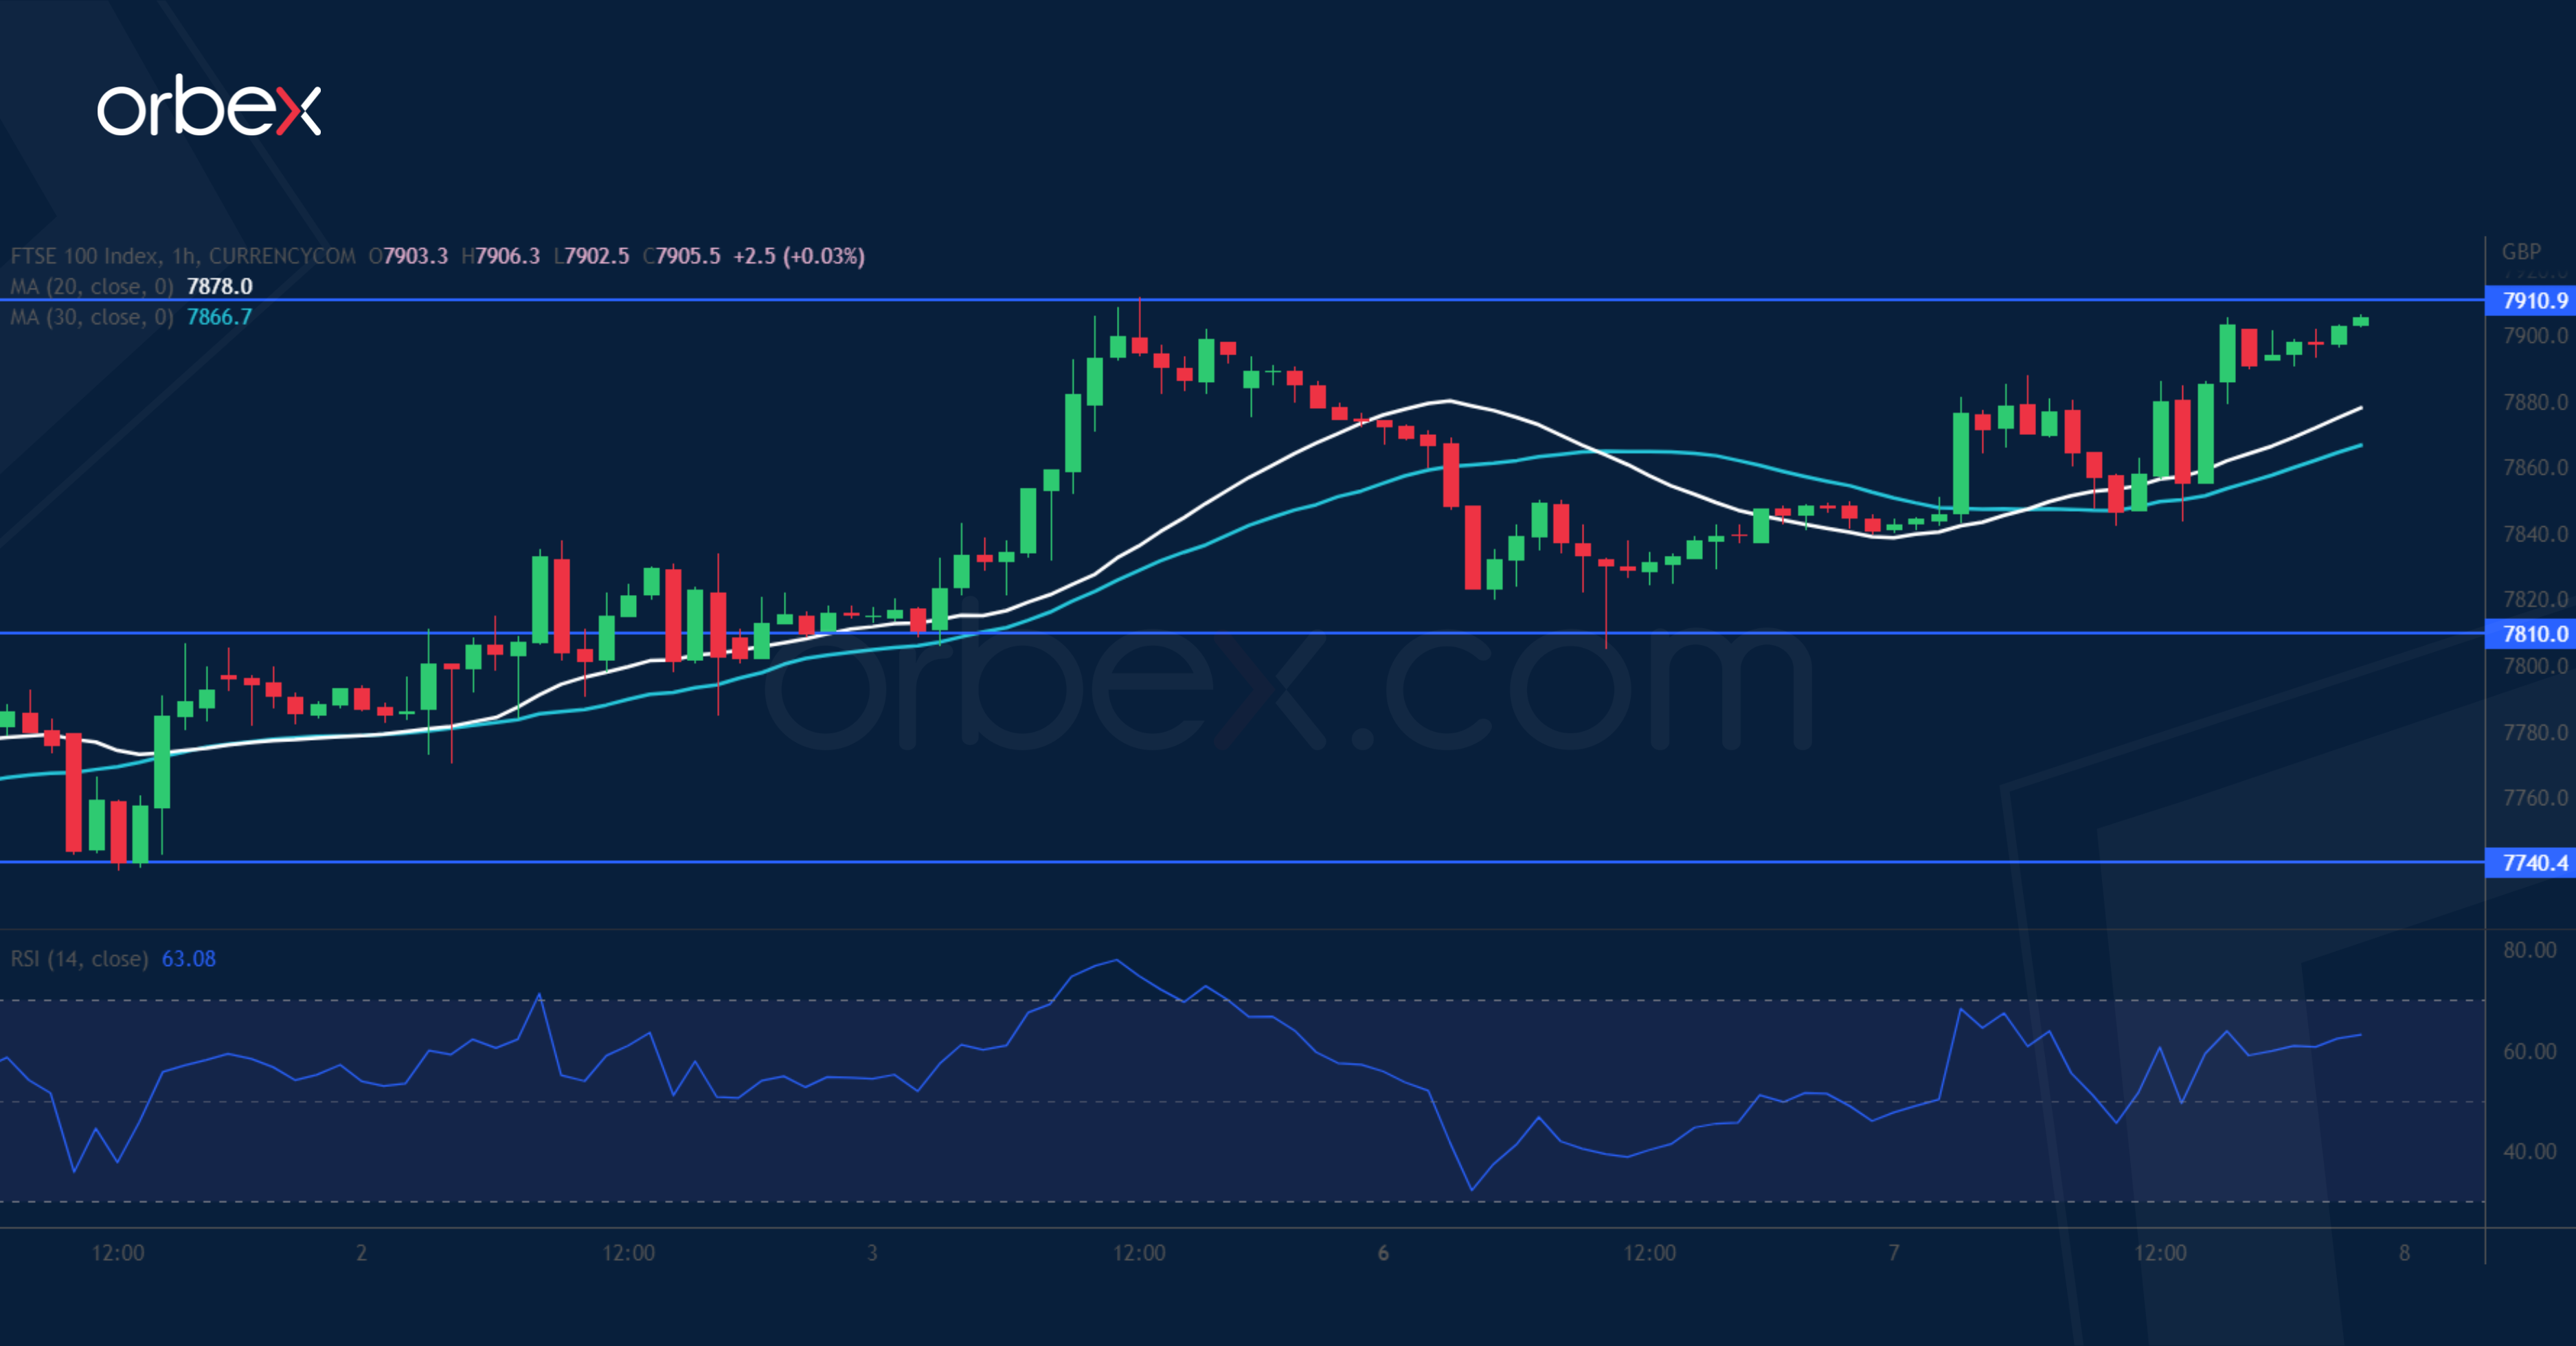
The FTSE 100 edged higher supported by blue chip energy names. A rally above the previous high of 7870 suggests that the directional bias is still up after securing bids along the 20-day SMA (7740). A bounce off the base of the latest breakout (7810) further cements the bulls’ resolve in keeping the uptrend intact. A close above 7910 could bring in momentum buyers and send the price to the milestone at 8000. 7740 now sitting on the 30-day SMA stays as a trailing stop in case of a deeper pullback.
XAU/USD Struggles to Stabilise
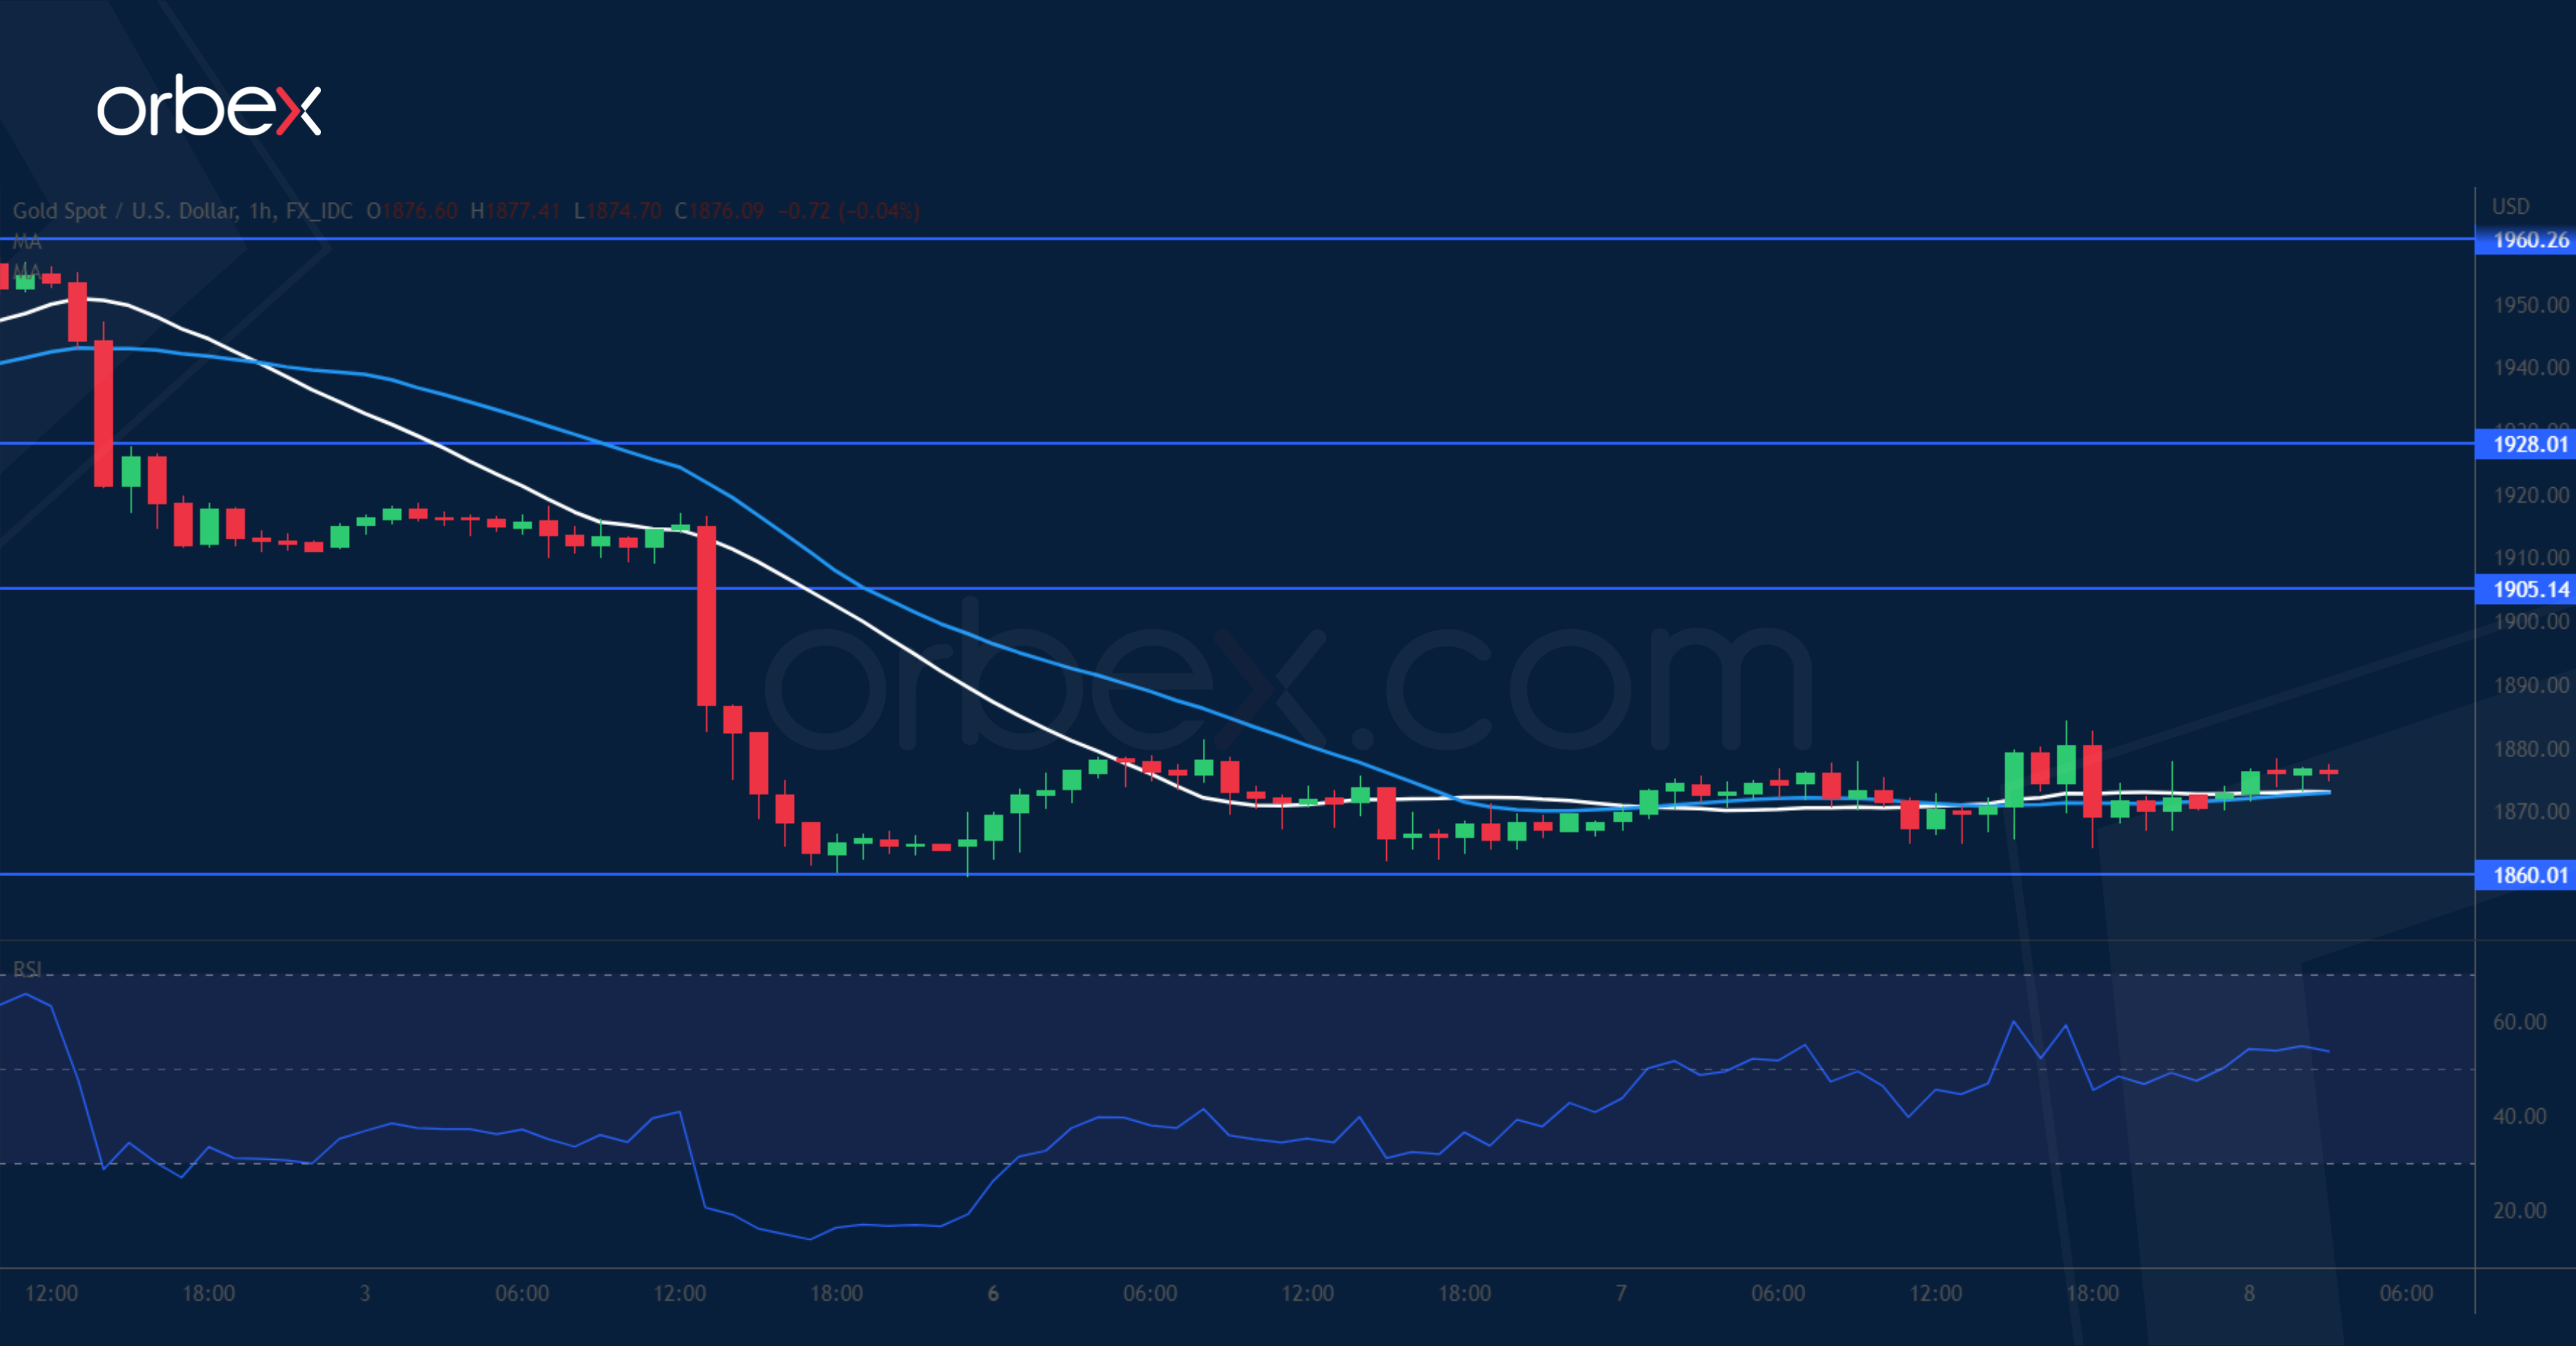
Gold steadies ahead of Fed Chair Jerome Powell’s speech later today. On the daily chart, last April’s sell-off zone around 1950 has proved to be a tough barrier to crack. A sharp fall below 1900 and the 30-day SMA (1880) forced leveraged positions to liquidate, exacerbating volatility. If the current support at 1860 cannot stop the bleeding, 1825 would be the next level to see if bids start to emerge. On the upside, a bounce to the supply zone around 1905 is likely to meet offers from those who caught the falling knife.