Sample Category Title
McCarthy and Biden to Meet over Debt Ceiling
Market movers today
The first central bank week of the year kicks off with a round of macro data. The Spanish Flash Inflation will give us the first taste of euro area's January price developments ahead of the euro area flash print on Wednesday. The January data will be complicated by several factors, and not least the updated index weights (see Euro inflation notes, 25 January, for a rundown).
In addition, Q4 Flash GDP data is due for release from Germany and Sweden. The full year data released earlier suggested that Germany might have narrowly escaped a recession late last year, while we still think the Swedish GDP most likely contracted in Q4.
Euro area Economic Sentiment Indicators for January will be released, consensus is looking for a slight uptick following last week's upbeat PMIs.
Later in the week, focus will naturally be on the central banks, we expect a 50bp hike from the ECB (see our ECB preview, 26 January), 25bp from the Fed (Fed preview, 24 January) and 50bp from the Bank of England (BoE preview, 27 January). Markets will also focus on a range of US labour market data, and not least the Jobs Report on Friday, as well as the US ISM and Chinese NBS PMIs.
The 60 second overview
US: House Speaker McCarthy plans to meet with President Biden on Wednesday to discuss an increase of the US debt ceiling and avoid sovereign default. The x-date, the day when US runs out of money to roll over maturing debt, is likely still months away - potentially early June, but likely in July. It is therefore encouraging that policy makers meet already now to discuss the issue.
Japan: Bank of Japan governor Kuroda stressed in comments to parliament that it is possible to hit the 2% inflation targeting with current monetary easing, but a virtuous cycle with higher wage growth is needed.
FI: It was a tale of two stories on Friday. In the morning, the rates sell-off from Thursday continued with Bunds touching 2.28% (+6bp) as markets reassessed the potential of a hawkish take this week, although seen on the day as a whole core yields ended virtually unchanged on the day.
FX: FX will take direction from the Fed and the ECB on Wednesday and Thursday, respectively. EUR/USD has levelled out and is starting the week at 1.0870. USD/JPY, which is also highly susceptible to relative rates, has dropped overnight on speculations that Bank of Japan might tighten policy further. The cross is now at 129.50. EUR/SEK is back above 11.20, at the end of the month supported by rebalancing flows. EUR/NOK at around 10.75.
Credit: Credit markets ended the week treading water, as investors turned their focus to upcoming central bank meetings. Itrax main was basically unchanged (+0.1bp) ending at 78.5bp. Itrax Xover widened 1.2bp to close at 410.8bp. The primary market had slowed down but was definitely still open. Most notable Nordic deal on Friday was the Swedish high yield issuer, GoNorth, printing SEK550m (after upsizing from SEK520m) at a spread of MS+1100bp.
AUD/USD Daily Outlook
Daily Pivots: (S1) 0.7085; (P) 0.7107; (R1) 0.7132; More…
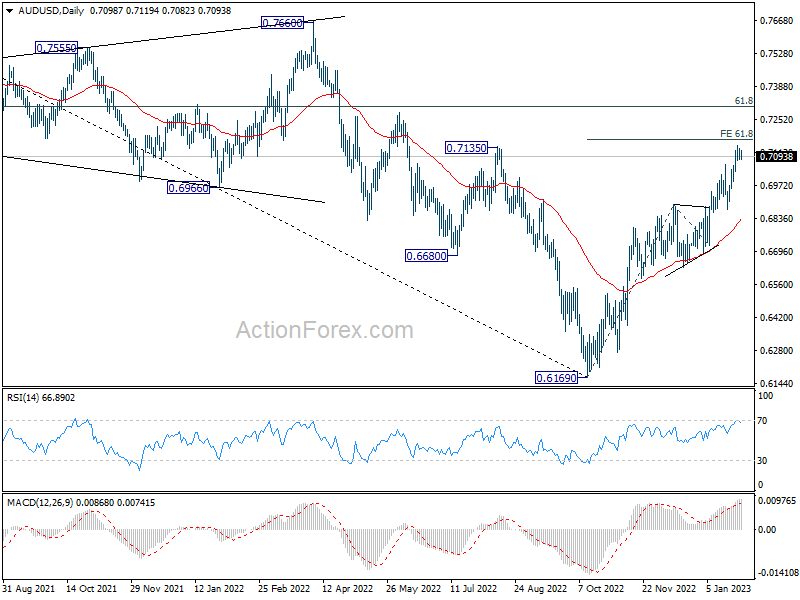
Intraday bias in AUD/USD is turned neutral first, as it lost momentum ahead of 61.8% projection of 0.6169 to 0.6892 from 0.6721 at 0.7168. On the downside, break of 0.7061 minor support will indicate short term topping, and turn bias to the downside, for pull back to 0.6871 support. Nevertheless, sustained break of 0.7168 will resume the rise from 0.6169 to 0.7304 fibonacci level.
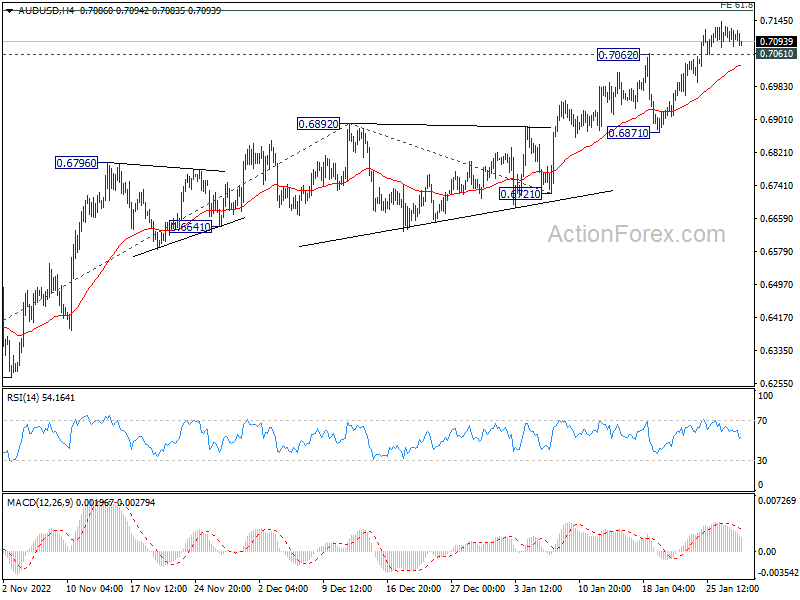
In the bigger picture, corrective decline from 0.8006 (2021 high) should have completed with three waves down to 0.6169 (2022 low). Further rally should be seen to 61.8% retracement of 0.8006 to 0.6169 at 0.7304. Sustained break there will pave the way to retest 0.8006. This will now remain the favored case as long as 0.6721 support holds.
Markets Turning Cautious; Fed, ECB and BoE ahead, With Lots of Data
Sentiment in Asia was mixed today. Most markets have turned cautious ahead of the central bank bonanza this week. At the same time Hong Kong stocks tumble deeply, as led by Chinese tech giants. In the currency markets, Australia Dollar is currently leading commodity currencies lower. Yen is the slightly stronger one while European majors are mixed. Much volatility is anticipated ahead considering the number of heavy weight events.
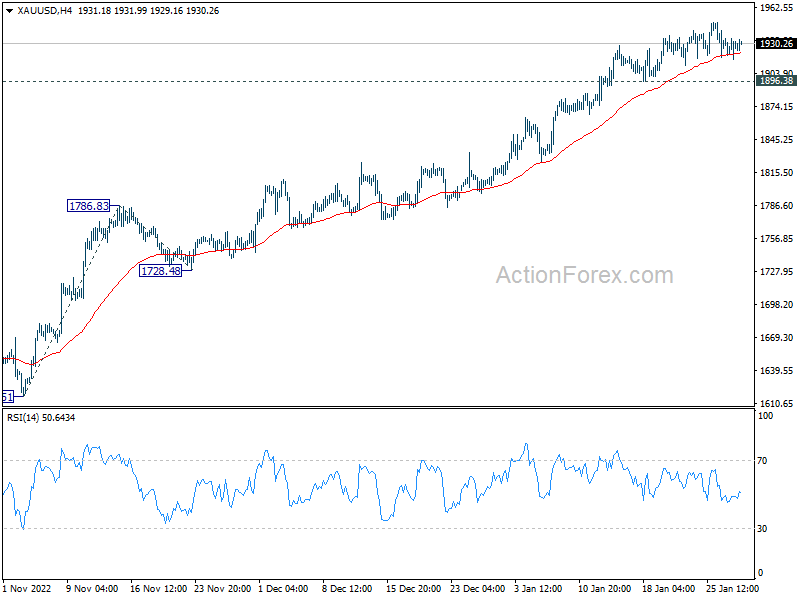
Technically, there is prospect of at least short term rebound in Dollar, considering oversold condition and loss of downside momentum. But some levels will need to be taken out firmly to confirm short term bottoming first, including 1.0765 support in EUR/USD, 1.2252 support in GBP/USD, as well as 131.56 resistance in USD/JPY. At the same time, Gold should also take out 1896.38 support decisively, if the greenback set to rebound with some conviction.
In Asia, Nikkei rose 0.19%. Hong Kong HSI is down -2.39%. China Shanghai SSE is up 0.20%. Singapore Strait Times is down -0.44%. Japan 10-year JGB yield is down -0.0068 at 0.478.
NZ goods exports rose 11% yoy in Dec, imports rose 1.8% yoy
New Zealand goods exports rose 11% yoy or NZD 640m to NZD 6.7B in December. Goods imports rose 1.8% yoy or NZD 125m to NZD 7.2B. Monthly trade deficit narrowed to NZD -475m, comparing to November's NZD -2180m and expectation of NZD -1750m.
The US leads monthly expect rise, up 40% yoy, while exports to all trade partners were up, including China (up NZD 4.2m), Australia (up 17% yoy), EU up (9.8% yoy), and Japan (up 14% yoy).
The US also leads monthly import rise up 80% yoy. Others were mixed with China down -11% yoy, EU up 3.8% yoy, Australia up 7.0% yoy and Japan up 3.4% yoy.
BoJ Kuroda: Inflation trend likely to gradually accelerate, but takes some more time
BoJ Governor Haruhiko Kuroda told the parliament today, "Japan's trend inflation is likely to gradually accelerate ... but that will take some more time."
"Uncertainty regarding Japan's economy is extremely high. It's therefore important now to support the economy, and create an environment where companies can raise wages," he said.
Separately, a panel of academics and business executives urged BoJ to make the 2% inflation target a long-term goal, to make monetary policy more flexible.
"The way the BOJ conducts monetary policy must be revamped," Yuri Okina, a candidate for the next BOJ deputy governor."By making 2% inflation a long-term goal, the BOJ can make its monetary policy more flexible."
Fed, BoE and ECB to continue tightening
The main events of the week are rate decisions of Fed, BoE and ECB. Fed is widely expected to slow down tightening to 25bps hike to 4.25-4.50%. At this point, Fed fund futures are pricing in another 25bps hike in March to 4.50-4.75%. Markets will looking affirmation from the statement for such expectations. Beyond that, the path will depend on upcoming data for sure, and then the new economic projections to be delivered in March. But in any case, Fed Chair Jerome Powell should reiterate that interest rate will stay high for as long as necessary to bring inflation back to target, and talk down any case of a rate cut this year.
BoE is expected to raise the Bank Rate by 50bps to 4.00%. Voting will be a main focus as usual as the hawk/dove split was very clear. At the December meeting where a 50bps rate hike was delivered, two members, (Swati Dhingra and Silvana Tenreyro voted for no change) and one (Catherine Mann) voted for 75bps hike. Additionally, BoE will also publish new economic projections. Currently there are expectations that another 25bps rate hike will be delivered in March, and then a pause. Any deviation from such expectation could trigger much volatility in the Pound.
ECB is widely expected to hike the main refinancing rate by 50bps to 3.00%. There were talks that ECB might start slowing down in March, but many officials have come out dismissing that. President Christine Lagarde should reiterate the stance to "stay the course". But beyond February, all would depend on the new economic projections to be delivered in March.
The economic calendar is also jam-packed with heavy weight data, including US non-farm payrolls, ISM indexes and consumer confidence; Eurozone GDP and CPI; Canada GDP; Swiss KOF and retail sales, Japan industrial production in retail sales; New Zealand employment; China PMIs. Here are some highlights for the week:
- Monday: New Zealand trade balance; Swiss KOF economic barometer; Germany GDP.
- Tuesday: Japan unemployment rate, industrial production, retail sales, consumer confidence, housing starts; Australia retail sales, private sector credit; China official PMIs; France consumer spending, GDP; Germany CPI flash, unemployment; Swiss retail sales; UK M4 money supply, mortgage approvals; Eurozone GDP; Canada GDP; US employment cost, house price index, Chicago PMI, consumer confidence.
- Wednesday: Australia AiG manufacturing; New Zealand employment; Japan PMI manufacturing final; China Caixin PMI manufacturing; Eurozone PMI manufacturing final, CPI flash, unemployment rate; UK PMI manufacturing final; US ADP employment, ISM manufacturing, construction spending, FOMC rate decision.
- Thursday: New Zealand building permits; Australia building approvals; Japan monetary base; Germany trade balance; Swiss SECO consumer climate; BoE rate decision; ECB rate decision; Canada building permits; US jobless claims, non-farm productivity, factory orders.
- Friday: Australia AiG construction; China Caixin PMI services; France industrial production; Eurozone PMI services final; UK PMI services final; US non-farm payroll employment, ISM services.
AUD/USD Daily Outlook
Daily Pivots: (S1) 0.7085; (P) 0.7107; (R1) 0.7132; More…
Intraday bias in AUD/USD is turned neutral first, as it lost momentum ahead of 61.8% projection of 0.6169 to 0.6892 from 0.6721 at 0.7168. On the downside, break of 0.7061 minor support will indicate short term topping, and turn bias to the downside, for pull back to 0.6871 support. Nevertheless, sustained break of 0.7168 will resume the rise from 0.6169 to 0.7304 fibonacci level.
In the bigger picture, corrective decline from 0.8006 (2021 high) should have completed with three waves down to 0.6169 (2022 low). Further rally should be seen to 61.8% retracement of 0.8006 to 0.6169 at 0.7304. Sustained break there will pave the way to retest 0.8006. This will now remain the favored case as long as 0.6721 support holds.
Economic Indicators Update
| GMT | Ccy | Events | Actual | Forecast | Previous | Revised |
|---|---|---|---|---|---|---|
| 21:45 | NZD | Trade Balance (NZD) Dec | -475M | -1750M | -1863M | -2180M |
| 08:00 | CHF | KOF Leading Indicator Jan | 89.1 | 92.2 | ||
| 09:00 | EUR | Germany GDP Q/Q Q4 P | 0.00% | 0.40% | ||
| 10:00 | EUR | Eurozone Economic Sentiment Jan | 94.6 | 95.8 | ||
| 10:00 | EUR | Eurozone Industrial Confidence Jan | -1.7 | -1.5 | ||
| 10:00 | EUR | Eurozone Services Sentiment Jan | 4.3 | 6.3 | ||
| 10:00 | EUR | Eurozone Consumer Confidence Jan F | -20.9 |
BoJ Kuroda: Inflation trend likely to gradually accelerate, but takes some more time
BoJ Governor Haruhiko Kuroda told the parliament today, "Japan's trend inflation is likely to gradually accelerate ... but that will take some more time."
"Uncertainty regarding Japan's economy is extremely high. It's therefore important now to support the economy, and create an environment where companies can raise wages," he said.
Separately, a panel of academics and business executives urged BoJ to make the 2% inflation target a long-term goal, to make monetary policy more flexible.
"The way the BOJ conducts monetary policy must be revamped," Yuri Okina, a candidate for the next BOJ deputy governor."By making 2% inflation a long-term goal, the BOJ can make its monetary policy more flexible."
NZ goods exports rose 11% yoy in Dec, imports rose 1.8% yoy
New Zealand goods exports rose 11% yoy or NZD 640m to NZD 6.7B in December. Goods imports rose 1.8% yoy or NZD 125m to NZD 7.2B. Monthly trade deficit narrowed to NZD -475m, comparing to November's NZD -2180m and expectation of NZD -1750m.
The US leads monthly expect rise, up 40% yoy, while exports to all trade partners were up, including China (up NZD 4.2m), Australia (up 17% yoy), EU up (9.8% yoy), and Japan (up 14% yoy).
The US also leads monthly import rise up 80% yoy. Others were mixed with China down -11% yoy, EU up 3.8% yoy, Australia up 7.0% yoy and Japan up 3.4% yoy.

Technical Outlook and Review
USD/JPY:
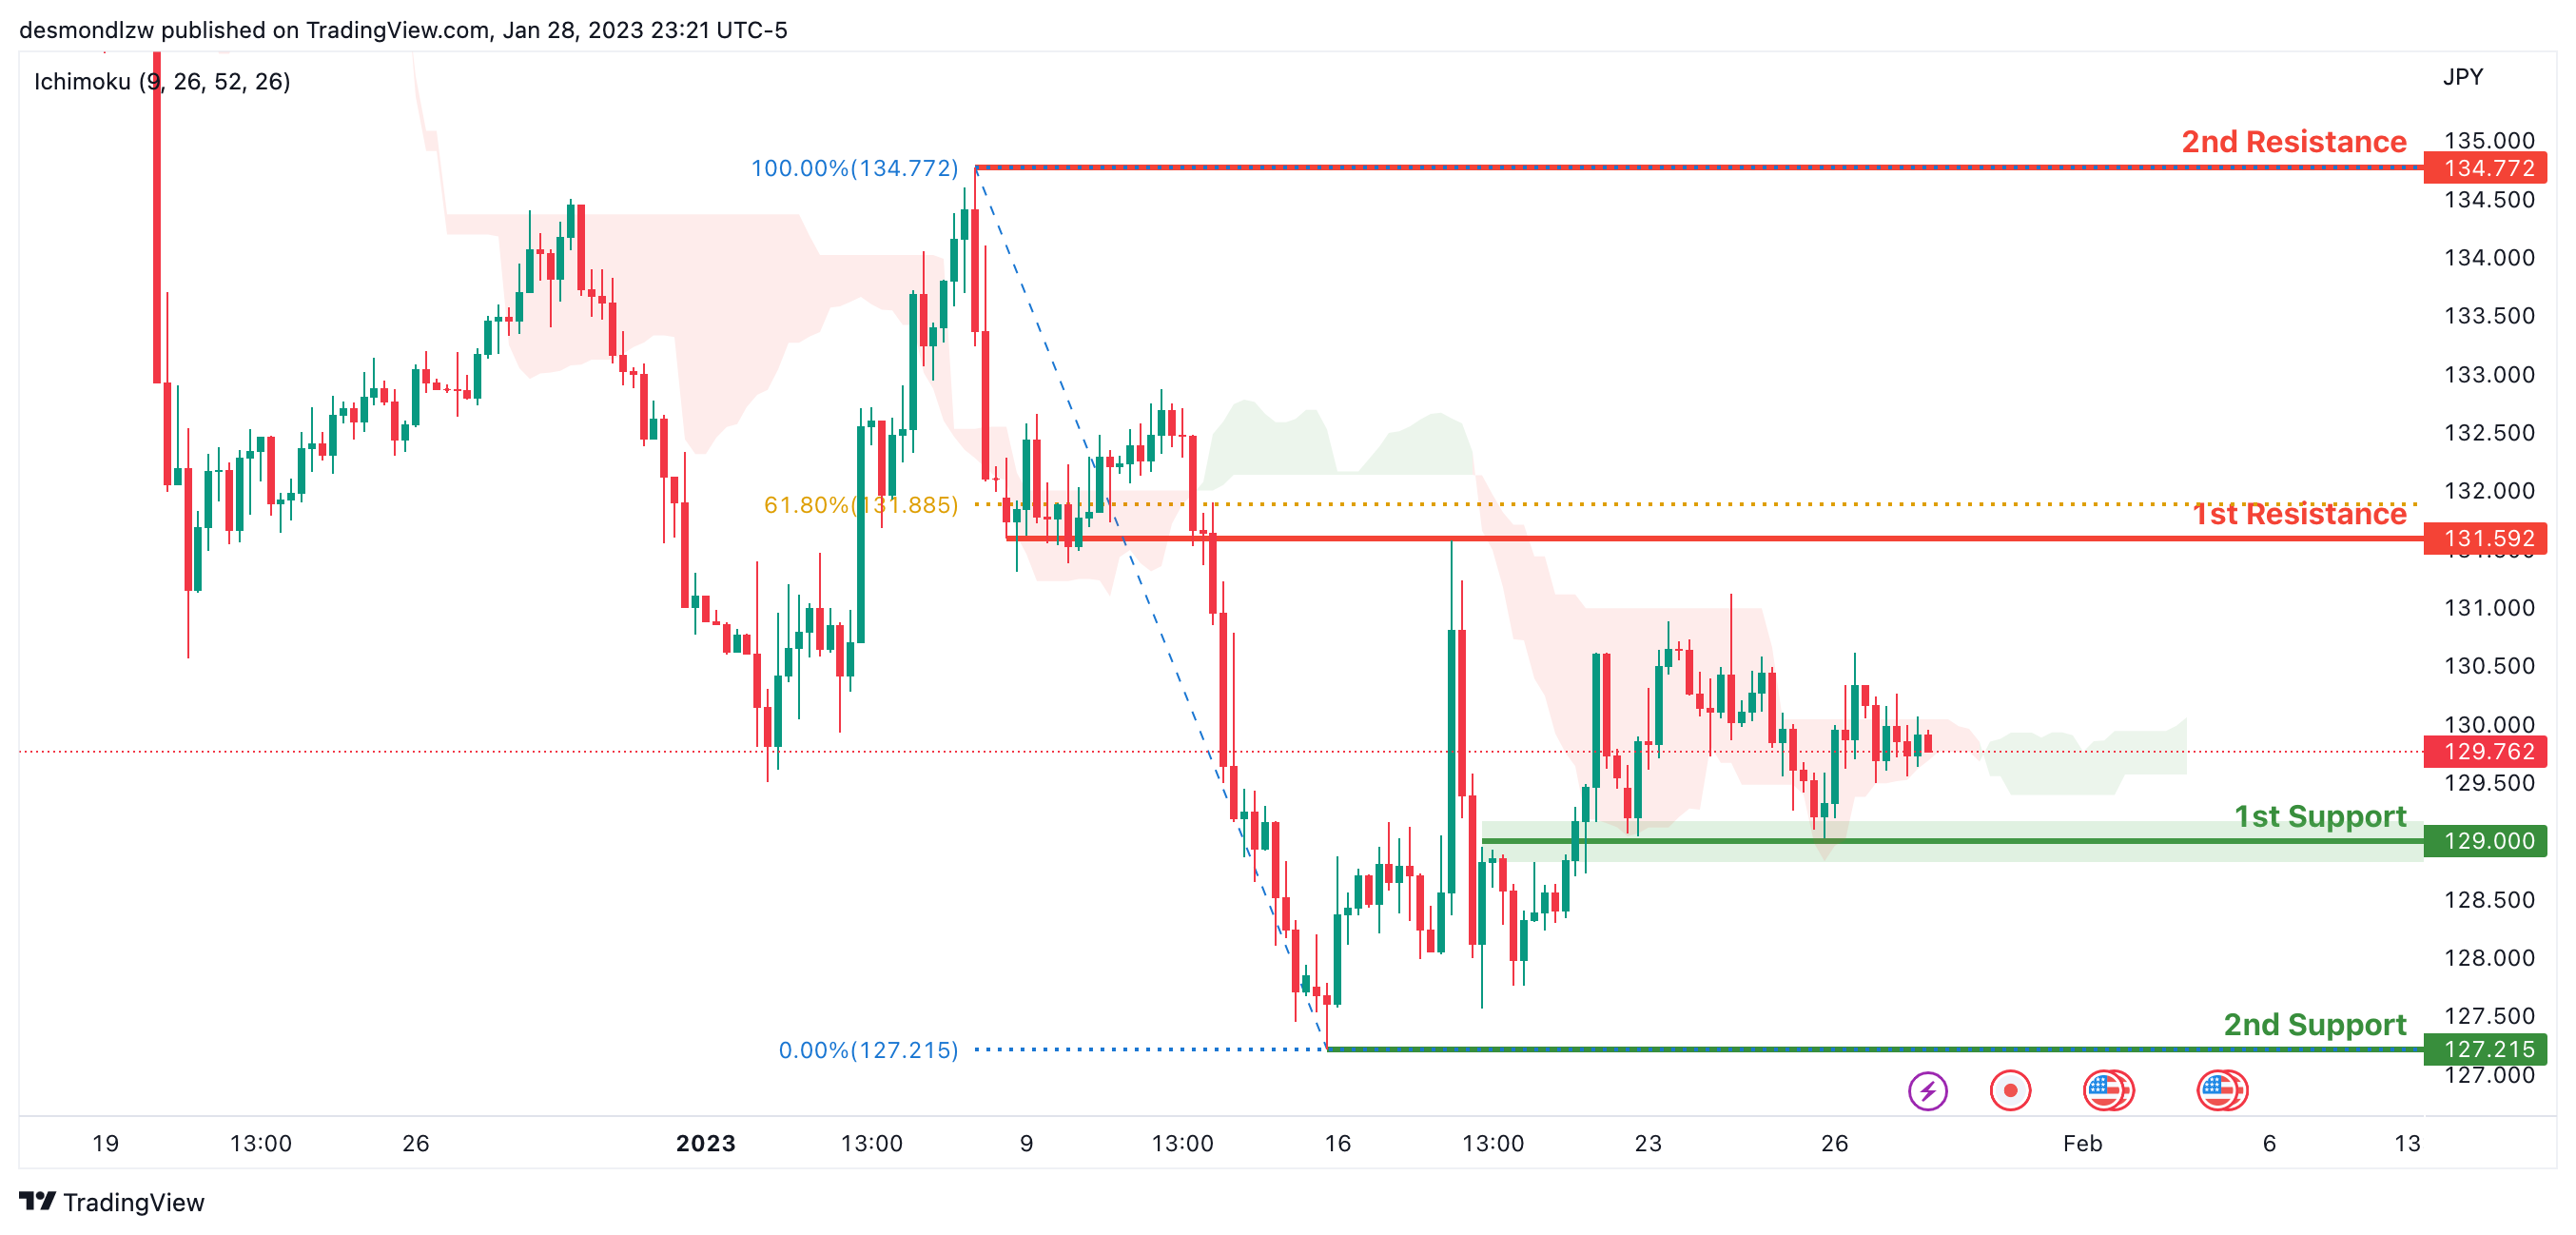
Looking at the H4 chart, my overall bias for USDJPY is bullish due to the current price crossing above the Ichimoku cloud, indicating a bullish market. If this bullish momentum continues, expect the price to possibly continue heading towards the 1st resistance level at 131.592, where the 61.8% Fibonacci line is. In an alternate scenario, price could possibly head back down to retest the 1st support at 129.000, where the overlap support is.
Areas of consideration:
H4 time frame, 1st resistance at 131.592
H4 time frame, 1st support at 129.000
DXY:
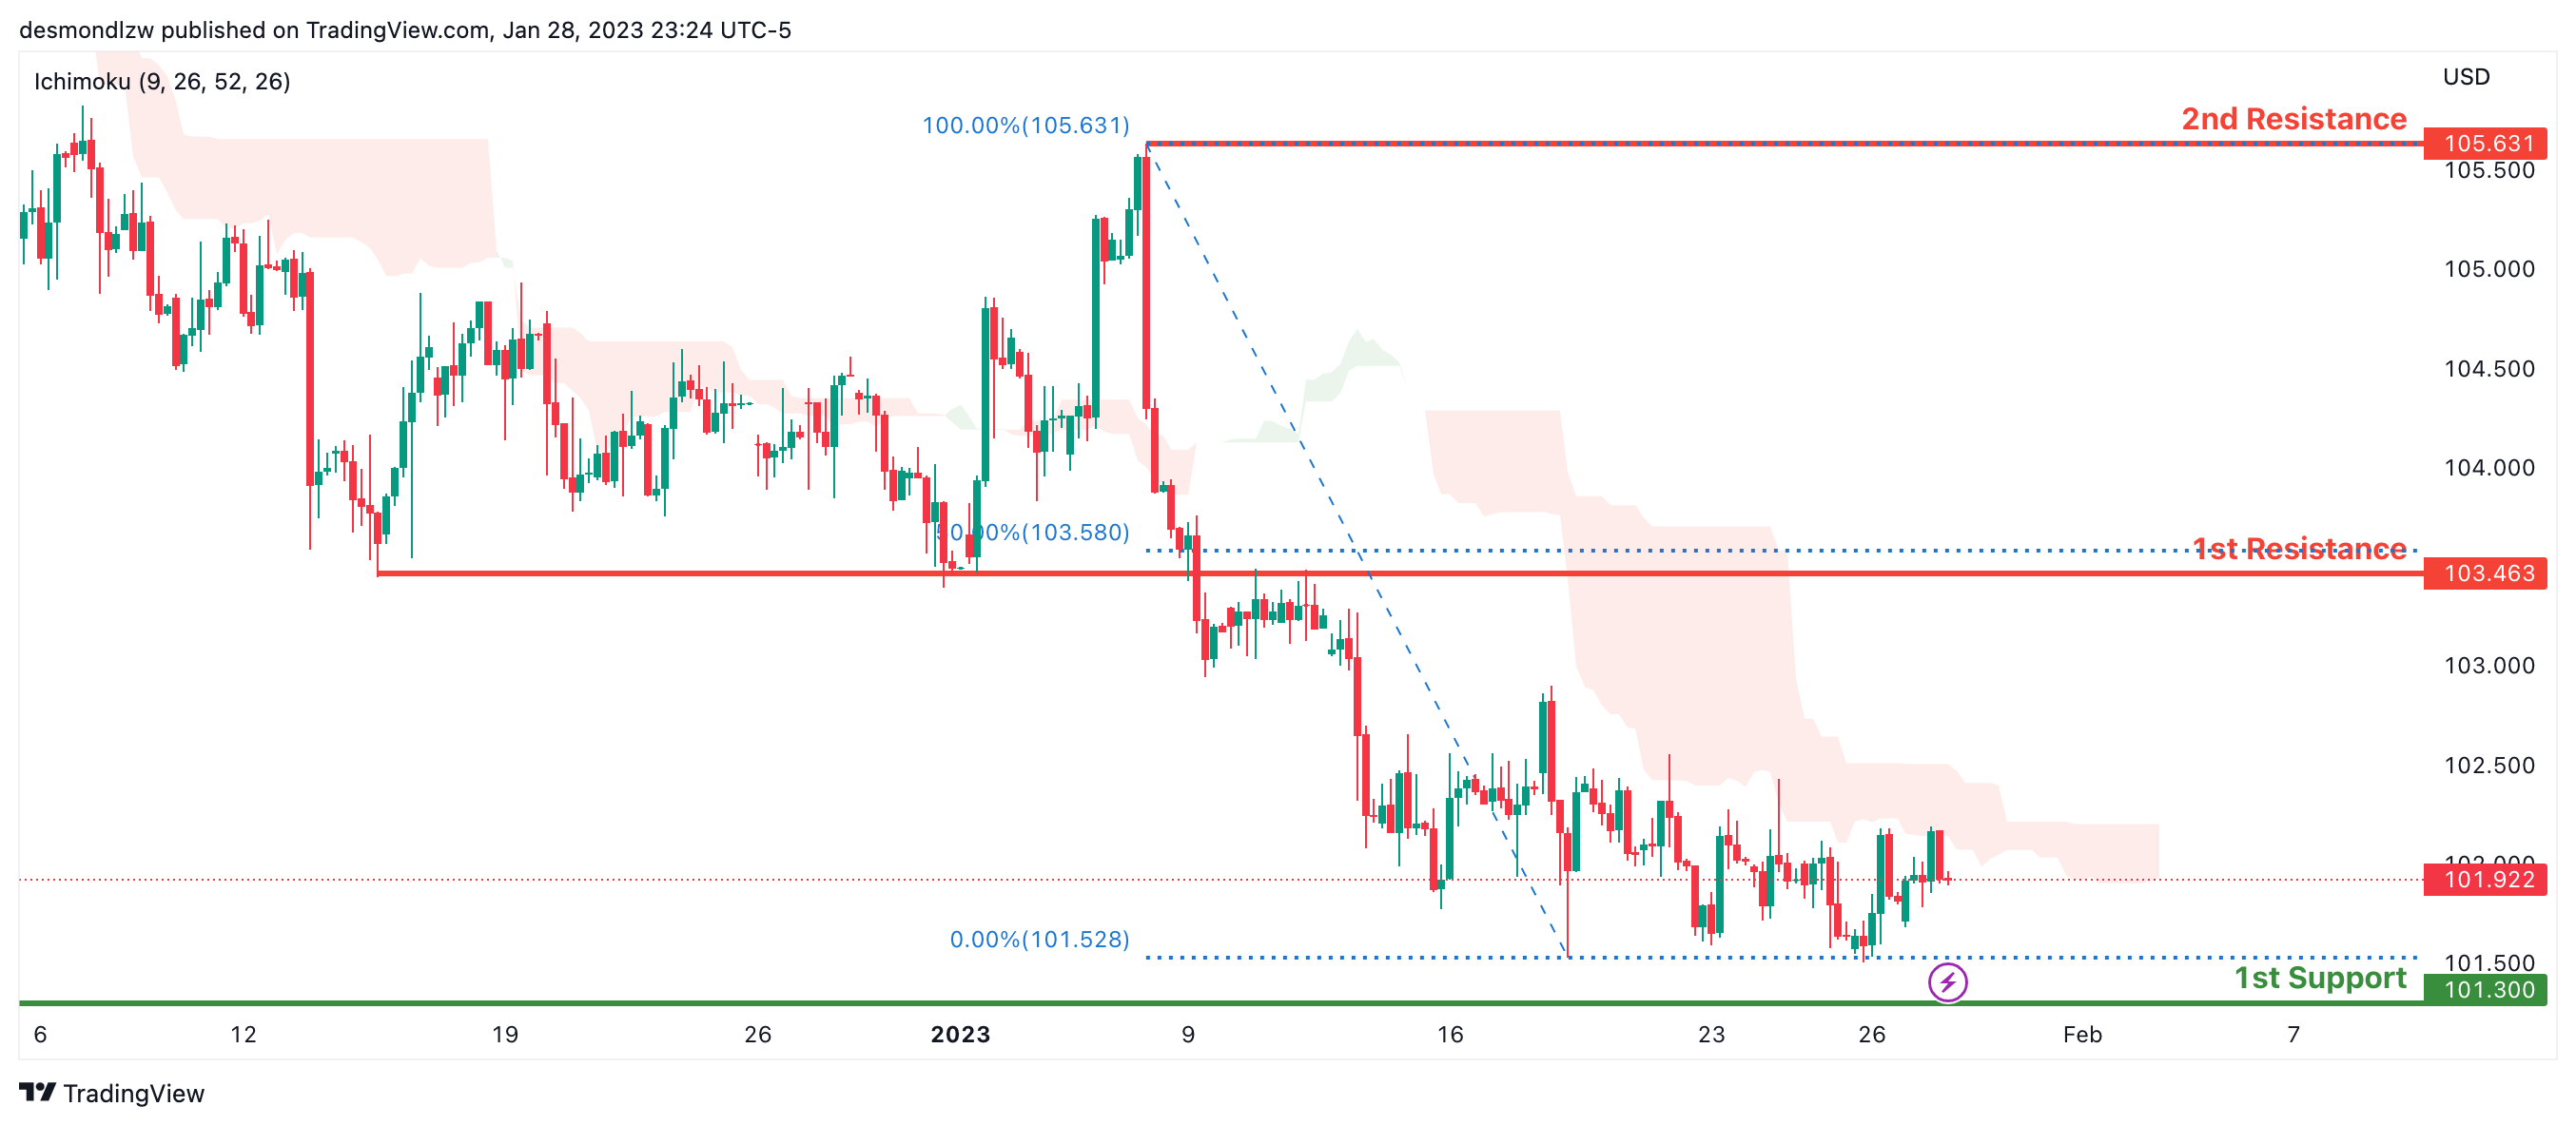
Looking at the H4 chart, my overall bias for DXY is bearish due to the current price being below the Ichimoku cloud, indicating a bearish market. If this bearish momentum continues, expect the price to possibly continue heading towards the 1st support at 101.300, where the previous swing low is. In an alternative scenario, price could head back up to retest the 1st resistance at 103.463, where the overlap resistance and 50% Fibonacci line is.
Areas of consideration:
H4 time frame, 1st resistance at 103.463
H4 time frame, 1st support at 101.300
EUR/USD:
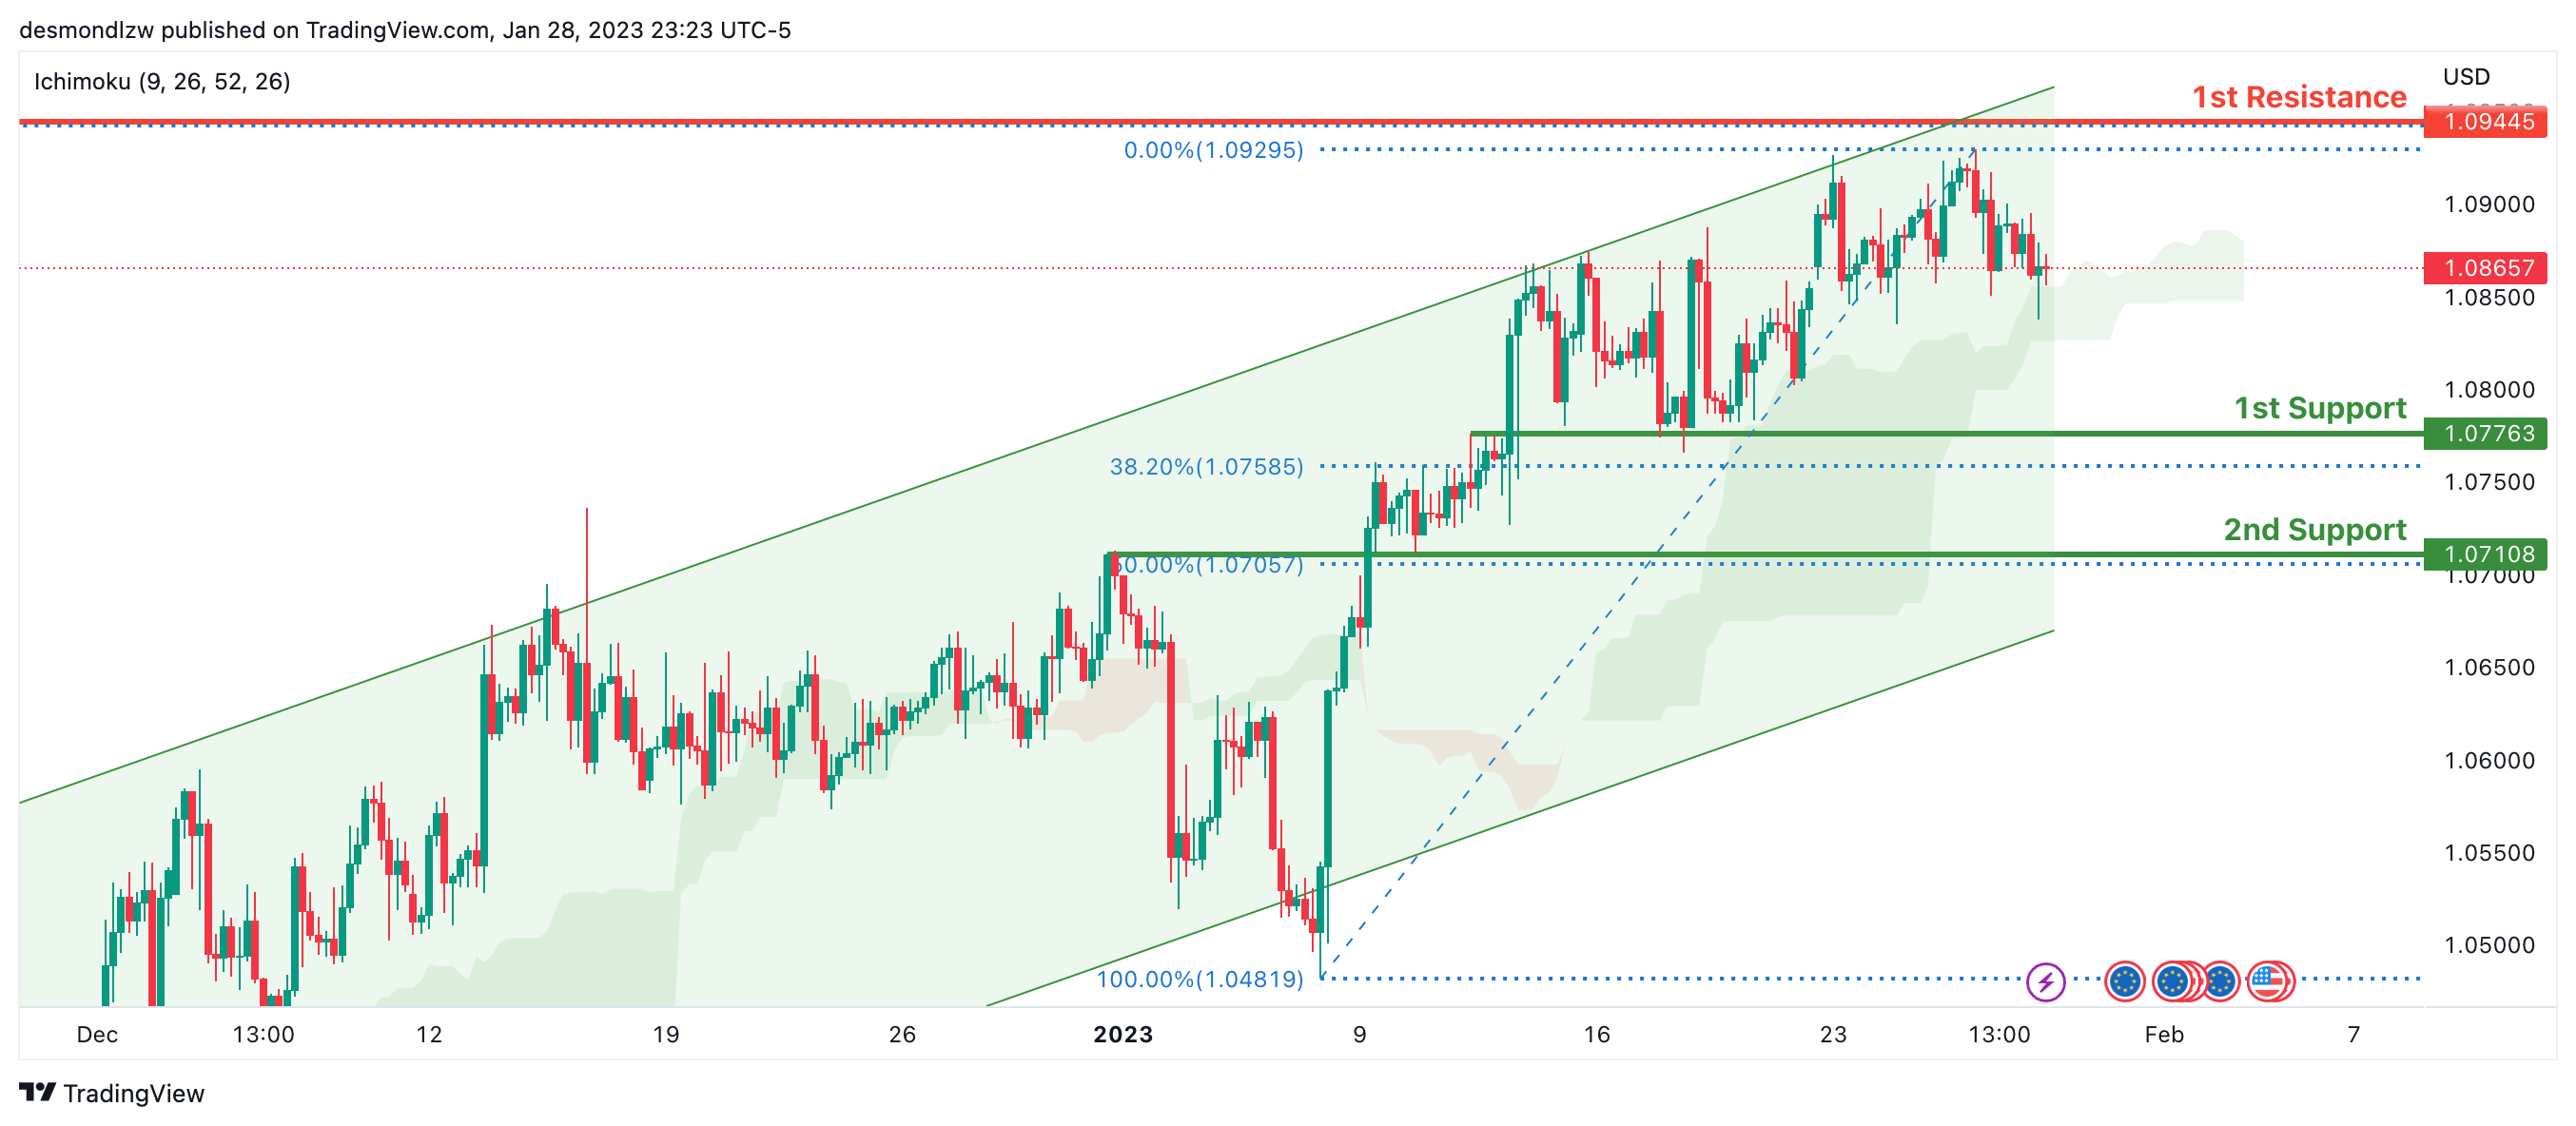
Looking at the H4 chart, my overall bias for EURUSD is bullish due to the current price being above the Ichimoku cloud, indicating a bullish market structure. To add confluence to this bias, price is also within an ascending channel. If this bullish momentum continues, expect the price to possibly continue heading towards the 1st resistance at 1.09445, where the 50% Fibonacci line is. In an alternate scenario, price could possibly head back down to retest the 1st support level at 1.07763, where the 38.2% Fibonacci line is.
Areas of consideration :
H4 1st resistance at 1.09445
H4 1st support at 1.07763
GBP/USD:
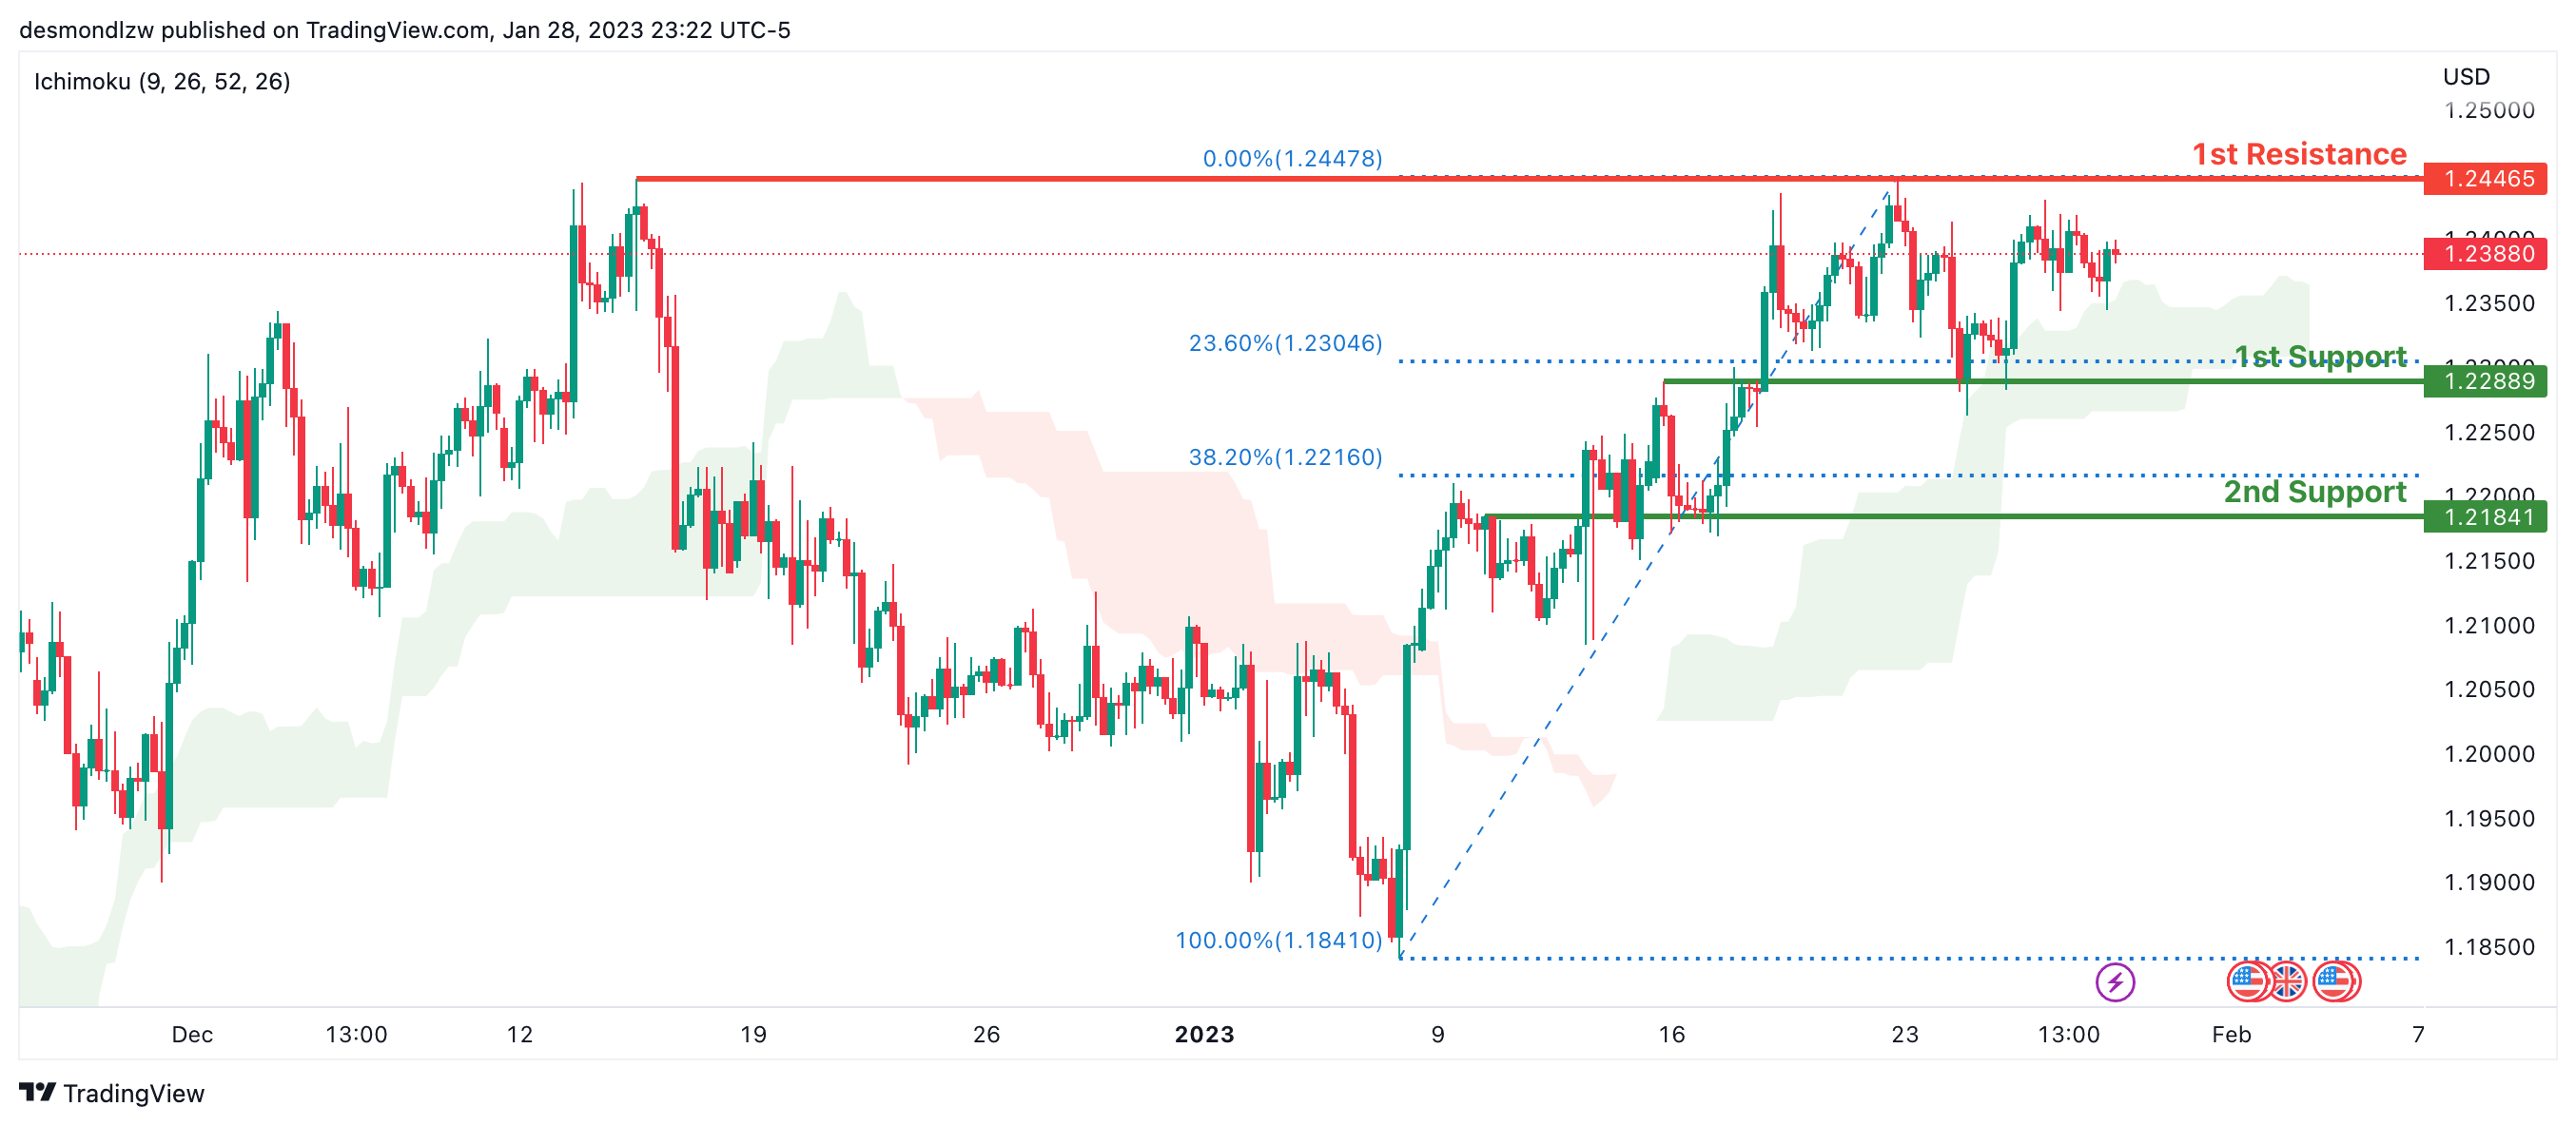
Looking at the H4 chart, my overall bias for GBPUSD is bullish due to the current price being above the Ichimoku cloud, indicating a bullish market. If this bullish momentum continues, expect price to possibly continue heading towards the 1st resistance line at 1.24465, where the previous swing high is. In an alternate scenario, price could possibly head back down and retest the 1st support at 1.22889, where the 23.6% Fibonacci line is.
Areas of consideration:
H4 1st resistance at 1.24465
H4 1st support at 1.22889
USD/CHF:
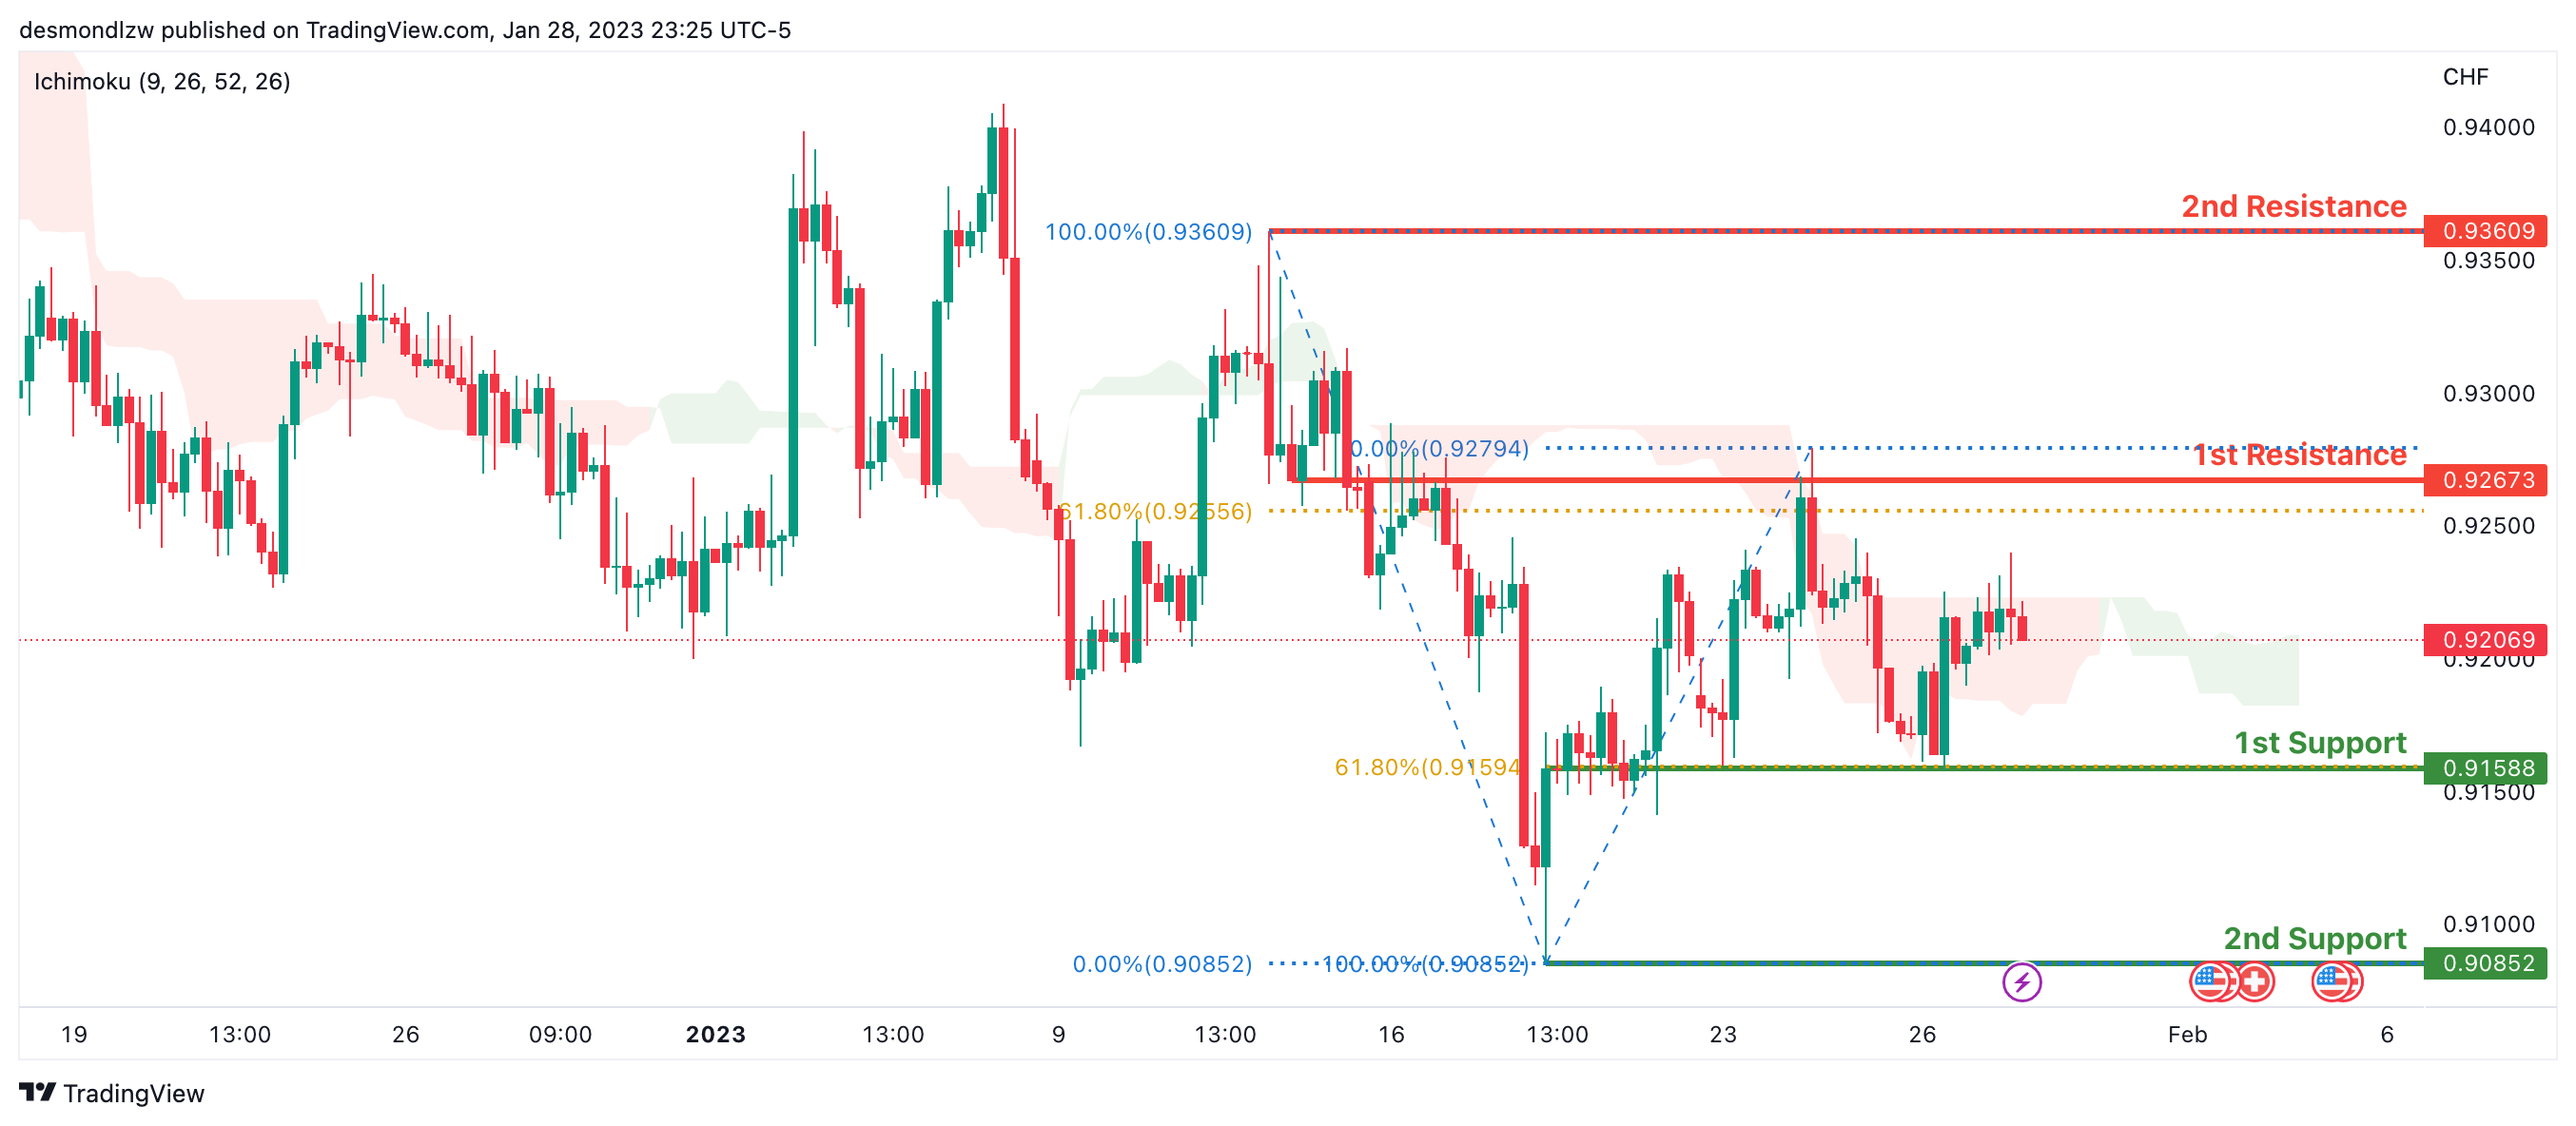
Looking at the H4 chart, my overall bias for USDCHF is bearish due to the current price crossing below the Ichimoku cloud, indicating a bearish market. If the current bearish trend continues, expect the price to possibly continue to head towards the 1st support at 0.91588, where the 61.8% Fibonacci line is. In an alternative scenario, price could possibly head back up to retest the 1st resistance at 0.92673, where the 61.8% Fibonacci line is.
Areas of consideration
H4 1st support at 0.91588
H4 1st resistance at 0.92673
XAU/USD (GOLD):
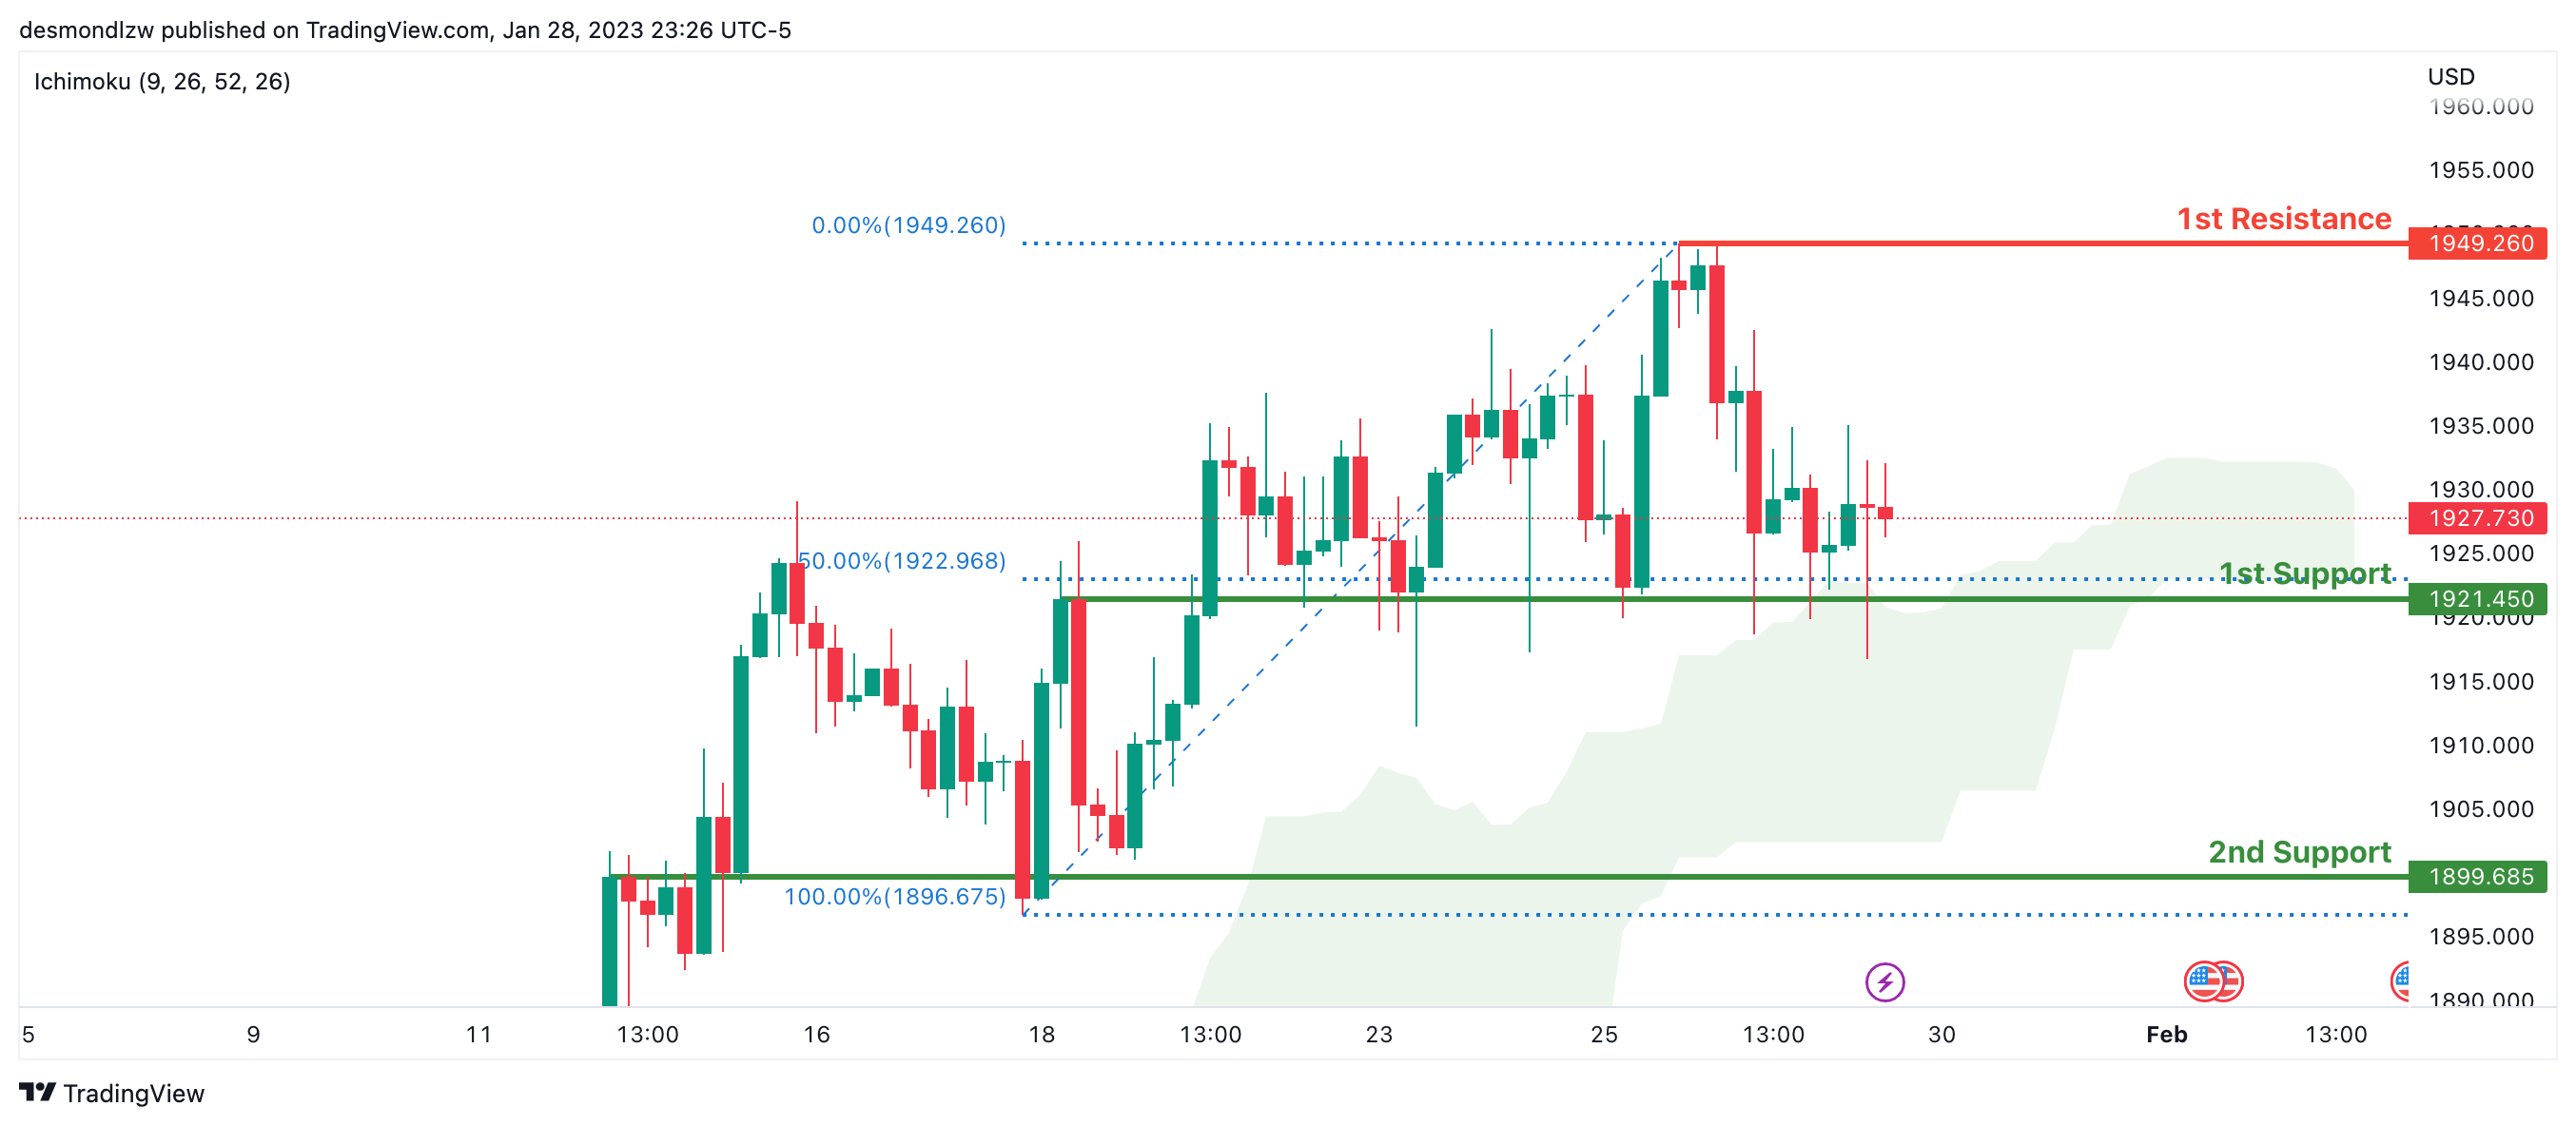
Looking at the H4 chart, my overall bias for XAUUSD is bullish due to the current price being above the Ichimoku cloud, indicating a bullish market. If this bullish momentum continues, expect the price to possibly continue heading towards the 1st resistance at 1949.260, where the recent swing high is. In an alternative scenario, price could possibly head back down to retest the 1st support at 1921.450 where the 50% Fibonacci line is.
Areas of consideration:
H4 time frame, 1st resistance at 1949.2
AUD/USD:
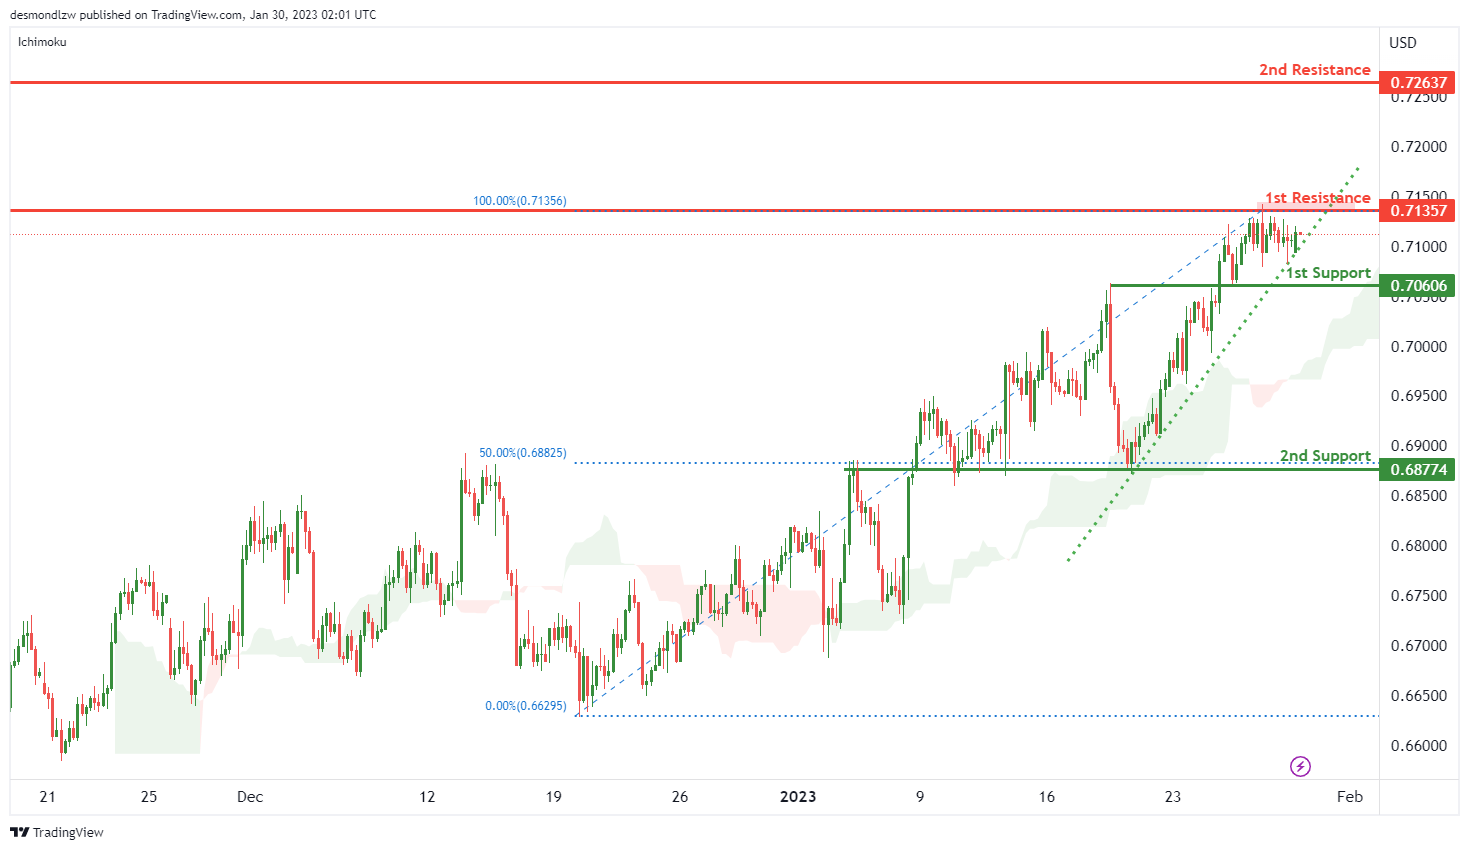
Looking at the H4 chart, my overall bias for AUDUSD is bullish due to the current price being above the Ichimoku cloud, indicating a bullish market. To add confluence to this bias, there is an ascending trend line. If this bullish momentum continues, expect price to possibly break through the 1st resistance at 0.71357 and head towards 2nd resistance is at 0.72637.
In an alternate scenario, the price could possibly go back down towards the 1st support level at 0.70606 which is an overlap support, and the 2nd support at 0.68774 where the 50% Fibonacci line is located.
Areas of consideration
H4 , 2nd resistance at 0.72637.
H4. 1st resistance at 0.71357
H4, 1st support at 0.70606
H4, 1st support at 0.68774
NZD/USD:
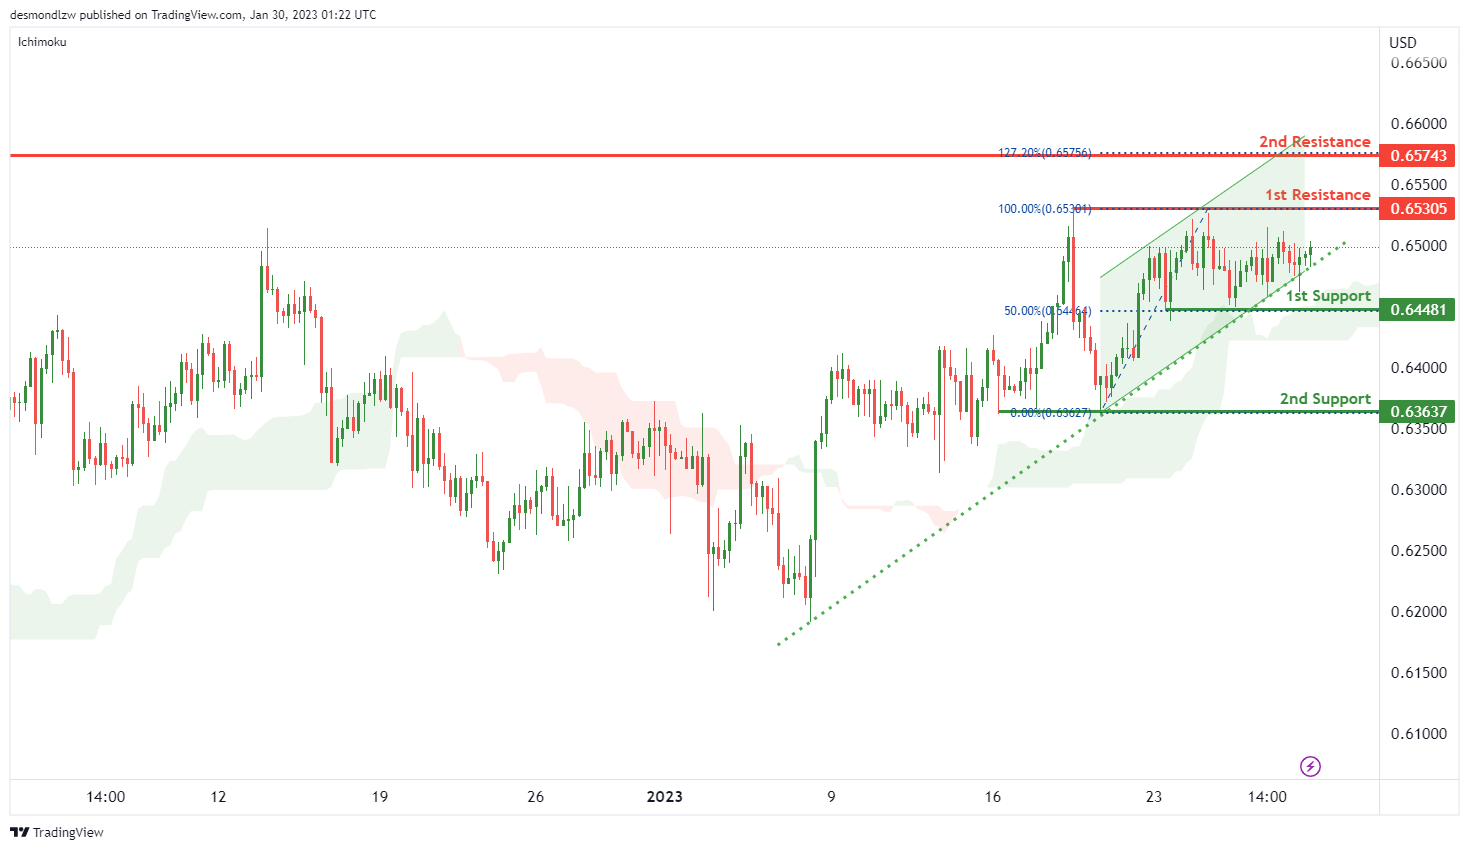
Looking at the H4 chart, my overall bias for NZDUSD is bullish due to the current price being above the Ichimoku cloud, indicating a bullish market. To add confluence to this bias, there is an ascending channel. If this bullish momentum continues, expect price to possibly head towards the 1st resistance at 0.65305 which is the recent swing high, and 2nd resistance is at 0.65743, where the 127% Fibonacci line is located.
In an alternate scenario, price could possibly head back down towards the 1st support level at 0.64481, where the 50% Fibonacci line is located. 2nd support is at 0.63637 which is the recent swing low.
Areas of consideration:
H4 time frame, 2nd resistance at 0.65743
H4 time frame, 1st resistance at 0.65305
H4 time frame, 1st support at 0.64481
H4 time frame, 2nd support at 0.63637
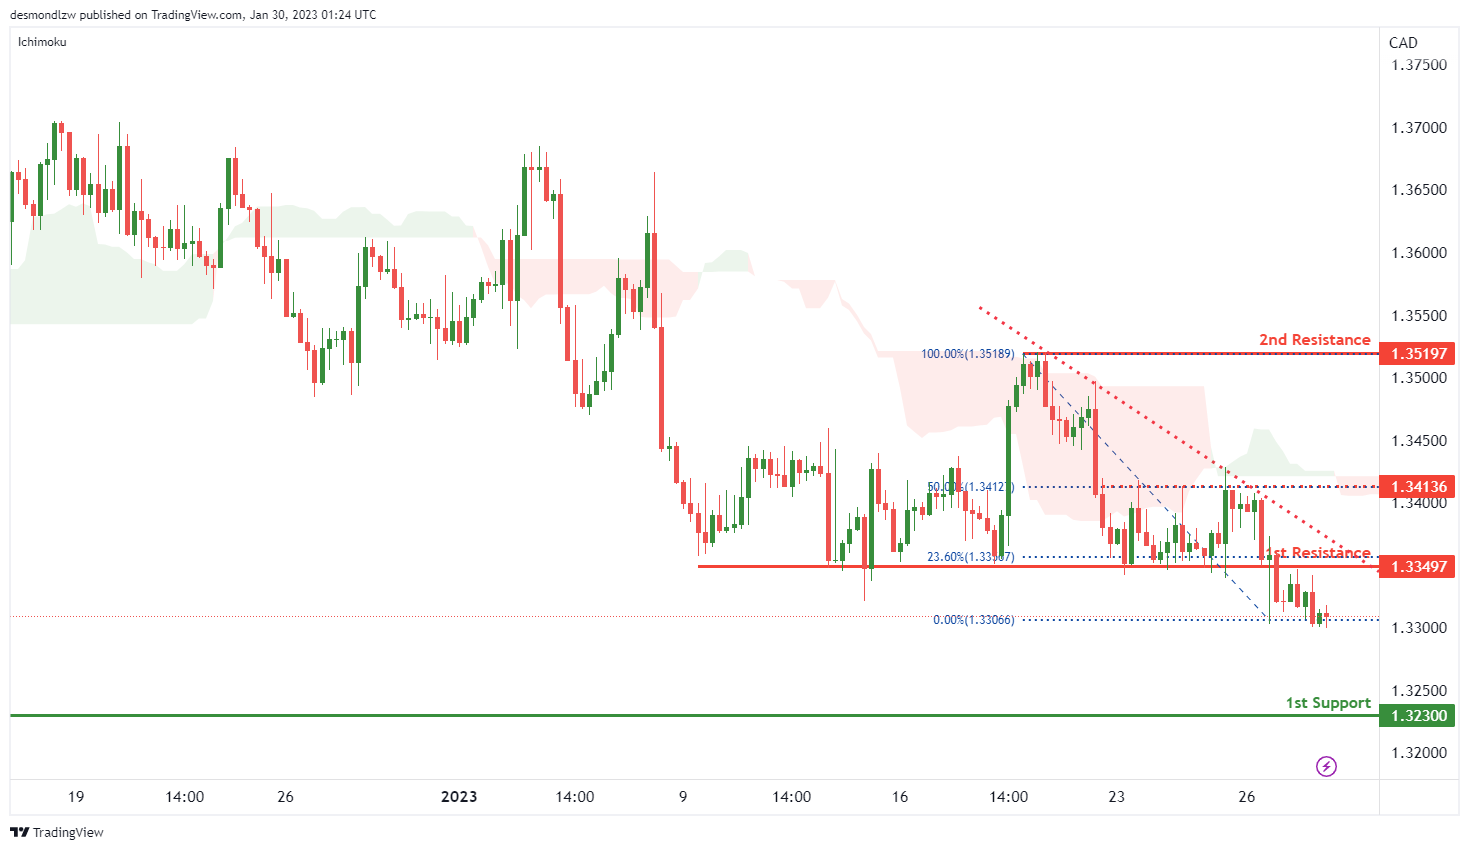
USD/CAD:
Looking at the H4 chart, my overall bias for USDCAD is bearish, due to the current price below the Ichimoku cloud, and there is a descending trend line add confluence to my bias. If this bearish momentum continues, expect the price to possibly continue heading towards the 1st support at 1.32263 which is recent swing low.
In an alternative scenario, price could possibly head up to the 1st resistance at 1.33497 which is in line with the 23.6% Fibonacci line. The 2nd resistance is at 1.35179 which is the recent swing high. There is an intermediate resistance at 1.34136 which is in line with 50% Fibonacci line.
Areas of consideration:
H4 time frame, 2nd resistance at 1.34802
H4 time frame, intermediate resistance at 1.34136
H4 time frame, 1st resistance at 1.33497
H4 time frame, 1st support at 1.32263
H4 time frame, 2nd support at 1.33138
OIL:
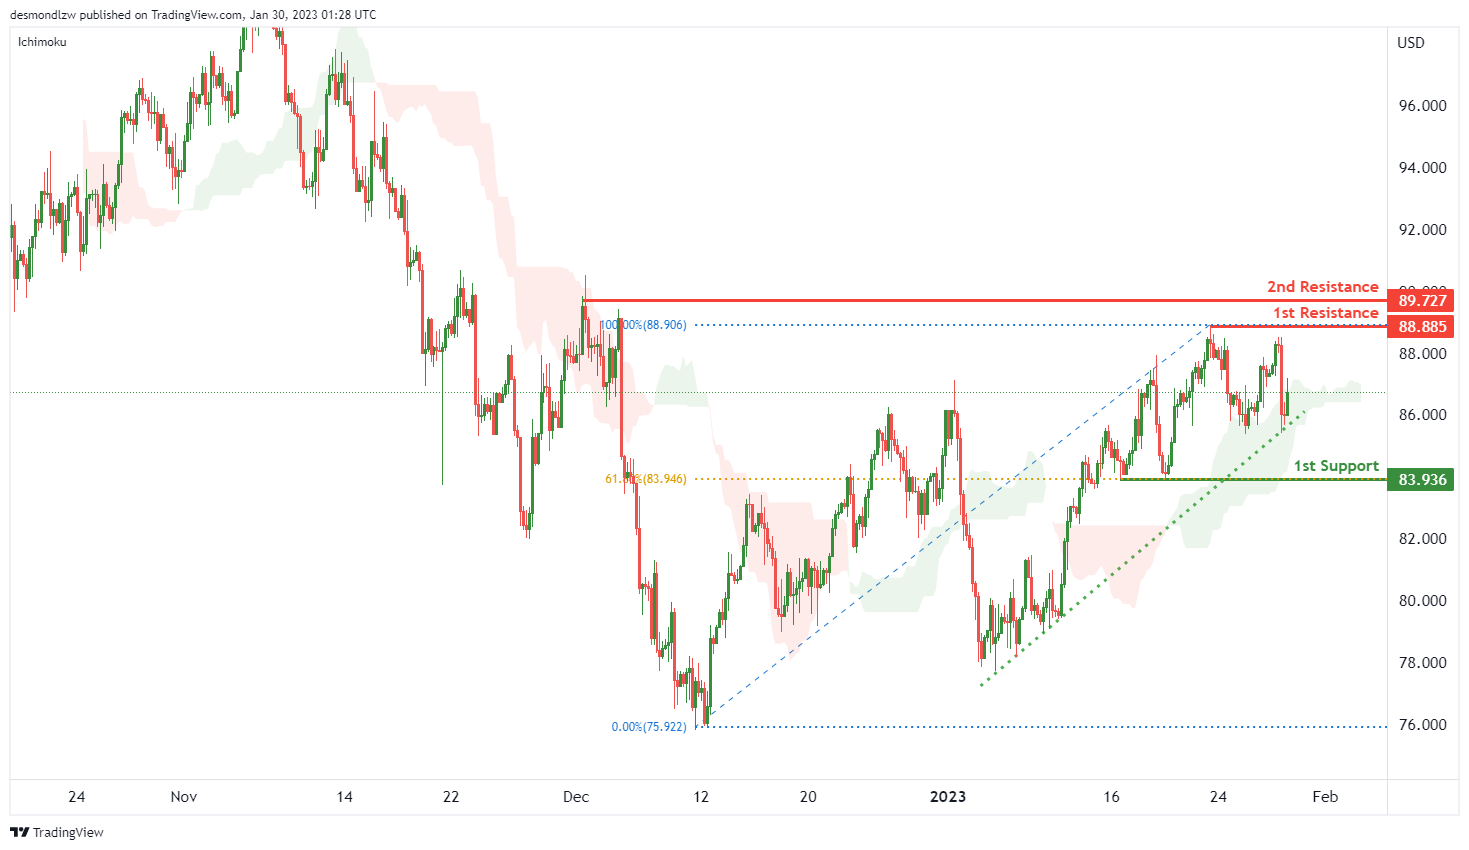
Looking at the H4 chart, my overall bias for BOC is bullish due to the current price being above the Ichimoku cloud, indicating a bullish market. To add confluence to this bias, there is an ascending trend line. If this bullish momentum continues, expect price to possibly head towards the 1st resistance at 88.885, where is the recent swing high. 2nd resistance is at 89.727.
In an alternate scenario, price could possibly head back down towards the 1st support level at 83.936, where the 50% Fibonacci line is located.
Areas of consideration:
H4 time frame, 2nd resistance at 89.727.
H4 time frame, 1st resistance at 88.885
H4 time frame,1st support at 83.936,
Dow Jones Industrial Average:
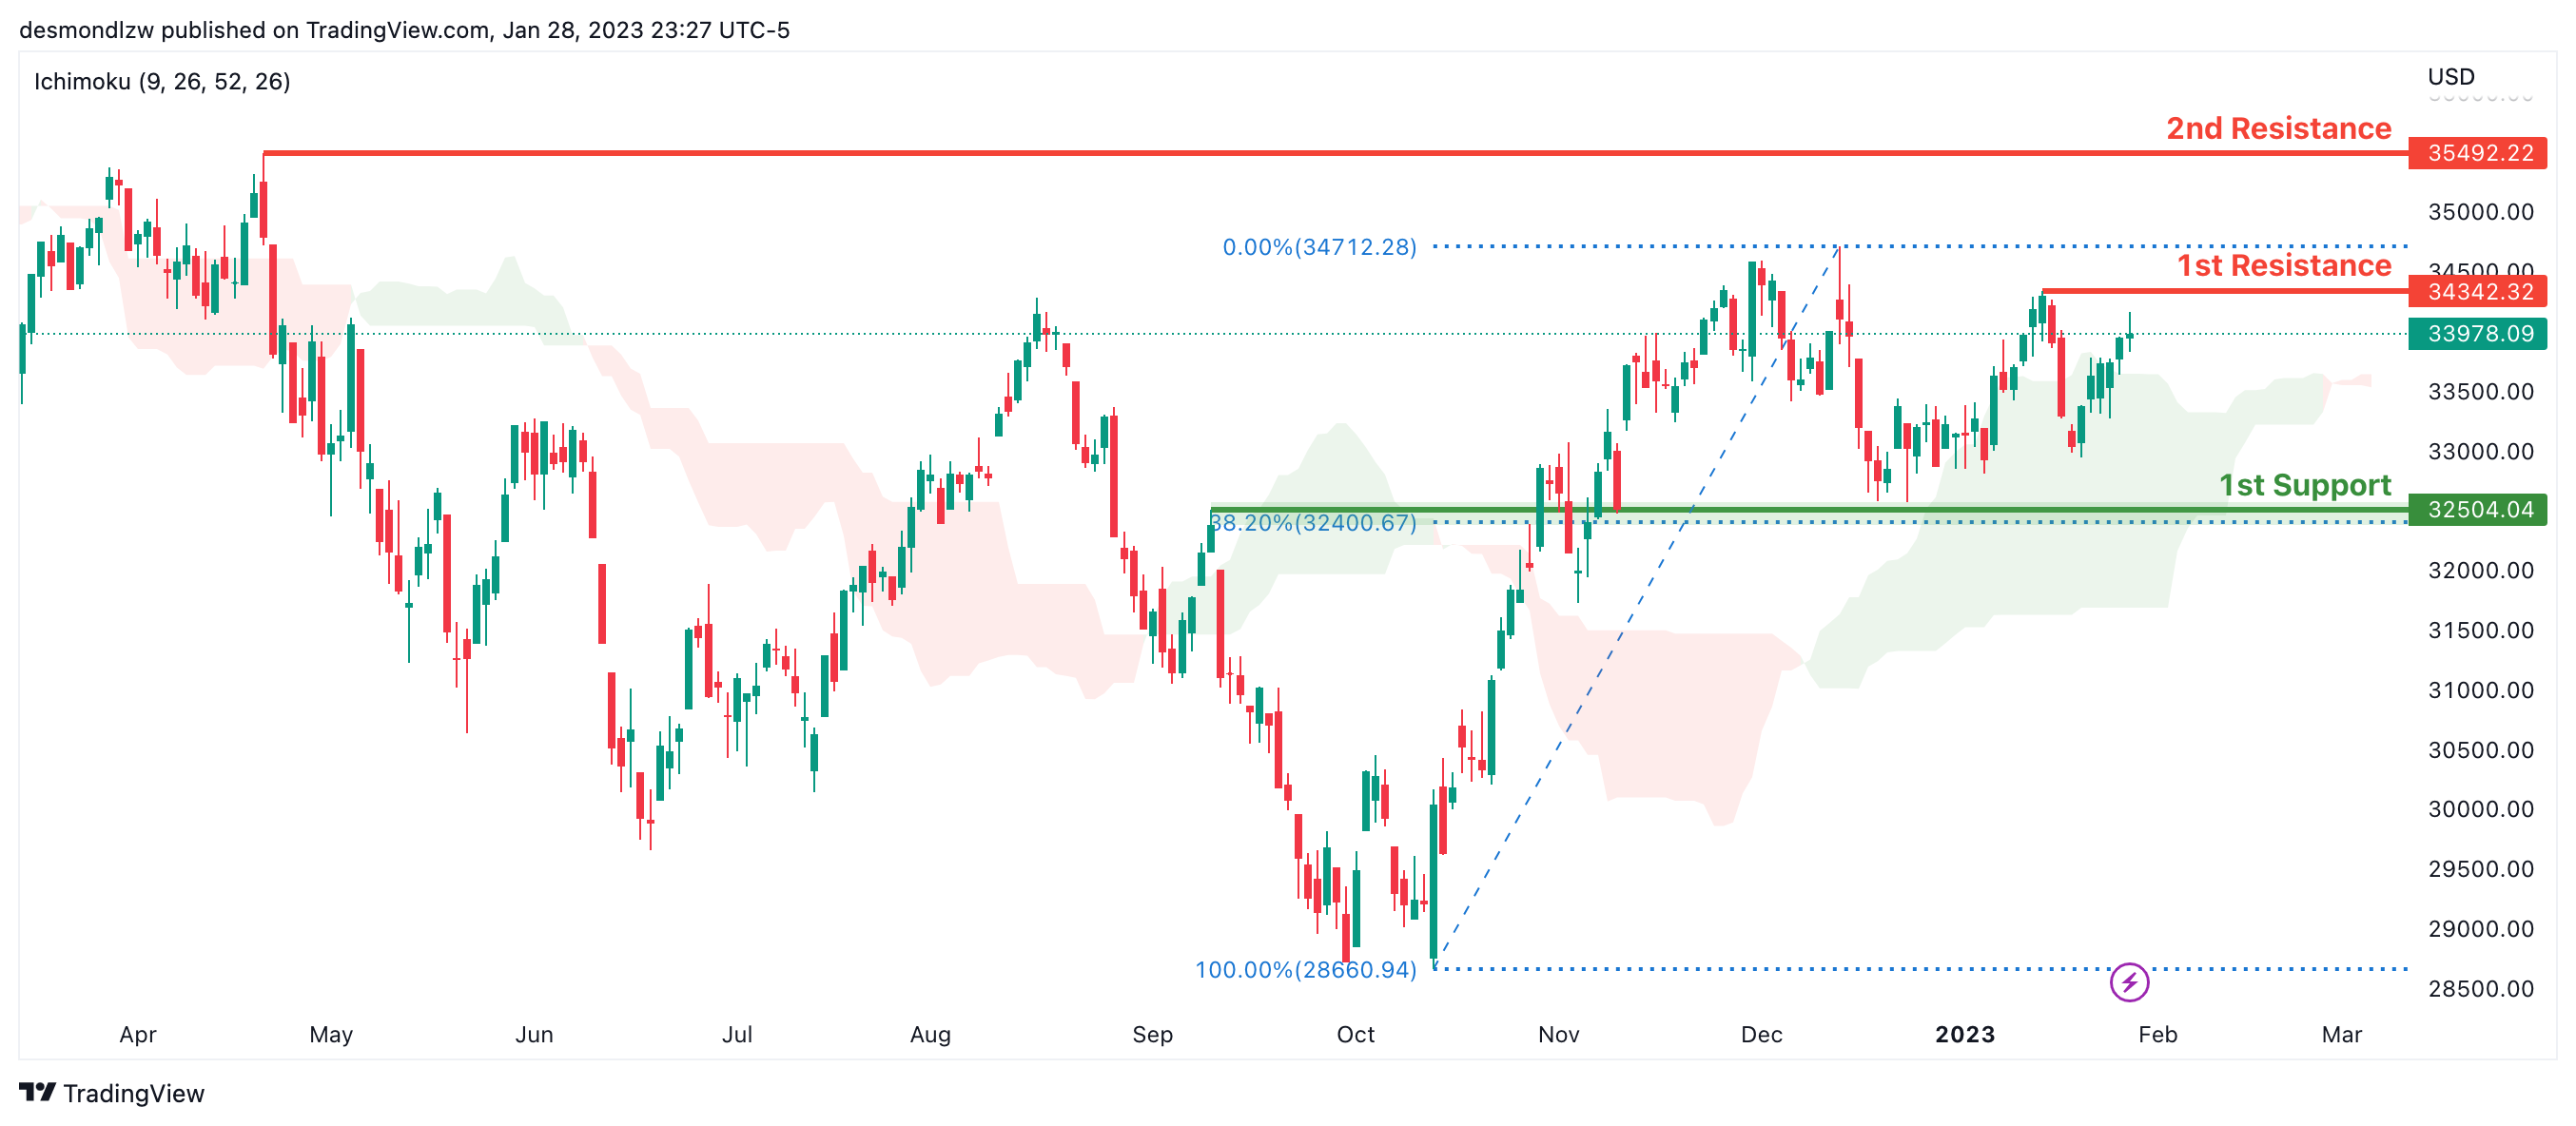
On the Daily chart, the overall bias for DJI is bullish. To add confluence to this, the price is crossing above the Ichimoku cloud which indicates a bullish market. If this bullish momentum continues, expect the price to possibly continue heading towards the 1st resistance line at 34342.32, where the recent swing high is. In an alternative scenario, price could possibly head back down towards the 1st support at 32581.97, slightly above where the 38.2% Fibonacci line is.
Areas of consideration:
H4 time frame, 1st support at 32581.97
H4 time frame, 1st Resistance at 34342.32
DAX:
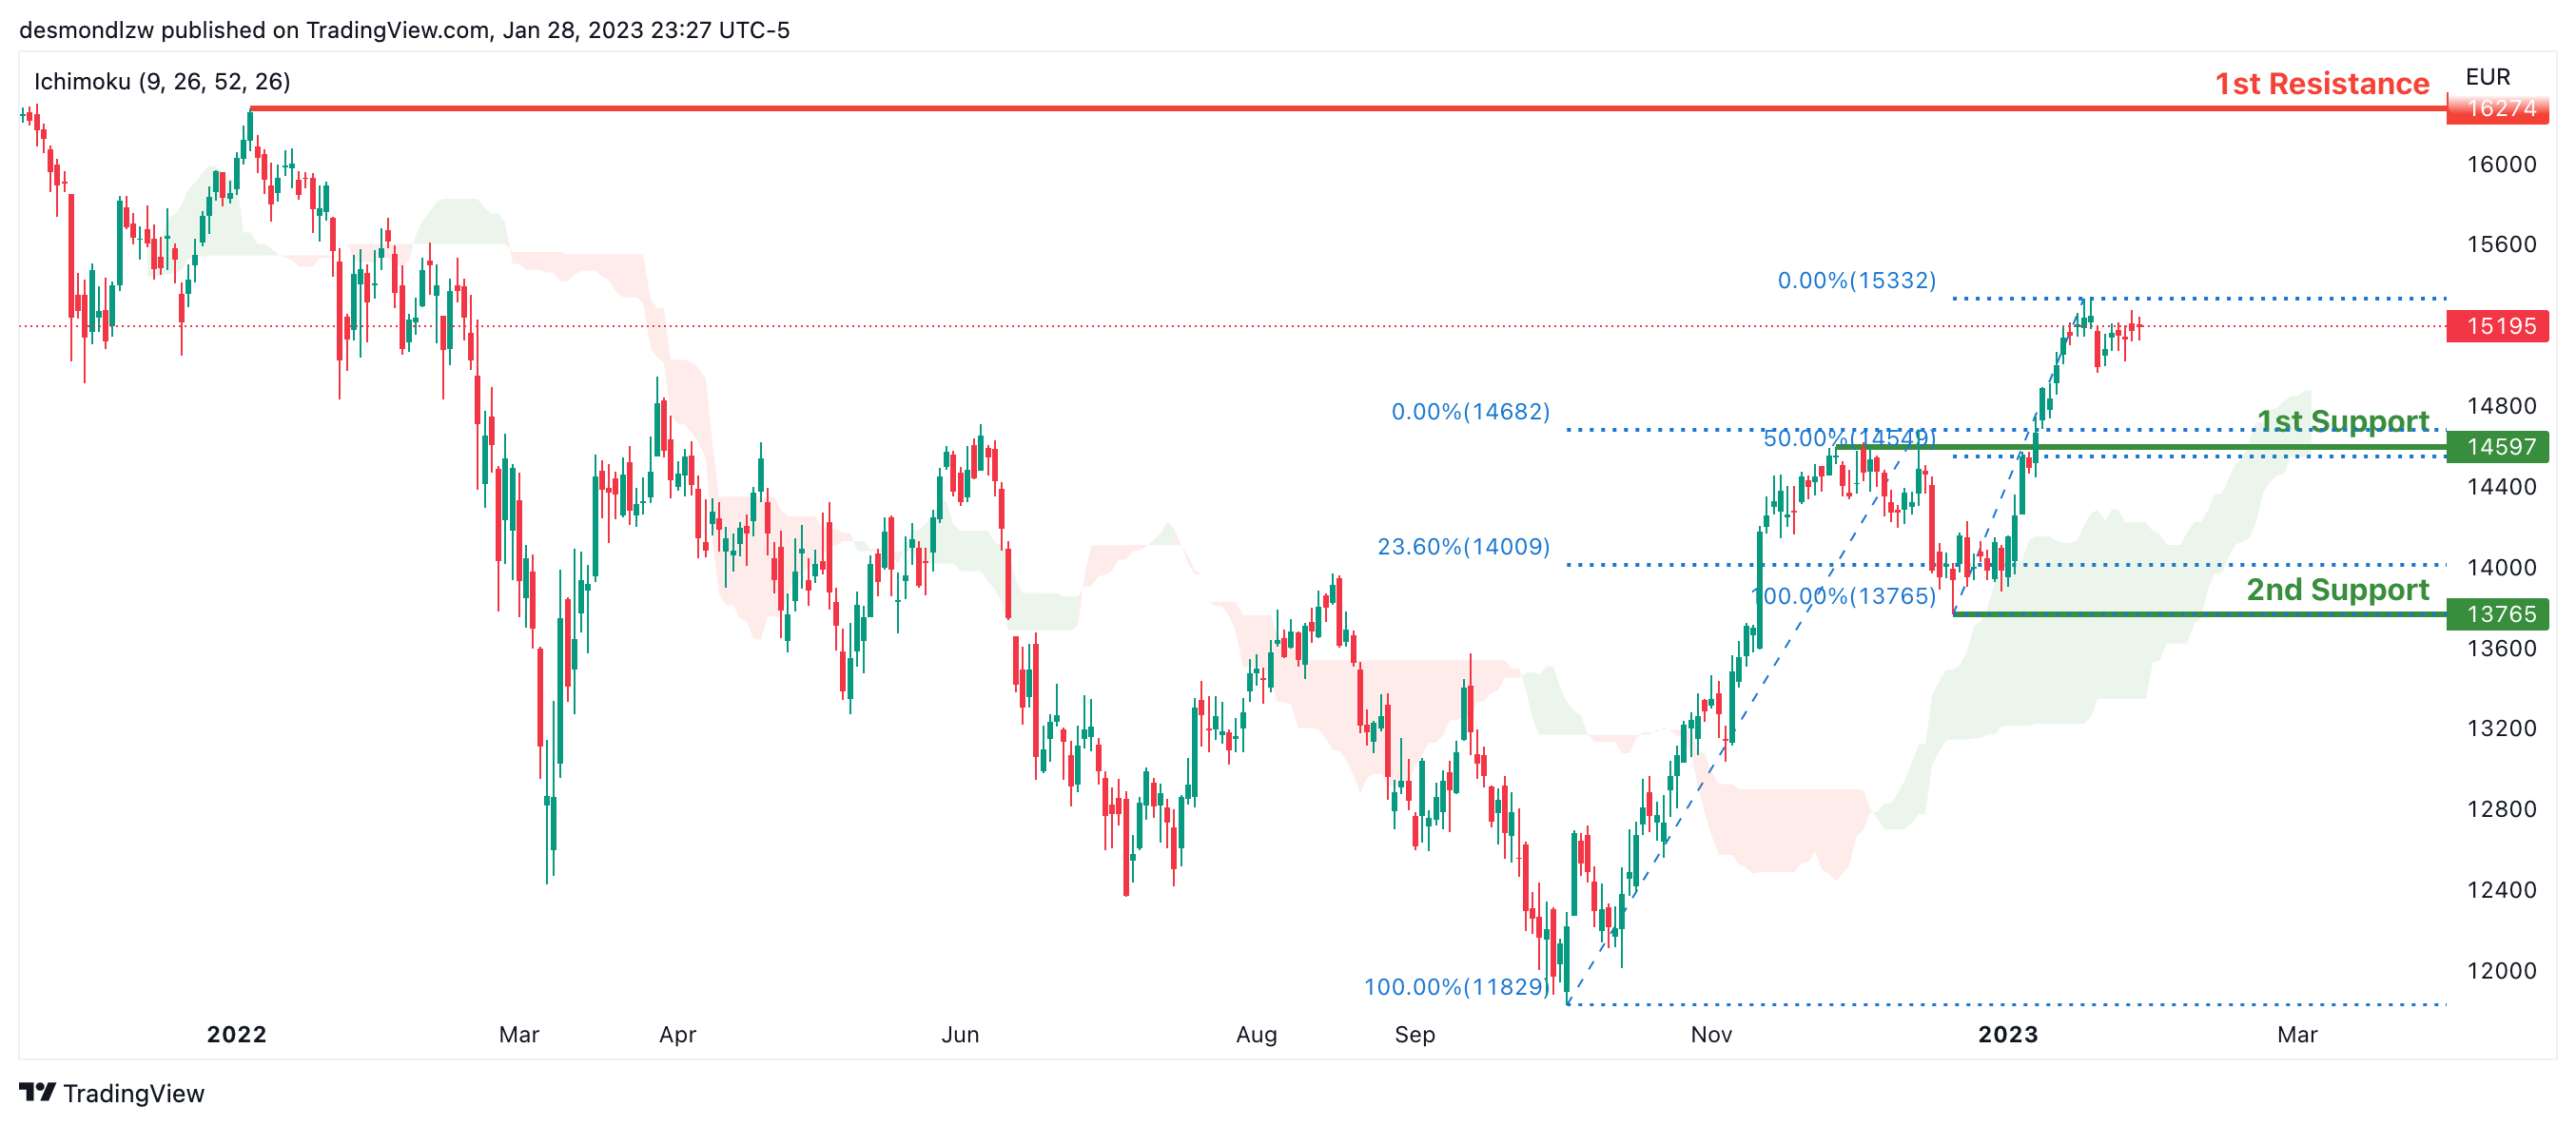
Looking at the Daily chart, my overall bias for DAX is bullish due to the current price crossing above the Ichimoku cloud, indicating a bullish market. If this bullish momentum continues, expect the price to possibly head towards the 1st resistance line at 16274, where the previous swing high is. In an alternative scenario, price could possibly head down to retest the 1st support at 14597, where the 50% Fibonacci line is.
Areas of consideration:
H4 time frame, 1st resistance is at 16274
H4 time frame, 1st support is at 14597
ETHUSD:
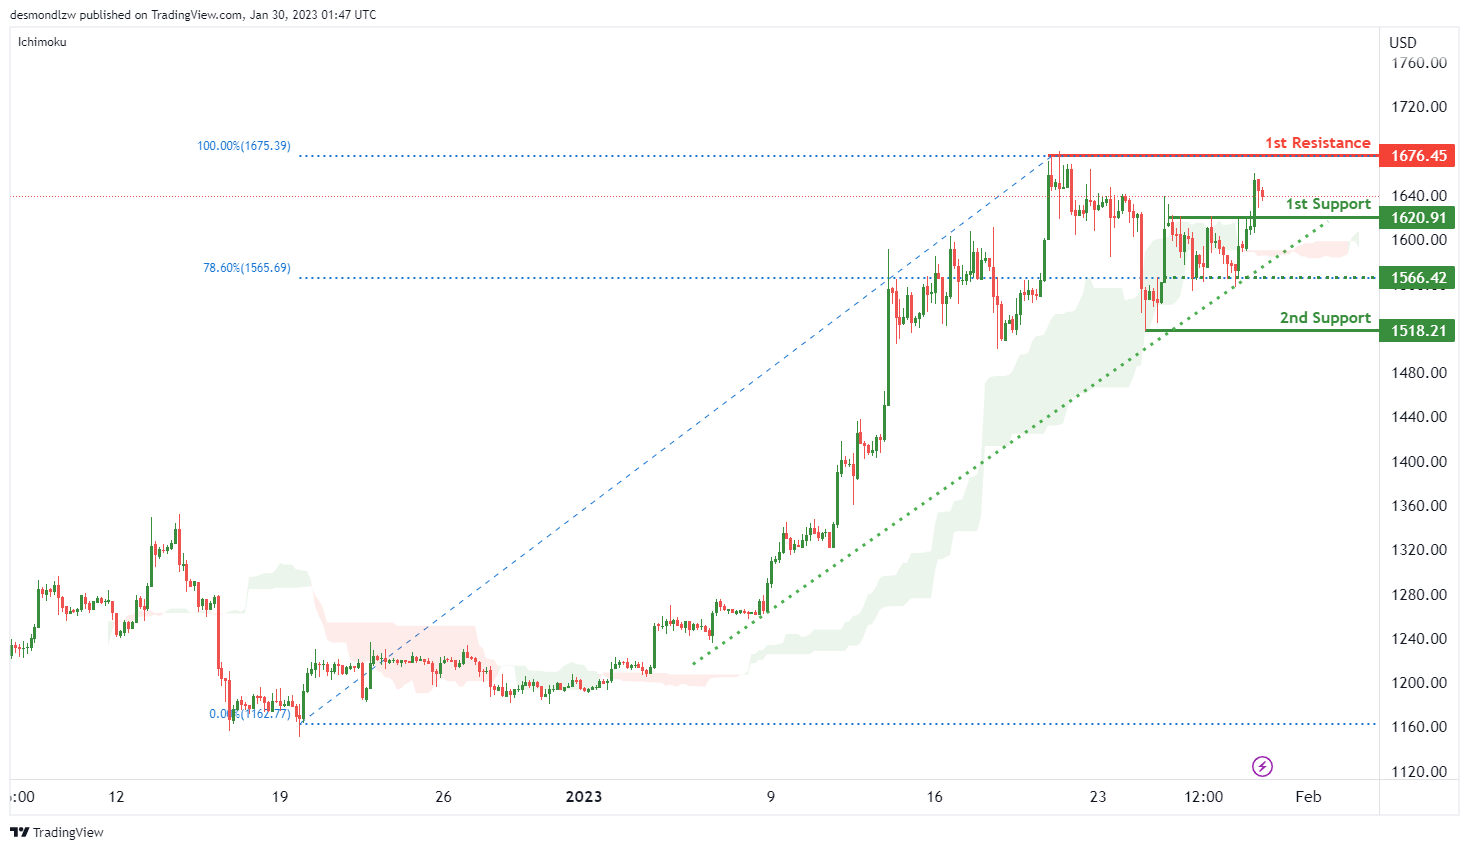
Looking at the H4 chart, my overall bias for ETHUSD is bullish, as the current price is above the Ichimoku cloud and a descending trend line add confluence to my bias.The price may break the 1st resistance at 1676.45 which is the recent swing high.
The price may break the 1st support at 1620.91 and head towards the intermediate support at 1566.42 which is in line with 78.6% Fibonacci line. The 2nd support at 1518.21 which is the recent swing low.
Areas of consideration:
H4 time frame, 1st resistance of 1676.45
H4 time frame, 1st support at 1620.91
H4 time frame, intermediate support at 1566.42
H4 time frame, 2nd support at 1518.21
BTCUSD:
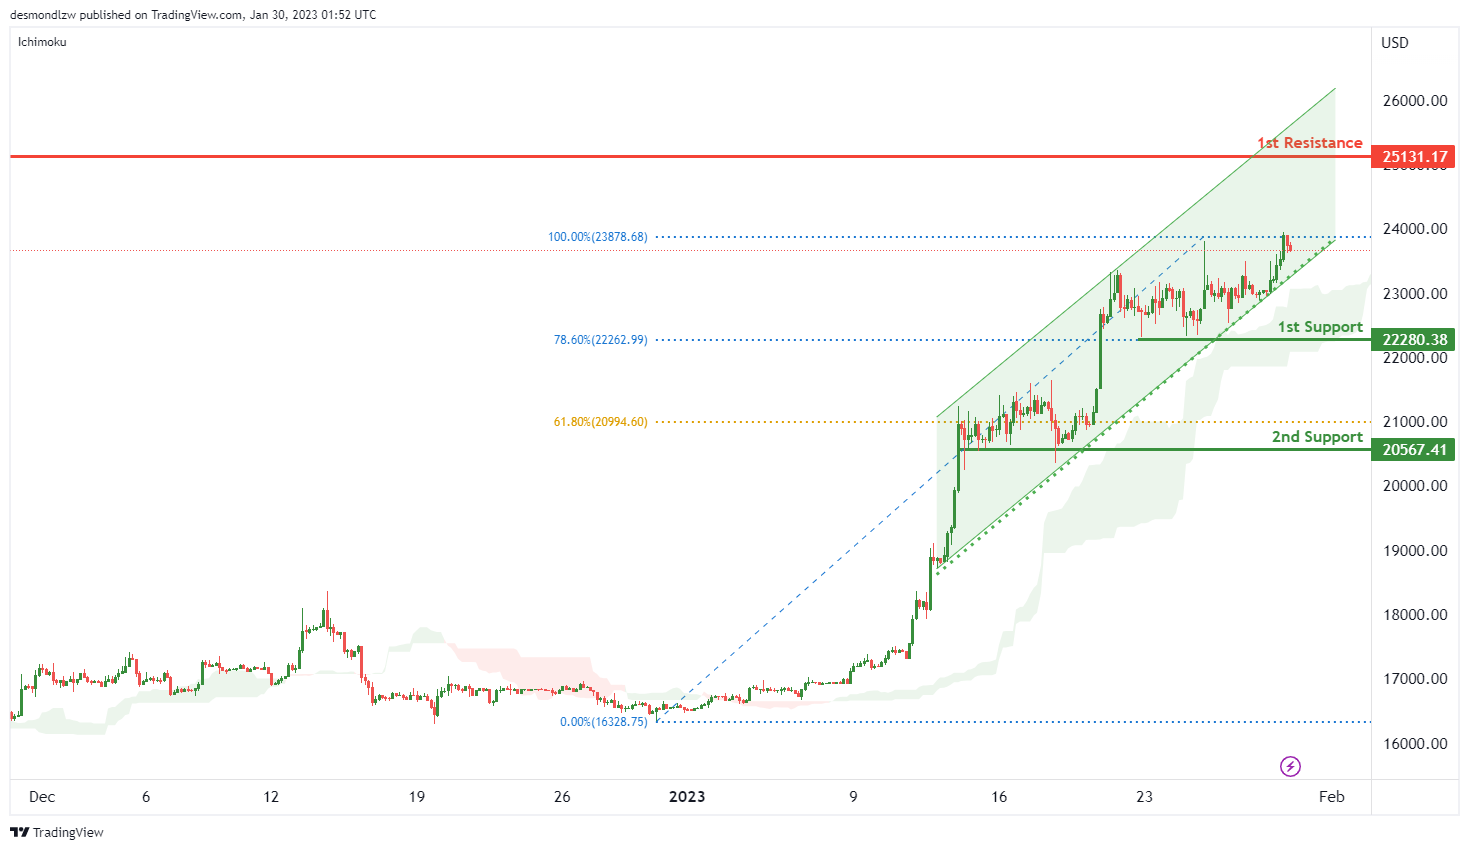
Looking at the H4 chart, my overall bias for BTCUSD is bullish due to the current price being above the Ichimoku cloud, and there is an ascending channel, indicating a bullish market. If this bullish momentum continues, expect the price to possibly rise to the 1st resistance at 25131.17 which is the previous swing high.
In an alternative scenario, the price could possibly head back down to retest at the 1st support at 22280.38 which is in line with 78.6% Fibonacci line.. 2nd support is at 20567.41 which is the recent swing low.
Areas of consideration:
H4 time frame, 1st resistance 25131.17
H4 time frame, 1st support at 22314.61
H4 time frame, 2nd support a 20567.41
S&P 500:
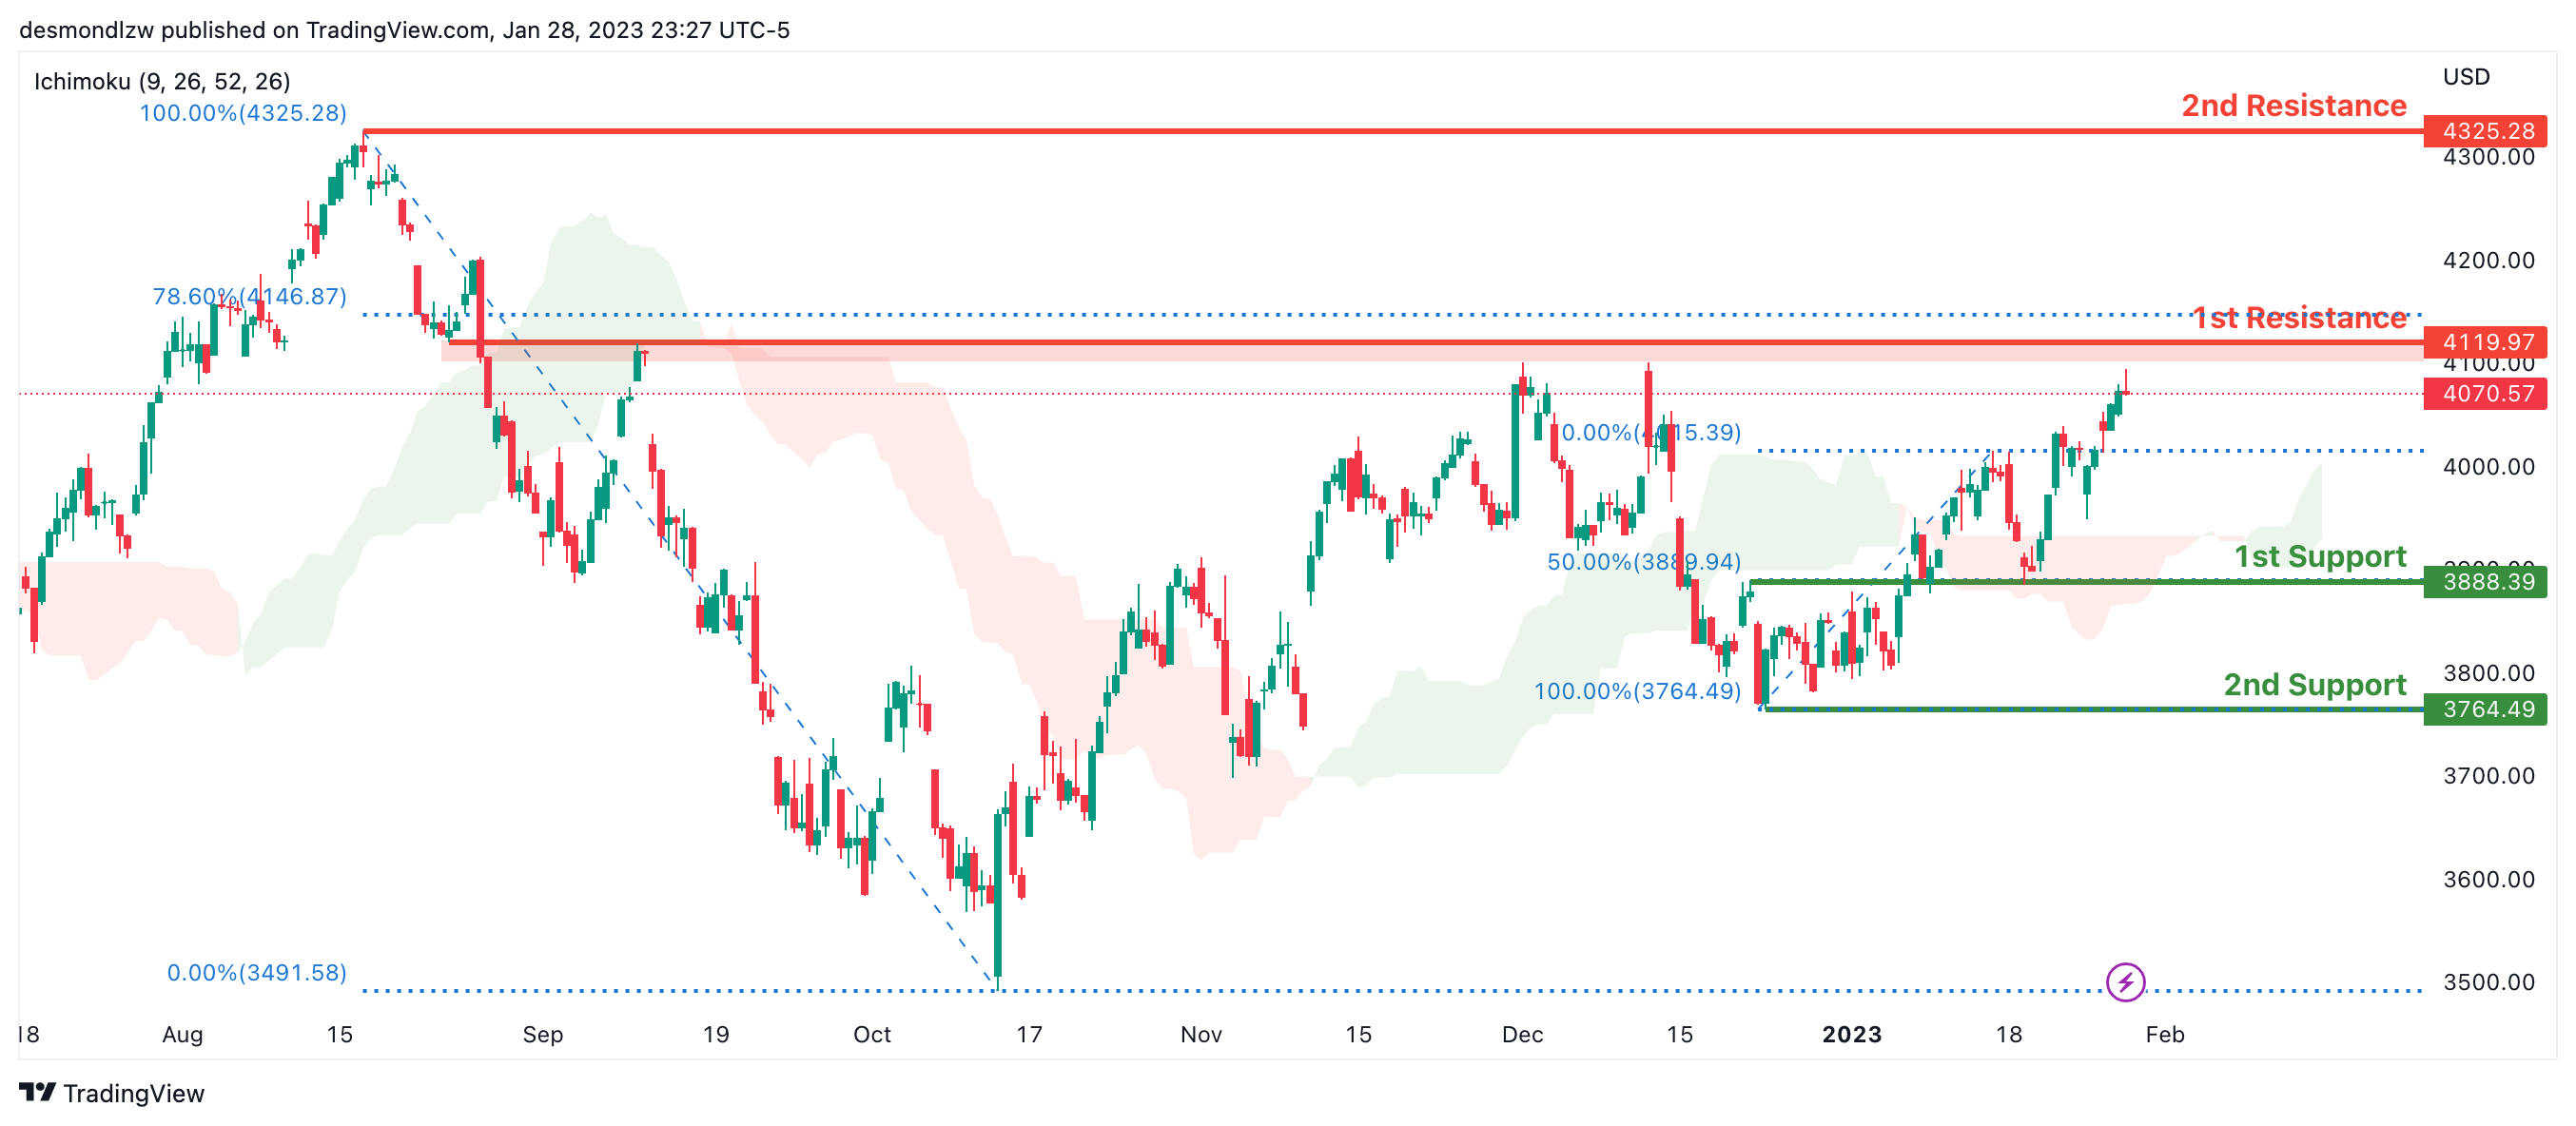
Looking at the H4 chart, my overall bias for S&P500 is bullish due to the current price being above the Ichimoku cloud, indicating a bullish market. If this bullish momentum continues, expect the price to continue heading towards the 1st resistance at 4119.97, where the 78.6% Fibonacci line is. In an alternative scenario, price could possibly head back down to break the 1st support at 3888.39, where the 50% Fibonacci line is, before heading towards the 2nd support at 3764.49, where the recent swing low is.
Areas of consideration:
H4 time frame, 1st support at 3888.39
H4 time frame, 2nd support at 3764.49
H4 time frame, 1st resistance at 4119.97
EUR/USD At Risk of A Downside Correction, Gold Price Consolidates
Key Highlights
- EUR/USD is struggling to clear the 1.0925 resistance zone.
- A key support is forming near 1.0800 on the 4-hours chart.
- GBP/USD could aim an upside break above the 1.2450 resistance.
- Gold price is consolidating near $1,930 and aiming a fresh increase.
EUR/USD Technical Analysis
The Euro made another attempt to clear the 1.0920 and 1.0925 resistance levels against the US Dollar. EUR/USD seems to be struggling to clear the 1.0925 barrier.
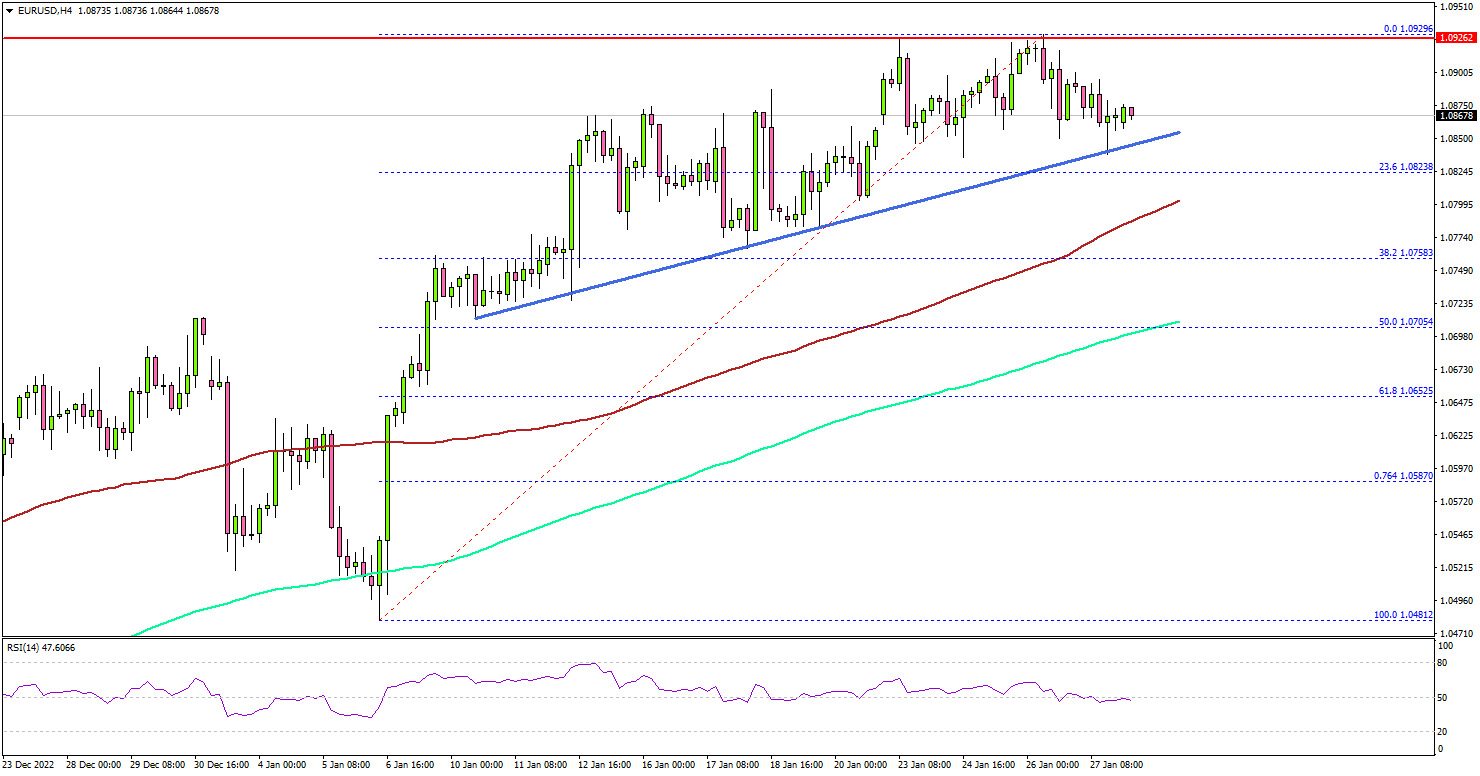
Looking at the 4-hours chart, the pair traded as high as 1.0929 and is currently consolidating in a range. There was a minor decline below the 1.0900 level. However, the pair is trading well above the 100 simple moving average (red, 4-hours) and the 200 simple moving average (green, 4-hours).
On the downside, there is a major support at 1.0800 and the 100 simple moving average (red, 4-hours). A downside break below the 1.0800 zone might push the pair lower.
The next major support sits near the 1.0700 level and the 200 simple moving average (green, 4-hours). Any more losses might open the doors for a move towards the 1.0580 support zone.
On the upside, the pair is facing resistance near 1.0920. The first major resistance is near the 1.0950 level. A clear move above the 1.0950 resistance might start a steady increase towards the 1.1000 resistance zone.
Any more gains could open the doors for a move towards the 1.1080 level. The next key hurdle is near 1.1200, above which the pair could climb towards the 1.1320 resistance zone.
Looking at GBP/USD, the pair is consolidating above the 1.2350 zone and might attempt a fresh increase above the 1.2450 resistance.
Economic Releases
- German Gross Domestic Product for Q4 2022 (YoY) (Preliminary) – Forecast 1.2%, versus 1.3% previous.
- German Gross Domestic Product for Q4 2022 (QoQ) (Preliminary) – Forecast 0%, versus 0.4% previous.
Forex and Cryptocurrency Forecast: Five Days of Storms and Tsunamis
EUR/USD: Next week: Five Days of Storms and Tsunamis
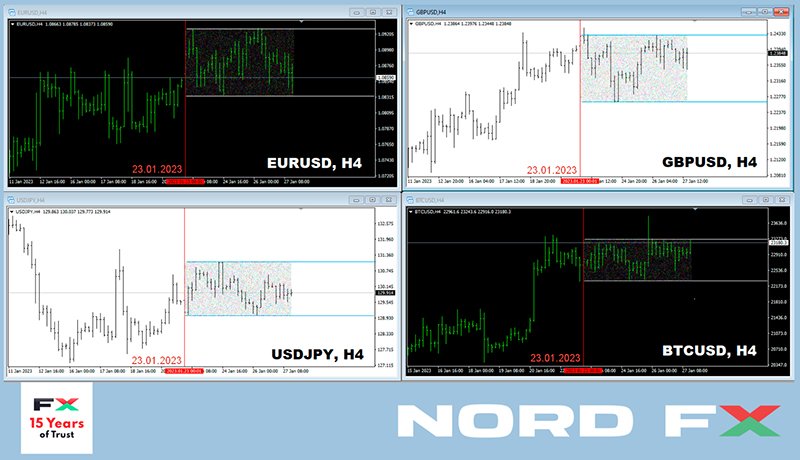
It seems that the whole world celebrated the Chinese New Year last week. There was some volatility in all major currency pairs of course, but we got an almost perfect sideways trend in the end. We will not deny the importance of the New Year holidays, but the reason for the lull, of course, is not in this, but in the key events that are coming next week.
On February 1, when it will be late at night in Europe and dawn in Asia, the US Federal Reserve will announce its key interest rate decision, and the regulator's management will tell (or at least give a hint) about its future monetary policy. The European Central Bank will make its decision on the rate a few hours later, on Thursday, February 02.
But, before giving forecasts, let's turn to the events of the past five days. Data released on Thursday, January 26 showed that the US economy is doing better than expected. The country's GDP, according to preliminary estimates, grew by 2.9% y/y in Q4 against the forecast of 2.6%. At the same time, initial claims for unemployment benefits for the week to January 21 fell to 186K (forecast 205K, the previous value of 192K). This is the lowest weekly figure since April 2022. Underlying durable goods orders also beat estimates, dropping by -0.1% instead of the expected -0.2%. New home sales are also doing well, with sales up to 616K in December from 602K in November.
Looking at these figures, we can conclude that not everything is so bad and there is no recession in the United States. And that the Fed's 2022 aggressive monetary policy (QT) has not had a suffocating effect on the economy. Therefore, it is possible to move on to its easing (QE). However, some economists point out that consumer demand is losing its momentum (2.1% in Q4 against the forecast of 2.9% and 2.3% a quarter earlier). Based on this, they conclude that the chances of a mild recession remain.
For now, the market believes the Fed will raise rates by 25 basis points (bps) at its February meeting. It is currently 4.50%, and the market consensus indicates its peak value at the level of 4.90-5.00% in 2023. The probability that the rate will be raised by another 25 bp in March is estimated at 85%. Although some analysts believe that the peak value will stop at around 4.75%. Moreover, the rate may even be lowered to 4.25-4.50% by the end of 2023. Such dynamics will obviously not benefit the dollar, but it will push up the competing currencies from the DXY basket and risky assets.
As for the common European currency, the market is sure that the ECB will raise the rate by 50 bp on February 02. But, according to analysts, the difference in the rises in USD and EUR rates has already been taken into account by the market in the pair's quotes, which is why it keeps in the range of 1.0845-1.0925. And its foreseeable future will depend on the comments and signals that the leaders of the Fed and the ECB will give at the end of their meetings.
Starting at 1.0855 on Monday, January 23, the pair ended last week at 1.0875. At the time of writing the forecast (Friday evening, January 27), the votes of supporters of bulls and bears are divided almost equally. 50% of analysts expect further strengthening of the euro and the growth of the pair. 45% expect that the US currency will be able to win back part of the losses. The remaining 5% of experts, in anticipation of the meetings of the Central Banks, prefer not to make forecasts at all. Among the indicators on D1, the picture is different: 90% of the oscillators are colored green, 5% indicate that the pair is overbought, and 5% are colored gray neutral. Among trend indicators, 80% recommend buying, 20% recommend selling. The nearest support for the pair is in the zone 1.0835-1.0845, then there are levels and zones 1.0800, 1.0740-1.0775, 1.0700-1.0710, 1.0620-1.0680, 1.0560 and 1.0480-1.0500. The bulls will meet resistance at the levels of 1.0895-1.0935, 1.0985-1.1010, 1.1130, after which they will try to gain a foothold in the 1.1260-1.1360 echelon.
The coming week will undoubtedly be stormy and filled with events. In addition to these Fed and ECB meetings, it should be noted that data on GDP were published on January 30, on the unemployment rate and inflation rate (CPI) on January 31, and on business activity (PMI) in the German manufacturing sector on February 01. We will find out what is the situation with consumer prices ( CPI ) in the Eurozone and what is happening with business activity (PMI) in the USA also on Wednesday, February 01. In addition, we are traditionally waiting for an impressive portion of statistics from the US labor market on February 01, 02 and 03, including the unemployment rate and the number of new jobs created outside the agricultural sector (NFP).
GBP/USD: The Future of the Pound Is in a Thick Fog
The Bank of England (BoE) will also make its decision on the interest rate on Thursday, February 02. And if the probability that the Fed and the ECB will raise their rates is close to 100%, everything is not so simple with the pound. According to some analysts, the BoE may surprise the markets by pausing and slowing down the tightening of its monetary policy.
Although there may not be a pause, we will see a new round of QT instead of QE. British Chancellor of the Exchequer Jeremy Hunt said on Friday, February 27 that “the weak recovery in the public sector after the pandemic reinforces the need for reforms” and that “the best tax cut right now is lower inflation.” And the best (if not the only) cure for inflation, as the experience of overseas colleagues shows, is to raise interest rates.
Pound bulls hope that the Bank of England will raise the pound rate by 50 bp, and it will rise to at least 4.50% from the current 3.50% by the summer. As for the bears, they believe that the threat of an economic downturn and recession will prevent the Central Bank from raising it by more than 25 bps now, and it will do so for the last time, and then be forced to ease monetary policy despite high inflation.
In general, the future is shrouded in fog. But the fact that the country's economy has big problems is very clear. This is evidenced by the fall in the Composite Business Activity Index (PMI) from 49.0 to 47.8 points, instead of the expected increase to 49.3.
Bank of England Governor Andrew Bailey has recently said that the British economy after Brexit has faced a shortage of more than 300,000 workers due to the cessation of the free movement of labor from the EU. Such a deficit has become an obstacle to the fight against inflation, as it entails an increase in wages. In addition, the country's economy continues to be pressured by high energy prices and supply disruptions, as well as other problems related to sanctions against Russia due to its invasion of Ukraine.
The quotes of GBP/USD have not changed much over the past five days: starting from 1.2395, it set the final chord there. The median forecast for the near future also looks vague: 35% of experts believe that it is time for the pair to turn south, just as many point to the north, and the remaining 30% look east. Among the oscillators on D1, 85% are colored green, 15% signal that the pair is overbought. Trend indicators are 100% on the green side. Support levels and zones for the pair are1.2360, 1.2300-1.2330, 1.2250-1.2270, 1.2200-1.2210, 1.2145, 1.2085-1.2115, 1.2025, 1.1960, 1.1900, 1.1800-1.1840. When the pair moves north, it will face resistance at levels 1.2430-1.2450, 1.2510, 1.2575-1.2610, 1.2700, 1.2750 and 1.2940.
Among the events related to the economy of the United Kingdom in the coming week, apart from the meeting of the Bank of England, one can note February 01 and 03, when fresh January data on business activity (PMI) in the country will be published.
USD/JPY: The Future of the Pair Depends on the Fed
Unlike its counterparts, the Bank of Japan (BoJ) left its key rate unchanged at a negative level of -0.1% at its meeting on January 18. The next meeting is not soon, on March 10. The current head of BoJ chapter Haruhiko Kuroda will preside over it for the last time. His powers will end on April 08, and the meeting of the BoJ on April 28 will be held by the new head of the Central Bank. It is with this event that markets associate a possible change in monetary policy in the country. In the meantime, the views of market participants are focused on the US Federal Reserve.
As with the previous pairs, USD/JPY was not much active last week, starting at 129.57 and finishing at 129.85. Analysts' forecasts do not give any guidance until the next Fed meeting: 50% of them side with the bulls, 40% with the bears, and 10% have decided not to make predictions at all. Among the oscillators on D1, 10% point north, 35% look south, and 55% point east. For trend indicators, 15% look north, 85% look in the opposite direction. The nearest support level is located at 129.50 zone, followed by levels and zones 128.90-129.00, 127.75-128.10, 127.00-127.25, 126.35-126.55, 125.00, 121.65-121.85. Levels and resistance zones are 130.50, 131.25, 132.00, 132.80, 133.60, 134.40 and then 137.50.
No important events regarding the Japanese economy are expected this week.
CRYPTOCURRENCIES: New Trading Strategy: Chinese New Year
Bitcoin behaves even more calmly than the S&P500, Dow Jones and Nasdaq stock indices on the eve of the Fed meeting on February 01. Of course, a certain correlation between them remains, but the volatility of the main cryptocurrency has become noticeably less. Although, it is quite possible that this is just the calm before the storm. Which, as usual, will be arranged by the American regulator with its monetary policy and the key rate for USD.
According to Ark Invest CEO Cathy Wood, the cryptocurrency market will enter a new phase in 2023. The rise in bitcoin and other virtual currencies will be the result of the Fed's monetary easing in the second half of this year. It is this move that will become a trigger for investors testing stock markets and digital currencies. (Bloomberg strategist Mike McGlone expressed a similar point of view earlier, pointing out the possibility of BTC rising to $30,000).
Adam Farthing, Chief Risk Officer at crypto company B2C2, noted that the first cryptocurrency needs to overcome the key level at around $25,000 in order to continue the rally. “It will be a tough nut to crack,” the expert shared his opinion. According to him, after passing the designated milestone, interest will resume from outsiders who want to return to the market.
However, analysts at the brokerage company Bernstein are convinced that such a rally is unlikely to continue at the moment, as there are no signs of “any new injections” into the industry. However, in their opinion, institutional capital will still begin to show more interest in cryptocurrency this year, as it becomes an increasingly regulated asset class. (We have also repeatedly raised the topic of regulation and its conflict with the main idea of cryptocurrencies in our reviews).
And DataDash analyst and channel creator Nicholas Merten also believes that while cryptocurrencies have a bright future, many underestimate the current global environment. In his opinion, the damage caused by FTX, Celsius, Three Arrows Capital and Terraform Labs has left an indelible mark on the industry. In addition, it is necessary to take into account the macroeconomic component, since many countries are struggling with rapid inflation, and supply chains have not fully recovered after the coronavirus pandemic. According to the expert, investors need to understand that the long-term bullish trend is over. Unfortunately, the digital asset industry needs to prepare for new challenges, and the current bullish trend in the market is only a local correction within the overall bearish trend.
Jim Cramer of CNBC agrees with Nicholas Merten. The “Mad Money” TV presenter has also focused on the risks in light of the FTX crash. He noted that a similar situation could happen at any time with any other large crypto company. In his opinion, no one knows what the big players in the industry are really hiding. And there are no guarantees that they are actually honest with their customers. Any new scandal, according to him, will cause a sharp drop in bitcoin quotes, which means that investors' assets are at risk. Citing Carley Garner, senior commodity strategist & broker at DeCarley Trading, he recommended staying away from virtual currencies and opting for physical gold instead as a hedge against rising inflation and economic chaos.
Such an authority as Jamie Dimon, the head of the American banking giant JPMorgan, has also gone with a heavy roller on digital gold. He doubted on the air of CNBC that the supply of bitcoin is really limited to 21 million coins. "How do you know? Maybe it will go up to 21 million, and Satoshi's photo will pop up and laugh at all of you,” he suggested. This top manager already publicly expressed skepticism in October 2022 regarding the code embedded in the algorithm of the first cryptocurrency. “Have you all read the algorithms? Guys, do you believe in all this? ”Dimon grinned at the time.
For your information. Given the programmed halvings, the bar of 21 million should be reached by 2141. At the same time, experts say that the limit on bitcoin emissions is provided by only five lines of the code. It is open for study, and anyone can verify this.
And here the question arises: what if Jamie Dimon's raids on bitcoin are connected with the desire to eliminate this successful competitor? After all, thanks to the recent bullish rally, the capitalization of the flagship cryptocurrency has exceeded $443 billion, and has surpassed all key traditional financial institutions, including global world banks, in this indicator. For example, the capitalization of the American banking giant JPMorgan Chase is $406.42 billion, while Bank of America has a capitalization of $277.56 billion. In addition, BTC is ahead of companies such as Alibaba ($317.01 billion), Samsung ($335.37 billion), Mastercard ($365.09 billion) and Walmart ($385.15 billion). However, it has slightly lost to Tesla ($454.72 billion).
According to CompaniesMarketCap, bitcoin is the 16th most valuable asset in the world. The leaders of the rating are gold ($12.77 trillion), Apple ($2.25 trillion) and Saudi Aramco ($1.94 trillion).
At the time of writing this review (Friday evening, January 27th), BTC/USD is trading in the $23,070 zone. The total capitalization of the crypto market is $1.060 trillion ($1.038 trillion a week ago). The Crypto Fear & Greed Index has grown from 51 to 55 points over the week and has moved from the Neutral zone to the Greed zone, where, according to the creators of the index, it is already dangerous to open short positions.
And at the end of the review, our half-forgotten half-joking column of crypto life hacks. This time we will talk about one interesting observation. Of course, if you decide to adopt it, the whole responsibility will fall on you. But if you can earn money thanks to it, be sure to tell us about it. And don't forget to say thank you.
So, it turns out that buying bitcoin at the end of the first day of the Chinese New Year and selling it after ten trading days guarantees an average profit of more than 9%. This was found out by Matrixport Research and Strategy Director Markus Thielen. According to his observations, the scheme has generated income in 100% of cases for the last eight years, from 2015 to 2022. Such an operation would bring the greatest profit in 2017: 15%. Even in 2018, against the backdrop of the previous crypto winter, the investor received income, although only 1%.
To implement the scheme In 2023, it was necessary to buy digital gold on January 22, and sell the assets 10 days later, on February 1. Bitcoin was trading near the $22,900 mark on the day of the proposed purchase. Thielen believes its price should approach $25,000 by the beginning of February. We will soon find out whether the phenomenon will be justified this time. And if anyone decides to follow Thielen's recommendations in the future, we would like to inform you that the next Chinese New Year begins on Saturday, February 10, 2024.
The Weekly Bottom Line: Slow Growth is Already Here
U.S. Highlights
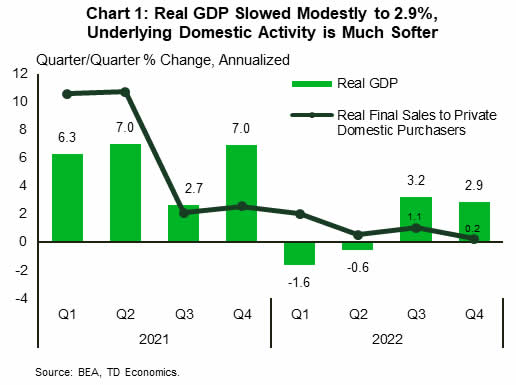
- Real GDP eased modestly to 2.9% (q/q annualized) in the fourth quarter of 2022. The details of the report were less
- constructive, with underlying domestic activity showed much softer momentum.
Real consumer spending fell by 0.3% month-on-month in December, with goods declining and services holding flat. - Core PCE inflation eased from 4.7% to 4.4% (y/y) in December.
- Housing market data are showing some improvement, with new home sales trending higher in each of the last three
- months through December and pending home sales increasing for the first time since May.
Canadian Highlights
- The Bank of Canada (BoC) hiked rates by an additional 25 basis points, but more importantly, announced a conditional pause in its rate hiking cycle.
- Accompanying the rate announcement, the BoC also released updated economic forecasts which showed a stalling
- in GDP growth and a meaningful deceleration in inflation.
- The recent drop in gasoline prices and easing supply chains will be a downward force on inflation, but the focus will
- be on wages to make sure inflation moves decisively to the Bank’s target.
U.S. - Slow Growth is Already Here
The U.S. economy grew by 2.9% quarter-on-quarter (q/q, annualized) in the fourth quarter of 2022 – an above-trend and slightly better than expected showing. However, the details were less constructive. For starters, inventory investment and net exports – two inherently volatile components – accounted for roughly two-thirds of the gain in the headline number. Meanwhile, fixed investment declined by 6.7% as another sharp pullback in residential (-27%) more than offset the modest gain in business investment (+0.7%). While household consumption held relatively steady, expanding by 2.1%, underlying domestic activity is looking much softer (Chart 1).
Digging further into consumption, another discouraging development was the fact that services spending slowed more than anticipated from 3.7% to 2.6%. Today’s personal income and outlays report helps shine additional light on more recent consumption trends. Real spending fell by 0.3% month-on-month (m/m) in December, ending the year on a sour note. As expected, goods spending was weak (-0.9%), but services also failed to make headway, holding flat on the month. This will provide a weak handoff to the first quarter of 2023, with consumption expected to stall or perhaps even print negative.
From that perspective, the broader demand adjustment appears to have already started towards the end of last year and is expected to intensify over the coming months as the cumulative impact of higher interest rates continues to bear down on the economy.
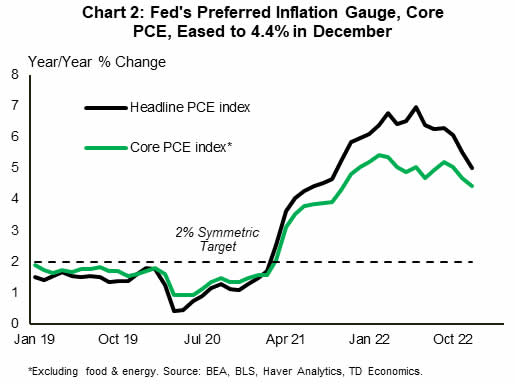
Today’s personal income and outlays report also provided an update on inflation. Overall PCE inflation decelerated from 5.5% year-on-year to 5.0% in December. The Fed’s preferred inflation measure, core PCE, slowed to 4.4% (Chart 2). Encouragingly, the 3-month annualized change on core PCE came in at 2.9% – a notable deceleration from the 5% pace seen during summer and early autumn. All in all, things appear to be moving in the right direction on this front. This is the last major inflation reading before next week’s FOMC decision. Market odds are overwhelmingly tilted toward a 25-basis point hike. Indeed, the Fed is nearing the end of its aggressive hiking cycle, though the policy rate is expected to remain elevated at 5% through much of this year as policymakers assess the passthrough to inflation.
Interest-sensitive areas continue to show plenty of bruising from last year’s sharp move up in interest rates, but some housing indicators are lightly glowing green. For instance, new home sales, which are down more than 10% from their pre-pandemic level, increased for the third consecutive month in December. In addition, pending home sales ticked up 2.5% in December – the first time since May. Echoing this theme are increases in weekly mortgage applications to purchase a home. All told, with mortgage rates falling by close to 100 bps since early November, sales activity does appear to see a bit of a bounce back. While we see scope for mortgage rates to trek moderately lower through the end of this year alongside long-term yields, we expect them to remain somewhat elevated relative to pre-pandemic levels. With new headwinds poised to emerge this year (i.e., increases in the unemployment rate), a ‘sustained’ turnaround in housing is likely still far in the horizon.
Canada – BoC Takes a Breather
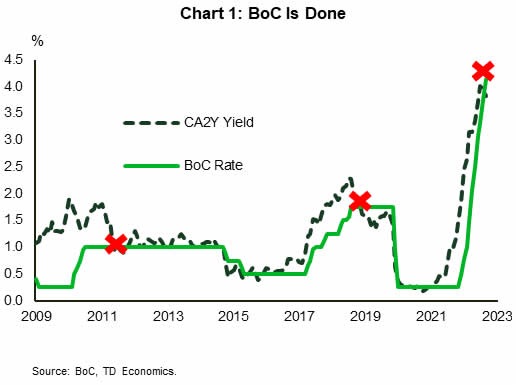
The Bank of Canada (BoC) captured global headlines this week as it became the first major central bank to announce a pause to its rate hiking cycle. By bringing the policy lever to 4.5%, the BoC can now move to the sidelines and let the cumulative impact of its rate hikes over the last year take effect (Chart 1). With greater certainty on the peak policy rate, Canadian bond yields have steadily declined over the last month, easing financial conditions and putting a floor under equities.
The BoC updated its economic forecast with the release of its quarterly Monetary Policy Report. Economic growth is expected to "stall", with real GDP averaging just 1% over 2023. That is a big drop from the 3.6% averaged over 2022. Governor Tiff Macklem even went so far as to say that 2023 could see a mild recession.
Weak consumer spending and business investment are the drivers of this slowdown, as "the effects of the rise in interest rates are expected to broaden." This view mirrors the sentiment inferred in the BoC's recent consumer and business outlook surveys. With most respondents expecting a recession within the next 12 months, declining spending and investment intentions are pointing to a slowing in growth prospects in the months ahead.
The expected slowdown reinforces the view that inflation will keep decelerating. The BoC's new forecast points to CPI going from 6.3% in December to 3% by the summer. Falling gasoline prices, a further easing in supply chains, and less consumer demand are all factors expected to bring inflation down. Given that the BoC's target range for inflation is 1% to 3%, getting inflation to the top of that range would be a huge accomplishment.
The key indicator for the BoC is wage growth. As the Bank highlighted in its report, the path of goods inflation looks set to continue exuding downward pressure on inflation. But at the same time, inflation in the service sector has been stickier. This is because price increases for services like eating at restaurants, education, and personal care are largely driven by labour costs, which are still running hot given the tightness in the jobs market.
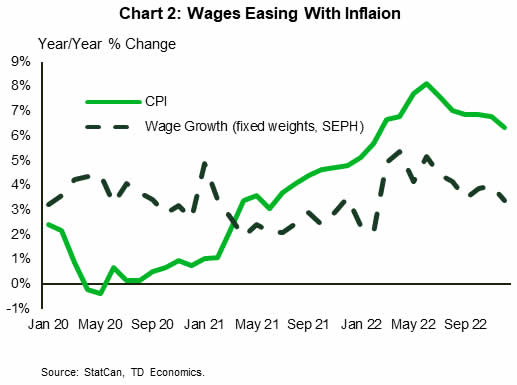
We got a bit of good news on this front this week. In the Survey of Employment, Payrolls and Hours data released yesterday, underlying measures of wage inflation that adjust for the compositional effects showed wage pressures are coming down alongside inflation (Chart 2). Furthermore, it points to wages growing at an average of 4% over the last six months. This is more palatable than the 5%+ growth rate witnessed over that same period. Though the BoC will need to see a further easing in wage pressures to be confident that overall inflation will decelerate to its target, it appears the trend is moving in the right direction.