Sample Category Title
Weekly Focus – Upbeat PMIs Paint Two-Sided Risks for the Central Banks
The January Flash PMIs painted a somewhat less negative growth outlook, reflecting lower energy prices and generally easing financial conditions. Both manufacturing and services indices recovered in the euro area, bringing the composite index above 50 for the first time since last June, and pointing towards recovering activity. US indices have remained at recessionary levels, but the January uptick suggests that the risk of a hard landing has eased. Broadly, we expect the global manufacturing PMI to bottom during Q1, which is earlier than we anticipated previously. See the details in Research Global - Global manufacturing PMI heading higher in H1, 25 January, where we also revised our forecast for US GDP growth higher to +0.3% for 2023 (from -0.2%) and +0.9% for 2024 (from +0.5%).
The uptick in developed market demand coincides with the brisk reopening-driven recovery in China. We will get more colour on Chinese holiday spending next week, when the January PMIs are due for release. For central banks, the early pick-up in activity is not purely a positive factor, as higher global demand could also mean more persistent inflation. While the European energy situation has eased markedly over the past months following warm weather and lower demand, the supply side still remains tight. Similarly, while US economy clearly lost steam towards the end of 2022, labour market conditions remain tight.
We think the ECB will remain firmly on tightening path, and hike its policy rates by 50bp in the next Thursday's meeting, which is fully priced in the markets. While the final ECB members' commentary has been mixed, we expect Lagarde to strike a hawkish tone and guide the markets towards another 50bp hike in March. Ultimately, we see ECB's terminal rate at 3.25% in May, but risks remain tilted to the upside, see our ECB Preview - Set for another 50bp rate hike, 26 January. January Flash HICP figures will be released just ahead of the meeting on Wednesday; we look for an uptick both in headline (9.6%; from 9.2%) and core (5.4%, from 5.2%) terms. We discuss both economic and technical inflation factors related to the turn of the year in Euro inflation notes - January surprises, 25 January.
While markets are well priced for a 25bp hike from the Fed next Wednesday, we discussed the conditions for future Fed rate cuts in our Fed preview - What it takes for the Fed to cut rates, 24 January. In brief, if the recent decline in inflation expectations continues towards year-end, Fed could turn toward cutting the nominal policy rate to avoid high real rates driving the economy into an unnecessarily deep recession. That said, the recent uptick in commodity prices combined with the tight labour markets point towards upside risks as well. We still expect Fed to deliver three consecutive 25bp hikes before ending the cycle.
The latest ISM manufacturing, ADP, and JOLTs data will be released on the afternoon ahead of the FOMC meeting, and resilient signals from the labour markets could further support the hawkish narrative. Consensus expects lower nonfarm payrolls print in the Jobs Report next Friday, but we still expect relatively strong employment growth at 200k.
Rounding out the central bank week, we expect the Bank of England to deliver a 50bp hike. It will be a close call between 25 and 50bp, divided markets are leaning towards the latter. In our Bank of England Preview - Topside risk to EUR/GBP, 27 January, we revised our call with one more 25bp hike in March on the back of the recent strong data releases.
Chinese PMIs and Potential Commodity Currency Recovery
With lingering questions on how much of an impact China's reopening will have on the global economy, there's likely to be increased focus on leading economic indicators from the country. Foremost among them are PMIs, since they are the freshest data, and give insight into economic trends. If the economy is ramping up, purchasing managers are among the first to see the increase in demand.
In the case of commodity currencies, like the CAD, AUD and NZD, but also JPY and even the Euro in the current circumstances, PMI are extra important. There is anticipation for when Chinese firms will ramp up buying of materials to meet demand. That includes commodities, but also machinery from Japan and Europe. Given the geopolitical tensions around semiconductors in particular, Chinese demand could grow unevenly.
The context is also important
The other aspect is that China has been closed for a week for the lunar new year, and that is likely to be reflected in PMI figures. The market could react to the return of Chinese trading over the weekend, which could create a relative impact on how it perceives the PMI figures.
Parsing the two different PMI readings could also have implications for commodity currencies, in particular the AUD and CAD. For the latter, the energy situation in China is more of a concern, naturally. Last year, China experienced droughts that contributed to rolling blackouts. With industrial activity expected to increase in the coming months, along with travel, there is expectation that China could lead crude prices higher. Indications of this will likely be visible first in growing PMIs
The diverging measures
The official (NBS) and the private (Caixin) PMI surveys are expected to diverge, with the latter returning to expansion unlike the former. The NBS survey follows a smaller group of larger, mostly state-owned companies that have been facing increased domestic headwinds. But, as far as forex is concerned, they represent the larger buyers of commodities.
The Caixin survey has a broader reach and includes a lot smaller businesses with an export focus. It's a better gauge of the domestic economy, and global consumer demand. Therefore, it could be more relevant for the NZD than the AUD.
What to look out for
Chinese NBS Manufacturing PMI is expected to improve, but as mentioned remain firmly in contraction at 48.0 compared to 47.0 prior. The non-manufacturing component is also expected to remain in contraction, but have a significant improvement to 48.0, up from 41.6 prior. This is seen as reflecting the improving conditions of the service industry following the complete lifting of covid restrictions.
Caixin Manufacturing PMI is expected to do much better, jumping firmly into expansion at 52.0, up from 49.0 prior. Caixin Services PMI is expected to reflect the same phenomenon seen in the NBS figures, also jumping to 52.0 from 48.0 prior.
GBP/USD Mid-Day Outlook
Daily Pivots: (S1) 1.2360; (P) 1.2396; (R1) 1.2446; More...
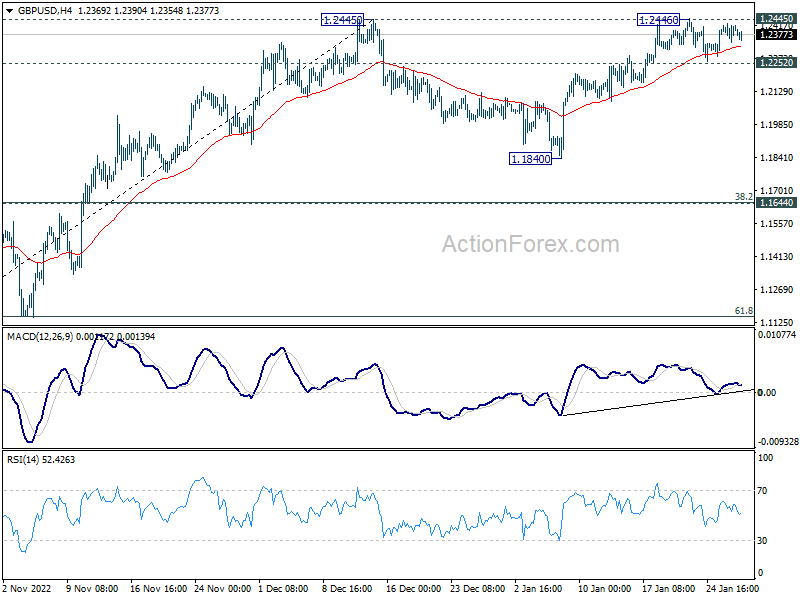
GBP/USD is still gyrating in very tight range and intraday bias remains neutral. On the downside, firm break of 1.2252 minor support will turn bias to the downside, and extend the corrective pattern from 1.2445 with another falling leg. On the upside, decisive break of 1.2445 will confirm resumption of whole rise from 1.0351. Next target will be 1.2759 fibonacci level.
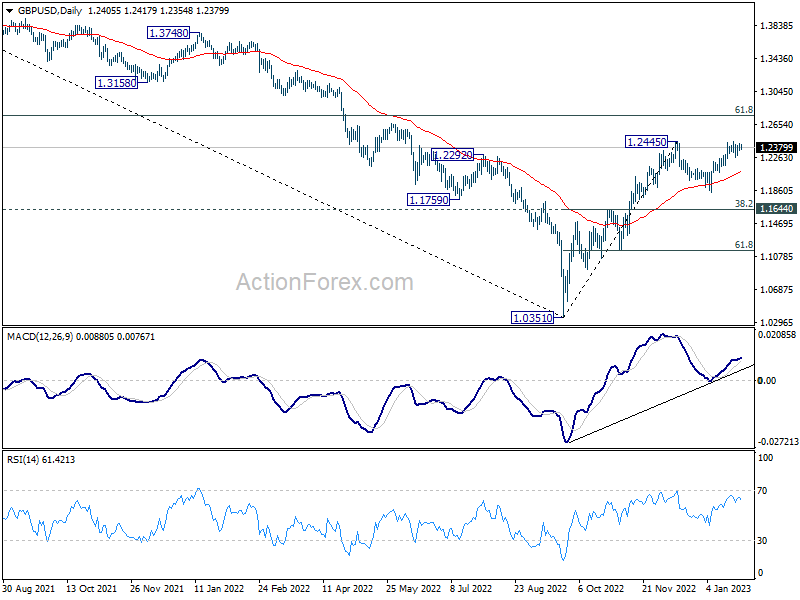
In the bigger picture, rise from 1.0351 medium term bottom is at least correcting whole down trend from 1.4248 (2021 high). Further rise is expected as long as 1.1644 resistance turned support holds. Next target is 61.8% retracement of 1.4248 to 1.0351 at 1.2759. Sustained break there will pave the way back to 1.4248.
US PCE Inflation Cooled, Markets Steady, Dollar Sluggish
The markets are steady after US data showed further cooling in headline and core PCE inflation. While the decline in Dollar has been slowing somewhat, there is no committed buying for a sustainable rebound. The greenback is likely to end the week mixed. Trade might be relatively subdued for the rest of the session. Traders will likely hold their bets until next week's main events.
In Europe, at the time of writing, FTSE is down -0.01%. DAX is down -0.13%. CAC is down -0.29%. Germany 10-year yield is up 0.025 at 0.242. Earlier in Asia, Nikkei rose 0.07%. Hong Kong HSI rose 0.54%. Singapore Strait Times rose 0.50%. Japan 10-year JGB yield rose 0.0198 to 0.485.
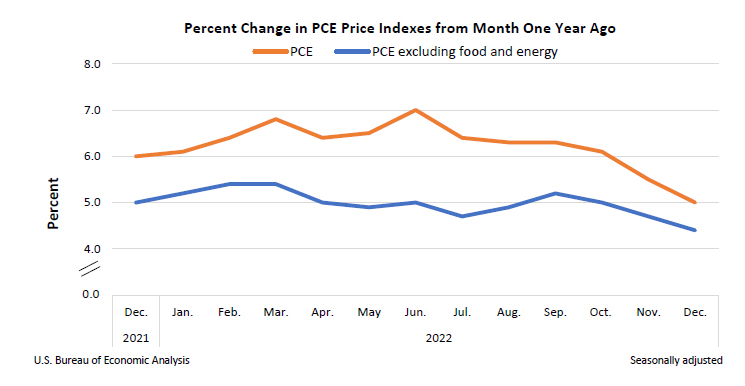
US PCE price index slowed to 5.0% yoy in Dec, core PCE down to 4.4% yoy
US personal income rose 0.2% mom or USD 49.5B in December, matched expectations. Spending dropped -0.2% mom or USD -41.6B.
PCE price index rose 0.1% mom while core PCE price index (excluding food and energy) rose 0.3% mom. Prices for goods was down -0.7% mom and prices for services up 0.5% mom. Foods prices rose 0.2% mom and energy prices dropped -5.1% mom.
From the same month one year ago, the PCE price index slowed from 5.5% yoy to 5.0% yoy. Excluding food and energy, core PCE price index slowed from 4.7% yoy to 4.4% yoy. Prices for goods rose 4.6% yoy, services up 5.2% yoy. Foods prices rose 11.2% yoy while energy prices rose 6.9% yoy.
Japan Tokyo CPI core rose to 3.4% yoy, highest in 42 years
In Japan, Tokyo CPI core (all items ex-fresh food), accelerated from 4.0% yoy to 4.3% yoy in January, above expectation of 4.2% yoy. That's also the fastest annual increase in nearly 42 years since May 1981.
Headline CPI (all items) rose from 4.0% yoy to 4.4% yoy, matched expectations. CPI core-core (all items ex-fresh food, energy) rose from 2.7% yoy to 3.0% yoy.
NZ ANZ business confidence rose to -52, inflation pressures remains intense
New Zealand ANZ Business Confidence improved from -70.2 to -52.0 in January. Own activity outlook rose form -25.6 to -15.8.
Looking at some details, exports intentions rose from -10.0 to -5.4. Investment investment intentions rose form -20.5 to -13.7. Employment intentions rose from -16.3 to -11.1.Pricing intentions rose from 59.1 to 62.4. Cost expectations rose from 84.4 to 91.3. Profit expectations rose from -52.7 to -42.6. Inflation expectations dropped from 6.23 to 5.99.
ANZ said: "Inflation pressures remain intense. Pricing intentions rose 3 points, and cost expectations rose 7 points. Inflation expectations remain stuck around the 6% mark. There's good reason for the RBNZ to keep hiking a while yet (we are picking +50bp in February)."
GBP/USD Mid-Day Outlook
Daily Pivots: (S1) 1.2360; (P) 1.2396; (R1) 1.2446; More...
GBP/USD is still gyrating in very tight range and intraday bias remains neutral. On the downside, firm break of 1.2252 minor support will turn bias to the downside, and extend the corrective pattern from 1.2445 with another falling leg. On the upside, decisive break of 1.2445 will confirm resumption of whole rise from 1.0351. Next target will be 1.2759 fibonacci level.
In the bigger picture, rise from 1.0351 medium term bottom is at least correcting whole down trend from 1.4248 (2021 high). Further rise is expected as long as 1.1644 resistance turned support holds. Next target is 61.8% retracement of 1.4248 to 1.0351 at 1.2759. Sustained break there will pave the way back to 1.4248.
Economic Indicators Update
| GMT | Ccy | Events | Actual | Forecast | Previous | Revised |
|---|---|---|---|---|---|---|
| 23:30 | JPY | Tokyo CPI Core Y/Y Jan | 4.30% | 4.20% | 4.00% | |
| 00:00 | NZD | ANZ Business Confidence Jan | -52 | -70.2 | ||
| 00:30 | AUD | Import Price Index Q/Q Q4 | 1.80% | 1.60% | 3.00% | |
| 00:30 | AUD | PPI Q/Q Q4 | 0.70% | 1.90% | 1.90% | |
| 00:30 | AUD | PPI Y/Y Q4 | 5.80% | 6.30% | 6.40% | |
| 09:00 | EUR | Eurozone M3 Money Supply Y/Y Dec | 4.10% | 4.60% | 4.80% | |
| 13:30 | USD | Personal Spending Dec | -0.20% | -0.10% | 0.10% | -0.10% |
| 13:30 | USD | Personal Income M/M Dec | 0.20% | 0.20% | 0.40% | 0.30% |
| 13:30 | USD | PCE Price Index M/M Dec | 0.10% | 0.10% | ||
| 13:30 | USD | PCE Price Index Y/Y Dec | 5.00% | 5.50% | ||
| 13:30 | USD | Core PCE Price Index M/M Dec | 0.30% | 0.20% | 0.20% | |
| 13:30 | USD | Core PCE Price Index Y/Y Dec | 4.40% | 4.70% | ||
| 15:00 | USD | Pending Home Sales M/M Dec | -1.00% | -4.00% | ||
| 15:00 | USD | Michigan Consumer Sentiment Index Jan F | 64.6 | 64.6 |
US PCE price index slowed to 5.0% yoy in Dec, core PCE down to 4.4% yoy
US personal income rose 0.2% mom or USD 49.5B in December, matched expectations. Spending dropped -0.2% mom or USD -41.6B.
PCE price index rose 0.1% mom while core PCE price index (excluding food and energy) rose 0.3% mom. Prices for goods was down -0.7% mom and prices for services up 0.5% mom. Foods prices rose 0.2% mom and energy prices dropped -5.1% mom.
From the same month one year ago, the PCE price index slowed from 5.5% yoy to 5.0% yoy. Excluding food and energy, core PCE price index slowed from 4.7% yoy to 4.4% yoy. Prices for goods rose 4.6% yoy, services up 5.2% yoy. Foods prices rose 11.2% yoy while energy prices rose 6.9% yoy.
Sterling Dips, Markets Await US Core PCE
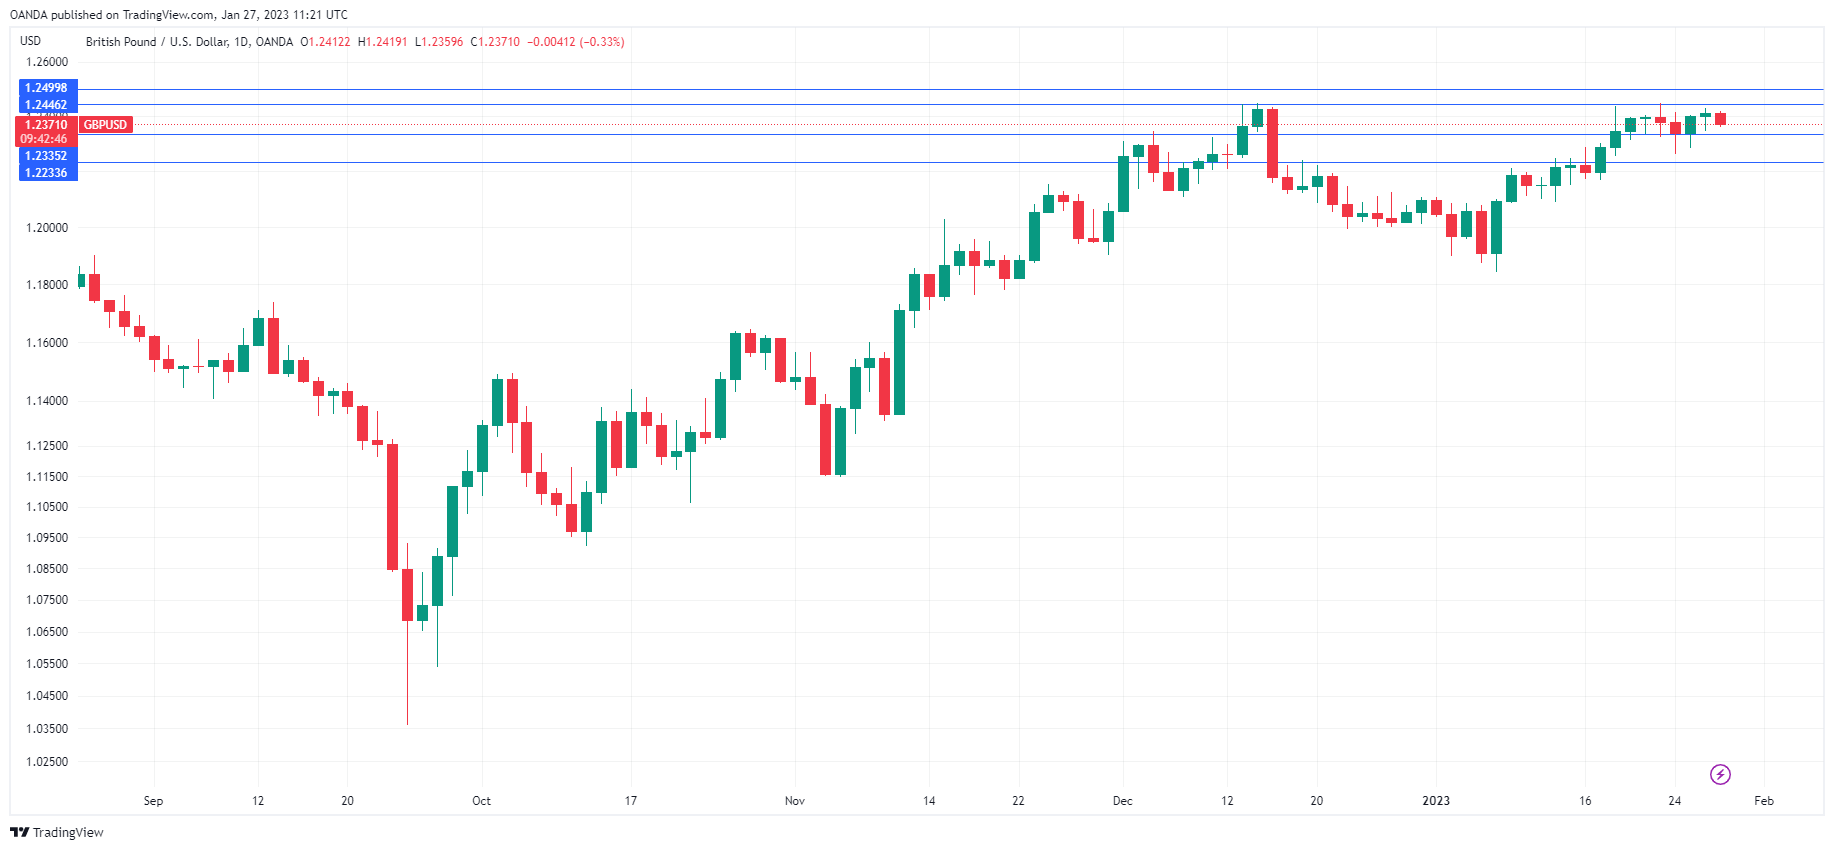
The British pound is slightly lower on Friday. In the European session, GBP/USD is trading at 1.2366, down 0.37%.
Will US Core PCE continue to drop?
There are no UK releases today, so all eyes will be on the US Core PCE, which is considered the Federal Reserve’s preferred inflation indicator. The forecast stands at 4.3% y/y for December, following 4.7% in November. If the print is in line with the forecast, it will mark a fourth straight decline in inflation.
The Core PCE release, even if it misses expectations, won’t change the outcome of the Fed meeting next Wednesday. The CME’s Fed Watch has pegged the likelihood of a 25-basis point hike at 98%. Still, the meeting could have a strong impact on the US dollar, depending on the tone of the rate statement and Fed Chair Powell’s follow-up remarks. The Fed has been very consistent in its hawkish stance, reiterating that rates will stay high and there are no plans to cuts rates, in contrast to the markets, which are expecting rate cuts late in the year. If the Fed repeats its hawkish stance at the meeting, it could give a lift to the US dollar.
The Bank of England holds its meeting just a day after the Fed on Feb. 2. The central bank is widely expected to raise rates by 0.50%, which would bring the cash rate to 4.0% and would be a 10th straight rate increase. Despite the significant tightening, inflation is running at a sky-high 10.5%, meaning that the BoE can’t even think about a pause in its rate-tightening cycle. The terminal rate is likely to be reached at 4.25%-4.5%, so we’re likely to see one or two more rate hikes in the first half of the year. For the BoE, the first sign of success against inflation will be to bring it back to single digits, after four straight months above 10%.
GBP/USD Technical
- 1.2335 and 1.2233 are providing support
- There is resistance at 1.2446 and 1.2499
ETHUSD Lower, Next Stochastic Move Crucial
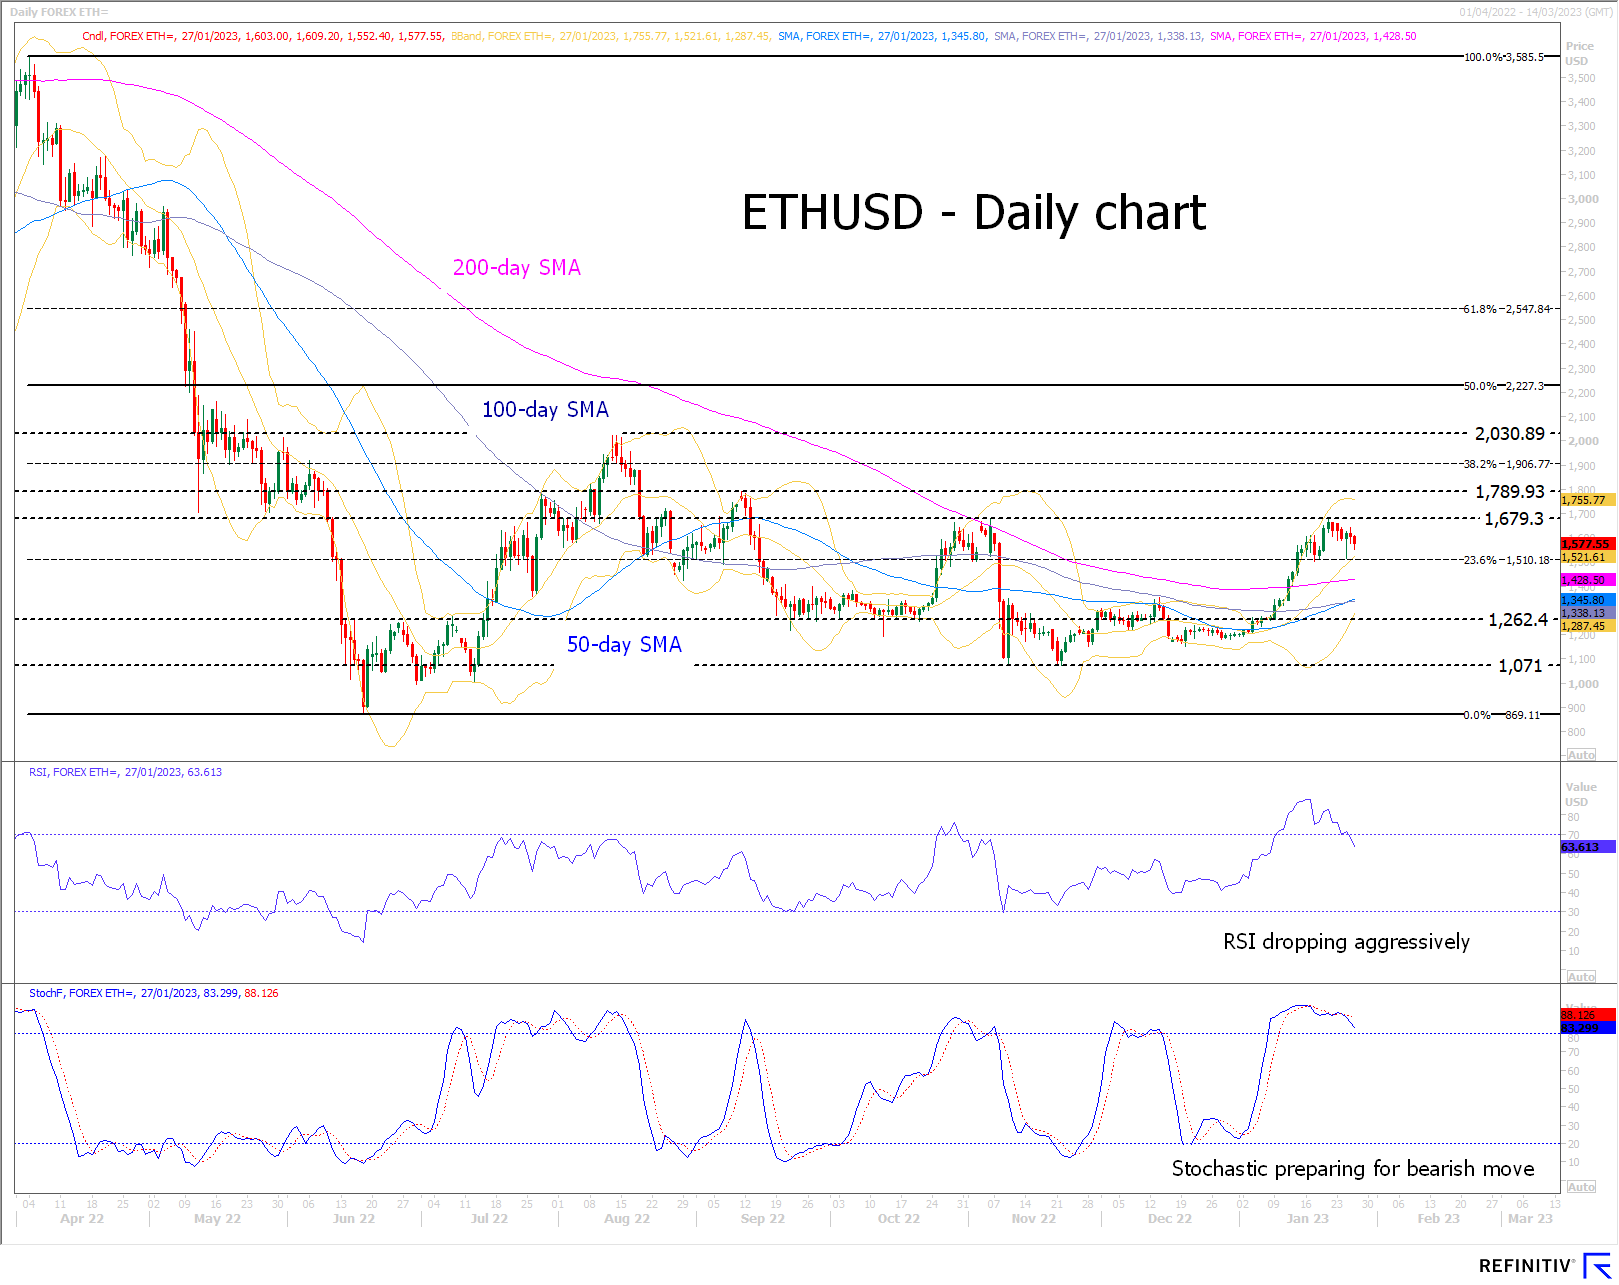
ETHUSD (Ethereum) is edging lower today after touching a local peak of 1,679 on January 21. Cryptocurrencies started the year on a very positive note and ETHUSD is currently around 30% higher year-to-date. However, this bullish move seems to lose the support from the momentum indicators, especially at a moment when the 50- and 100-day simple moving averages (SMAs) convergence is setting the scene for an imminent move.
The RSI is dipping aggressively towards the 50-midpoint and the stochastic oscillator has broken below its moving average. It remains at the overbought territory (OB) and hence still revealing a bullish bias, but its direction is raising concerns. A potential move below OB could signal a potential reversal of the current trend.
Should the bears manage to push the market lower, the initial resistance could come at the 23.6% Fibonacci retracement level of the April 4, 2022 – June 18, 2022 downtrend of 1,510, just ahead of the 200-day SMA at 1,428. Even lower, the 1,338-1345 area populated by the 50- and 100-day SMA could trouble the bears.
On the other hand, if the current dip proved to be a local trough, the bulls could aim for the recent high of 1,679. Higher, the September 11 high of 1,790 and the 38.2% Fibonacci retracement at 1,907 could prove stronger resistance points. Upon successfully breaking these levels, the path will be clear for bulls to test the 2,000s area.
To sum up, the rally appears to have lost support from technical indicators, but a decisive move lower is needed for bears to clear a short-term victory.
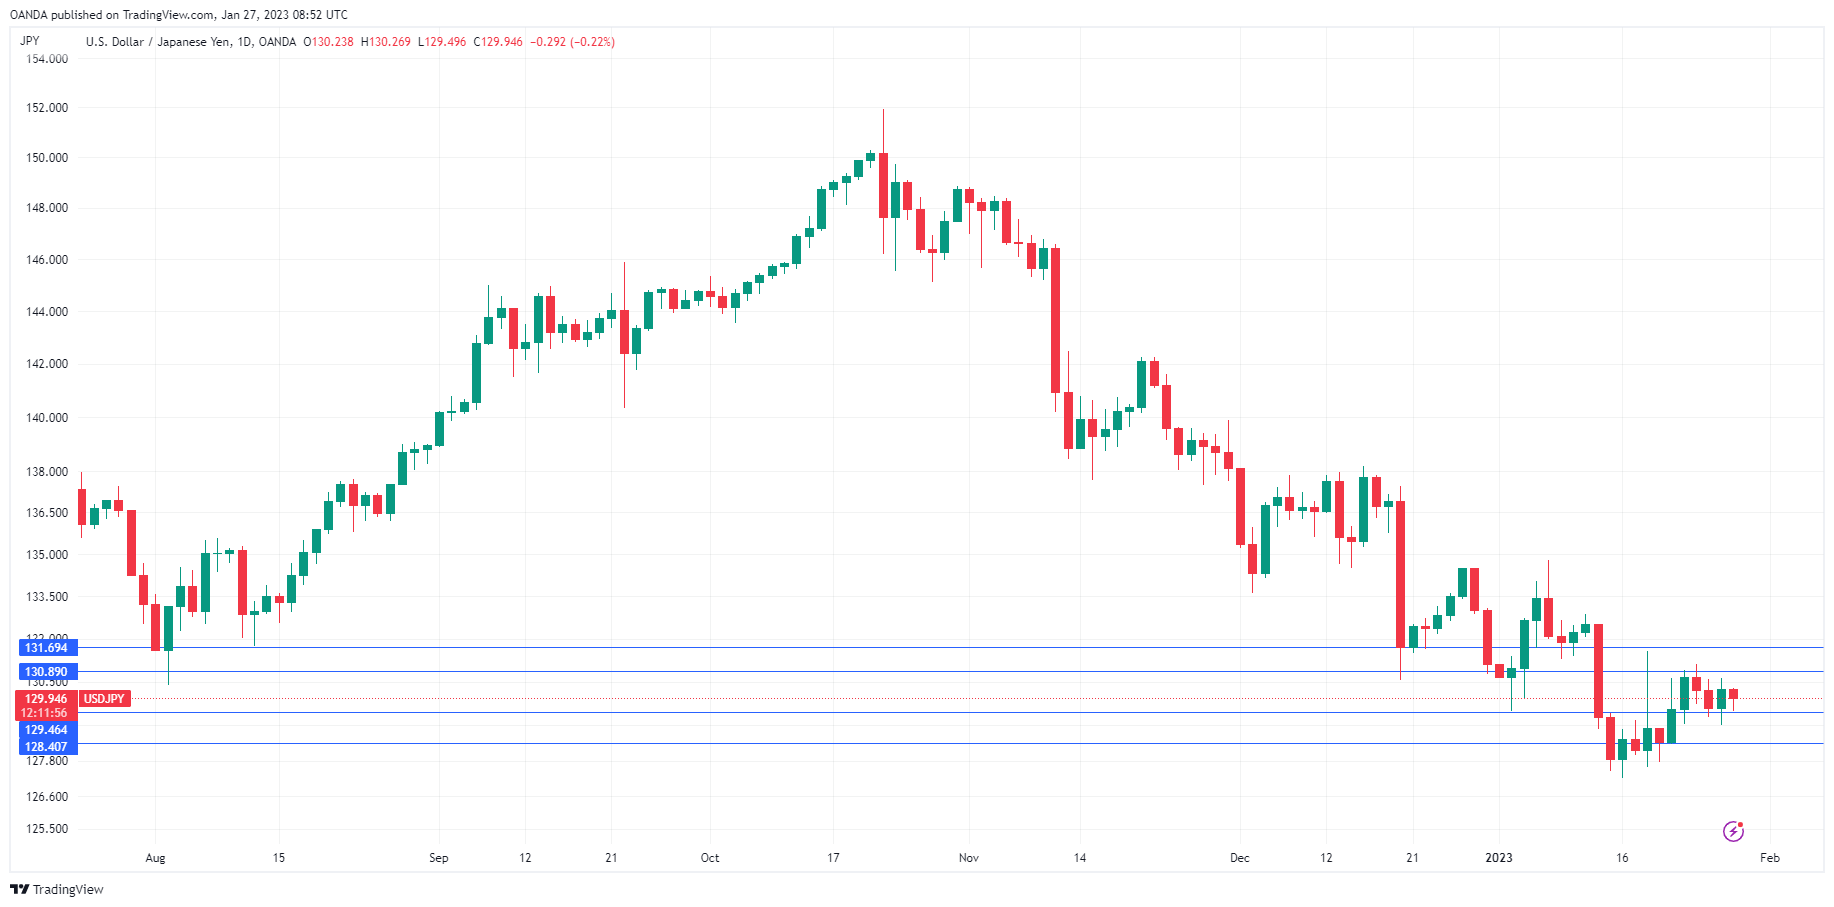
USD/JPY: Yen Edges Higher on Inflation Figures But Near-Term Action Still Directionless
The USDJPY dipped after Tokyo core inflation rose above expectations in January, increasing pressure on Bank of Japan to start phasing out its ultra-loose policy.
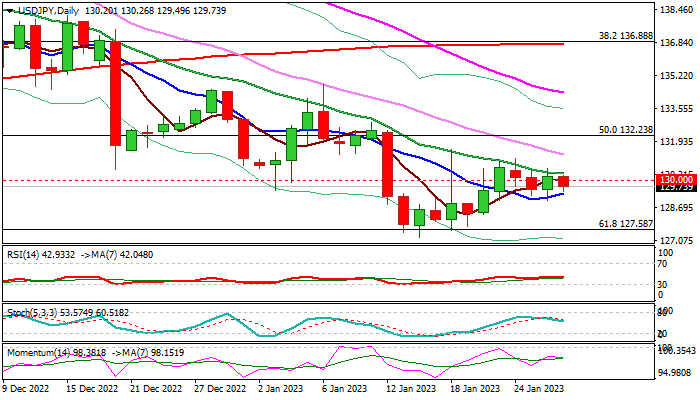
Near-term price action holds in a sideways mode, ranging around 130 level for the fifth straight day and on track to fail again to register a weekly close above 130 that would add to signals that recovery leg from 127.22 (Jan 16 low) was limited (capped by falling 20DMA) keeping larger bearish structure intact.
Technical studies on daily chart are bearish, with minor support from 10DMA (129.39), keeping the downside at risk.
Weekly close below 10DMA would further weaken near-term structure and open way for attack at key supports at 127.58/22 (cracked Fibo 61.8% of 112.53/151.94/Jan 16 low), loss of which would signal continuation of larger downtrend.
Conversely, sustained break through pivotal 130.00/37 barriers (psychological / 20DMA), would improve near-term outlook and open way for fresh recovery.
Res: 130.00; 130.36; 131.12; 131.57.
Sup: 129.39; 128.34; 127.58; 127.15.
Australian Dollar Shrugs as PPI Falls
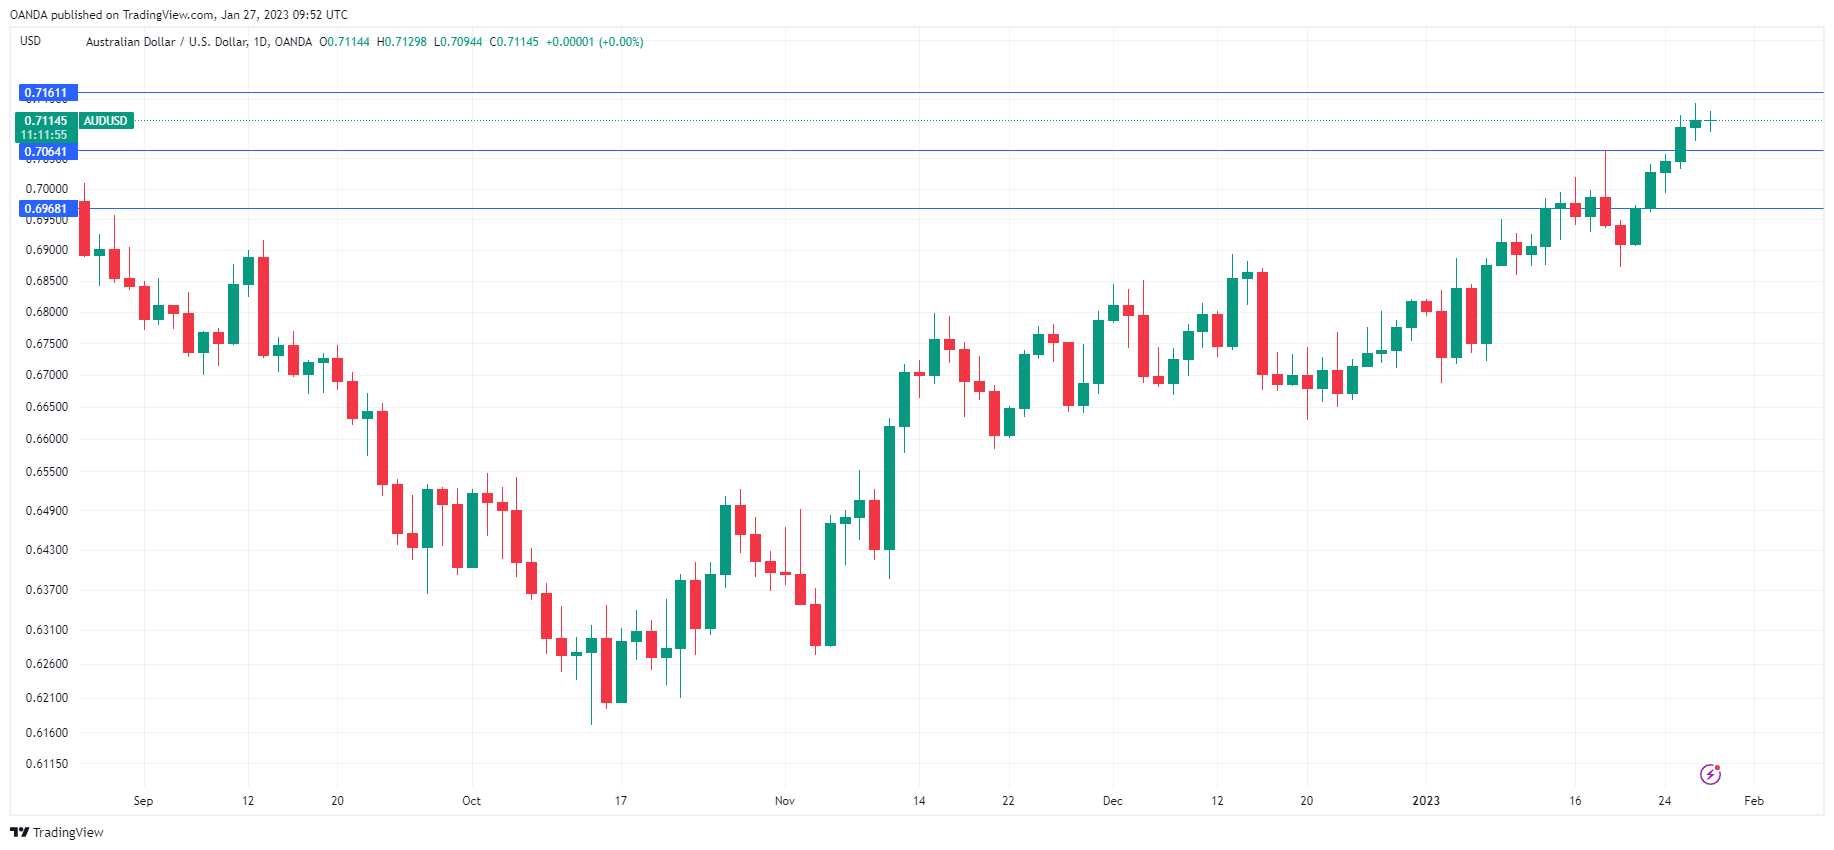
The Australian dollar is almost unchanged on Friday, trading at 0.7112.
Australia’s PPI slips
Just a day after Australian CPI unexpectedly rose, the Producer Price Index went in the opposite direction. PPI in the fourth quarter slowed to 5.8% y/y, down from 6.4% in Q3 and below the consensus of 6.3%. On a monthly basis, PPI fell to 0.7%, much weaker than the gain of 1.9% in Q3 and the forecast of 1.9%.
The RBA has raised rates sharply but inflation is yet to peak. The CPI release for Q4 was a shocker, rising to 8.4% after a 7.3% gain in Q3. The markets had priced in a peak rate of 3.6%, but with the cash rate currently at 3.1% and more rate hikes on the way, it appears that the market is underestimating the terminal rate.
The Australian dollar has been on a tear, rising around 10% since Nov. 1. The outlook for the Aussie remains bright, both for domestic and global reasons. At home, the RBA will continue to raise rates in order to curb inflation. Abroad, China has reopened and that will increase demand for Australian exports. As well, commodity prices are high which is good news for the export sector and the Australian dollar.
Will the US be able to avoid a recession? The answer isn’t clear, as the economic data shows a mixed picture. The employment market remains robust and overall growth has been positive, with GDP for Q4 coming in at 2.9%. Manufacturing and Services PMIs continue to show that these sectors are contracting and housing has been especially weak, as it lowered Q4 GDP by about 1.3%.
Consumer spending, which accounts for some 68% of GDP, could determine whether the US economy tips into a recession or not. Consumer spending rose 2.1% in Q4, down slightly from 2.3% in the third quarter. However, the December release is worrying, as consumer spending declined by 1.1%. If the Fed is to guide the economy to a soft landing, retail sales will have to rebound strongly.
AUD/USD Technical
- There is resistance at 0.7160 and 0.7256
- 0.7064 and 0.6968 are providing support
USD/JPY Dips as Tokyo Core CPI Rises
The Japanese yen is in positive territory on Friday. In the European session, USD/JPY is trading at 129.76, down 0.33%.
Tokyo CPI hits 4.3%
Inflation indicators in Japan continue to head northwards. Tokyo Core CPI rose to 4.3% y/y in January, up from 3.9% in December and ahead of the consensus of 4.2%. This is the highest level in 42 years, but what is more worrying for the Bank of Japan is that the indicator has exceeded the central bank’s target of 2% for the eighth straight month. The increase was broad-based, with food and fuel prices the main contributors to the increase.
The Tokyo Core CPI reading follows other inflation indicators which have hit decades-high levels, adding pressure on the BoJ to exit its stimulus programme. The BoJ insists that inflation will peak at 3% in March. but this view seems over-optimistic, given the trend we’re seeing from inflation data. BOJ Governor Kuroda has said he will maintain the Bank’s ultra-loose policy until wages increase, which would indicate that inflation is driven by domestic demand rather than cost-push factors. Kuroda winds up his term in April, and the new Governor could decide to tighten policy, which would boost the yen.
US GDP climbed 2.9% y/y in Q4, down from 3.2% in Q3 but still a respectable clip. Will the US be able to avoid a recession? The answer isn’t clear, as the economic data shows a mixed picture. The employment market remains robust and overall growth has been positive. Manufacturing and Services PMIs continue to show that these sectors are contracting and housing has been especially weak, as it lowered Q4 GDP by about 1.3%. Much will depend on the strength of consumer spending, which accounts for some 68% of GDP. Consumer spending rose 2.1% in Q4, down slightly from 2.3% in the third quarter. However, the December release is worrying, as consumer spending declined by 1.1%. If this trend continues, it seems likely that the US economy will tip into a recession.
USD/JPY Technical
- 129.46 is a weak support level. The next support line is 128.40
- There is resistance at 130.89 and 131.69