Sample Category Title
GBP/JPY Daily Outlook
Daily Pivots: (S1) 160.51; (P) 161.13; (R1) 162.23; More...
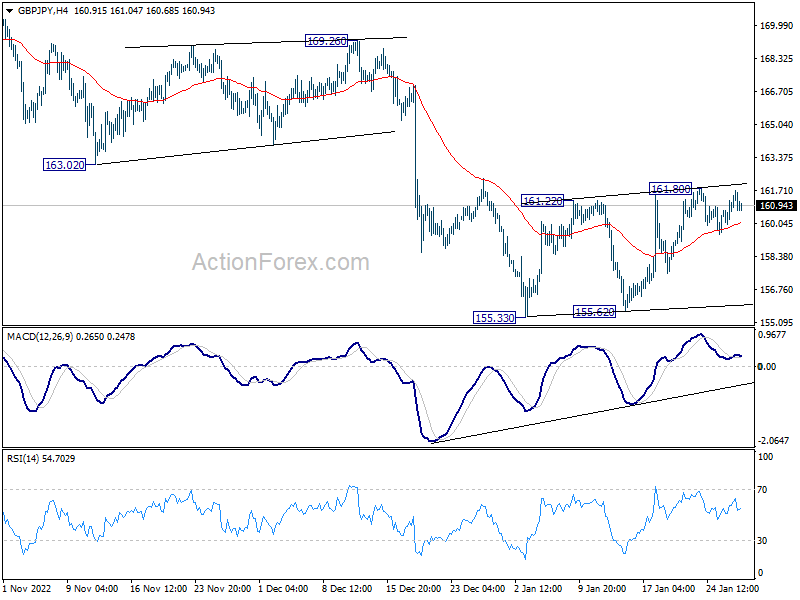
Intraday bias in GBP/USD remains neutral for the moment. On the downside, break of 155.33 low will resume the fall form 172.11 to 153.70 fibonacci level next. Risk will stays on the downside as long as 55 day EMA (now at 162.03) holds, even in case of another rally attempt.
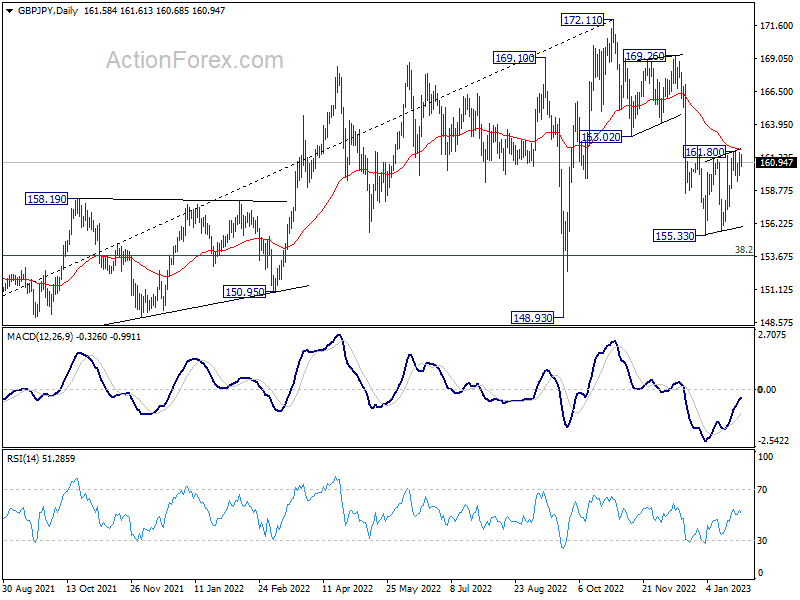
In the bigger picture, as long as 163.02 support turned resistance holds, decline from 172.11 medium term top is expected to continue to 38.2% retracement of 123.94 to 172.11 at 153.70. Sustained break there will raise the change of trend reversal and target 61.8% retracement at 142.34. Nevertheless, break of 163.02 support turned resistance will argue that the decline has completed, and retain medium term bullishness.
EUR/GBP Daily Outlook
Daily Pivots: (S1) 0.8760; (P) 0.8788; (R1) 0.8802; More...
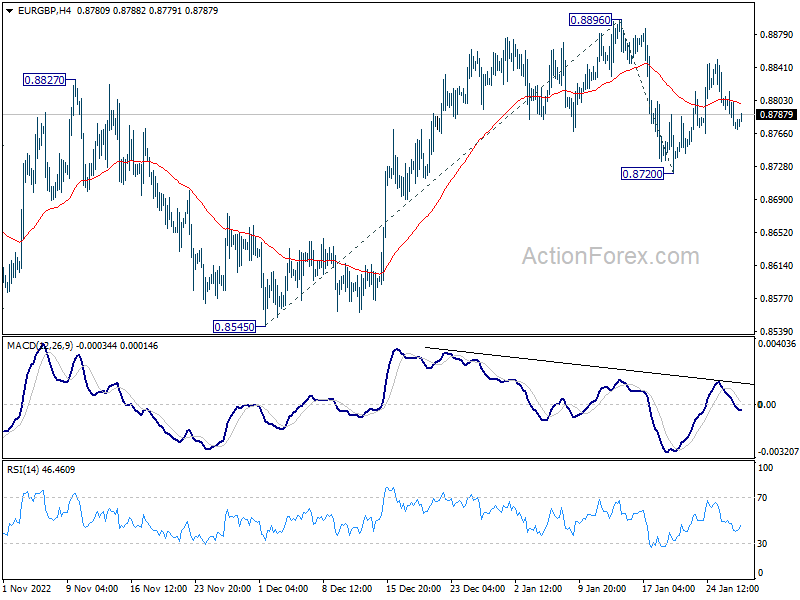
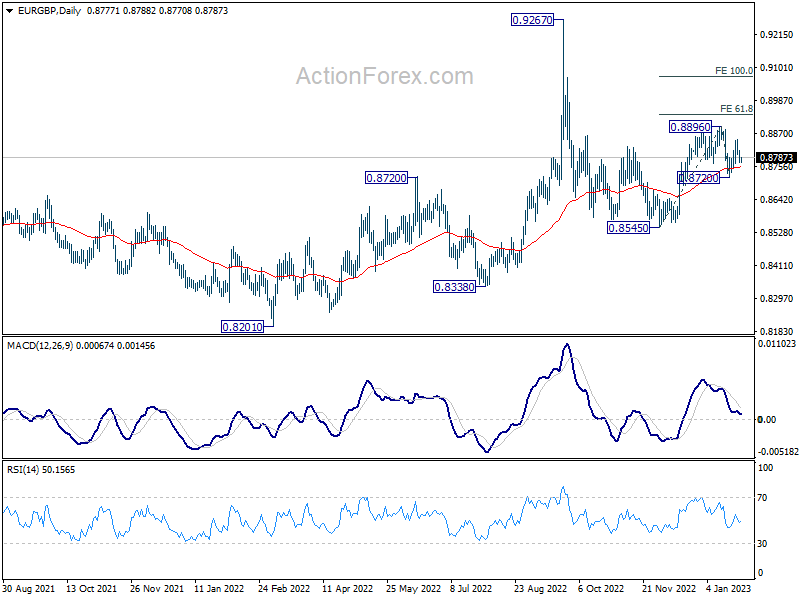
Intraday bias in EUR/GBP remains neutral for the moment. On the upside firm break of 0.8896 will resume the rise from 0.8545 and target 61.8% projection of 0.8545 to 0.8896 from 0.8720 at 0.8937. On the downside, break of 0.8720 will resume the fall from 0.8896 instead.
In the bigger picture, the notable support from 55 day EMA (now at 0.8752) retains near term bullishness. Break of 0.8896 should target 0.9267 (2022 high) and possibly above, to resume whole up trend from 0.8201 (2022 low). However, break of 0.8270 support and sustained trading below 55 day EMA will set the stage for 0.8545 and below.
EUR/AUD Daily Outlook
Daily Pivots: (S1) 1.5265; (P) 1.5323; (R1) 1.5367; More...
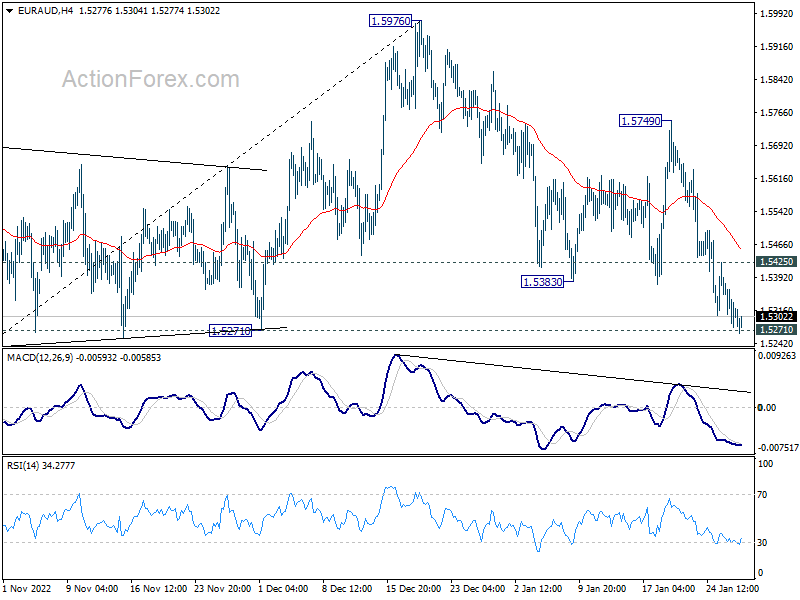
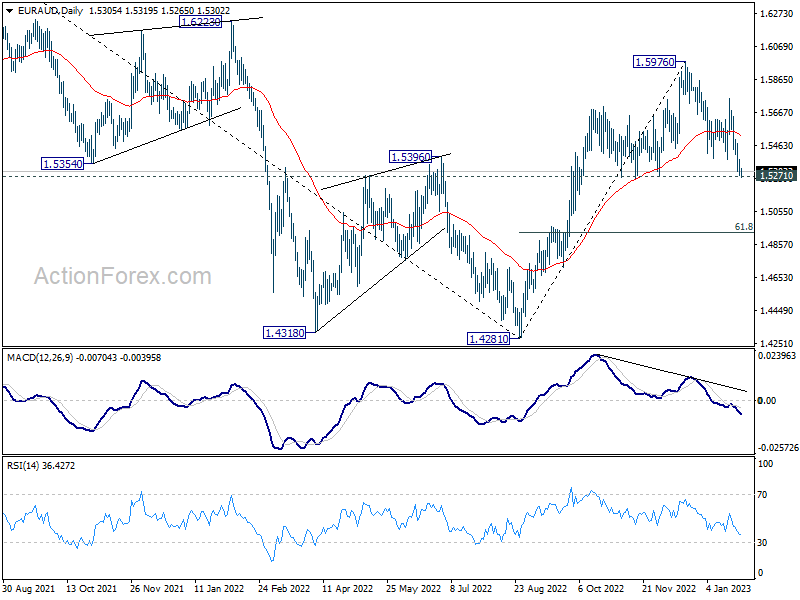
Focus stays on 1.5271 support in EUR/AUD. Decisive break there will carry larger bearish implication. Deeper decline would then be seen to 61.8% retracement of 1.4281 to 1.5976 at 1.4928. Nevertheless, rebound from current level, followed by break of 1.5425 minor resistance, will revive near term bullishness for 1.5749 resistance and above.
In the bigger picture, it's still early to confirm if rise from 1.4281 represents bullish trend reversal. But as long as 1.5271 support holds, such rally is in favor to continue. Break of 1.5976 will target 1.6434 key resistance next. On the other hand, firm break of 1.5271 will retain medium term bearishness instead.
EUR/CHF Daily Outlook
Daily Pivots: (S1) 0.9999; (P) 1.0014; (R1) 1.0038; More....
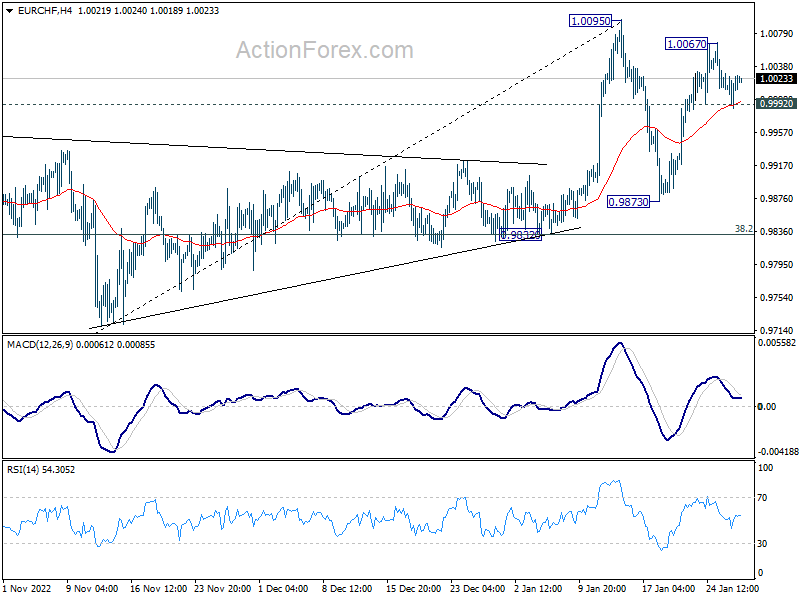
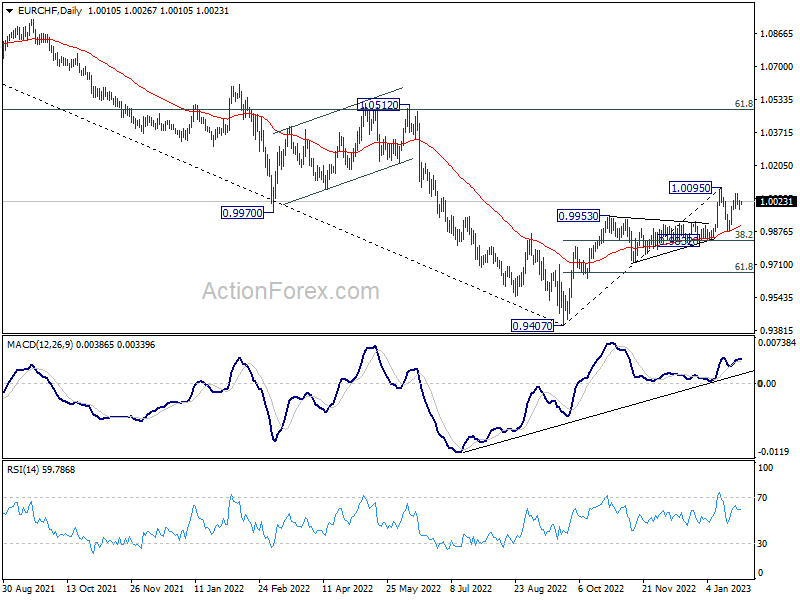
Intraday bias in EUR/CHF remains neutral and outlook is unchanged. On the downside, break of 0.9952 minor support will turn bias back to the downside, to extend the corrective pattern from 1.0095 with another leg, back towards 0.9873 support. On the upside, firm break of 1.0095 will resume whole rally from 0.9407 low.
In the bigger picture, the initial rejection by 55 week EMA (now at 1.0039) mixed up the outlook. On the upside, sustained trading above 55 week EMA will raise the chance of bullish trend reversal. Rise from 0.9407 should then target 1.0505 cluster resistance (2020 low at 1.0505, 61.8% retracement of 1.1149 to 0.9407 at 1.1484). However, firm break of 0.9832 support will revive medium term bearishness and bring retest of 0.9407 low instead.
USD/CAD Daily Outlook
Daily Pivots: (S1) 1.3281; (P) 1.3345; (R1) 1.3385; More....
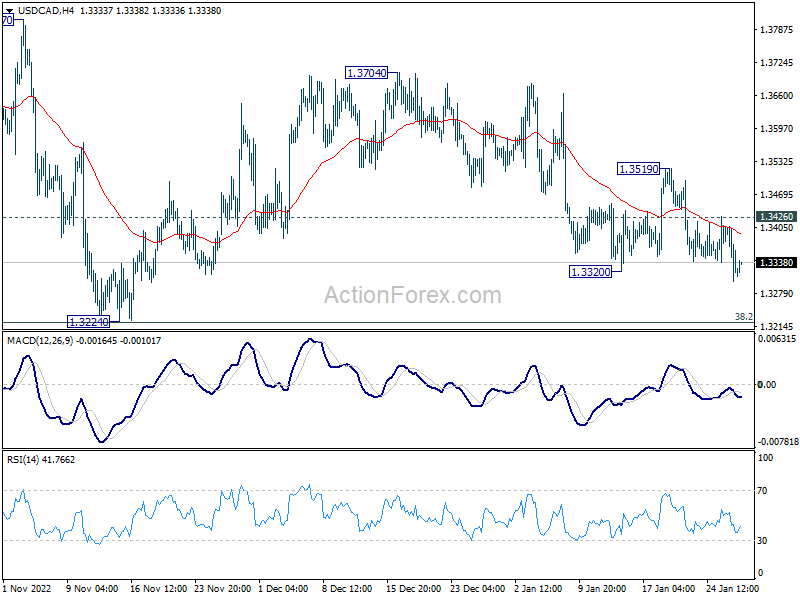
Intraday bias in USD/CAD stays on the downside. Fall from 1.3704 would target 1.3224 key support level. Strong support is still expected from there to bring rebound. But decisive break would carry larger bearish implication. On the upside, above 1.3426 minor resistance will turn intraday bias neutral first.
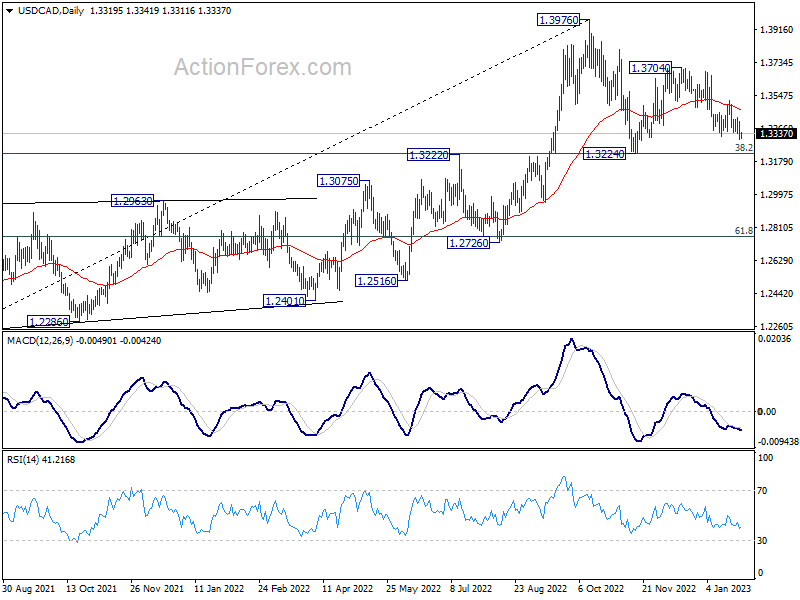
In the bigger picture, as long as 1.3222 cluster support (38.2% retracement of 1.2005 to 1.3976 at 1.3223) holds, larger up trend from 1.2005 (2021 low) is still expected to resume through 1.3976 high at a later stage. However, firm break of 1.3222/3 will indicate that the trend might have reversed. Deeper fall would be seen to next cluster support at 1.2726 (61.8% retracement at 1.2758).
AUD/USD Daily Report
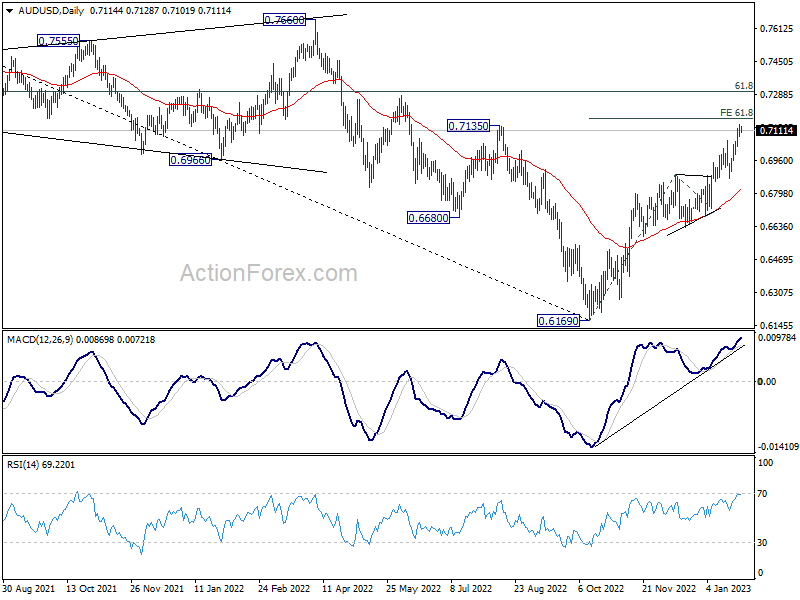
Daily Pivots: (S1) 0.7082; (P) 0.7112; (R1) 0.7146; More...
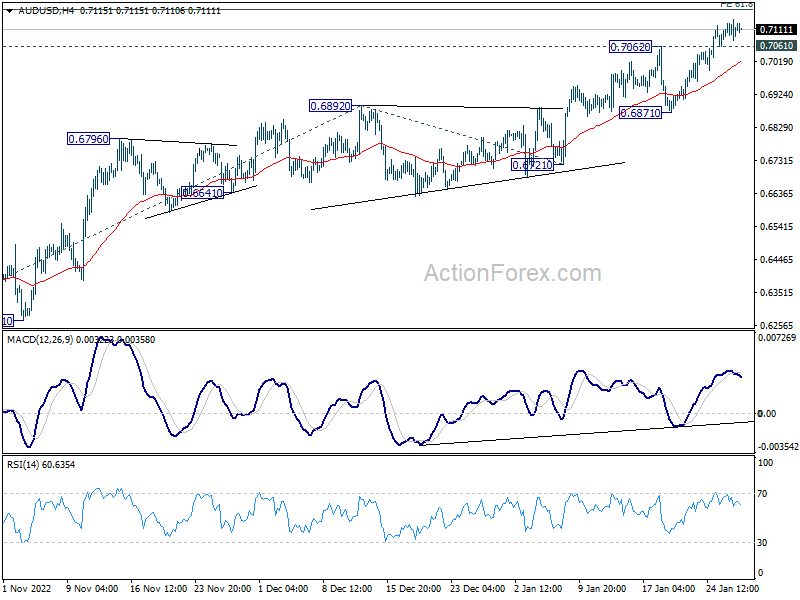
With 0.7061 minor support intact, further rise could still be seen in AUD/USD. Firm break of 61.8% projection of 0.6169 to 0.6892 from 0.6721 at 0.7168 will target 0.7304 fibonacci level. However, break of 0.7061 will turn bias back to the downside for pull back towards 0.6871 support.
In the bigger picture, corrective decline from 0.8006 (2021 high) should have completed with three waves down to 0.6169 (2022 low). Further rally should be seen to 61.8% retracement of 0.8006 to 0.6169 at 0.7304. Sustained break there will pave the way to retest 0.8006. This will now remain the favored case as long as 0.6721 support holds.
USD/JPY Daily Outlook
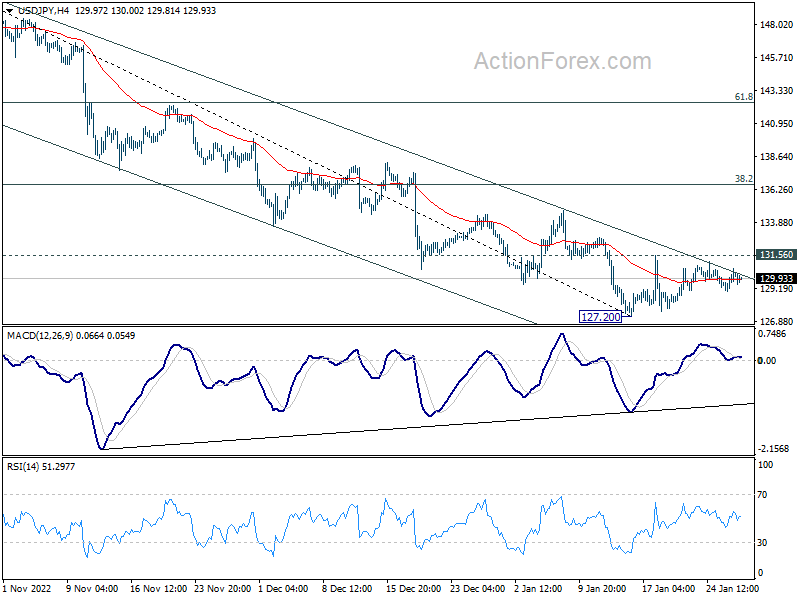
Daily Pivots: (S1) 129.30; (P) 129.96; (R1) 130.89; More...
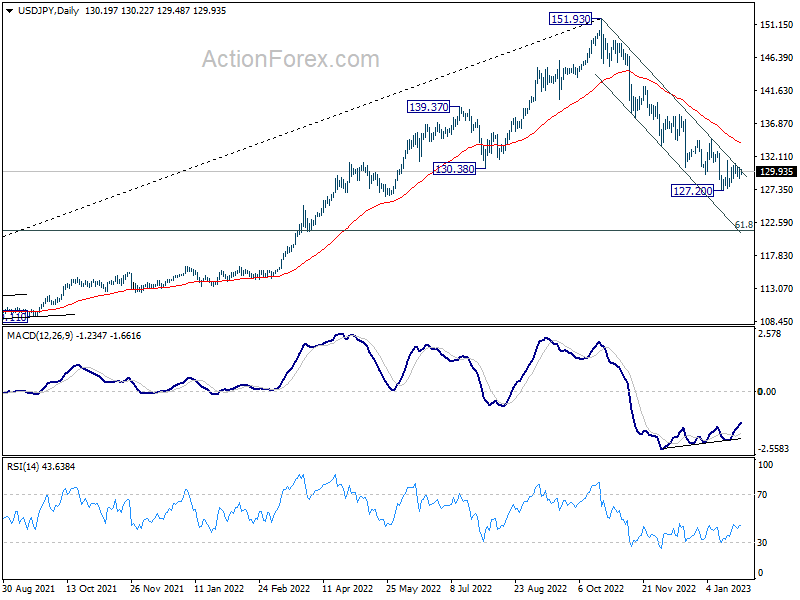
Intraday bias in USD/JPY remains neutral and outlook is unchanged. On the downside, break of 127.20 will resume the whole decline from 151.93 and target 121.43 fibonacci level. Nevertheless, on the upside, break of 131.56 should confirm short term bottoming, and turn bias back to the upside for stronger rebound to 55 day EMA (now at 134.02).
In the bigger picture, the break of 55 week EMA (now at 131.47) raises the chance of medium term bearish reversal, but that's not confirmed yet. Strong support could be seen around 61.8% retracement of 102.58 to 151.93 at 121.43 and 38.2% retracement of 75.56 to 151.93 at 122.75 to bring rebound. But break of 131.56 resistance is needed to indicate bottoming first. Otherwise further fall will remain in favor.
USD/CHF Daily Outlook
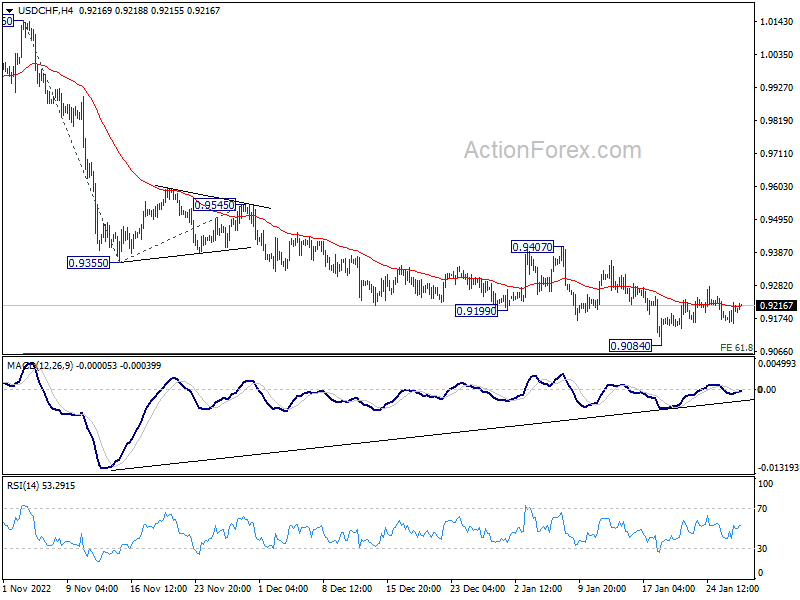
Daily Pivots: (S1) 0.9167; (P) 0.9196; (R1) 0.9233; More...
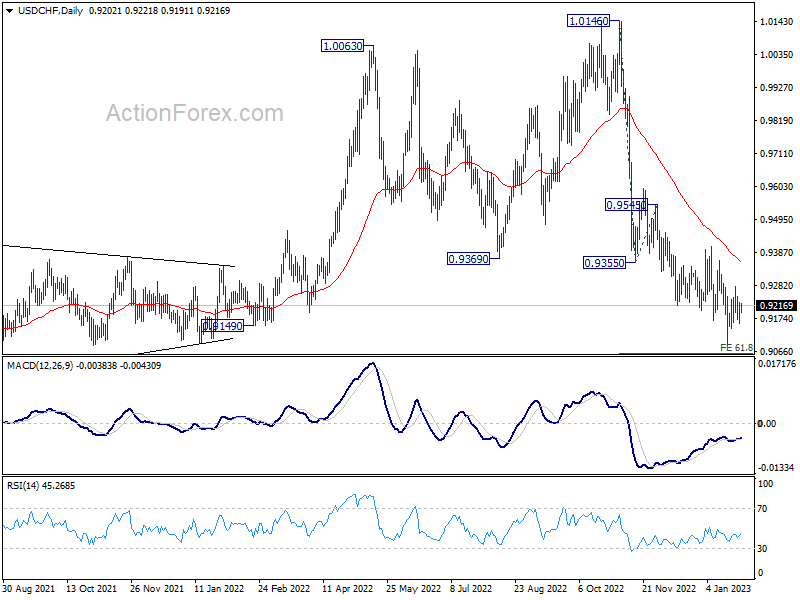
No change in USD/CHF's outlook and intraday bias remains neutral. On the downside, sustained break of 61.8% projection of 1.0146 to 0.9355 from 0.9545 at 0.9056 will pave the way to 100% projection at 0.8754, which is close to 0.8756 long term support. Nevertheless, on the upside, break of 0.9407 should confirm short term bottoming and turn bias back to the upside.
In the bigger picture, rise from 0.8756 (2021 low) has completed at 1.0146, well ahead of 1.0342 long term resistance (2016 high). Based on current downside momentum, fall from 1.0146 should be a medium term down trend itself. Next target is a test on 0.8756 low. Strong support should be seen there to bring rebound. Still, further decline will now be expected as long as 0.9407 resistance holds, in any case.
GBP/USD Daily Outlook
Daily Pivots: (S1) 1.2360; (P) 1.2396; (R1) 1.2446; More...
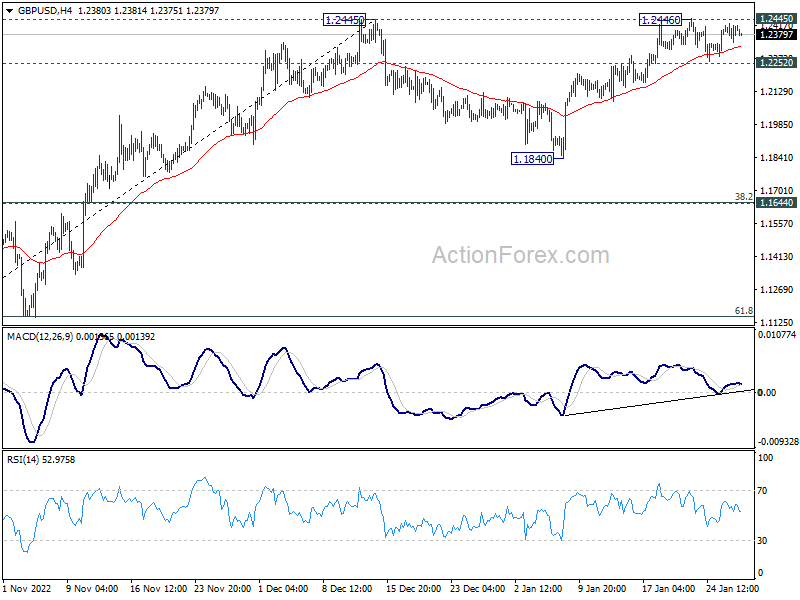
Intraday bias in GBP/USD remains neutral and outlook is unchanged. On the downside, firm break of 1.2252 minor support will turn bias to the downside, and extend the corrective pattern from 1.2445 with another falling leg. On the upside, decisive break of 1.2445 will confirm resumption of whole rise from 1.0351. Next target will be 1.2759 fibonacci level.
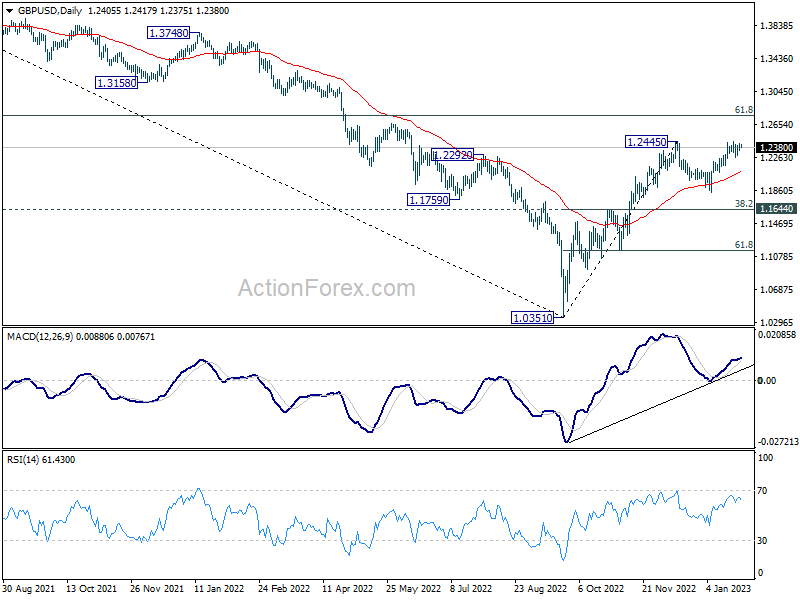
In the bigger picture, rise from 1.0351 medium term bottom is at least correcting whole down trend from 1.4248 (2021 high). Further rise is expected as long as 1.1644 resistance turned support holds. Next target is 61.8% retracement of 1.4248 to 1.0351 at 1.2759. Sustained break there will pave the way back to 1.4248.
Gold (XAUUSD) Rallying in a Nesting Elliott Wave Impulse
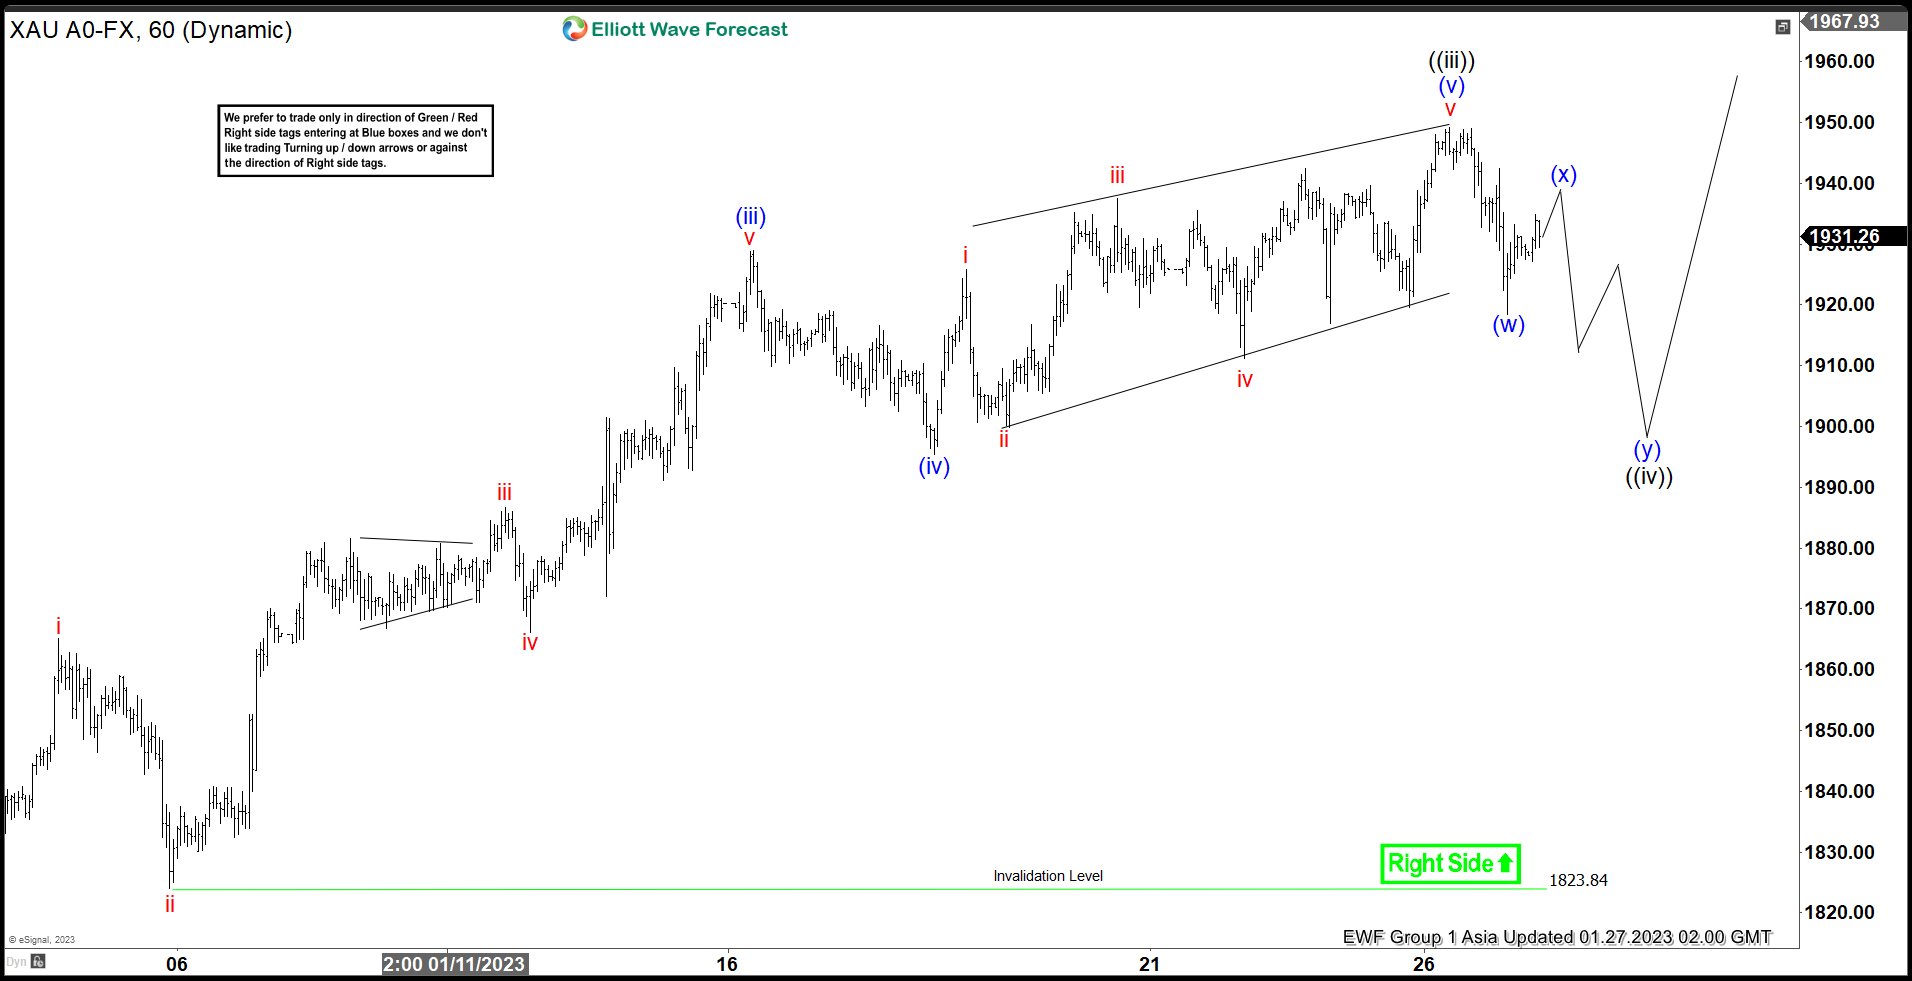
Cycle from 11.23.2022 is unfolding as a 5 waves nesting Elliott Wave impulse. Up from 11.23.2022 low, wave ((i)) ended at 1810.04 and pullback in wave ((ii)) ended at 1773.92. The metal then is nesting within wave ((iii)). Up from wave ((ii)), wave (i) ended at 1823.82 and dips in wave (ii) ended at 1795.90. The metal then extends higher in wave (iii) towards 1928.95 and pullback in wave (iv) ended at 1895.40. Final leg wave (v) ended at 1949.16 which completed wave ((iii)).
Wave ((iv)) pullback is in progress as a double three Elliott Wave structure. Down from wave ((iii)), wave (w) ended at 1918.40. Expect a rally in wave (x) to hold below wave ((iii)) high at 1949.16 and the metal to turn lower again in wave (y) before ending wave ((iv)). Afterwards, it should resume higher again in wave ((v)) to end cycle from 11.23.2022 low. Near term, as far as pivot at 1823.84 low stays intact, expect dips to find support in 3, 7, or 11 swing for further upside. Potential target for wave ((iv)) is 23.6 – 38.2% retracement of wave ((iii)) which comes at 1882 – 1908 area.
Gold 1 hour Elliott Wave Chart