Sample Category Title
German EM Habeck: We have broken the inflation trend
German Economy Minister Robert Habeck told Bundestag that inflation will remain high at the beginning of this year. But, "we have broken the inflation trend."
According to the government's annual economic report published yesterday, inflation is projected to be at 6% in 2023, revised down by prior forecast of 7%. The economy is projected to growth 0.2% this year, much better than autumn forecast of -0.4% contraction.
Habeck also noted that in 2024, inflation will be lower than in 2023 and growth will be higher.
ECB Preview – Set for Another 50bp Rate Hike
For next week's ECB meeting, another 50bp rate hike has been well telegraphed and fully priced by markets. We expect the ECB to continue to sound very hawkish and signal that further rate hikes are coming, in particular giving guidance for another 50bp hike in March. The ECB surprised on the hawkish side in December, which immediately tightened financial conditions, but during January financial conditions reversed back to pre-December levels. Consequently, we expect Lagarde to give a strong reminder to markets to tighten financial conditions.
Since the December meeting, the economic outlook has brightened, but this is a double-edged sword for the ECB. While headline inflation declined in December and is expected to head lower throughout most of the year, the stickiness of underlying inflation remains a headache for the ECB.
On the technical side, the ECB said at the December meeting that it will publish the technical details of the reduction in the APP portfolio.
USDJPY trapped within bearish area; support at 129
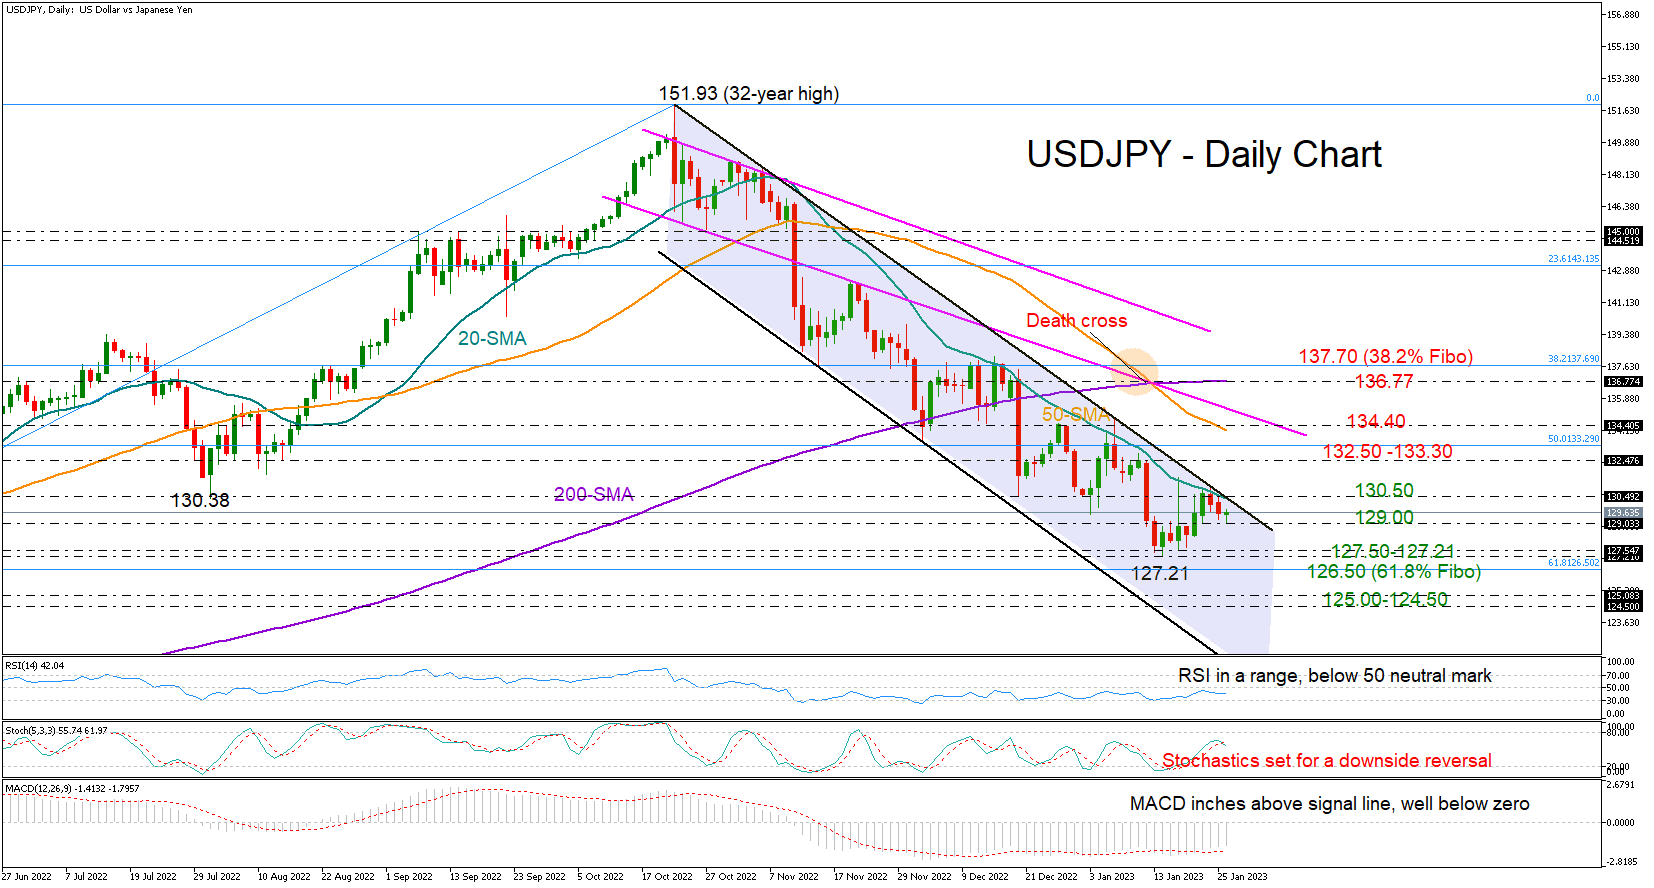
USDJPY faced another rejection at the topline of the four-month-old downward-sloping channel near 131.11, increasing speculation that a new selling wave could start in the short term. The 20-day simple moving average (SMA) was another hurdle.
Monday’s low of 129.00 is currently buffering downside pressures, though the technical signals remain confusing, providing little hope for a bullish breakout. Despite its latest rebound, the RSI keeps hovering within a range below its 50 neutral mark. The stochastic oscillator looks set for a negative reversal, whereas the MACD, although pushing for some recovery, is still well dipped in the negative area.
Meanwhile, the clear bearish SMA crosses keep promoting the negative trajectory in the market.
If the 129.00 base gives way, the bears may push for a downtrend resumption below the previous support area of 127.50-127.21. In this case, the 61.8% Fibonacci retracement of the 114.64 – 151.93 uptrend may attempt to pause the decline near 126.50. If it proves weak, selling pressures may intensify towards the March-April constraining zone of 125.00-124.50, while lower, the price may plummet to meet the channel’s lower boundary seen near 121.50.
In the event the pair exits the channel on the upside at 130.50, closing above the 20-day SMA too, the focus will turn to the 132.50-133.30 bar. There might be another trap nearby, set between the 50-day SMA and the descending line at 135.10. Hence, a sustainable extension above that wall will probably be the key for an advance towards the 200-day SMA and the 38.2% Fibonacci of 137.70.
Summarizing, USDJPY continues to trade within a caution area, facing a bleak short-term outlook. A decisive close above 130.50 is required to reduce negative risks, though only a rally above 134.40 would violate the downward pattern.
WTI Oil Futures Consolidate Above 50-day SMA
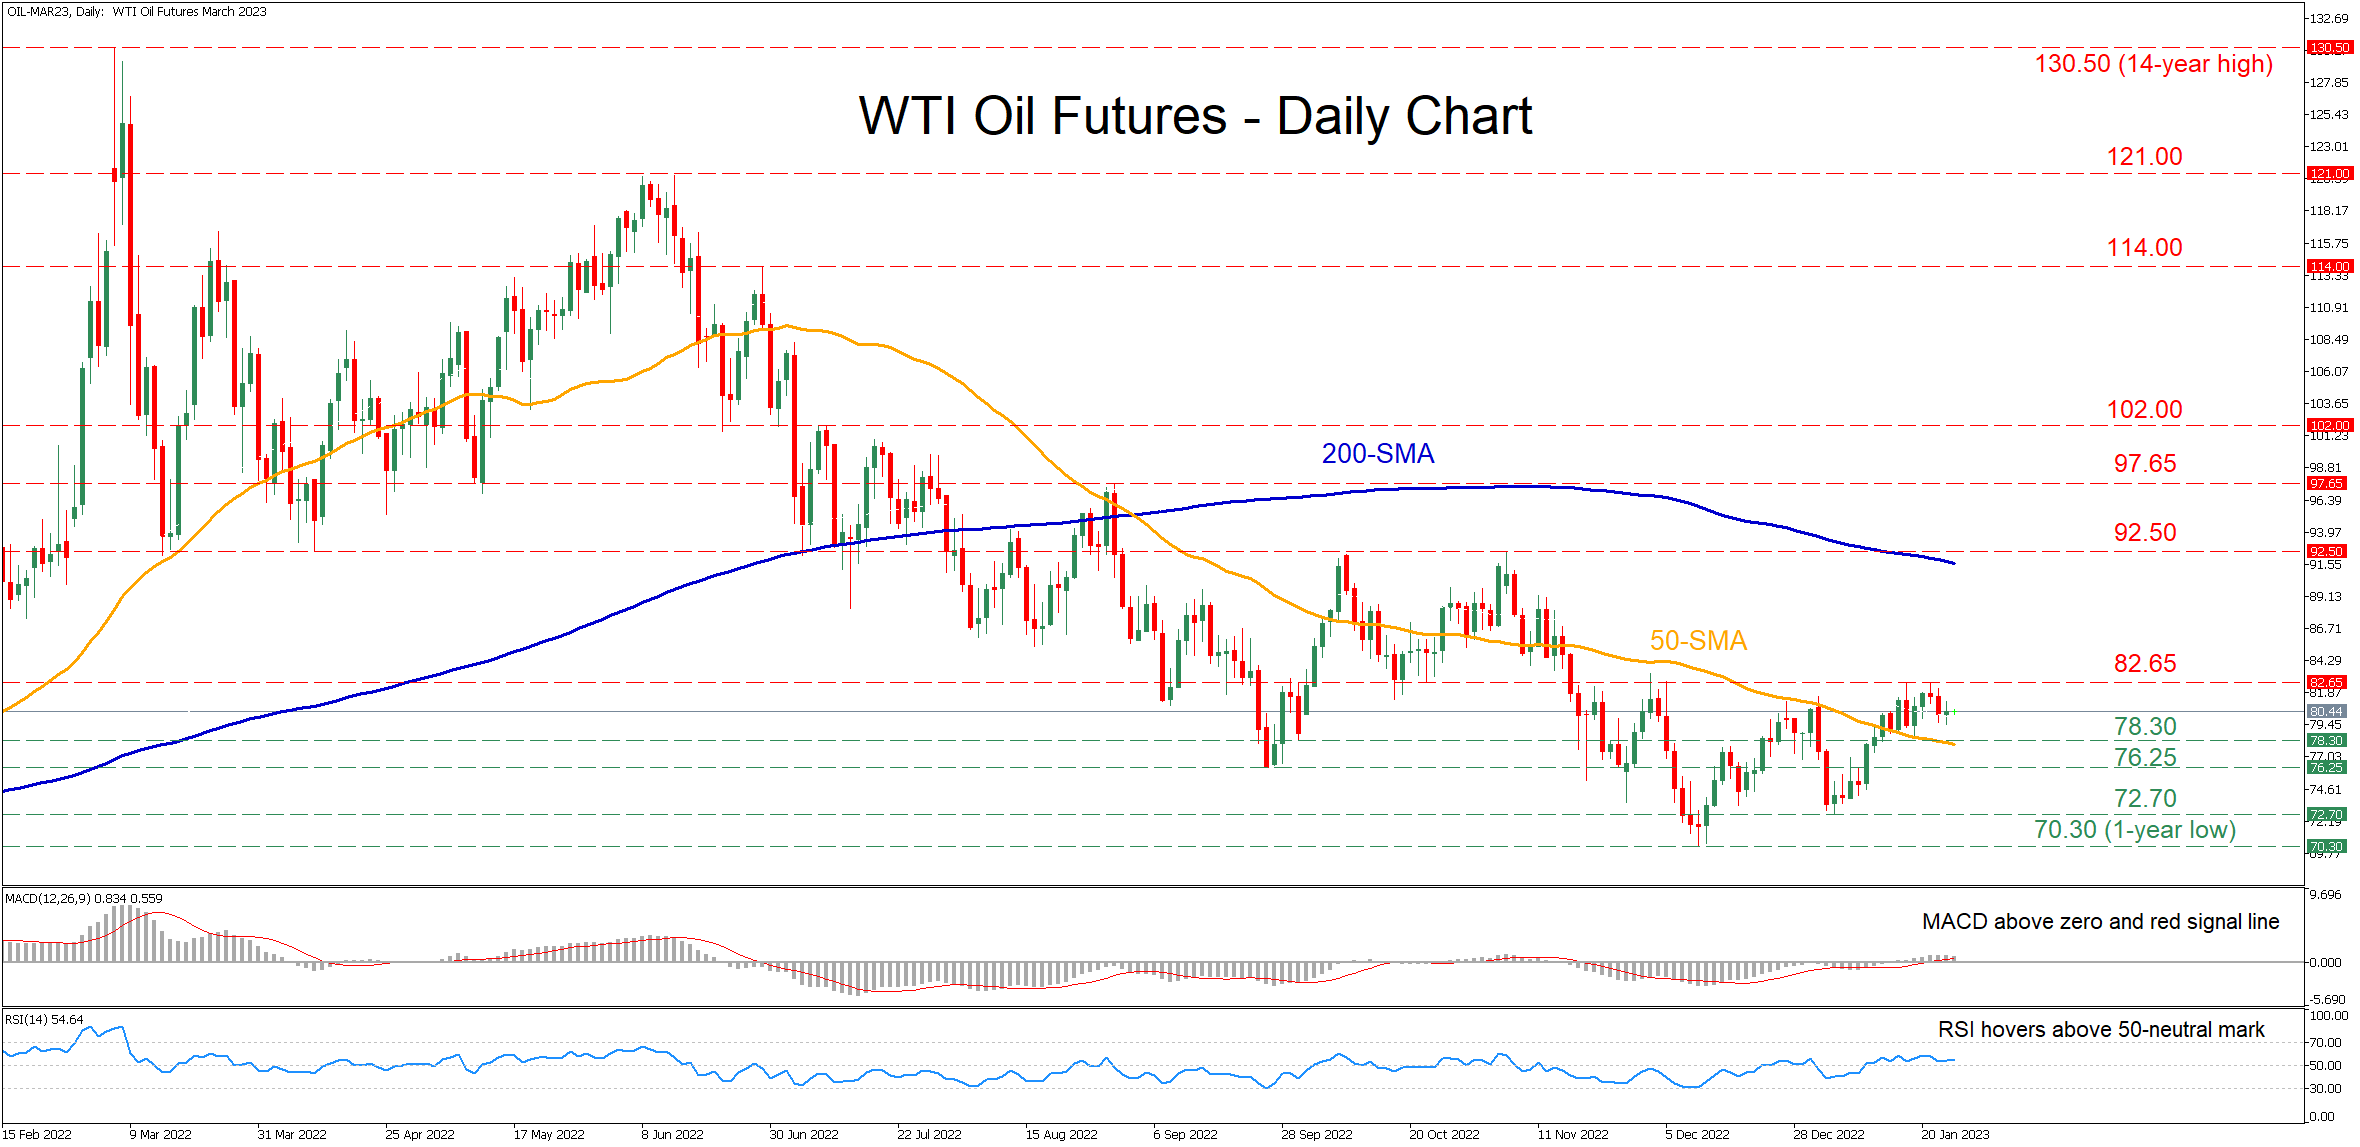
WTI oil futures (March delivery) have been stuck in a prolonged downtrend since June, generating a fresh one year-low of 70.30 in December. Even though the commodity managed to recoup some losses and break above its 50-day simple moving average (SMA), its rebound seems to be running out of juice.
The momentum indicators currently suggest that near-term risks are tilted to the upside. Specifically, the MACD histogram is softening but remains above zero and its red signal line, while the RSI is flatlining above its 50-neutral mark.
Should the positive momentum strengthen, initial resistance could be met at the 2023 peak of 82.65. Piercing through that wall, the price could ascend towards the November high of 92.50 before the 97.65 barrier comes under examination. Further advances could then cease at 102.00, which acted both as support and resistance in June.
To the downside, if sellers re-emerge and push the price lower, the recent support of 78.30 could act as the first line of defense. Sliding beneath that floor, the bears could aim for the September low of 76.25 before the 72.50 hurdle comes under examination. Failing to halt there, the price could challenge the one-year low of 70.30.
In brief, WTI oil futures appear unable to extend their rebound as they have been rejected twice by the 2023 peak of 82.65. Therefore, the commodity is likely to enter a consolidation phase, trading sideways between its recent strong resistance zone and the 50-day SMA.
Technical Outlook and Review
USD/JPY:
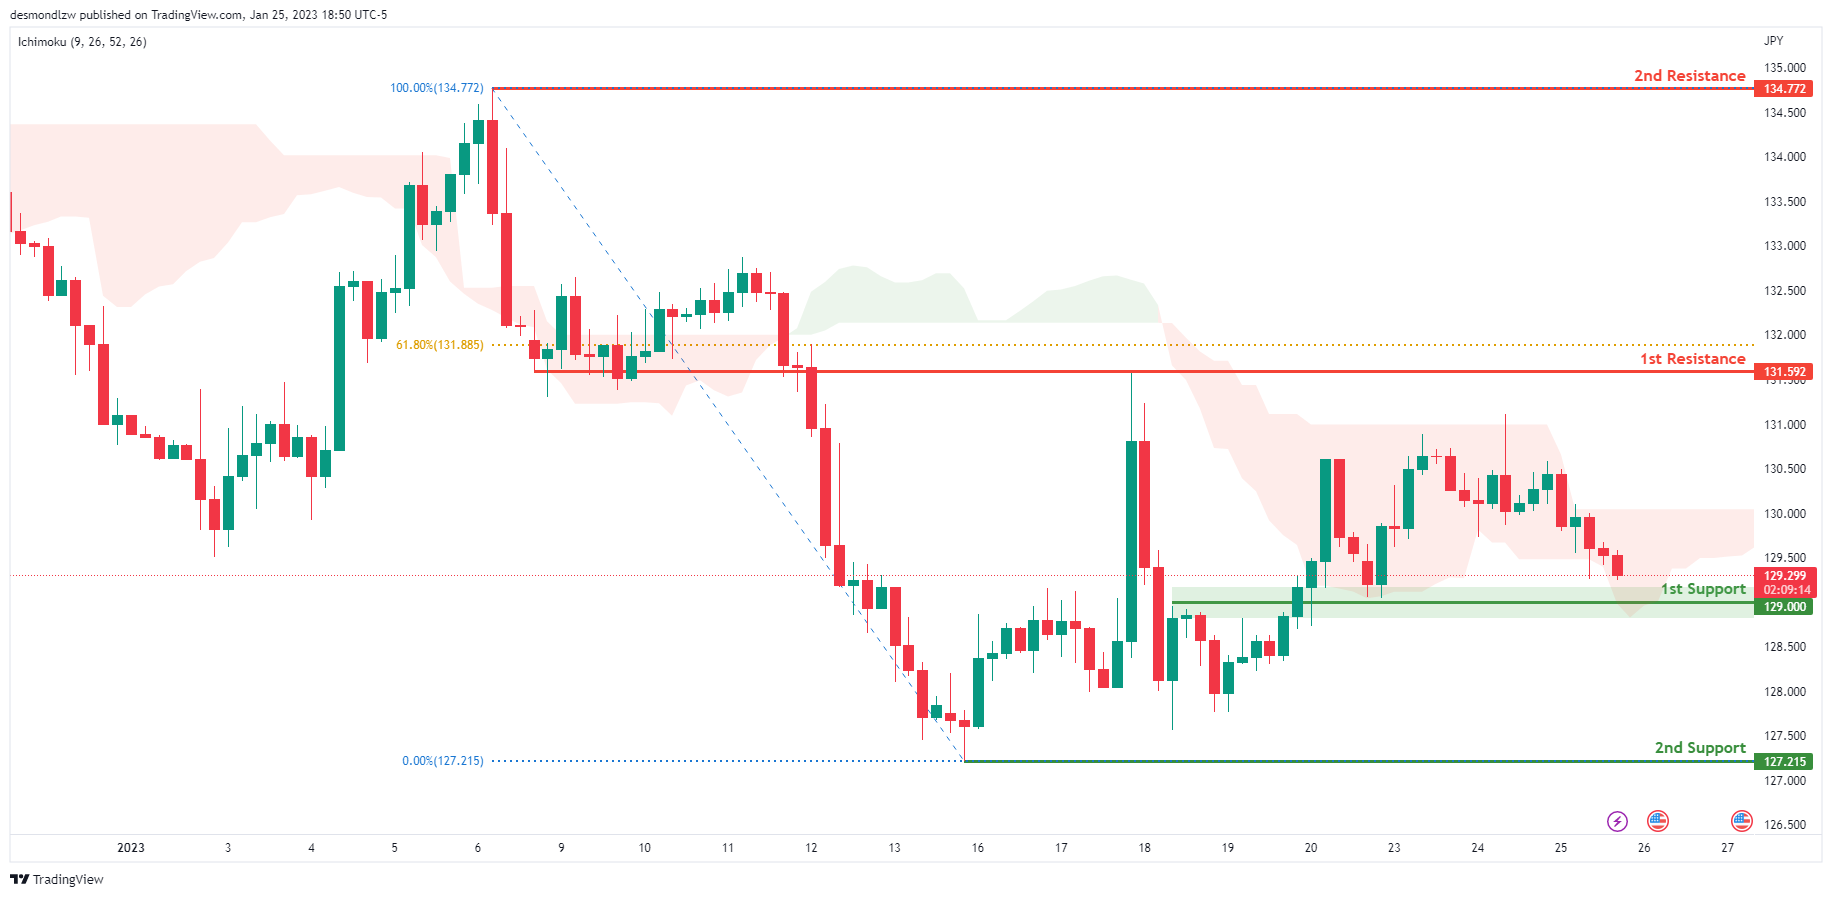
Looking at the H4 chart, my overall bias for USDJPY is bullish due to the current price crossing above the Ichimoku cloud, indicating a bullish market. If this bullish momentum continues, expect the price to possibly continue heading towards the 1st resistance level at 131.592, where the 61.8% Fibonacci line is. In an alternate scenario, price could possibly head back down to retest the 1st support at 129.000, where the overlap support is.
Areas of consideration:
- H4 time frame, 1st resistance at 131.592
- H4 time frame, 1st support at 129.000
DXY:
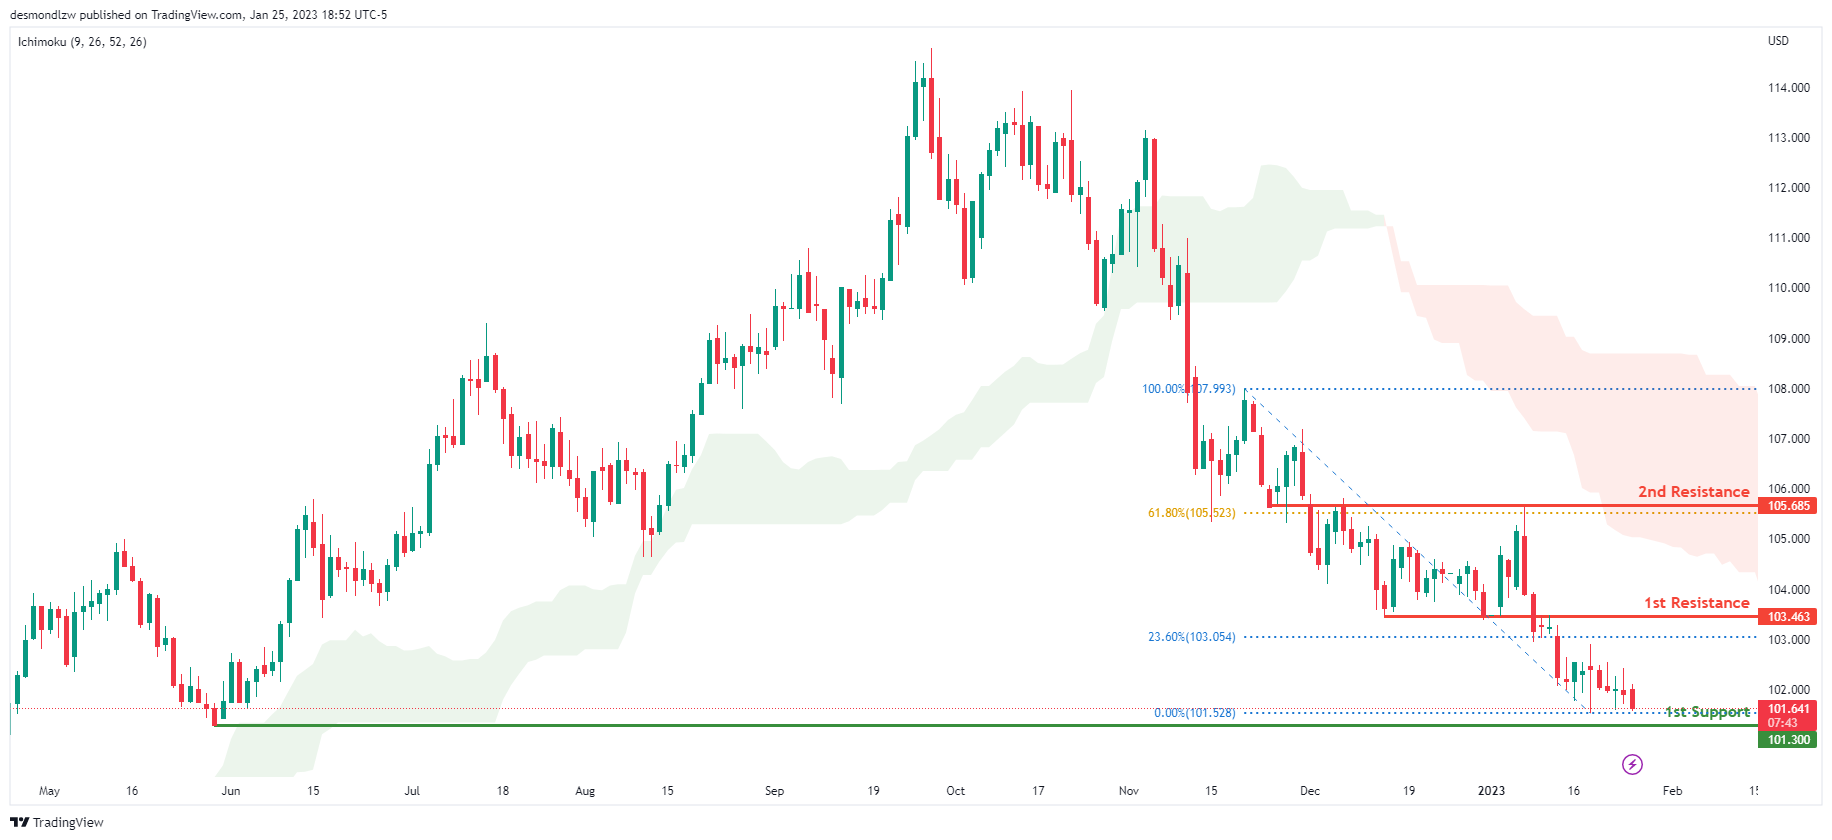
Looking at the Daily chart, my overall bias for DXY is bearish due to the current price being below the Ichimoku cloud, indicating a bearish market. If this bearish momentum continues, expect the price to possibly continue heading towards the 1st support at 101.300, where the previous low is. In an alternative scenario, price could head back up to retest the 1st resistance at 103.463, where the 23.6% Fibonacci line is.
Areas of consideration:
- H4 time frame, 1st resistance at 103.463
- H4 time frame, 1st support at 101.300
EUR/USD:
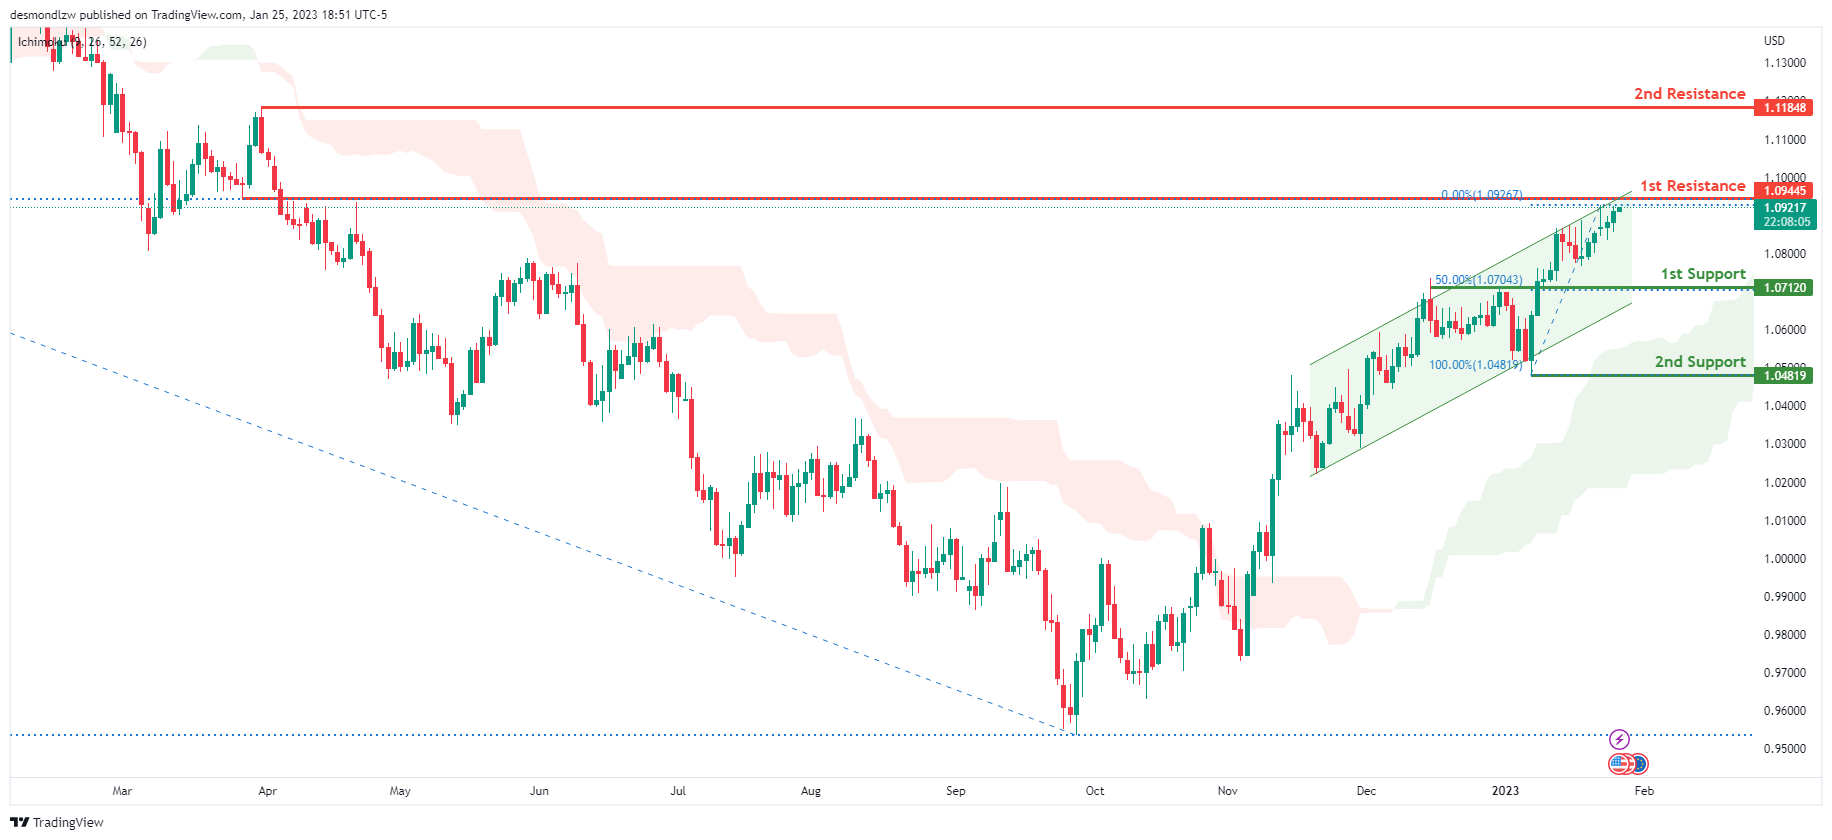
Looking at the Daily chart, my overall bias for EURUSD is bullish due to the current price being above the Ichimoku cloud, indicating a bullish market structure. To add confluence to this bias, price is also within an ascending channel. If this bullish momentum continues, expect the price to possibly continue heading towards the 1st resistance at 1.09445, where the 50% Fibonacci line is. In an alternate scenario, price could possibly head back down to retest the 1st support level at 1.07120, where the 50% Fibonacci line is.
Areas of consideration :
- H4 1st resistance at 1.09445
- H4 1st support at 1.07120
GBP/USD:
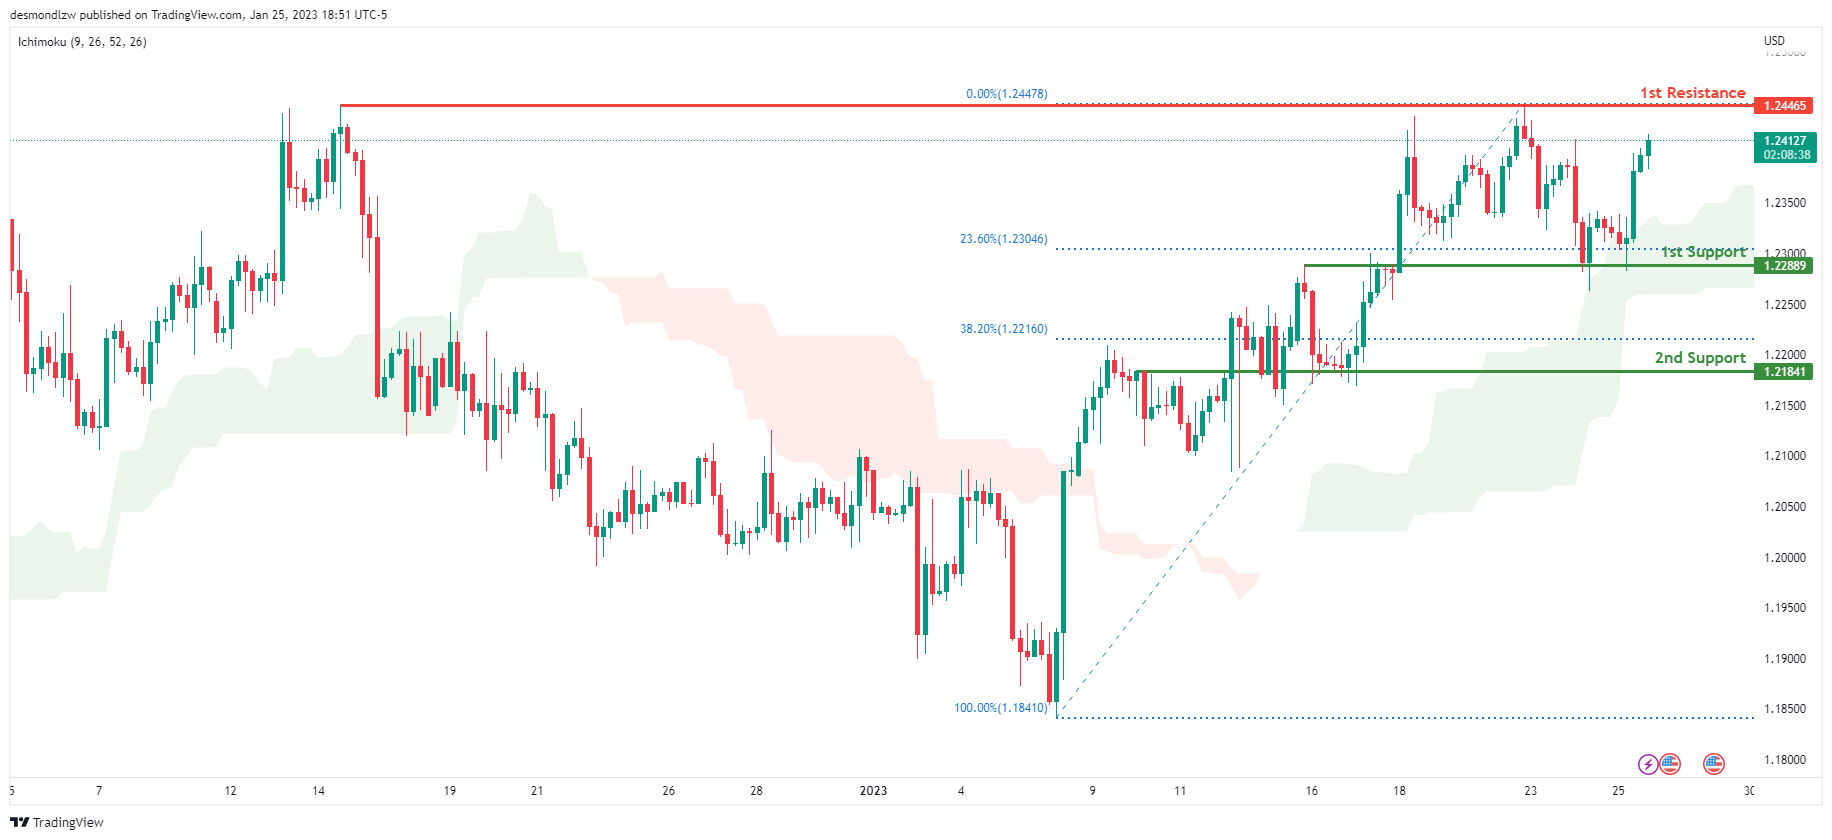
Looking at the H4 chart, my overall bias for GBPUSD is bullish due to the current price being above the Ichimoku cloud, indicating a bullish market. If this bullish momentum continues, expect price to possibly continue heading towards the 1st resistance line at 1.24465, where the previous swing high is. In an alternate scenario, price could possibly head back down and retest the 1st support at 1.22889, where the 23.6% Fibonacci line is.
Areas of consideration:
- H4 1st resistance at 1.24465
- H4 1st support at 1.22889
USD/CHF:
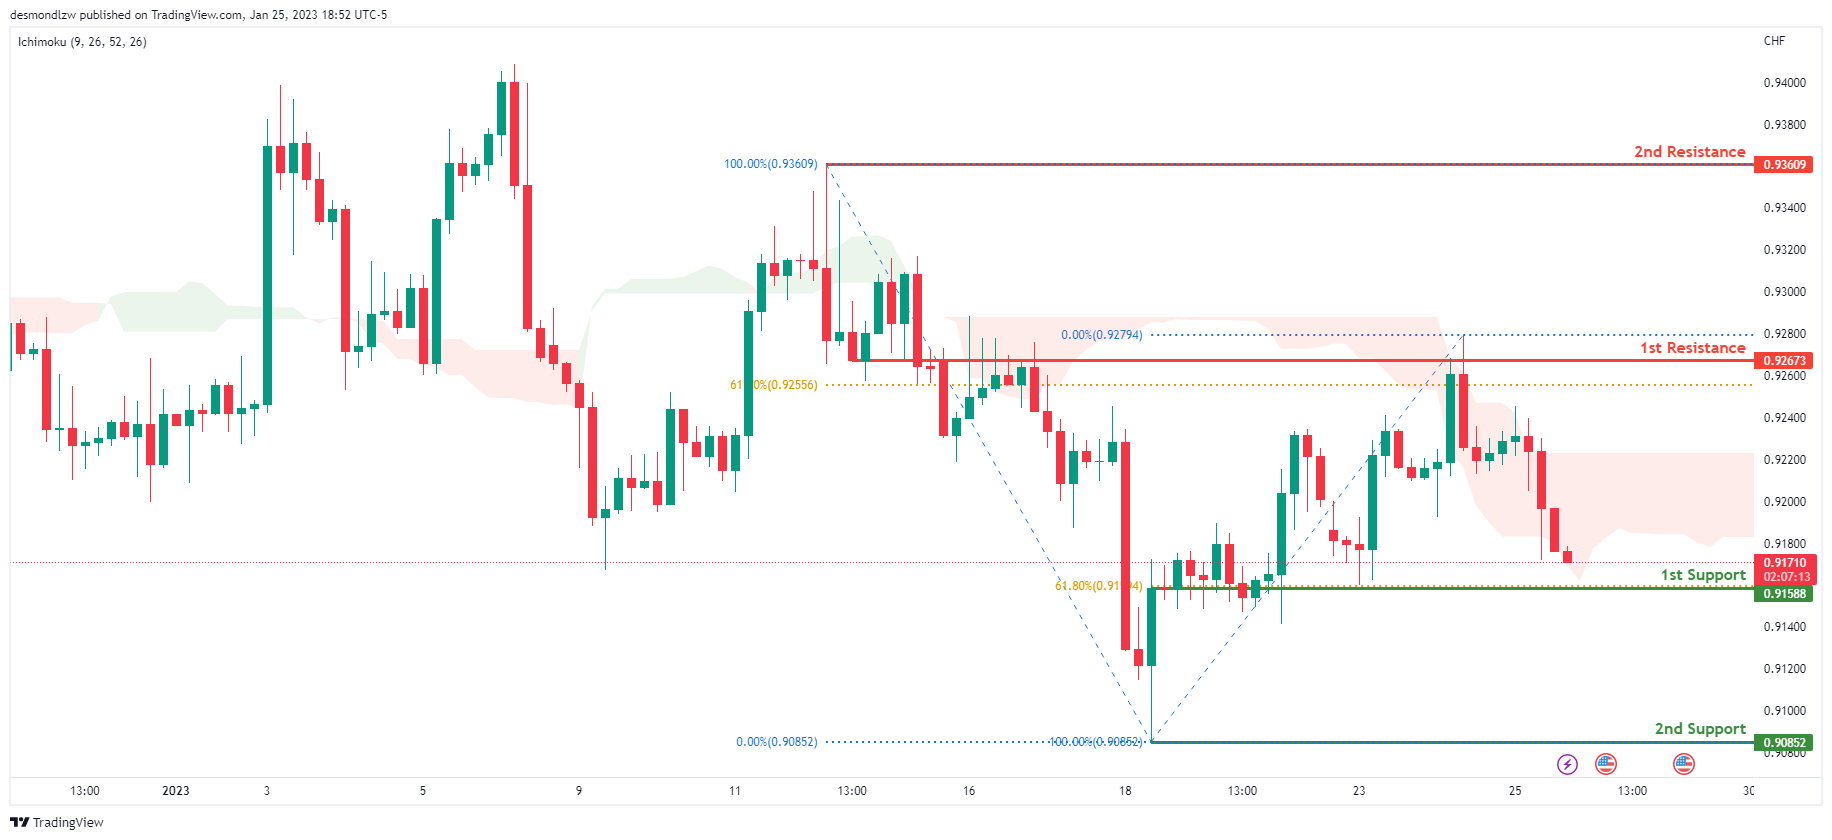
Looking at the H4 chart, my overall bias for USDCHF is bearish due to the current price crossing below the Ichimoku cloud, indicating a bearish market. If the current bearish trend continues, expect the price to possibly continue to head towards the 1st support at 0.91588, where the 61.8% Fibonacci line is. In an alternative scenario, price could possibly head back up to retest the 1st resistance at 0.92673, where the 61.8% Fibonacci line is.
Areas of consideration
- H4 1st support at 0.91588
- H4 1st resistance at 0.92673
XAU/USD (GOLD):
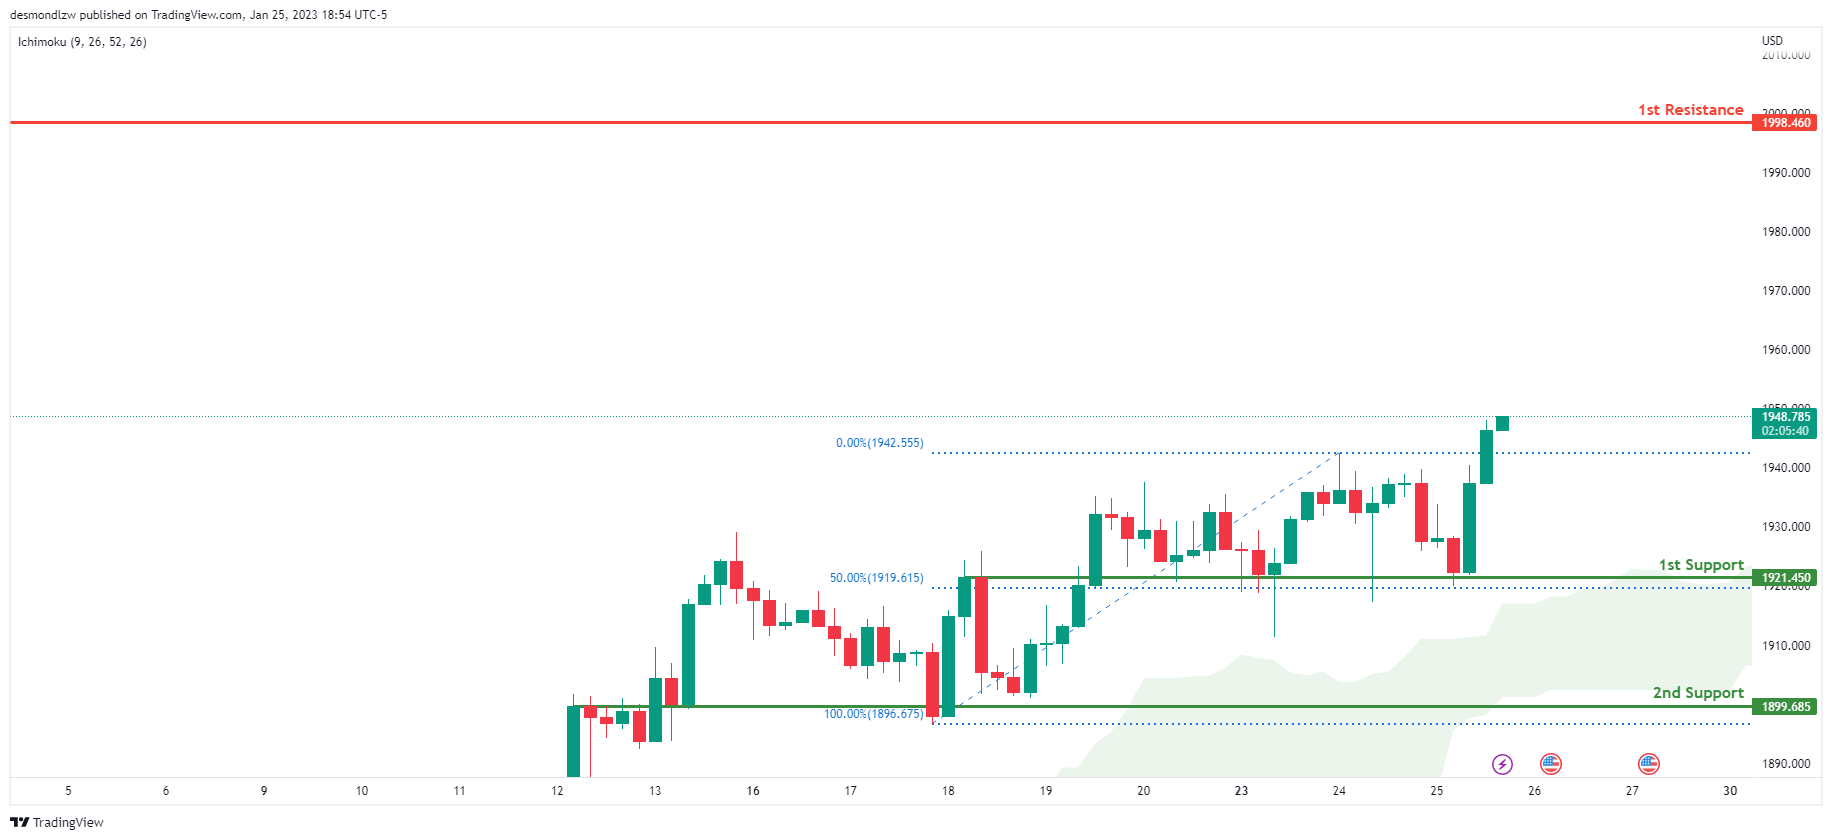
Looking at the H4 chart, my overall bias for XAUUSD is bullish due to the current price being above the Ichimoku cloud, indicating a bullish market. If this bullish momentum continues, expect the price to possibly continue heading towards the 1st resistance at 1998.460, where the intermediary high is. In an alternative scenario, price could possibly head back down to retest the 1st support at 1921.450 where the 50% Fibonacci line is.
Areas of consideration:
- H4 time frame, 1st resistance at 1998.460
- H4 time frame, 1st support at 1921.450
AUD/USD:
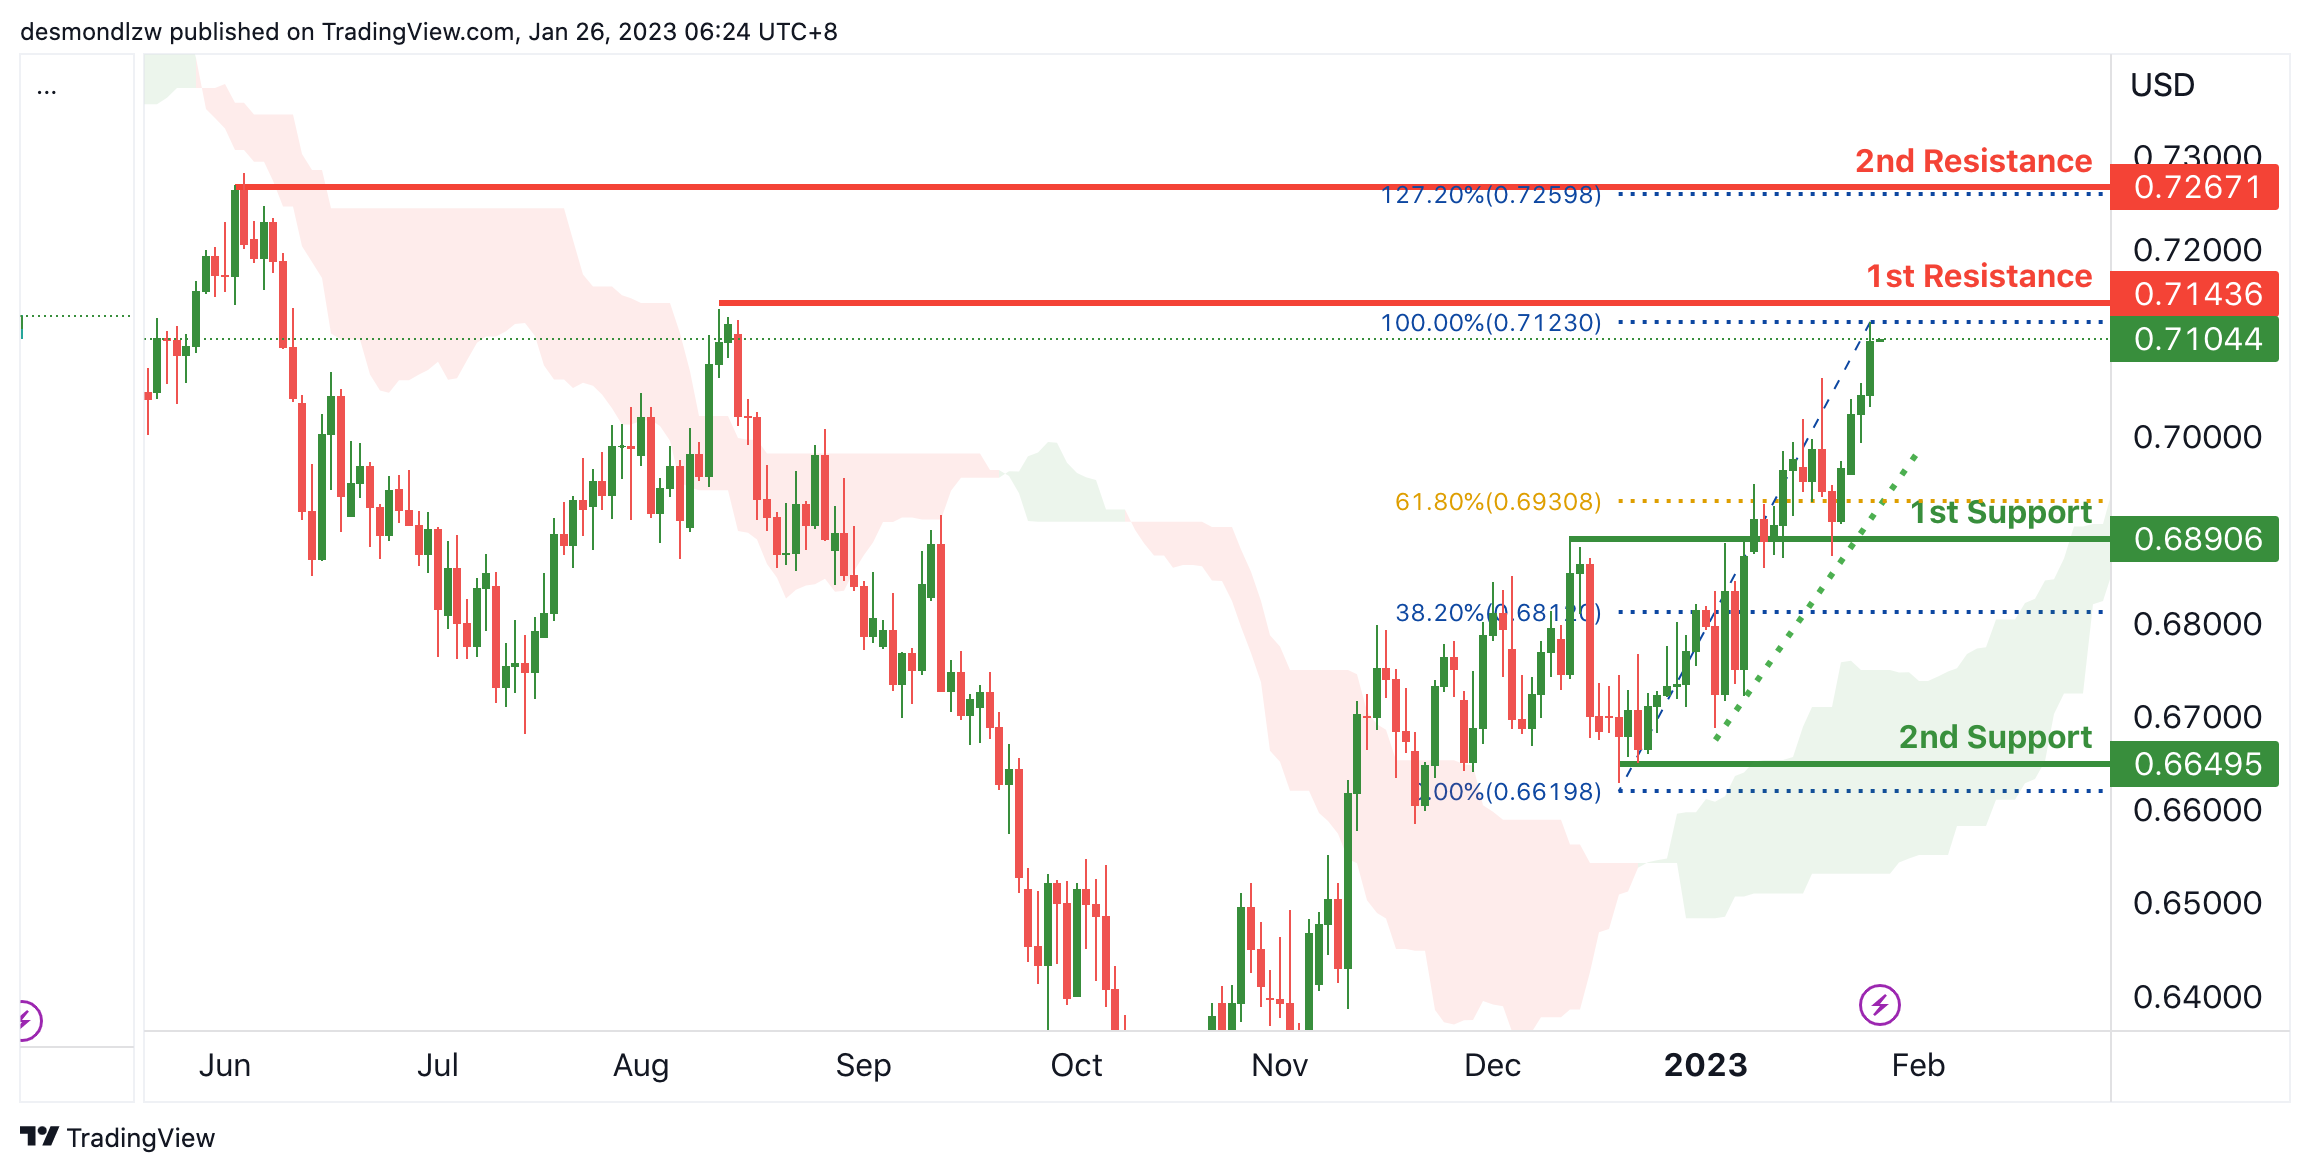
Looking at the H4 chart, we can see that the 1st support is at 0.68906 which is a recent swing low. As the price is above the Ichimoku cloud
Combined with the up trend line, suggests the bullish market.
In terms of resistance, the 1st resistance area is at 0.71436 which is the recent swing high. And the 2nd resistance is at 0.72671 which is in line with the 127% Fibonacci extension. Expecting the price will break the 1st resistance and take profit at intermediate resistance.
Areas of consideration
- H4 , 2nd resistance at 0.72671
- H4. 1st resistance at 0.71436
- H4, 1st support at 0.68906
NZD/USD:
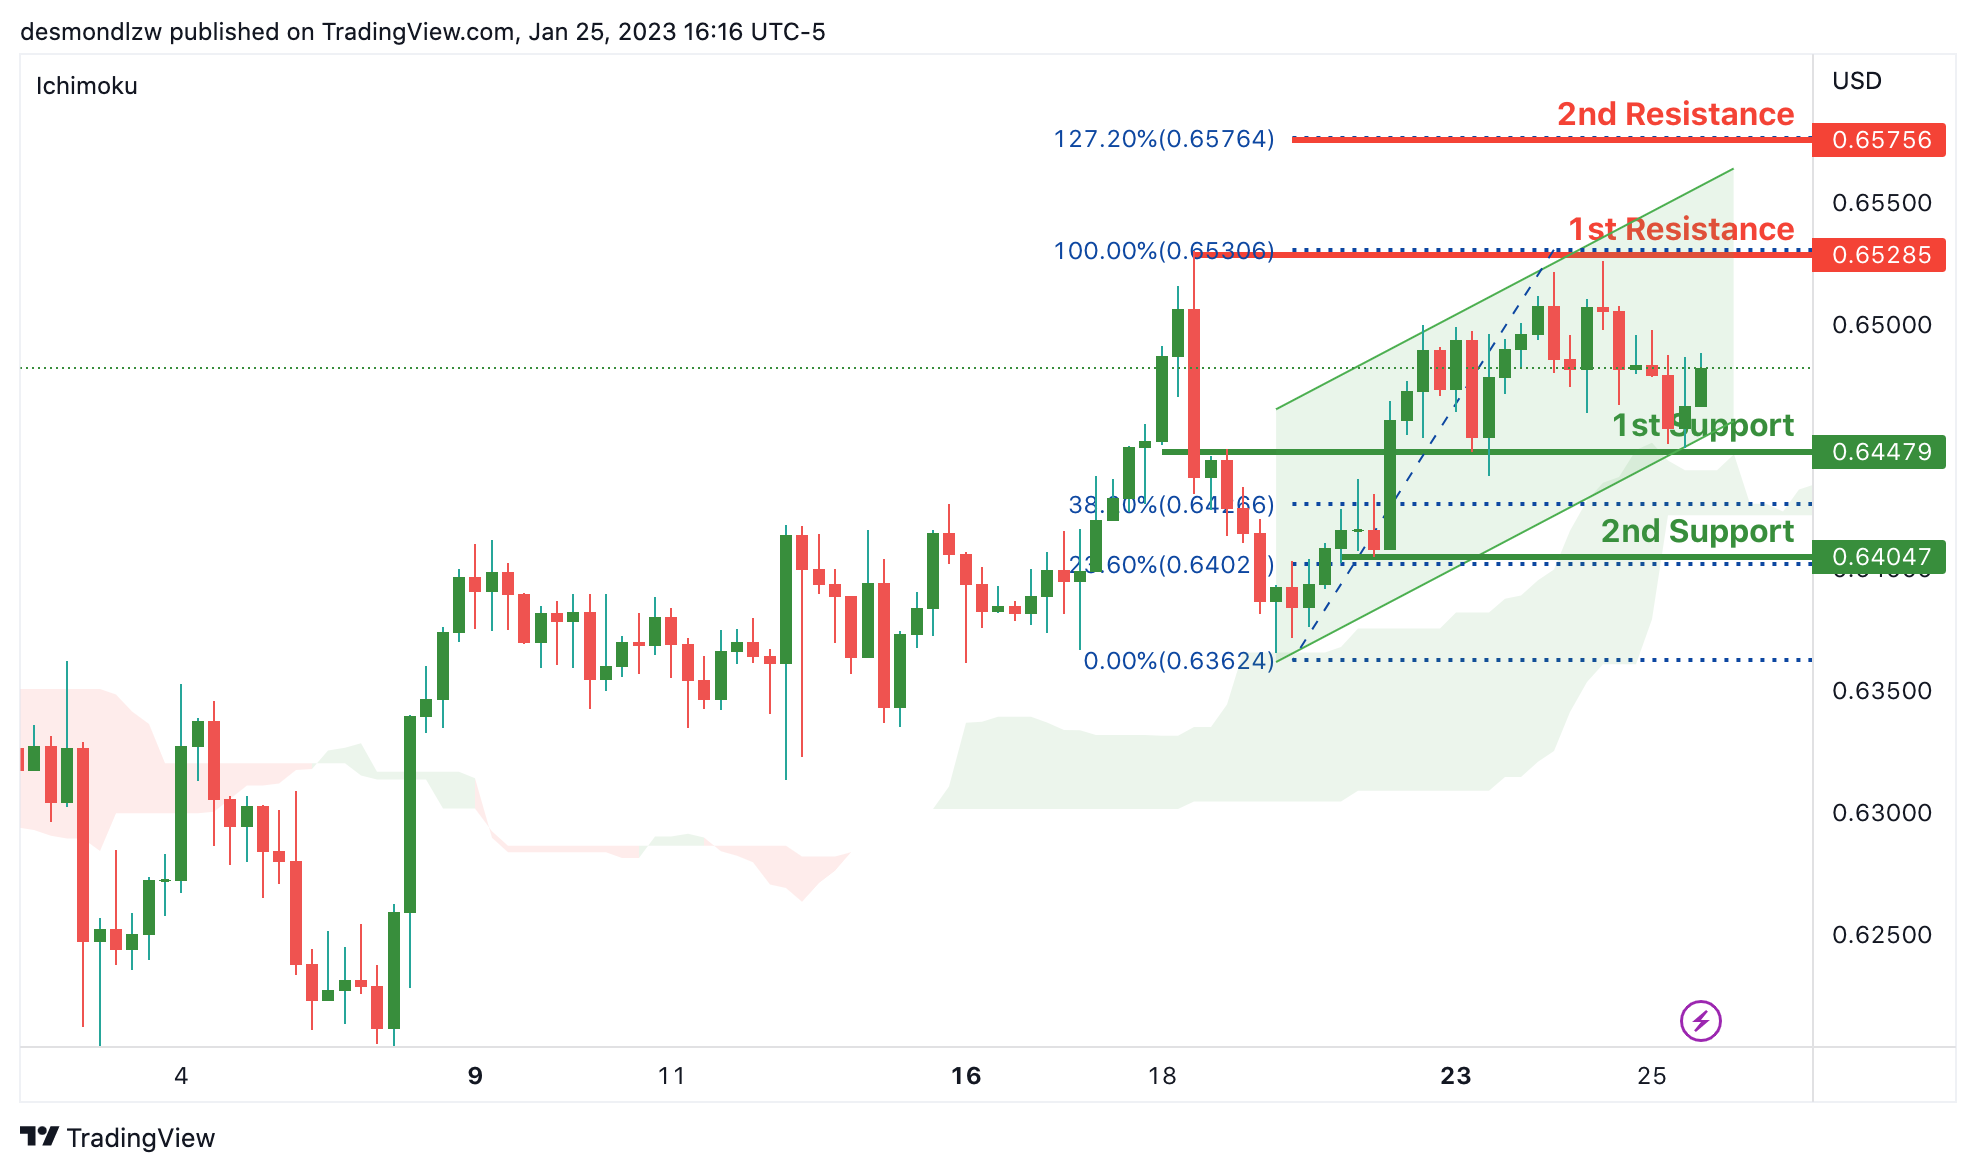
Looking at the H4 chart, we can see that the 1st support is at 0.64479 which is an overlap support. As the current price is above Ichimoku cloud, and there is an ascending channel, which indicates there is a bullish market. If this momentum continues, the price is expected to move to the 1st resistance at 0.65306 which is the recent swing high. And the 2nd resistance is 127% Fibonacci extension which is at 0.65756.
In alternative scenario, the price may drop break the 1st support level and drop to 2nd support at 0.64047
Areas of consideration:
- H4 time frame, 2nd resistance at 0.65756.
- H4 time frame, 1st resistance at 0.65306
- H4 time frame, 1st support at 0.64479
- H4 time frame, 2nd support at 0.64047
USD/CAD:
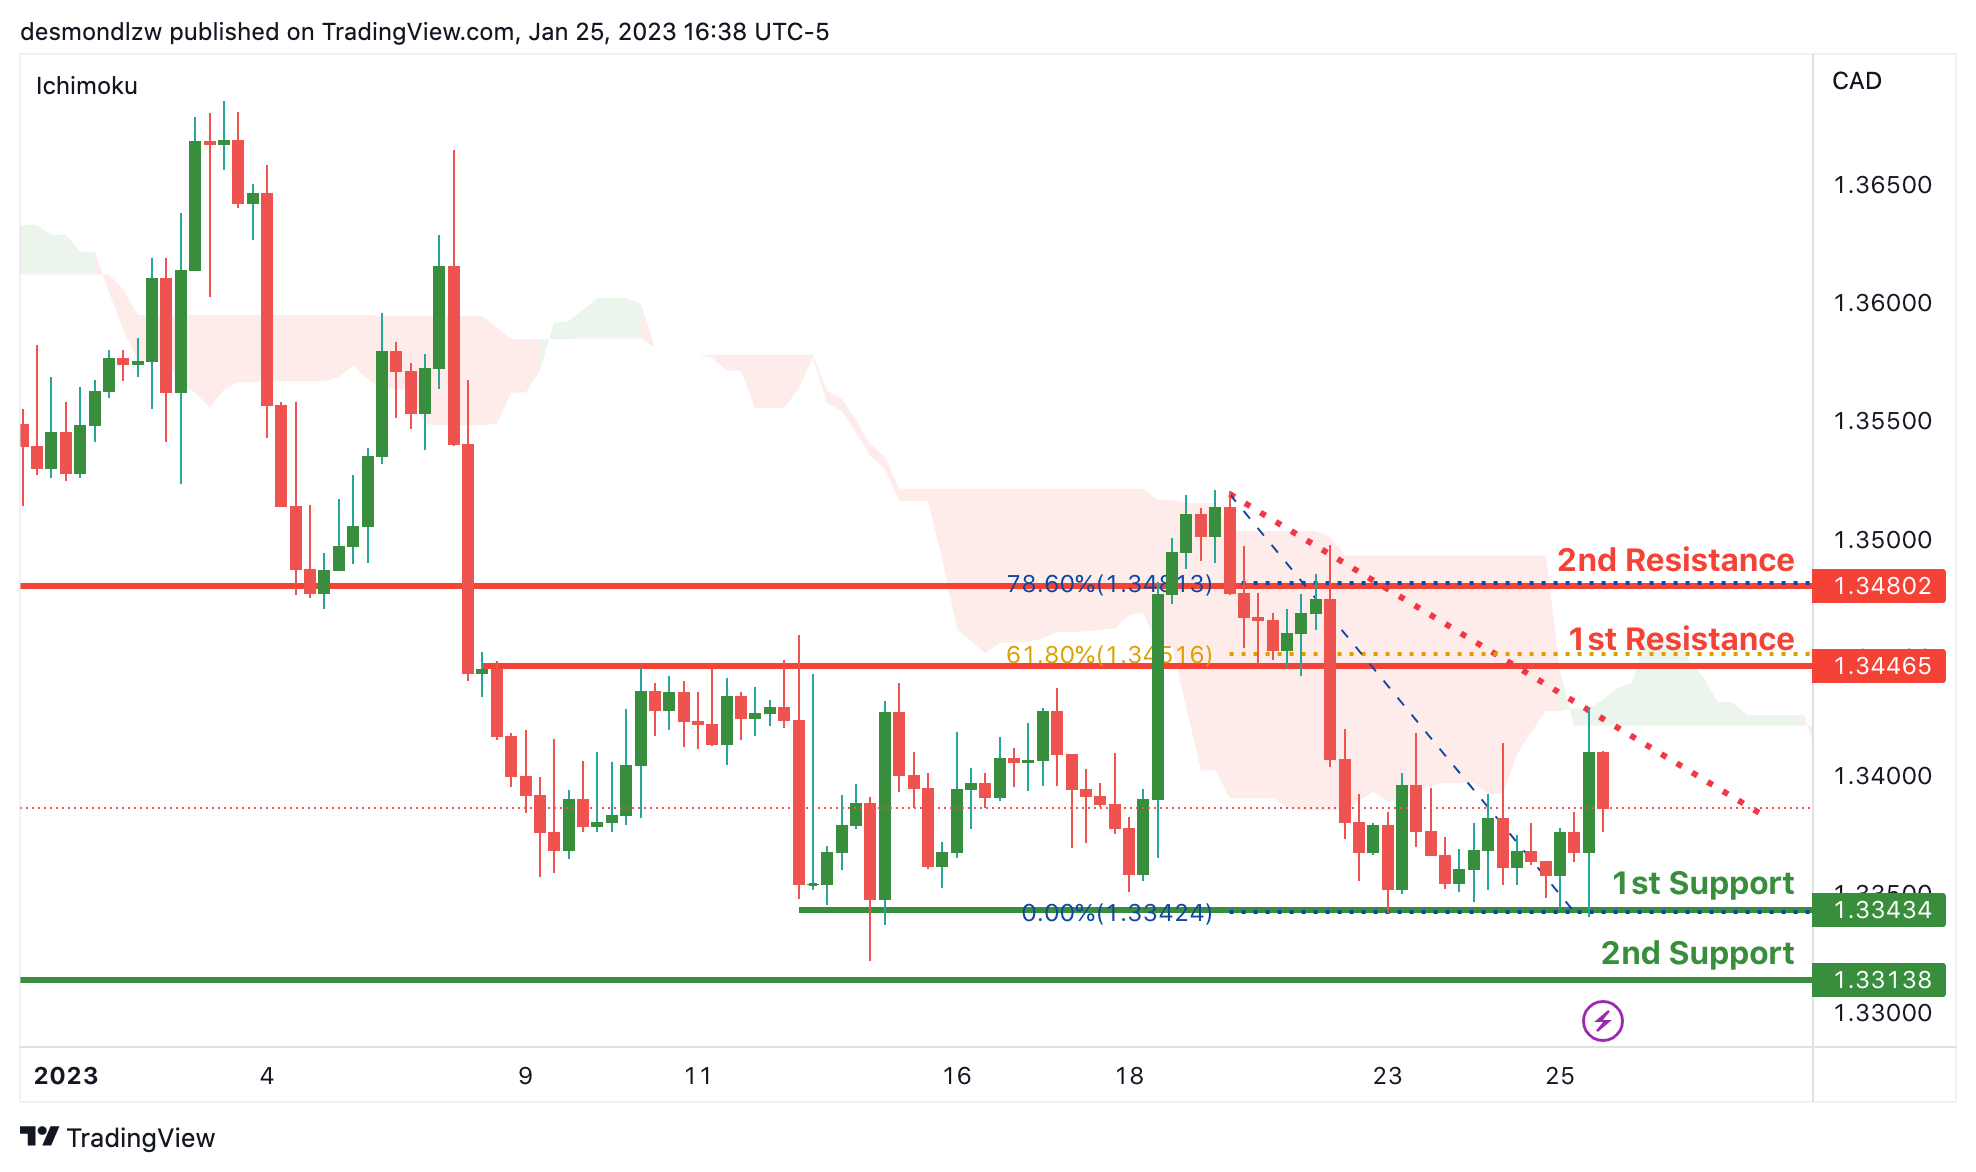
Looking at the H4 chart, my overall bias for USDCAD is bearish, due to the current price being below the Ichimoku cloud, and there is a descending trend line indicating a bullish market. If this bearish momentum continues, expect the price to possibly continue heading towards the 1st support at 1.33434 which is an overlap support and recent swing low. The price may further drop to the 2nd support at 1.33138.
In an alternative scenario, price could possibly head up to the 1st resistance at 1.34465 which is in line with 61.8% Fibonacci retracement. The 2nd resistance is at 1.34802 which is in line with 78.6% Fibonacci line.
Areas of consideration:
- H4 time frame, 2nd resistance 1.34802
- H4 time frame, 1st resistance at 1.34465
- H4 time frame, 1st support at 1.33434
- H4 time frame, 2nd support at 1.33138
OIL:
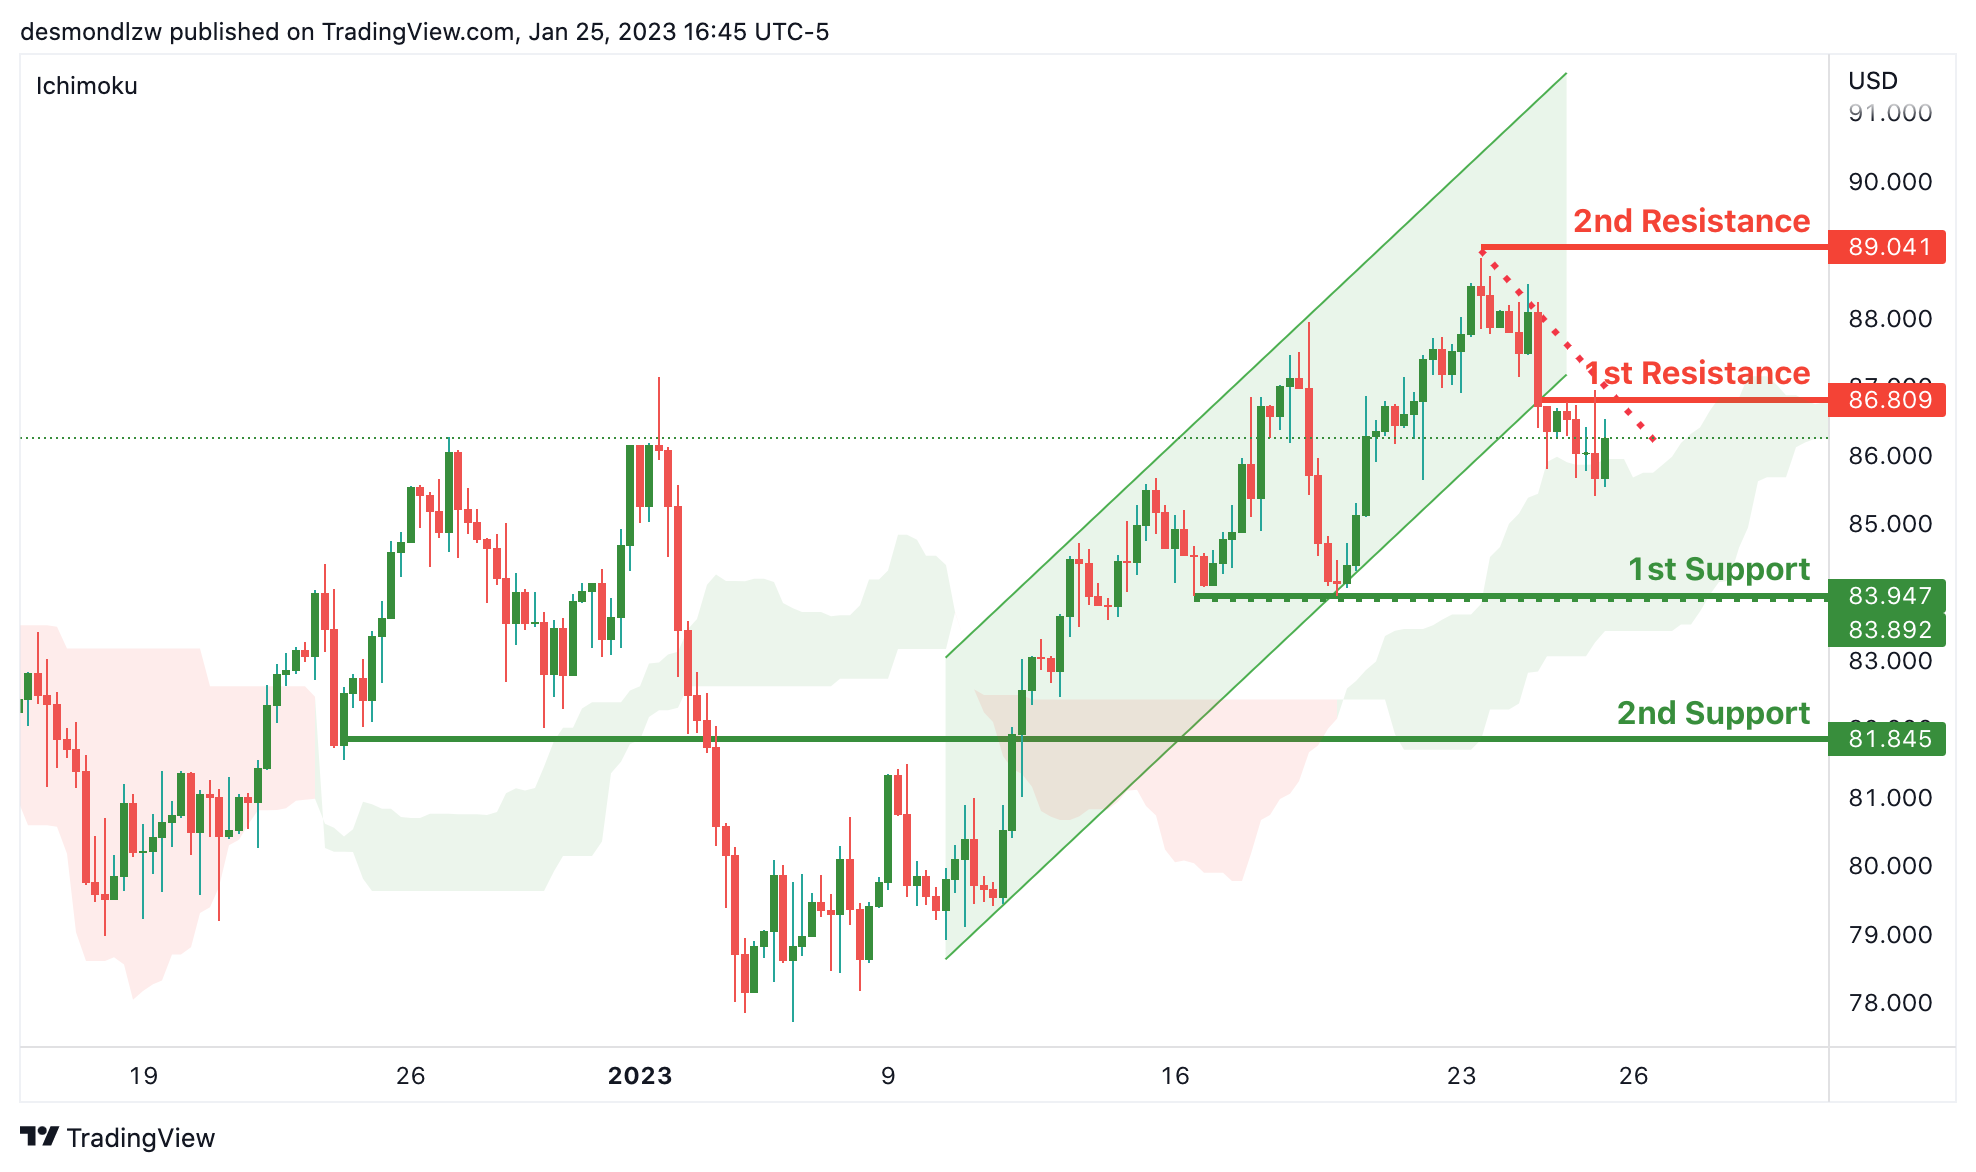
Looking at the H4 chart, my overall bias for BOC is bearish, as the current ascending trend line has been broken and the price is moving within the Ichimoku cloud, a downside trend line has been created, suggesting there is bearish market. The price may drop to the 1st support at 83.947, if this bearish momentum continues, the price is expected to move down to the 2nd support at 81.845.
In terms of resistance, the 1st resistance is at 86.809 which is the recent swing high. 2nd resistance is at 89.041.
Areas of consideration:
- H4 time frame, 2nd resistance at 89.041
- H4 time frame, 1st resistance at 86.809
- H4 time frame,1st support at 83.947,
- Hr time frame, 2nd support at 81.845
Dow Jones Industrial Average:
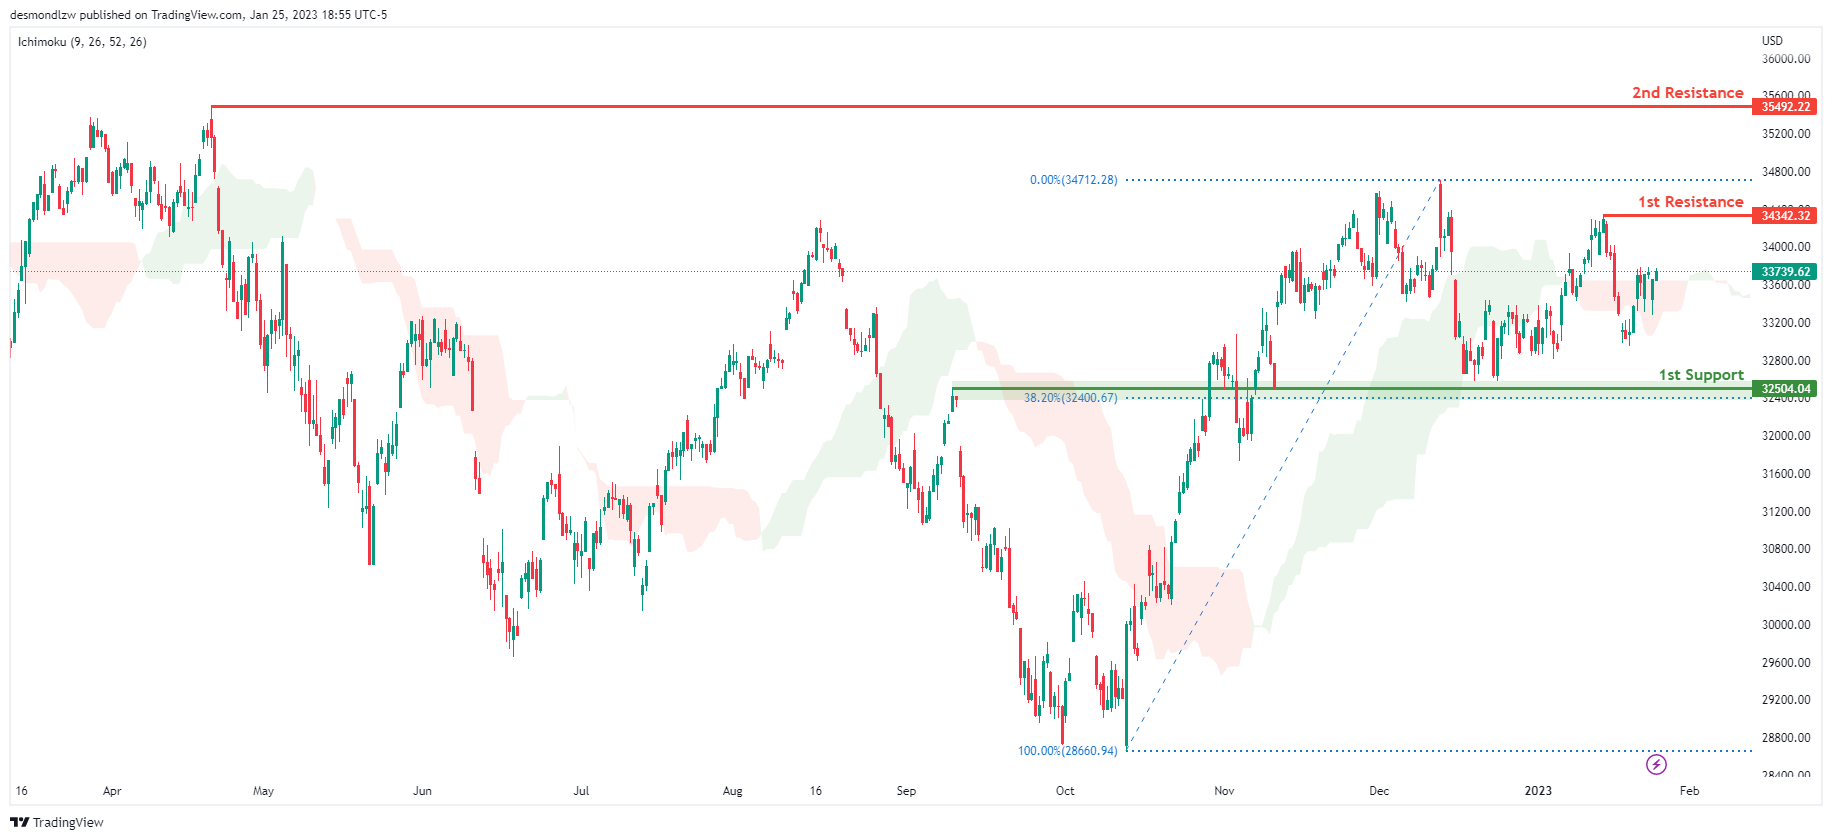
On the H4 chart, the overall bias for DJI is bullish. To add confluence to this, the price is crossing above the Ichimoku cloud which indicates a bullish market. If this bullish momentum continues, expect the price to possibly continue heading towards the 1st resistance line at 34342.32, where the recent swing high is. In an alternative scenario, price could possibly head back down towards the 1st support at 32581.97, slightly above where the 38.2% Fibonacci line is.
Areas of consideration:
- H4 time frame, 1st support at 32581.97
- H4 time frame, 1st Resistance at 34342.32
DAX:
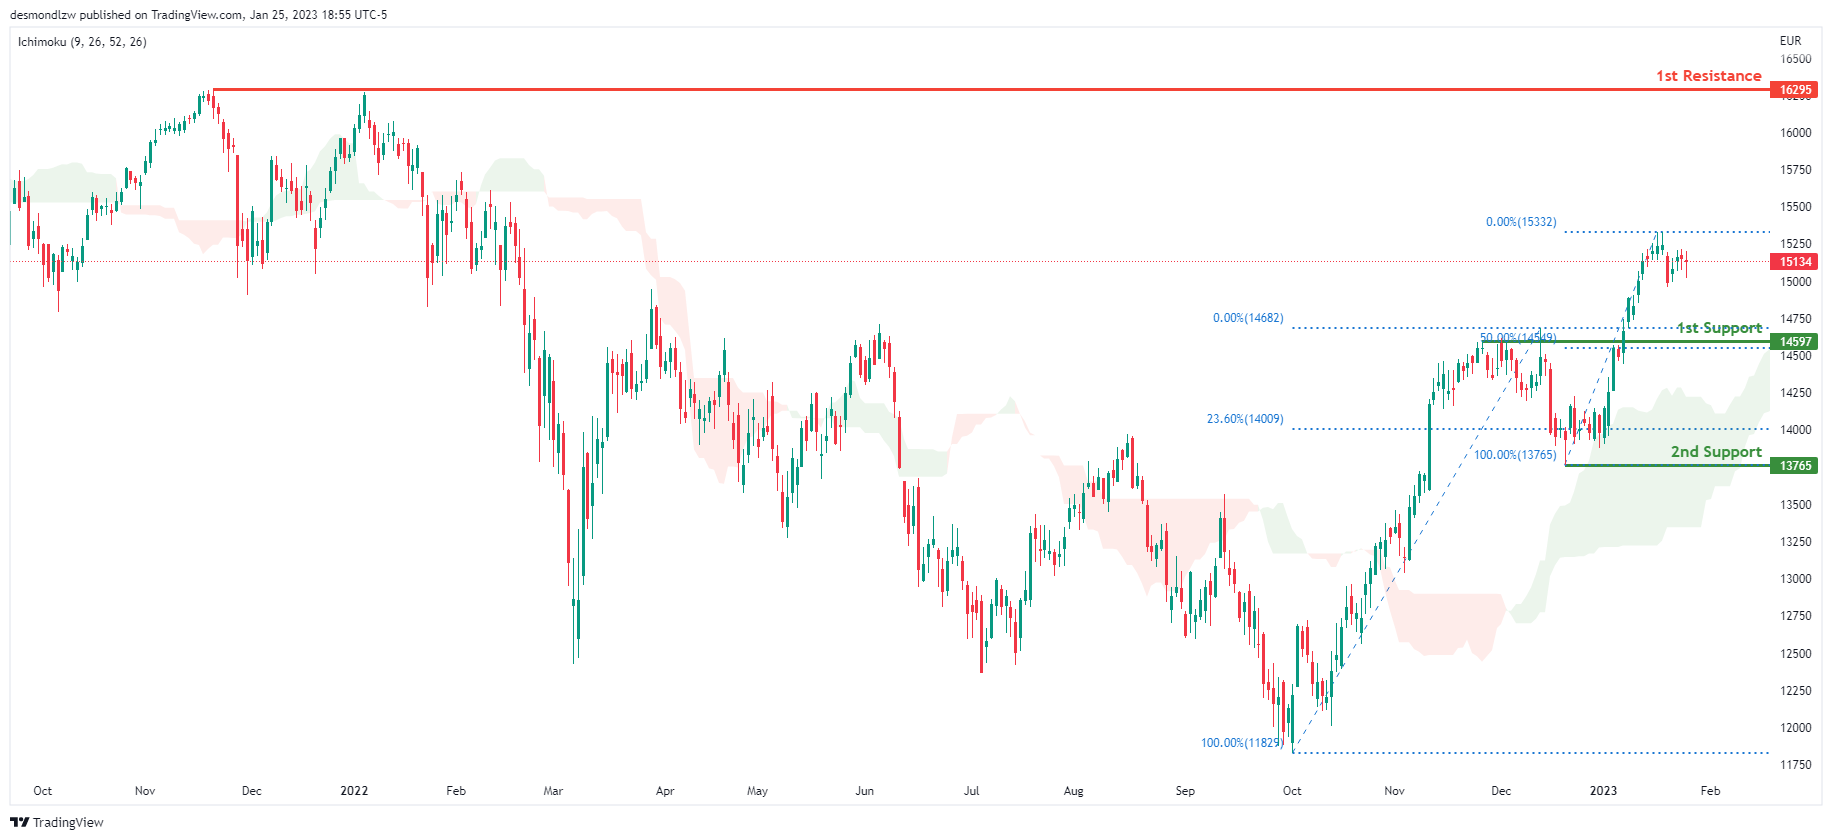
Looking at the Daily chart, my overall bias for DAX is bullish due to the current price crossing above the Ichimoku cloud, indicating a bullish market. If this bullish momentum continues, expect the price to possibly head towards the 1st resistance line at 16295, where the previous swing high is. In an alternative scenario, price could possibly head down to retest the 1st support at 14597, where the 50% Fibonacci line is.
Areas of consideration:
- H4 time frame, 1st resistance is at 16295
- H4 time frame, 1st support is at 14597
ETHUSD:
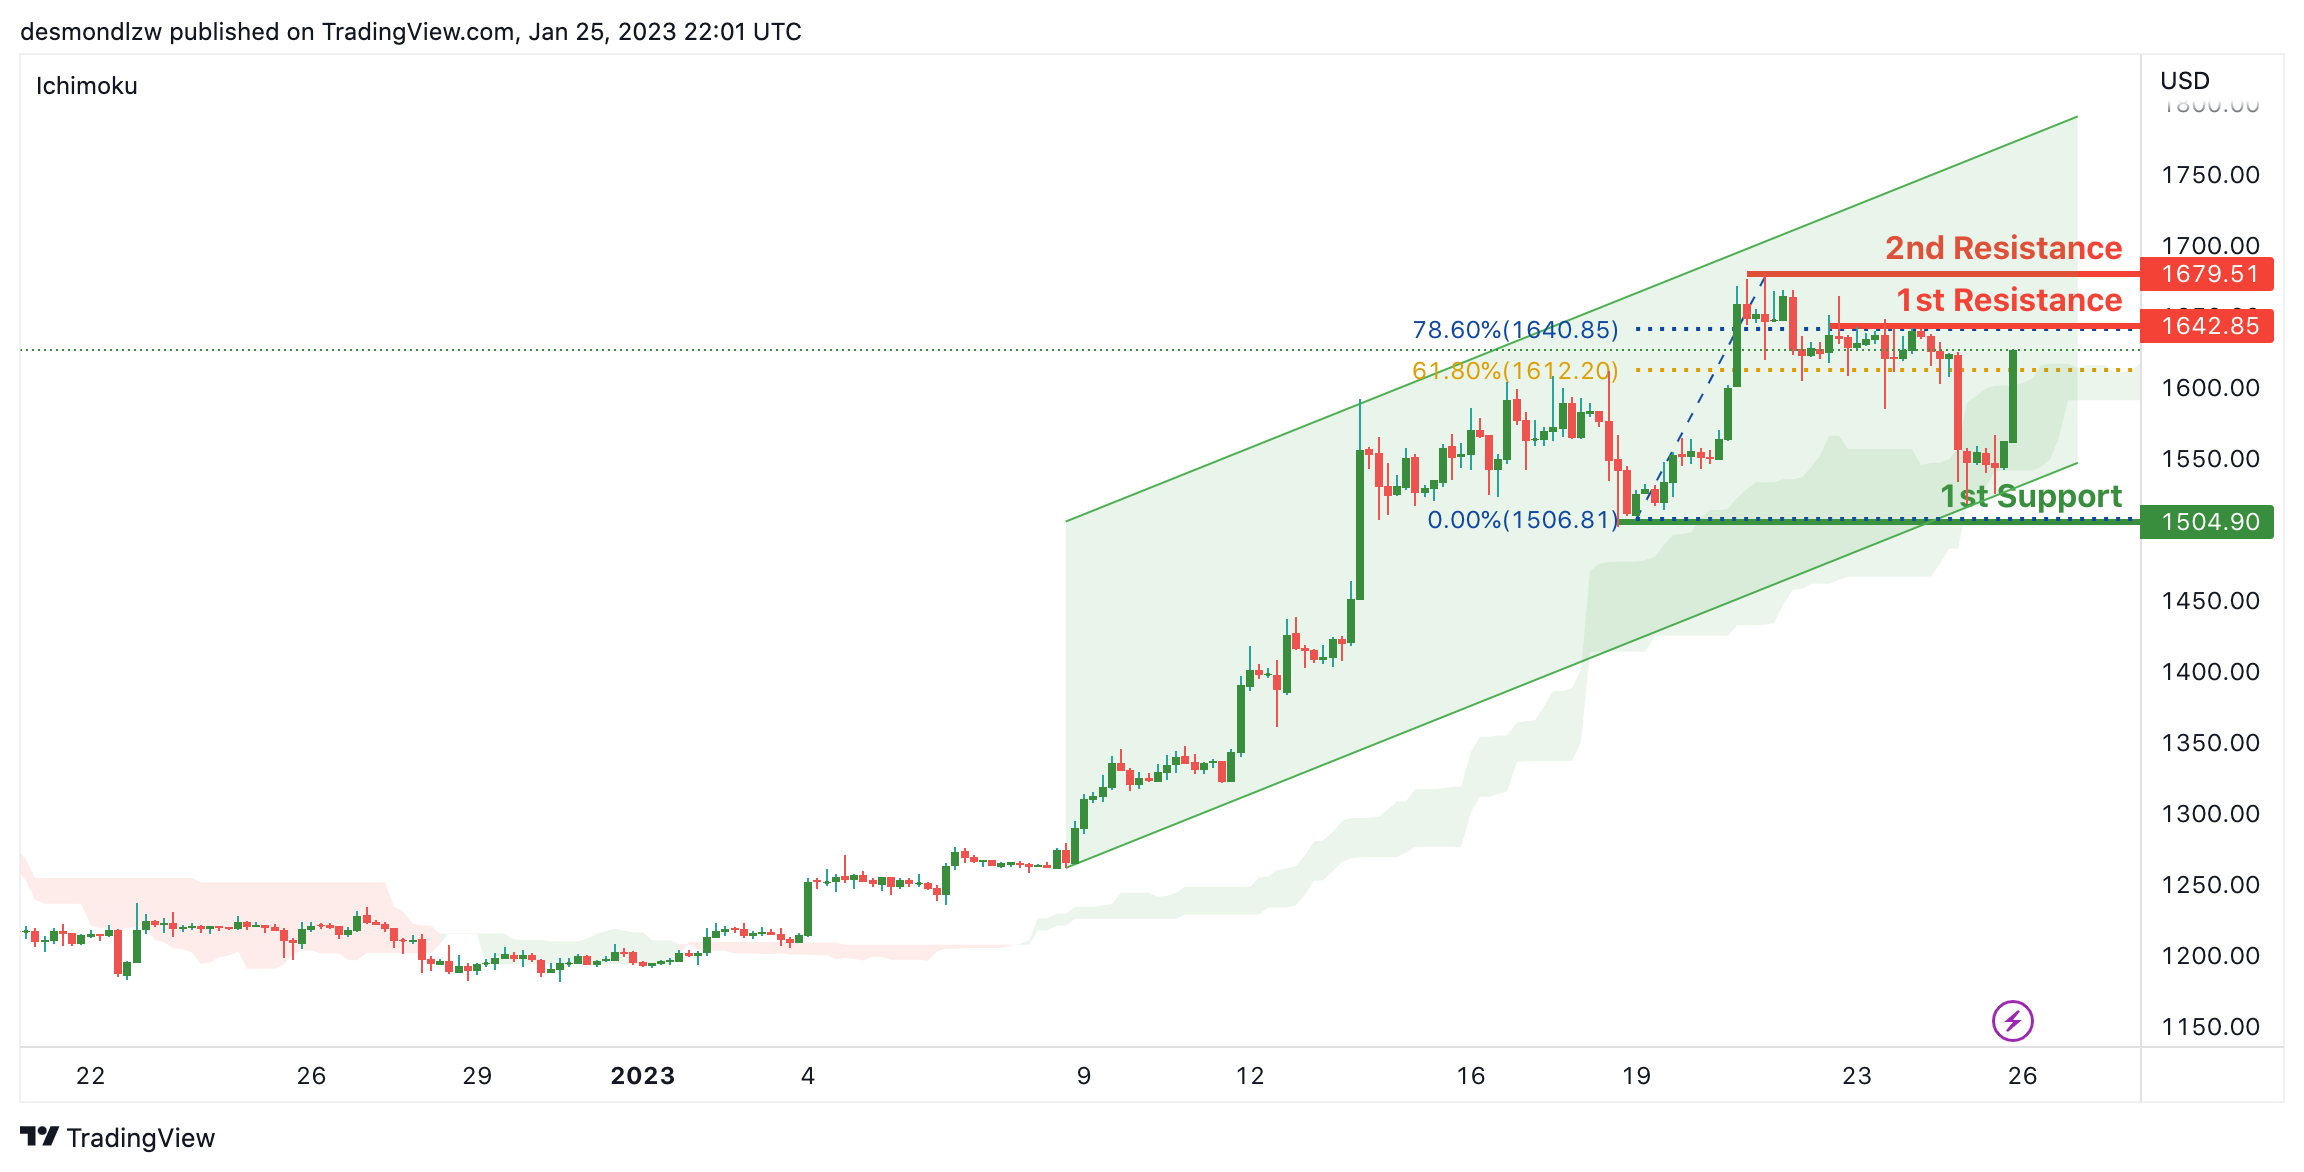
Looking at the H4 chart, my overall bias for ETHUSD is bullish, as the current price is above the Ichimoku cloud and an ascending trend line has been created. The price may move up to the 1st resistance at 1642.85 which is an overlap resistance and in line with 61.8% Fibonacci retracement. If the bullish momentum continues, the price may rise to the 2nd resistance at 1679.51 which is the recent6 swing high.
In an alternative scenario, the price may down to the 1st support at 1506.81 which is the recent swing low.
Areas of consideration:
- H4 time frame, 2nd resistance 1679.51
- H4 time frame, 1st resistance of 1642.85
- H4 time frame, 1st support at 1506.81
BTCUSD:
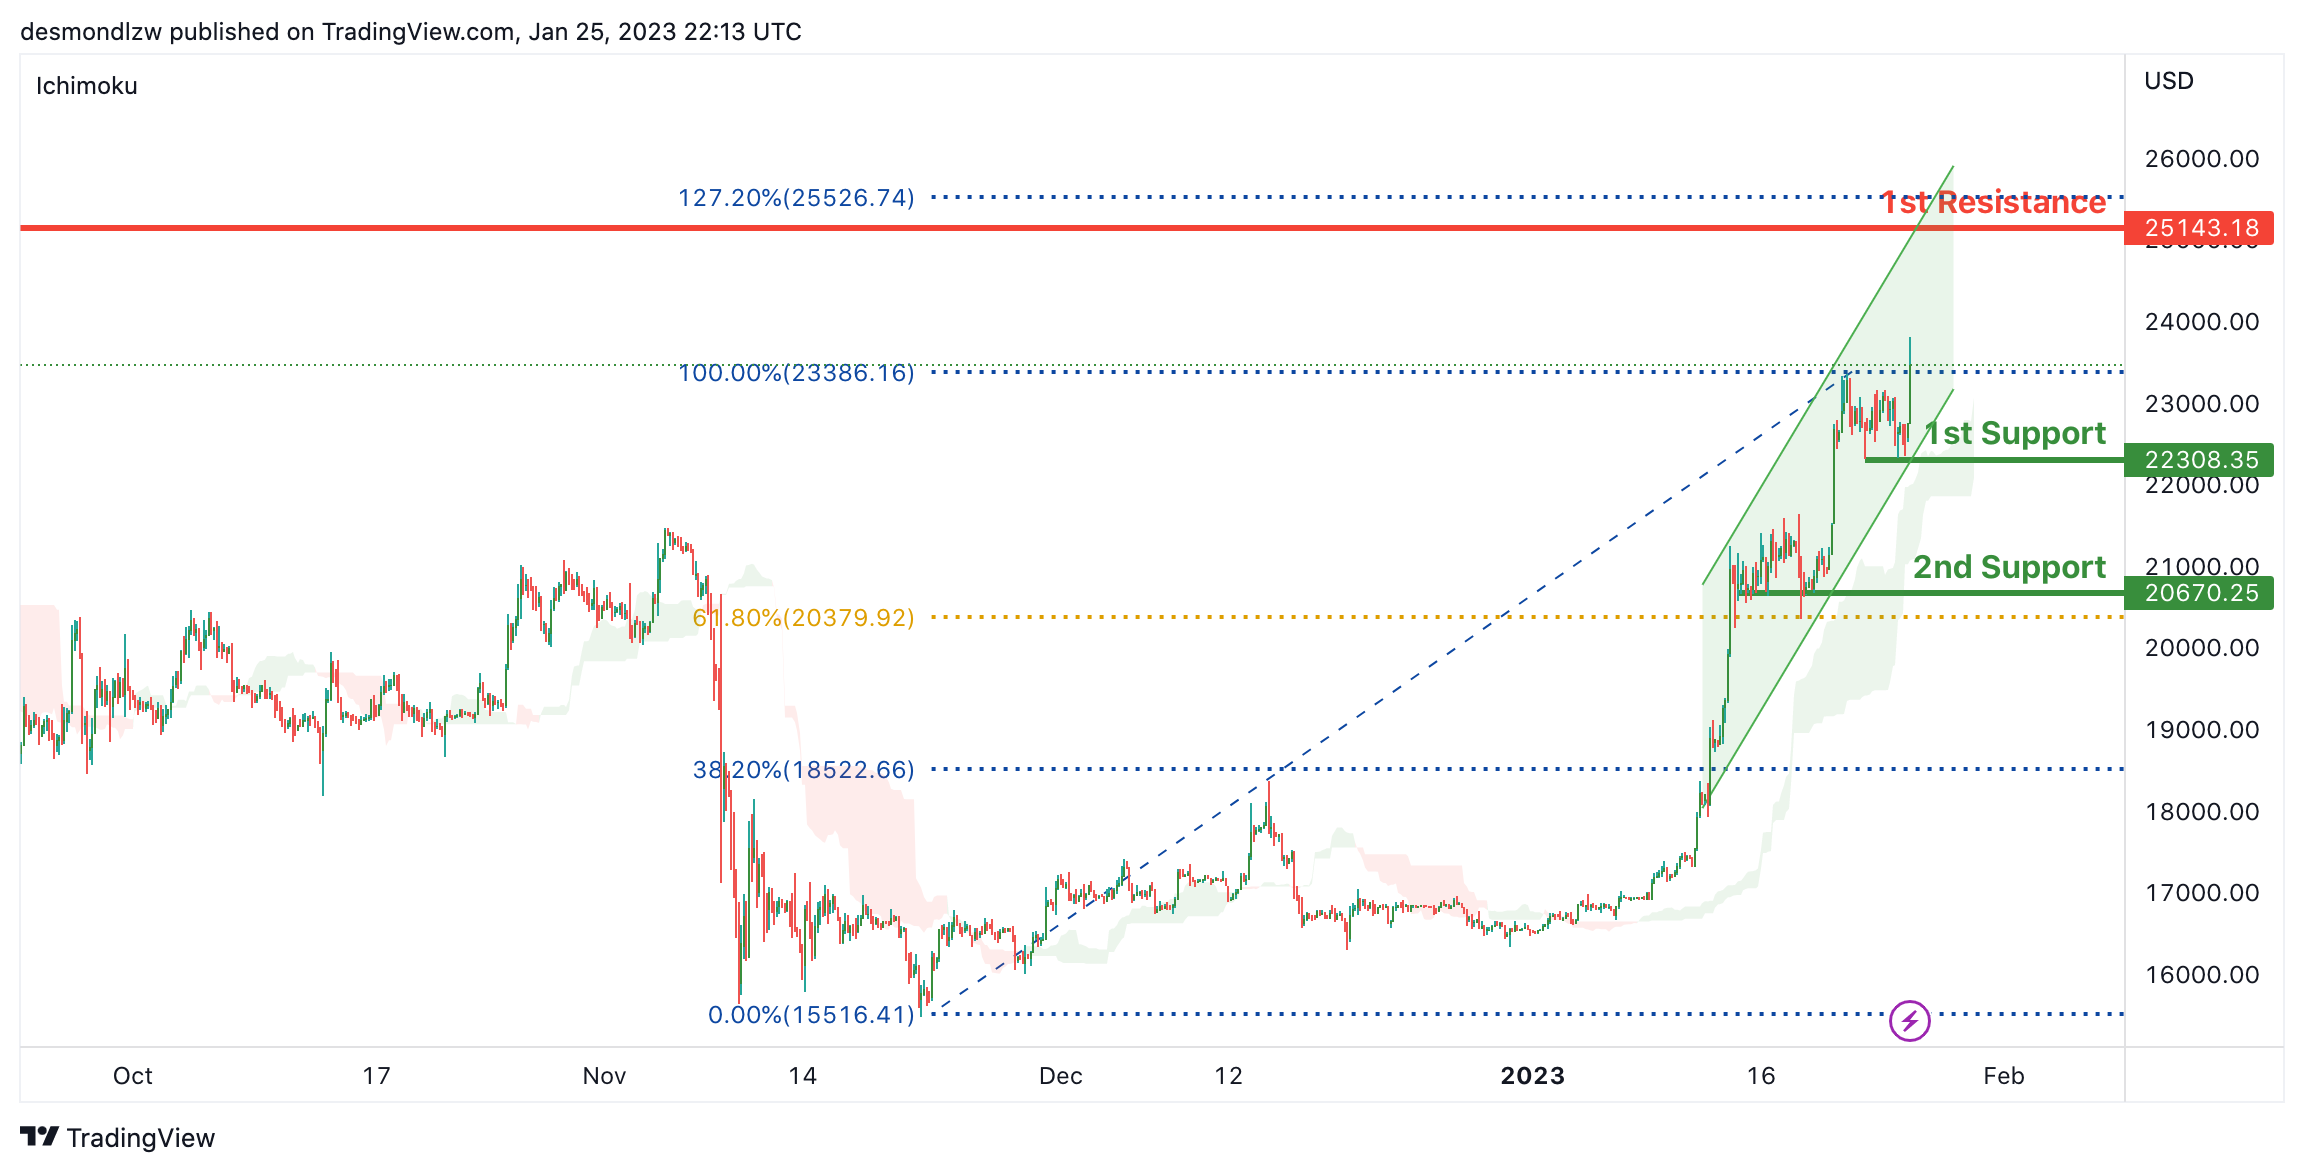
Looking at the H4 chart, my overall bias for BTCUSD is bullish due to the current price being above the Ichimoku cloud, and there is an ascending channel, indicating a bullish market. If this bullish momentum continues, expect the price to possibly rise to the 1st resistance at 25143.18 which is the recent swing high and also in line with 127% Fibonacci projection.
In an alternative scenario, the price could possibly head back down to retest at the 1st support at 22308.35. 2nd support is at 20670.25which is in line with 61.8% Fibonacci line
Areas of consideration:
- H4 time frame, 1st resistance 25143.18
- H4 time frame, 1st support at 22308.35
- H4 time frame, 1st support a 20670.25
S&P 500:
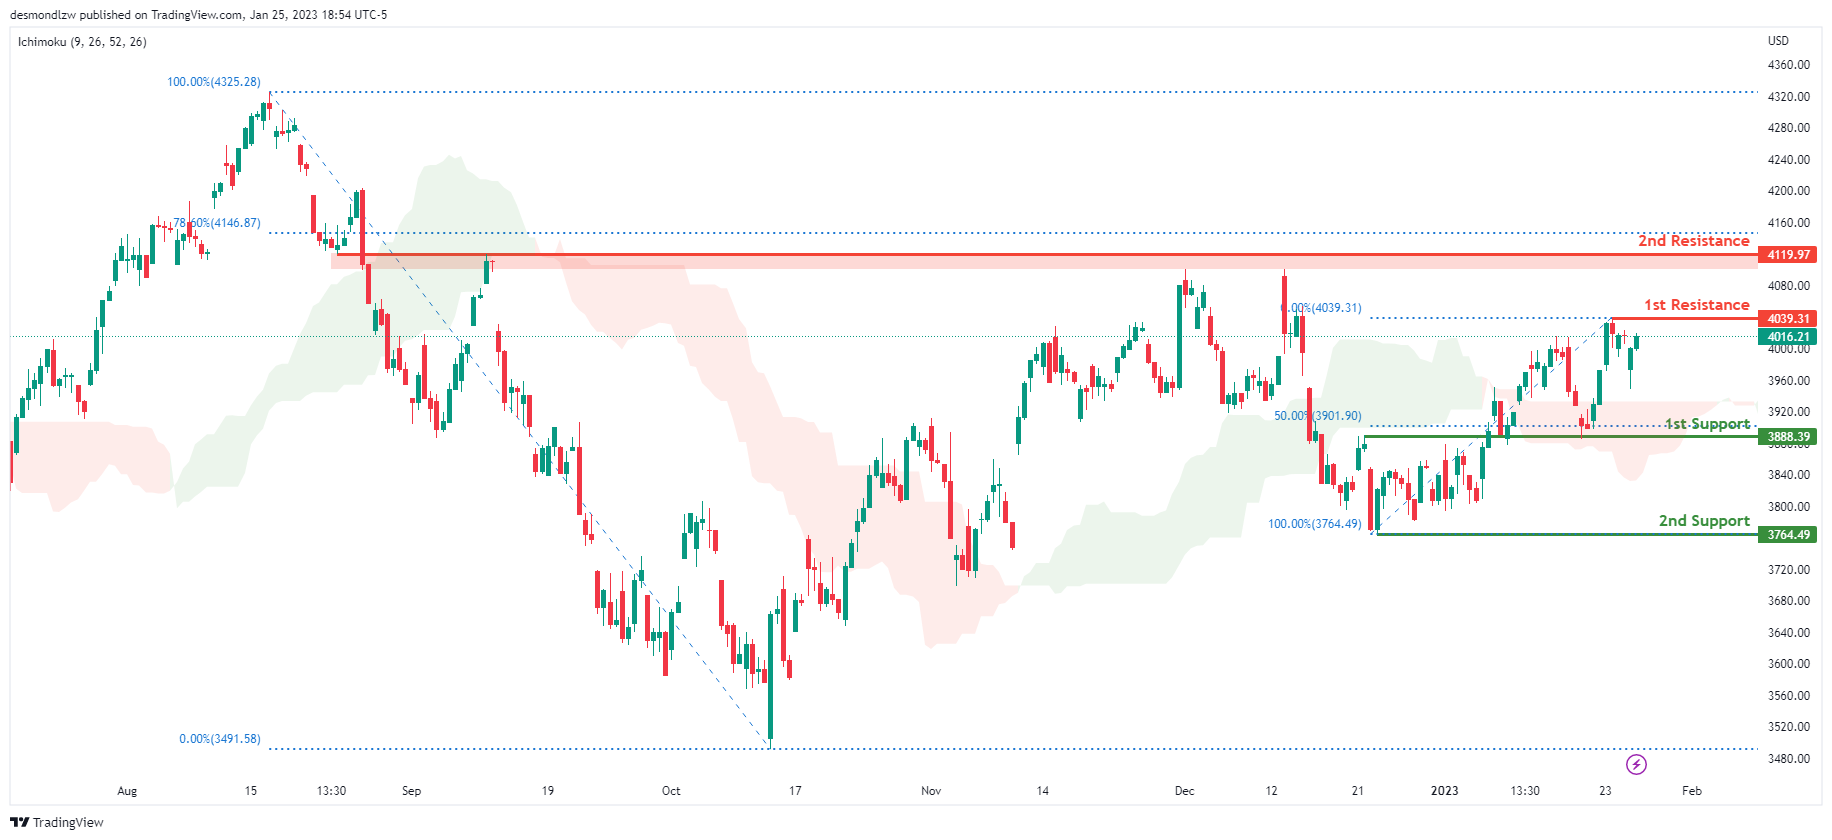
Looking at the H4 chart, my overall bias for S&P500 is bullish due to the current price being above the Ichimoku cloud, indicating a bullish market. If this bullish momentum continues, expect the price to continue heading towards the 1st resistance at 4039.31, where the recent high is. In an alternative scenario, price could possibly head back down to break the 1st support at 3888.39, where the 50% Fibonacci line is, before heading towards the 2nd support at 3764.49, where the recent swing low is.
Areas of consideration:
- H4 time frame, 1st support at 3888.39
- H4 time frame, 2nd support at 3764.49
- H4 time frame, 1st resistance at 4039.31
Can US Data Bring Back Risk Appetite
But corporate reports were providing investors with plenty of reason to pause. Microsoft was one of the larger firms to contribute to pessimism, as it reported slower growth in its enterprise software division. That implies that many companies were cutting back spending, and weren't seeing the need to expand.
The slowing economy narrative weakens the dollar, in large part due to Fed expectations. If the US does tip into a recession at the start of the year, it's speculated that the Fed won't hike as aggressively, and could even start cutting. After a series of negative corporate reports, the US will provide a series of key data points that could move the markets. The question is whether the data will contribute to the building pessimism, or will it support the case for growth? Can the dollar rebound from here?
US Durable Goods Orders
Durable goods orders is one of the key indicators for an economy's economic outlook. It measures how much major companies are investing in the long-term. If the economy is doing good, typically businesses are eager to invest to increase profits in the future. But if there is economic uncertainty, businesses will hold back on longer term investments to keep capital to weather a downturn.
US December durable goods orders are expected to increase by 2.2%, a reversal from the -2.1% reported in November. That would contradict some of the industrial data that has come out in recent days, and could provide some optimism. If the figure disappoints, however, it could add another datapoint to the narrative of a coming recession.
US Core PCE Price Index
Core PCE is the preferred inflation measure used by the Fed, and can have a bigger impact on monetary policy expectations than CPI figures. There has been increased focus on core price changes as the falling cost of energy filters through the economy.
December Core PCE Price index is expected to show a monthly increase of 0.1%, down from 0.2% prior. On an annualized basis, that would be a tick down to 4.6% from 4.7%. A beat in this measure would likely raise expectations of more tightening by the Fed in the near term. At the moment, over 90% of economists expect the Fed to hike by 25bps next week.
US Personal income and spending
The consumer is the driver of the US economy, making these indicators key for expectations for how the economy will perform. Inflation has been eating into disposable income and real wages falling for months, leading to depressed demand. It should be noted that the BLS doesn't adjust for inflation in this statistic. Monthly inflation for December was reported at -0.1%.
December Personal income is expected to have grown 0.3%, down from 0.4% in November. But when factoring in inflation, that would be a similar growth rate. Personal spending, on the other hand, is expected to decline -0.1% compared to 0.1% in November.
Goldilocks Scenario Might Sustain ST Resilience of Equities, Soft Yields and Weaker Dollar
Markets
Eco data were few yesterday and the outcome only gave limited directional guidance for global trading. German IFO business confidence (business climate rising from 88.6 to 90.2; expectations gaining from 83.2 to 86.4) confirmed the message from Tuesday’s PMI’s. A recession will probably be avoided and prospects for later this year are better than a few months ago. European bonds found a bid during the morning session, but the move had no strong legs and yields reversed most of the decline in US trading. At the end of the day, German yields closed little changed (-1.5 bps 2-y; +1.6 bps 30-y). Last ECB speakers before the blackout period reiterated the case for two additional 50 bps hikes in at least February and March. US yields eased between 3 bps (5-y) and 1.1 bp (30-y). The decline in the 2-yield was mainly due to a benchmark change. The $43bn 5-y Note auction met with very strong investor demand, reinforcing a late session bond rebound. Equities again showed resilience, with both US indices and European indices almost fully reversing intraday losses (S&P -0.02%, EuroStoxx 50 -0.12%). The dollar continues its gradual/protracted retreat. DYX closed at 101.64 (from 102). EUR/USD finished north of the 1.09 big figure (1.0916). EUR/GBP slipped back to close just above 0.88, despite UK Gilts’ outperformance. Oil traded little changed near $86/b.
Asian equities mostly keep a positive tone this morning. Yields on US Treasuries are little changed. The dollar holds near recent lows (DXY 101.60, EUR/USD 1.091, USD/JPY 129.35). Later today, US Q4 GDP is expected show growth of 2.6% Q/Qa while price deflators are expected to ease substantially (core 3.9% from 4.4%). GDP data are old news. Even so, some kind of goldilocks scenario of decent growth and easing price pressure might sustain the ST resilience of equities, soft yields and a weaker dollar. US durable goods orders and jobless claims also deserve some attention. The US 10-y yield struggles to stay above the 3.4% support area. The German 10-y yield meets first resistance near 2.2%. EUR/USD is heading for 1.0942 (50% retracement 2021/22). Major technical breaks are not evident as investors await guidance from next weeks Fed, ECB and BoE policy meetings.
News Headlines
The Bank of Canada raised the policy rate yesterday by 25 bps to 4.5%. Provided the economy and inflation evolves in line with the outlook, the BoC expects it to hold it there. Growth has been more resilient and the economy remains in excess demand. GDP is expected to expand about 1% this year and 2% in the next, little changed from the October forecast. However, restrictive monetary policy is filtering through, especially in household spending and the housing market. The overall activity slowdown will allow supply to catch up with demand. Inflation declined to 6.3% in December on lower gasoline prices and moderating prices for durable goods. 3-month measures of core inflation have come down, suggesting that it has peaked. CPI is projected to come down to around 3% in the middle of this year and back to the 2% target in 2024. The BoC’s pause announcement came as no major surprise. Markets were pricing in a 4.5% terminal rate for some time now. It nevertheless triggered Canadian yield losses between 4.9-7.7 bps with the front outperforming. Canadian money markets expects 50 bps rate cuts by the end of this year. The loonie lost ground in a kneejerk reaction before paring losses to USD/CAD 1.3392 (from 1.3369).
Growth in South Korea contracted in Q4 of 2022 by 0.4% q/q. That brought the yearly figure to 1.4%, down from 3.1% in Q3. The first decline in two and a half years was mainly due to a crash in exports (-5.8% q/q), more than offsetting a 4.8% import decline. Household consumption, a key driver for growth for most of last year, also dropped (-0.4%). Government spending offered some counterweight (+3.2%). SK’s finance minister Choo Kyung-ho already pledged strong support for exporters such as tax breaks and administrative help. This may complicate the central bank’s task. Although the BoK itself kept all options open, its rate hike earlier this month to 3.5% was seen as the final one this cycle. The South Korean won reacted stoic to the data. USD/KRW is trading near recent lows of 1231.
US Oil Consolidates Gains
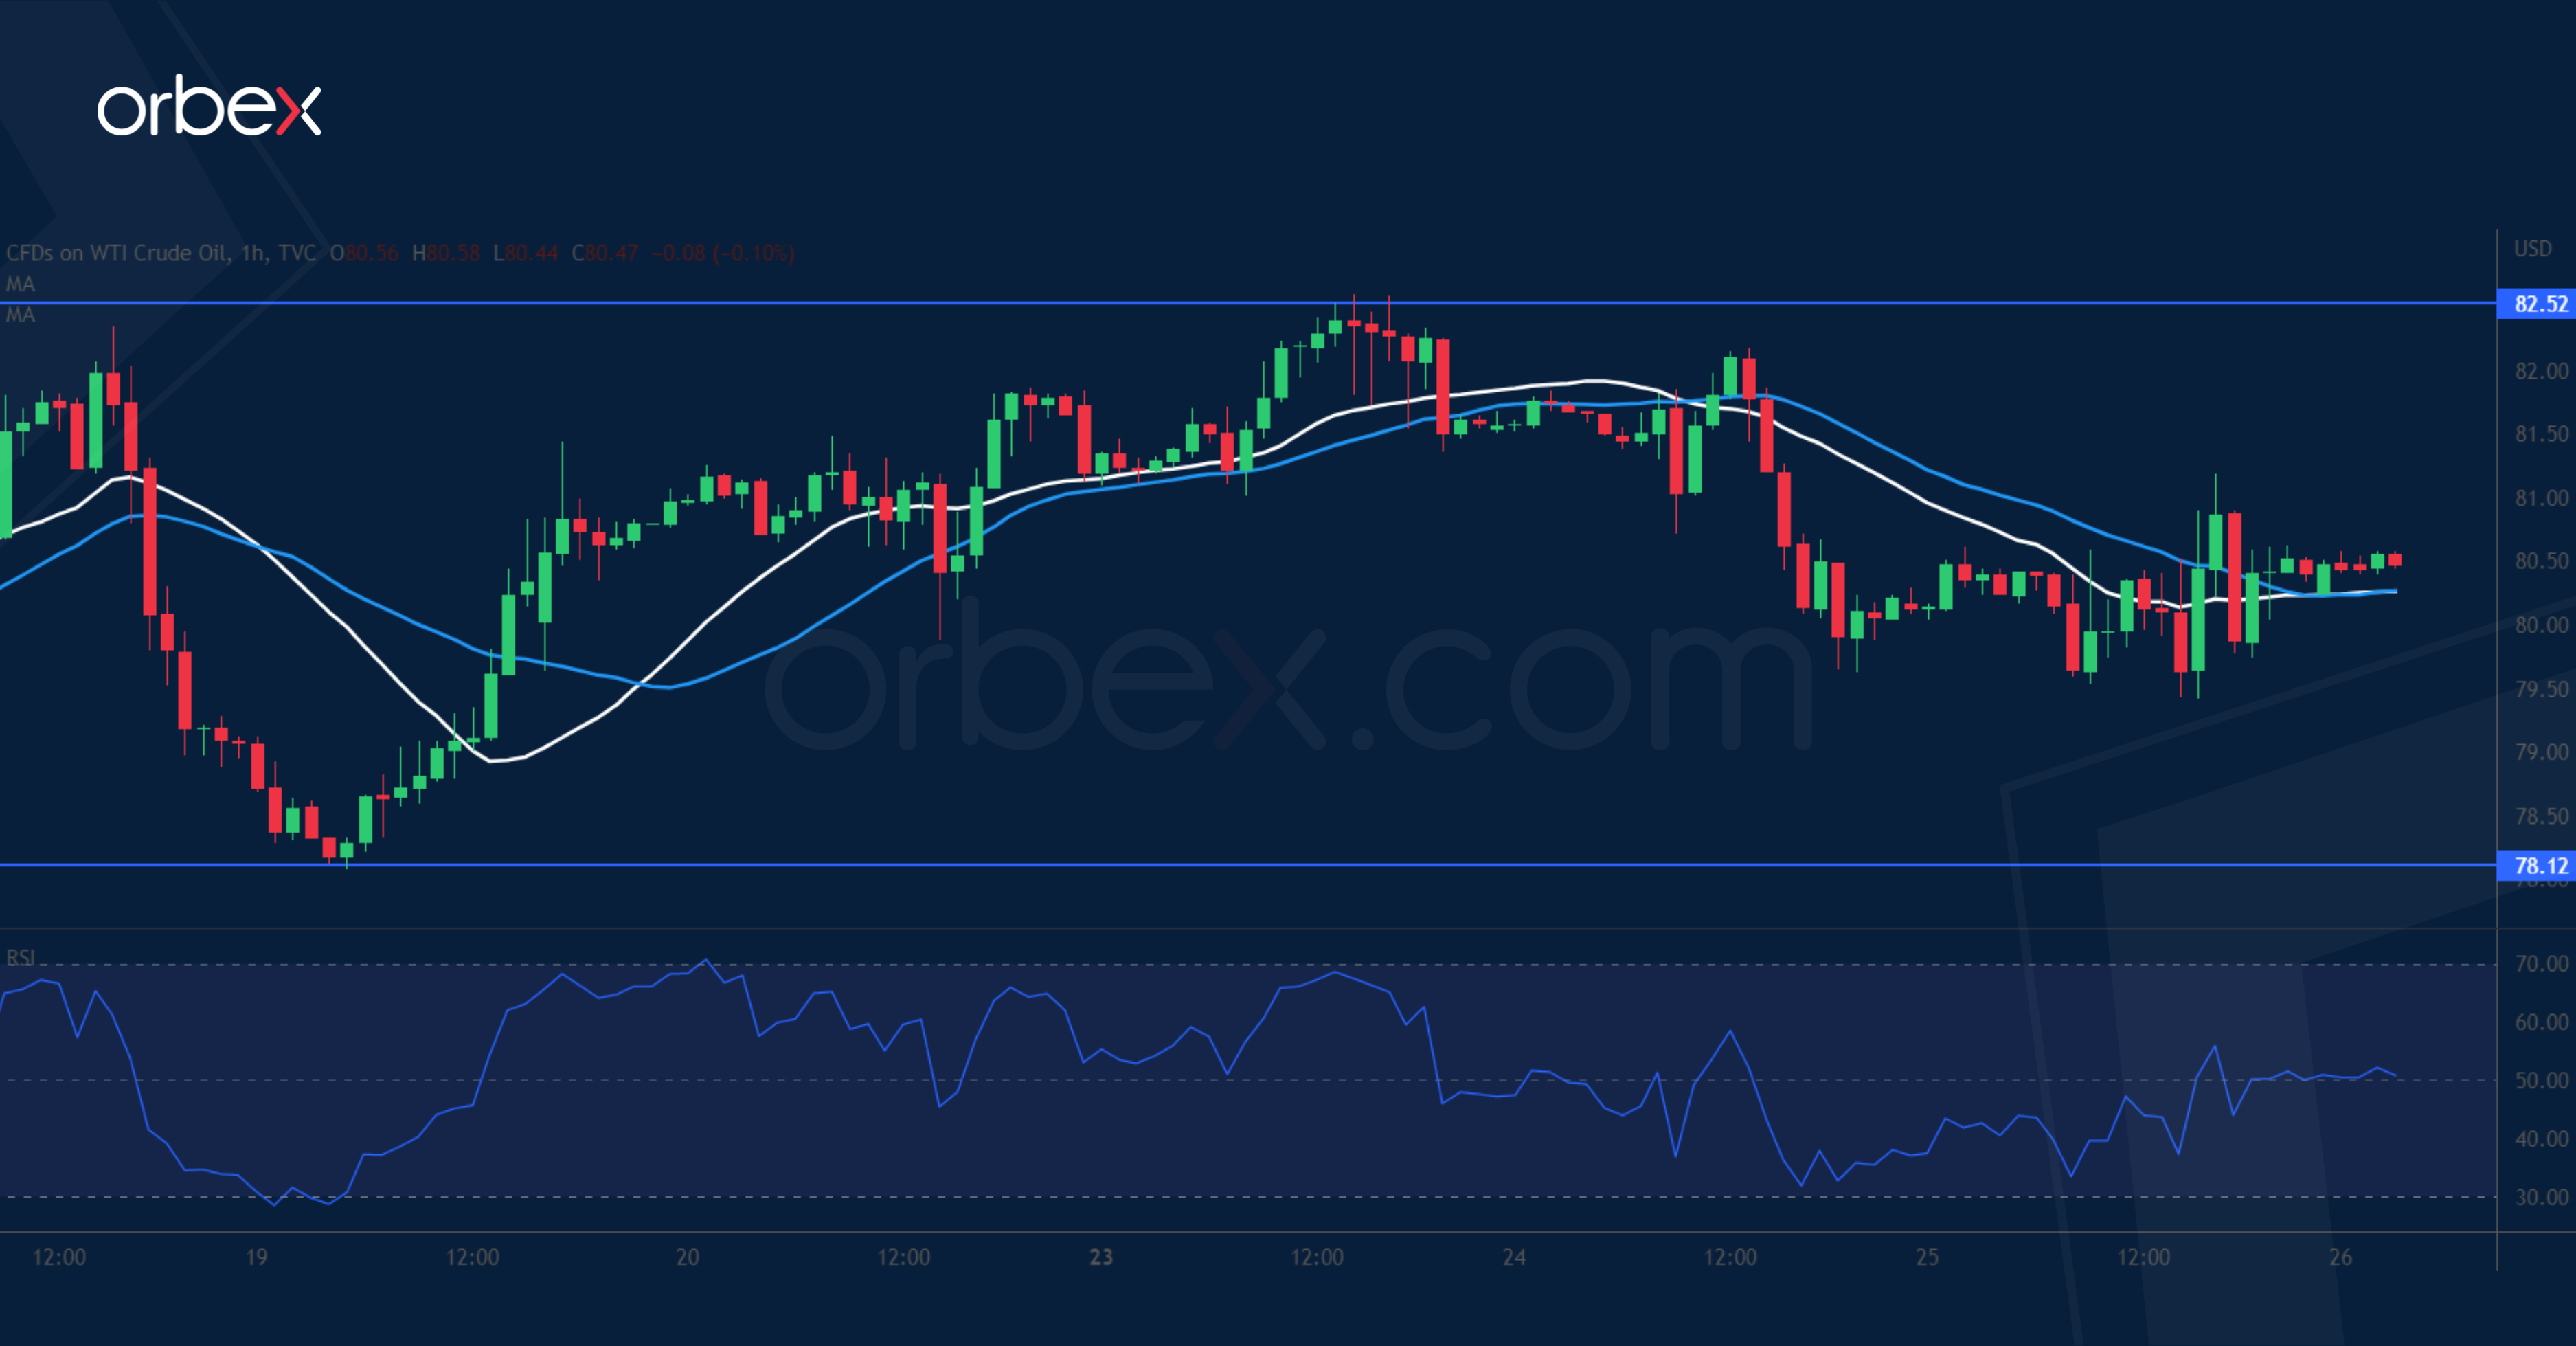
WTI crude treads water as US crude inventories show a smaller buildup. The price action is grinding last December’s high of 82.50 as its breach might trigger an extended rally in the medium-term. Instead, a drop below the immediate support at 80.30 has put the bulls on the defensive. The previous swing low at 82.50 sits on the 20-day moving average and is a key level to keep the price afloat. A bearish breakout would shake out recent buyers and send the price to the psychological level of 75.00.
EUR/AUD Sinks Further
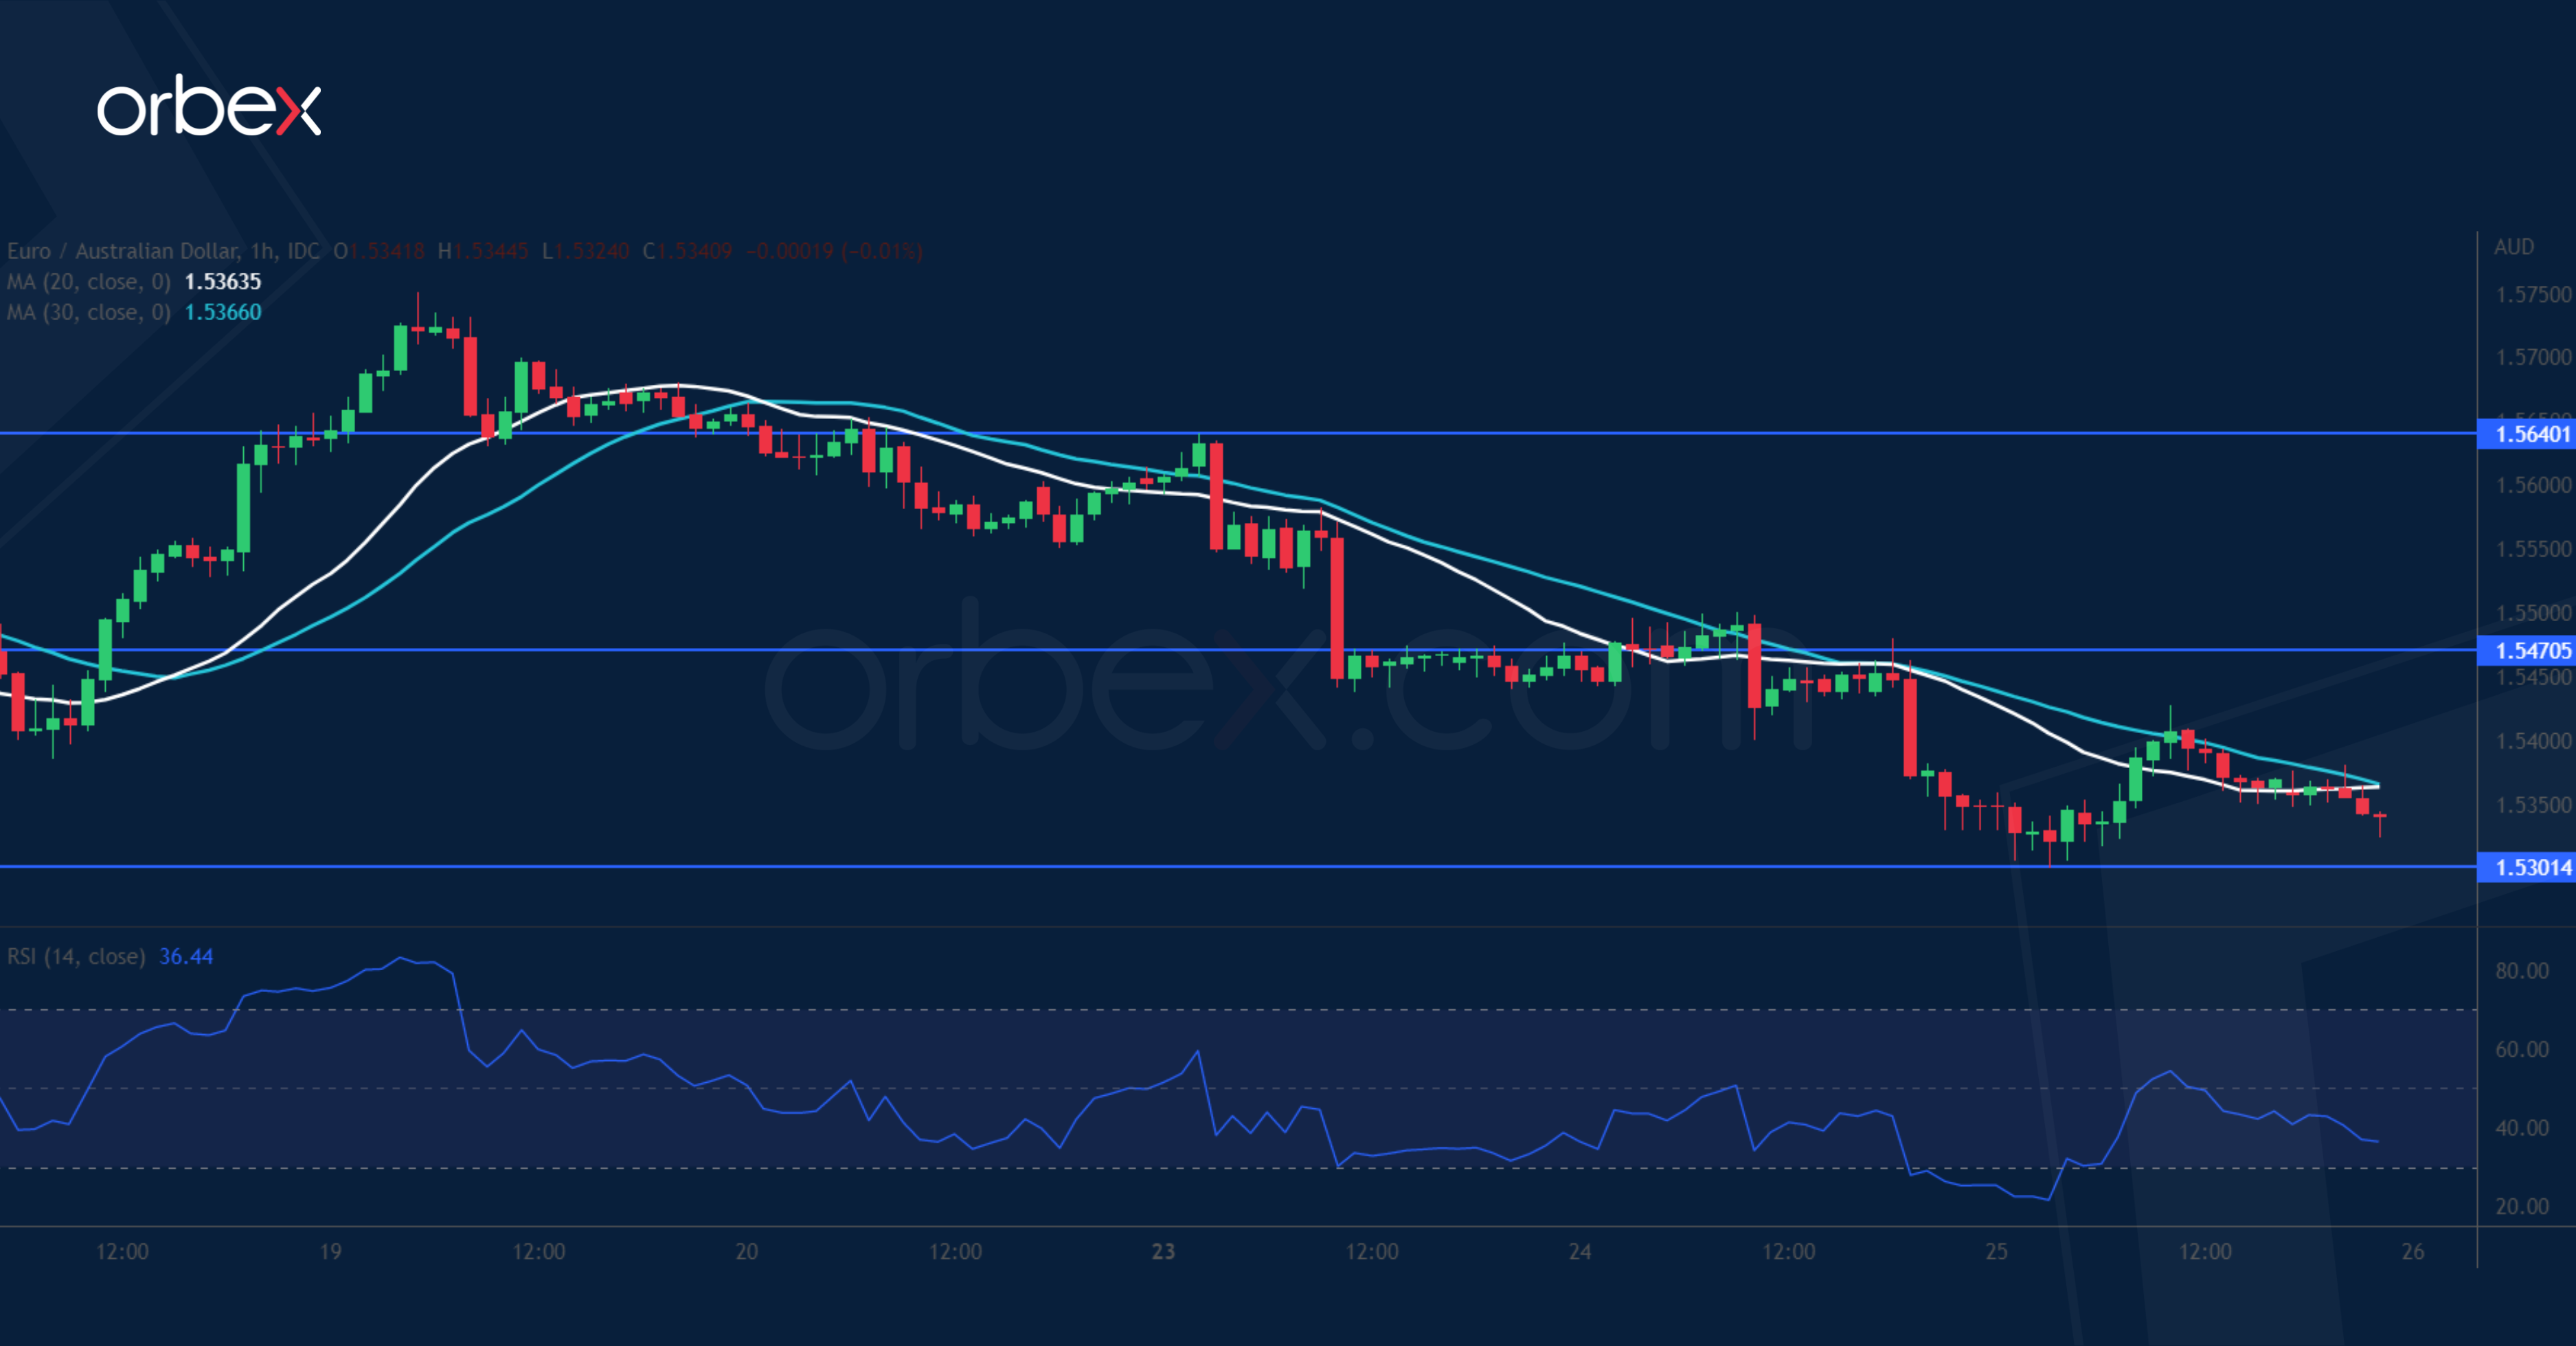
The Australian dollar climbed after Q4 inflation came in hotter-than-expected. On the daily chart, the euro turned south at the support-turned-resistance (1.5950) from a sell-off earlier last year. This suggests that the medium-term bias is still skewed to the downside. Zooming into the hourly chart, a break below 1.5400 has invalidated the latest bounce and confirmed the pessimism on the higher timeframe. The RSI’s oversold situation has gathered limited support over 1.5300, but stiff selling could be expected around 1.5470.
USD/CAD Attempts to Rebound
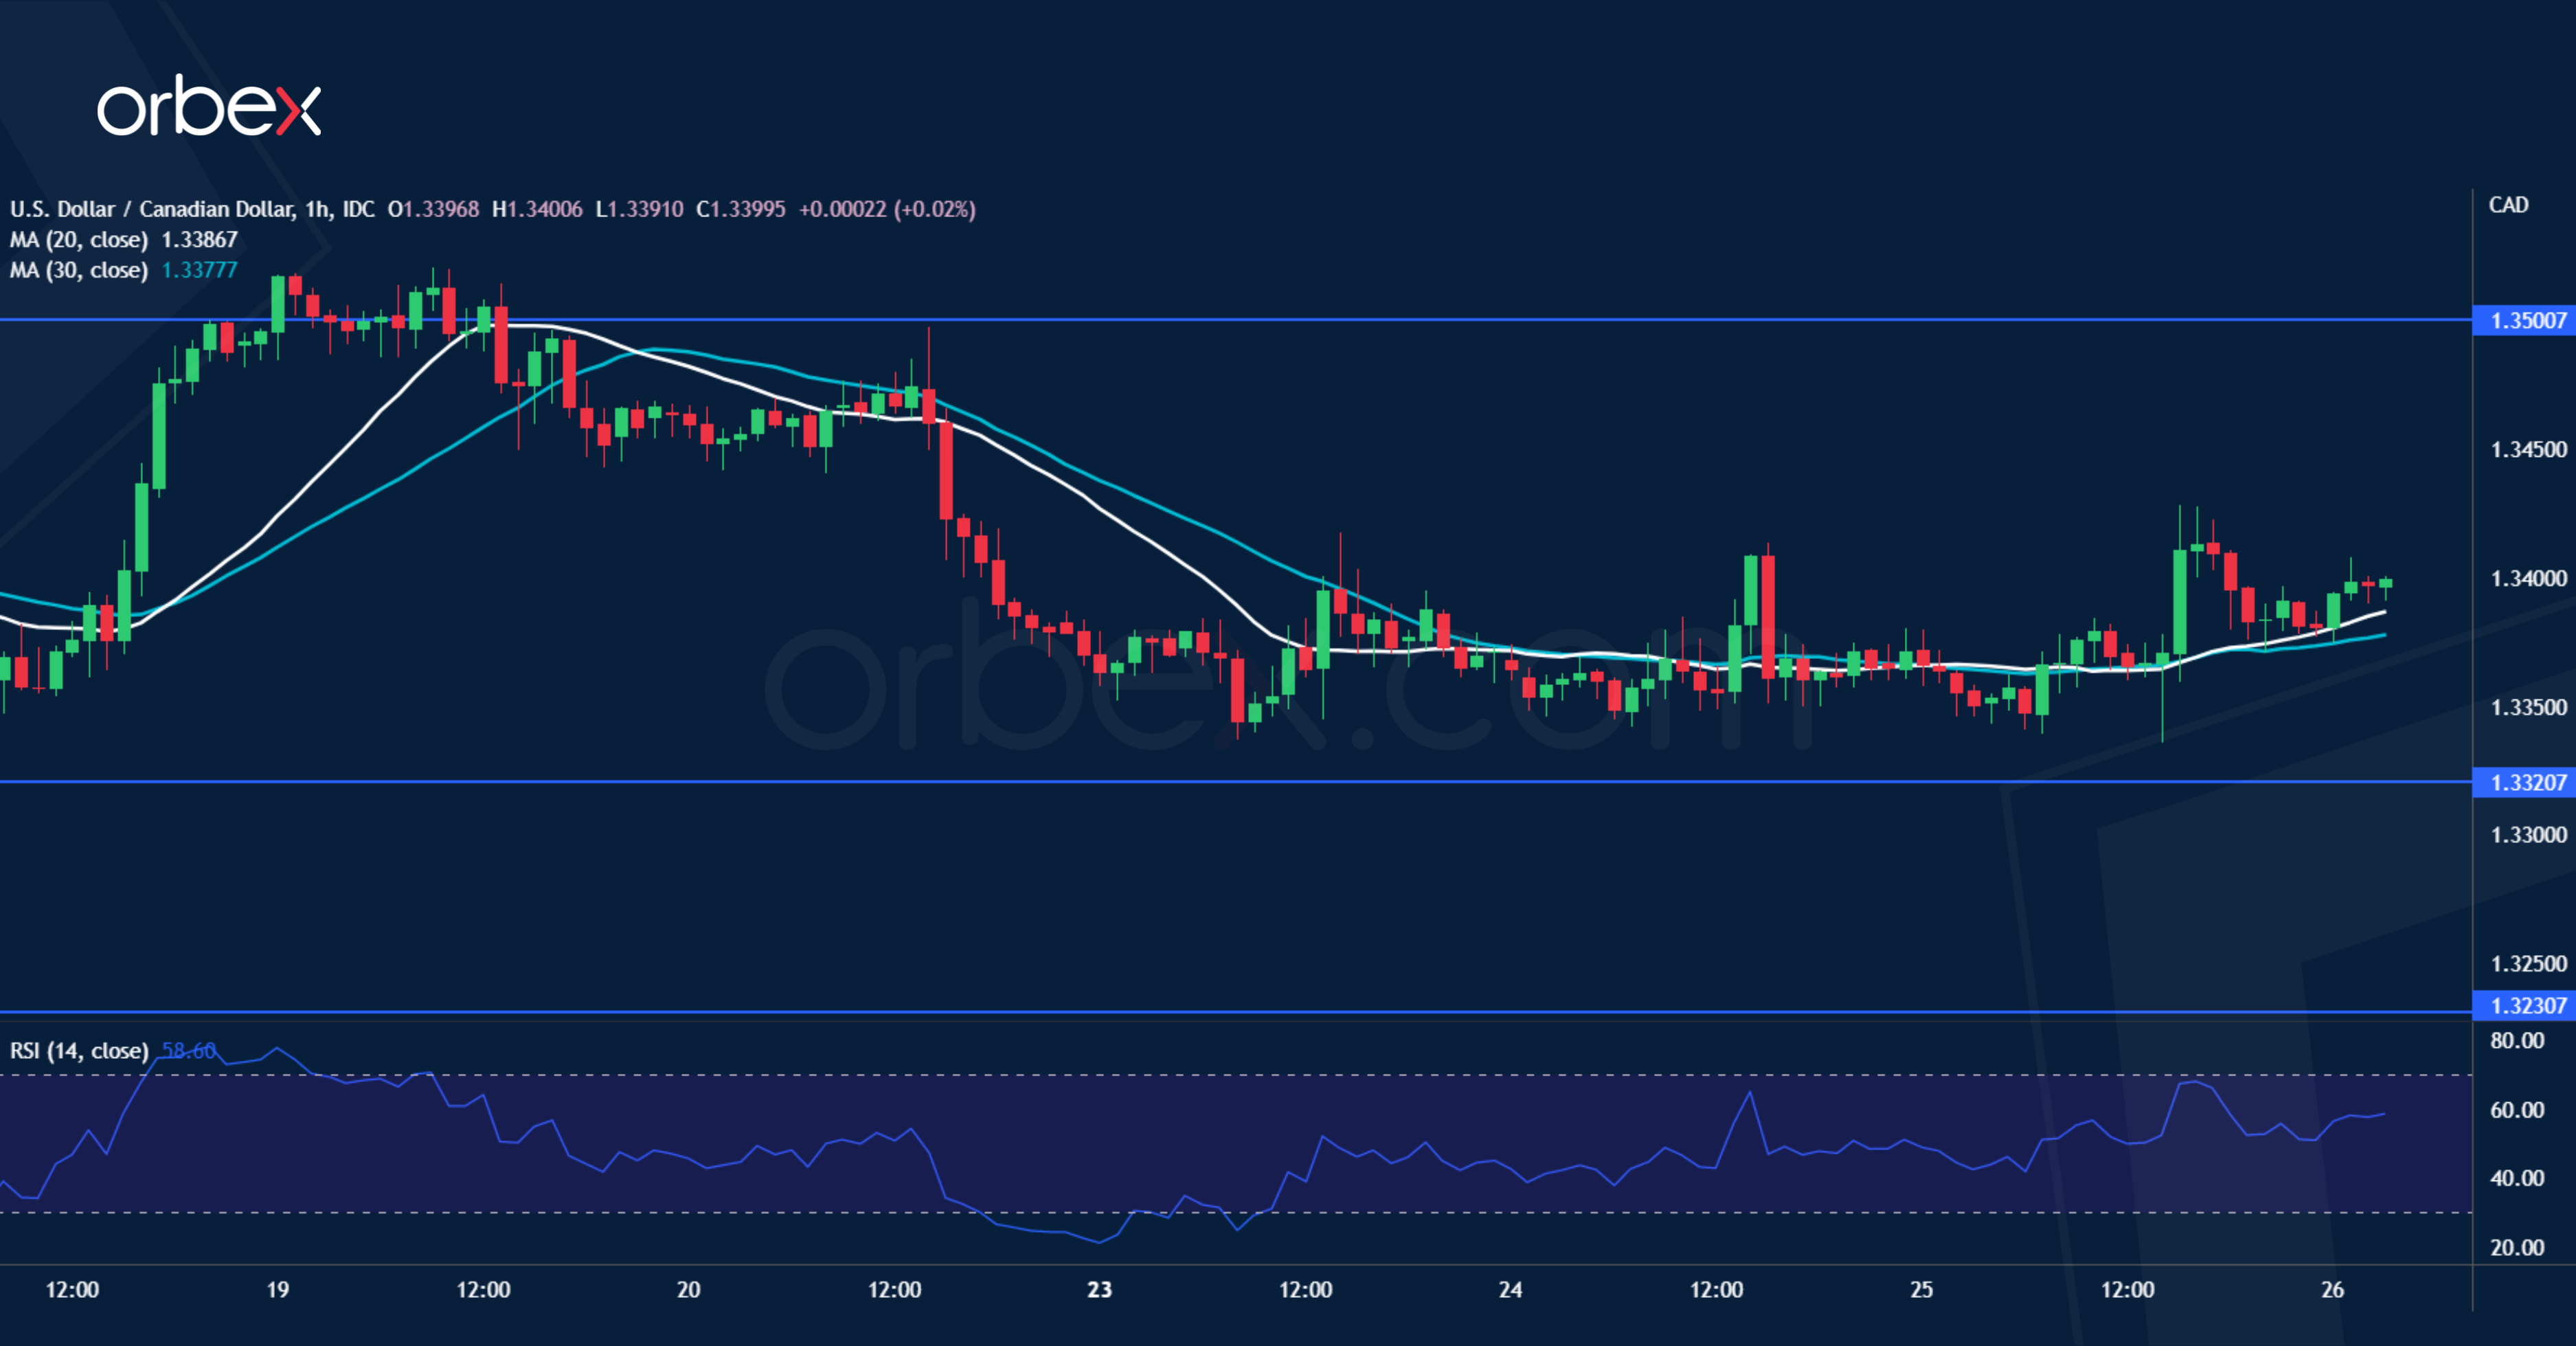
The Canadian dollar slipped after the BoC signalled a pause in rate increases. On the daily chart, the pair is looking to hold above 1.3320 as a triangle consolidation pattern seems to be taking shape between 1.3230 and 1.3700. After hitting resistance at the former support at 1.3520 the short-term price action reversed and tested 1.3320 again. Its breach would send the greenback to the critical floor at 1.3230. On the upside, 1.3500 is the first hurdle and 1.3660 may cap any further advance in the short-term.