Sample Category Title
USD/JPY Daily Outlook
Daily Pivots: (S1) 135.83; (P) 136.37; (R1) 137.13; More...
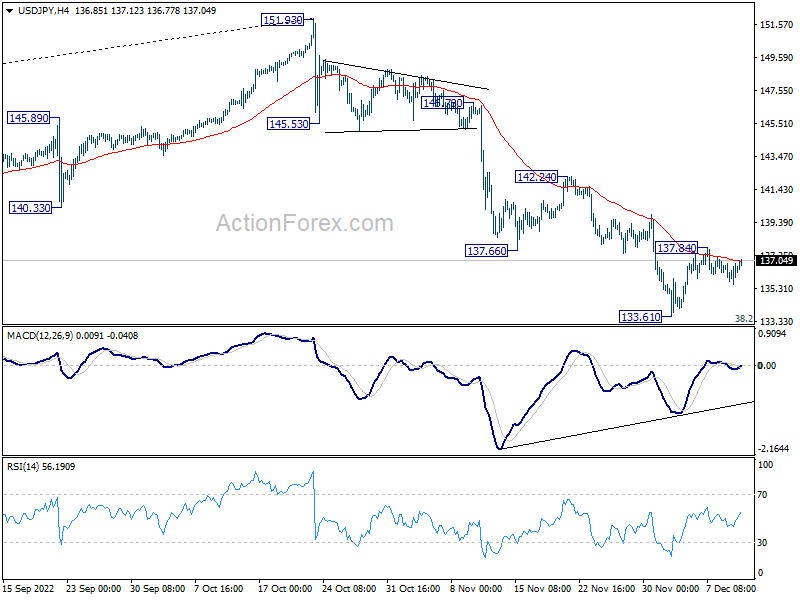
Intraday bias in USD/JPY stays neutral for the moment. On the upside, break of 137.84 resistance will revive the case of short term bottoming at 133.61, and turn bias back to the upside for 55 day EMA (now at 140.89). However, break of 133.61 will resume the decline form 151.93 through 133.07 fibonacci level.
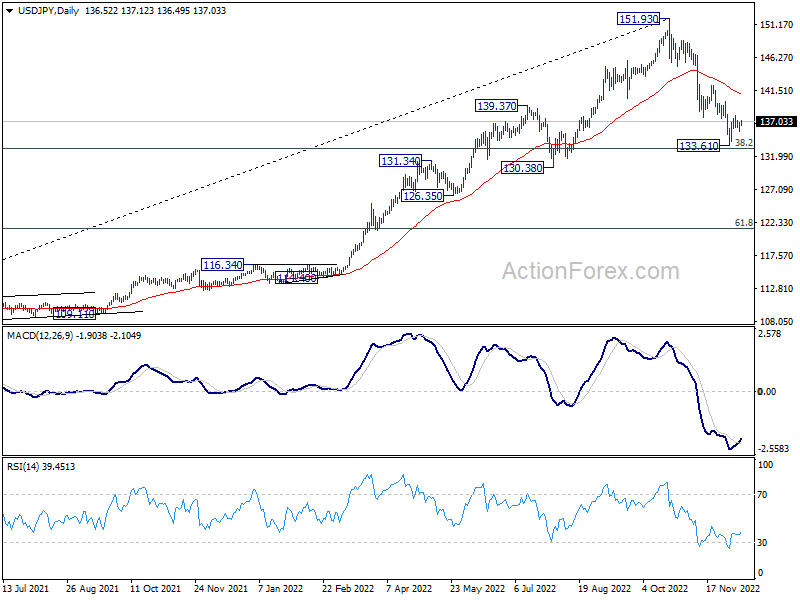
In the bigger picture, price actions from 151.93 medium term could be just a corrective pattern to up trend from 102.58 (2021 low). Strong support from 38.2% retracement of 102.58 to 151.93 at 133.07 and 55 week EMA (now at 131.71) will set the range for such corrective pattern. However, sustained break of 55 week EMA will pave the way to 61.8% retracement at 121.43.
AUD/USD Daily Report
Daily Pivots: (S1) 0.6757; (P) 0.6786; (R1) 0.6824; More...
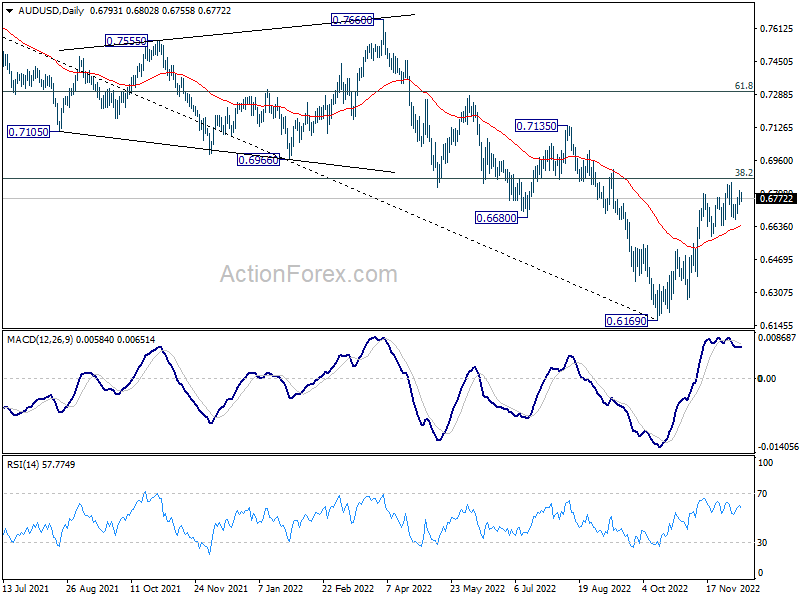
Intraday bias in AUD/USD remains neutral as consolidation from 0.6850 is extending. On the downside, break of 0.6641 should confirm rejection by 0.6871 resistance. Intraday bias will be back on the downside for 0.6521 resistance turned support. However, sustained break of 0.6871 will extend the rise from 0.6169 to 55 week EMA at 0.6912.
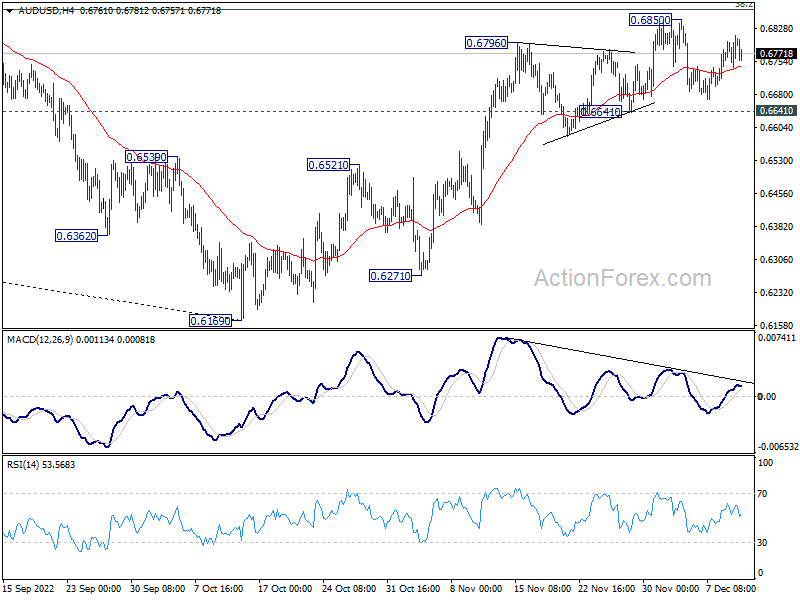
In the bigger picture, it's still unsure if price actions from 0.6169 medium term bottom are developing into a corrective pattern or trend rejection. Rejection by 38.2% retracement of 0.8006 to 0.6169 at 0.6871 will maintain medium term bearishness for another fall through 0.6169 at a later stage. However, firm break of 0.6871, and sustained trading above 55 week EMA (now at 0.6912) will raise the chance of the start of a bullish up trend.
USD/CAD Daily Outlook
Daily Pivots: (S1) 1.3579; (P) 1.3635; (R1) 1.3701; More....
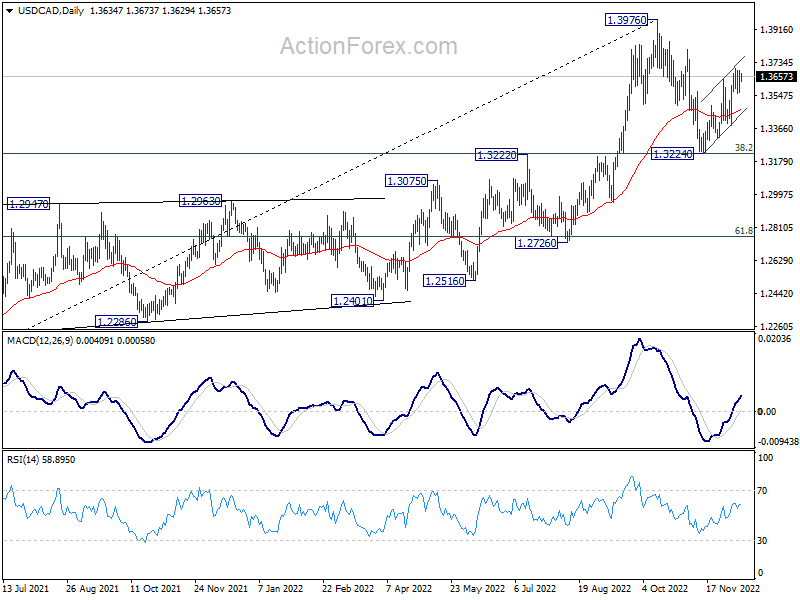
Intraday bias in USD/CAD remains neutral as consolidation from 1.3699 is still in progress. The favored case is still that correction from 1.3976 has completed at 1.3224. Above 1.3699 will resume the rebound from there to 1.3807 resistance, and then retesting 1.3976 high. However, break of 1.3383 support will dampen this case and bring retest of 1.3224 low instead.
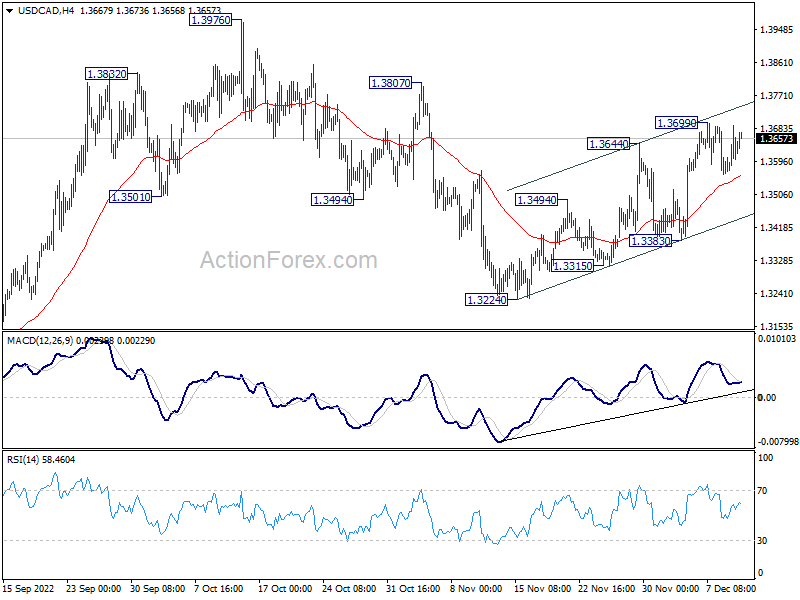
In the bigger picture, as long as 1.3222 cluster support (38.2% retracement of 1.2005 to 1.3976 at 1.3223) holds, larger up trend from 1.2005 (2021 low) is still expected to resume through 1.3976 high at a later stage. However, firm break of 1.3222/3 will indicate that the trend might have reversed. Deeper fall would be seen to next cluster support at 1.2726 (61.8% retracement at 1.2758).
Dollar Rises Slightly as Markets Turn Cautious; Fed, ECB, BoE and SNB to Hike
Dollar rises mildly in Asian session as investors turned cautious. Euro is also firmer but Sterling is on the softer side together with Aussie and Kiwi. Market focus are on the four central bank meetings this week, and lots of important indicators. Among them, Fed's new economic projections and dot plot would likely be most market moving.
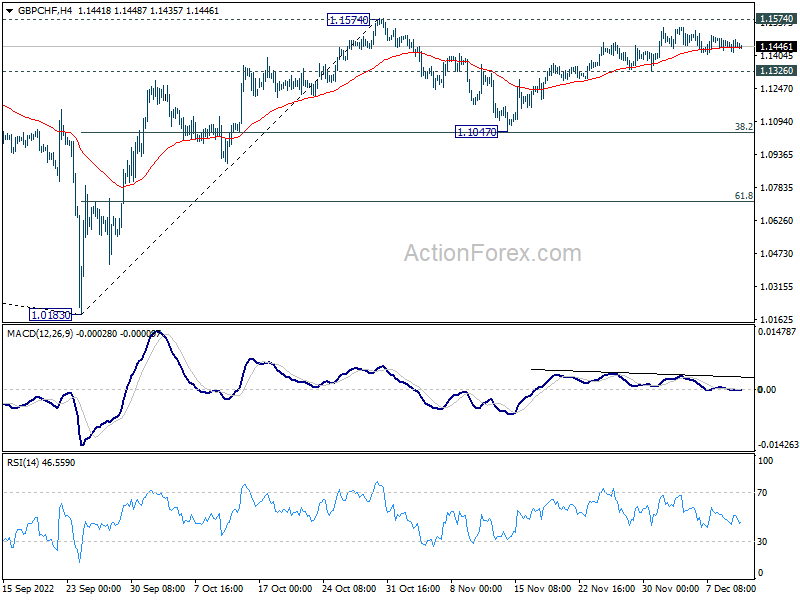
GBP/CHF could be a mover this week with BoE and SNB featured. Technically, rebound from 1.1047 is seen as the second leg of the consolidation pattern from 1.1574. Upside momentum has been diminishing just ahead of this resistance, as seen in 4 hour MACD. For now, break of 1.1574 is not anticipated in case of another rise. Instead, break of 1.1326 support should indicate the start of the third leg, and target 1.1047 again. But downside should be contained there to complete the pattern.
In Asia, at the time of writing, Nikkei is down -0.27%. Hong Kong HSI is down -1.88%. China Shanghai SSE is down -0.63%. Singapore Strait Times is up 0.04%. Japan 10-year JGB yield is up 0.0022 at 0.258.
Japan PPI slowed to 9.3% yoy in Nov, global commodity prices easing
Japan corporate goods price index slowed from 9.4% yoy to 9.3% yoy in November, above expectation of 8.9% yoy. The index, at 118.5, was a record high. Yen-based import price index slowed notably from 42.3% yoy to 28.2% yoy.
"Companies were passing on rising raw material costs for a broad range of goods. But some goods saw the impact of recent easing of global commodity prices," a BOJ official told a briefing.
Also from Japan, MoF's Business Survey Index for all large industries rose from 0.4 to 0.7 in Q4. BSI large manufacturing, however, dropped from 1.7 to -3.6. BSI large non-manufacturing improved form -0.2 to 2.7. BSI medium all industries rose from -2.2 to 4.7. BSI small all industries rose from -15.9 to -6.0.
Fed, ECB, BoE and SNB to hike 50bps
Four central banks are expected to raise interest rate this week. Fed is widely expected to slow down the pace of tightening, and hike interest rate by 50bps to 4.25-4.50%. Tightening is certainly not finished and the FOMC statement will make it clear. The main focus is on the new economic projections where three questions would be answered: The terminal rate, the time to get there, and the time to stay there. Currently, markets are expecting the federal funds are to peak at 5.00-5.52% in Q2 next year.
ECB is also expected to slow down and deliver a 50bps rate hike to 2.50%. There are expectations that ECB's main refinancing rate will peak at 3.00% in Q1. But the central bank reiterate its meeting-by-meeting approach, and reveal little about the path forward, except the direction. Another focus is any announcement regarding quantitative tightening.
BoE is also expected to slow the pace of tightening and hike by 50bps to 3.50%. Opinions on the terminal rate for BoE vary, and it could very much depend on the depth of the recession. Meanwhile, some attention will be on the voting. Last month, only seven MPC members voted for the 75bps hike. Swati Dhingra voted for 50bps, while Silvana Tenreyro voted for 25bps.
SNB is also expected to raise the policy rate by 50bps to 1.00%. With inflation much tamer than other major regions, SNB's terminal rate will certainly be much lower. A focus in on whether the central bank would indicate how close it is to the end of the cycle. Also, some attention would be on its rhetorics on exchange rates.
The week will also feature a large number of important economic data, before people head off to holidays. Here are some highlights for the week:
- Monday: Japan BSI manufacturing index, PPI, machine tools orders; UK GDP, production, trade balance, NIESR GDP estimate.
- Tuesday: Australia Westpac consumer sentiment, NAB business confidence; UK employment; Swiss SECO economic forecasts; Germany CPI final, ZEW economic sentiment; US NFIB small business index, CPI.
- Wednesday: New Zealand current account; Japan machine orders, Tankan survey; UK CPI, RPI; Swiss PPI; Eurozone industrial production; Canada manufacturing sales; US FOMC rate decision, import prices.
- Thursday: New Zealand GDP; Japan trade balance, tertiary industry index; Australia employment; China industrial production, retail sales, fixed asset investment; SNB rate decision; BoE rate decision; ECB rate decision; Canada housing starts; US retail sales, Philly Fed survey, jobless claims, industrial production, business inventories.
- Friday: New Zealand BusinessNZ manufacturing index; Australia PMIs; Japan PMI manufacturing; UK retail sales, PMIs; Eurozone PMIs, CPI final, trade balance; Canada wholesale sales; US PMIs.
USD/CAD Daily Outlook
Daily Pivots: (S1) 1.3579; (P) 1.3635; (R1) 1.3701; More....
Intraday bias in USD/CAD remains neutral as consolidation from 1.3699 is still in progress. The favored case is still that correction from 1.3976 has completed at 1.3224. Above 1.3699 will resume the rebound from there to 1.3807 resistance, and then retesting 1.3976 high. However, break of 1.3383 support will dampen this case and bring retest of 1.3224 low instead.
In the bigger picture, as long as 1.3222 cluster support (38.2% retracement of 1.2005 to 1.3976 at 1.3223) holds, larger up trend from 1.2005 (2021 low) is still expected to resume through 1.3976 high at a later stage. However, firm break of 1.3222/3 will indicate that the trend might have reversed. Deeper fall would be seen to next cluster support at 1.2726 (61.8% retracement at 1.2758).
Economic Indicators Update
| GMT | Ccy | Events | Actual | Forecast | Previous | Revised |
|---|---|---|---|---|---|---|
| 23:50 | JPY | PPI Y/Y Nov | 9.30% | 8.90% | 9.10% | 9.40% |
| 23:50 | JPY | BSI Manufacturing Index Q4 | -3.6 | 2.3 | 1.7 | |
| 06:00 | JPY | Machine Tool Orders Y/Y Nov P | -5.40% | |||
| 07:00 | GBP | GDP M/M Oct | 0.40% | -0.60% | ||
| 07:00 | GBP | Index of Services 3M/3M Oct | -0.10% | 0.00% | ||
| 07:00 | GBP | Industrial Production M/M Oct | -0.30% | 0.20% | ||
| 07:00 | GBP | Industrial Production Y/Y Oct | -4.20% | -3.10% | ||
| 07:00 | GBP | Manufacturing Production M/M Oct | -0.10% | 0.00% | ||
| 07:00 | GBP | Manufacturing Production Y/Y Oct | -6.30% | -5.80% | ||
| 07:00 | GBP | Goods Trade Balance (GBP) Oct | -15.0B | -15.7B | ||
| 13:00 | GBP | NIESR GDP Estimate (3M) Nov | -0.30% |
Technical Outlook and Review
USD/JPY:
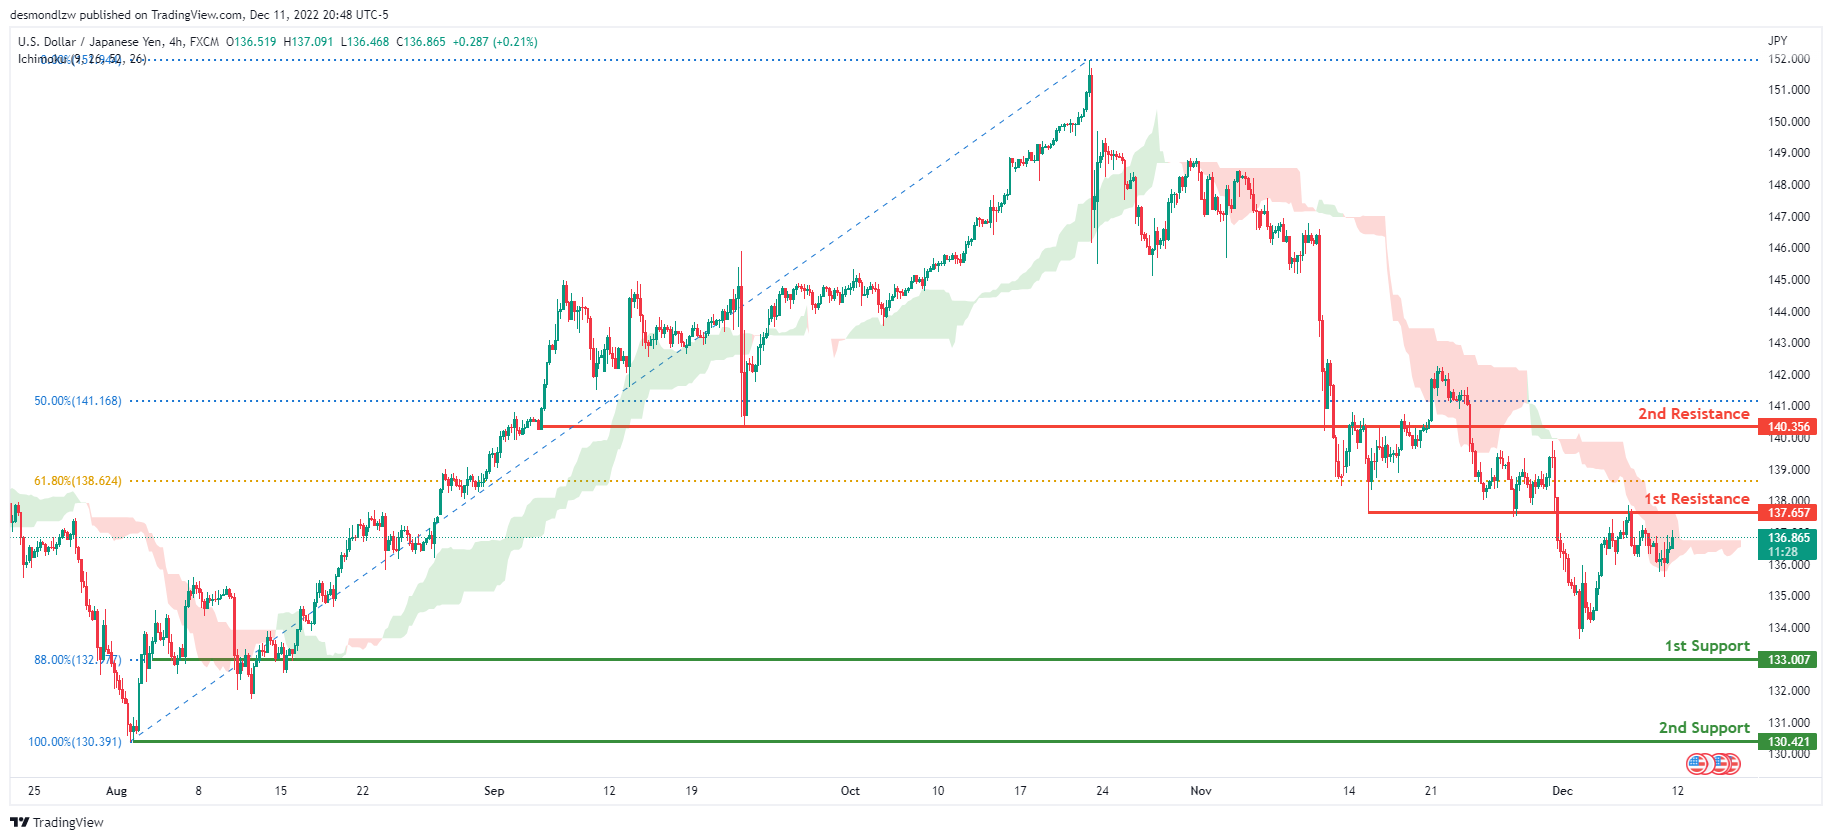
The current general bias for USDJPY on the H4 chart is bearish. To add confluence to this, the price is under the Ichimoku cloud which indicates a bearish market. If the bearish momentum continues, expect USDJPY to continue heading towards the 1st support at 133.007 where the 88% Fibonacci line is. In an alternative scenario, price could head back up to retest the 1st resistance line at 137.657, where the 61.8% Fibonacci line and previous low are located.
Areas of consideration:
- H4 time frame, 1st resistance at 137.657
- H4 time frame, 1st support at 133.007
DXY:
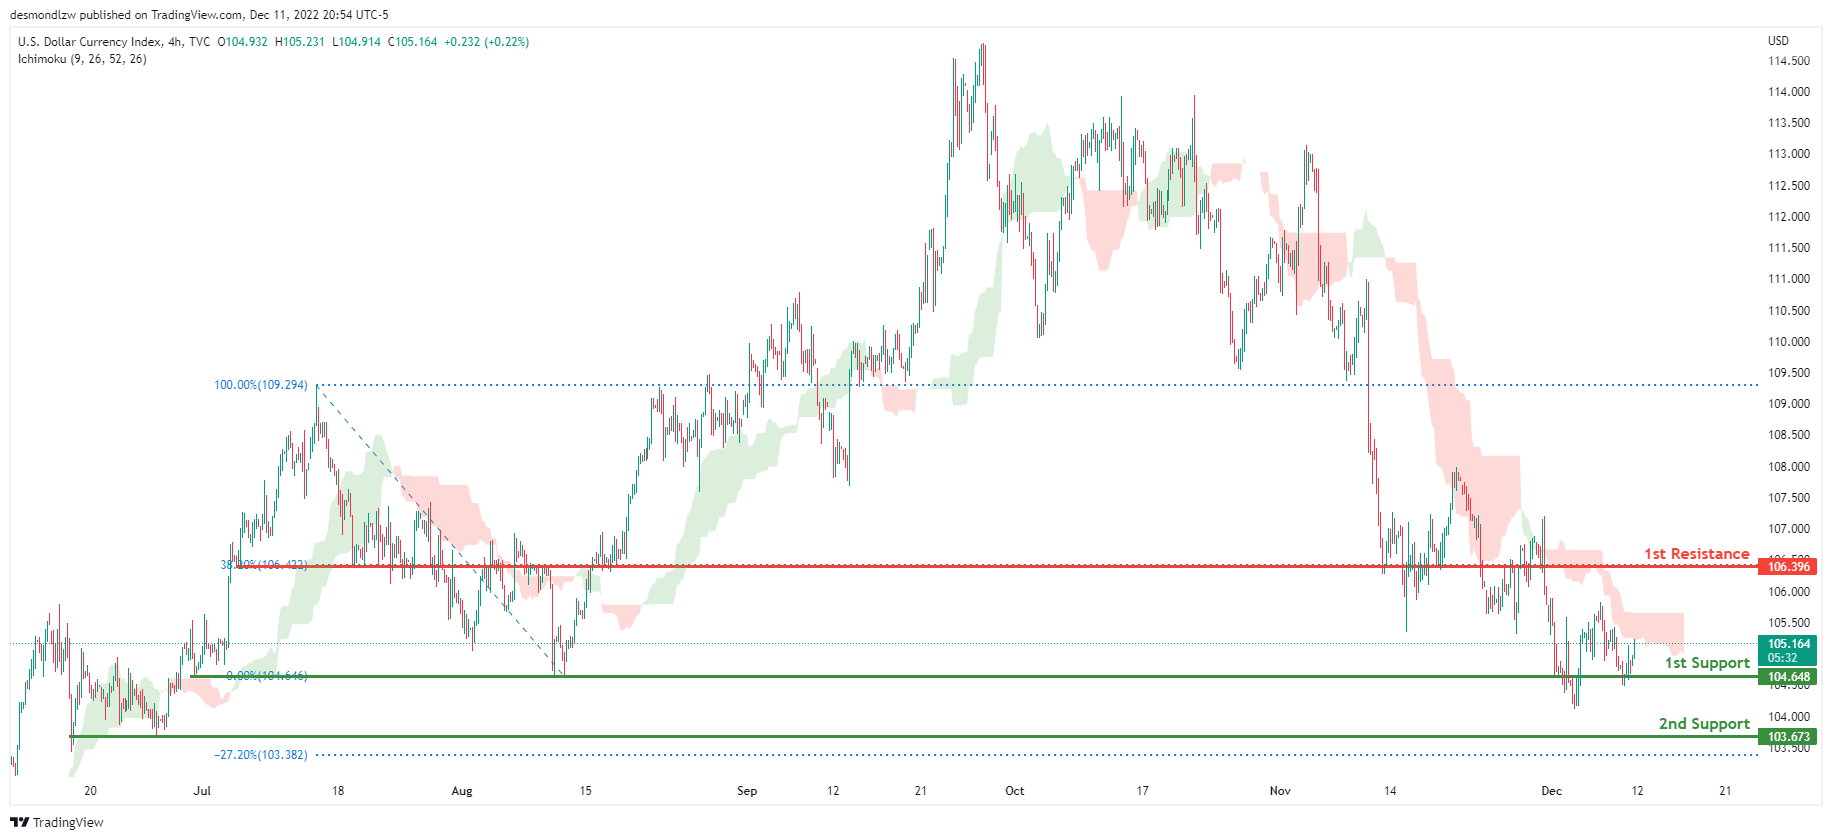
On the H4 chart, the overall bias for DXY is bearish. To add confluence to this, the price is below the Ichimoku cloud which indicates a bearish market. If this bearish momentum continues, expect the price to continue heading towards the 1st support line at 104.648, where the previous swing low is. In an alternative scenario, price could head back up and retest the 1st resistance line resistance at 106.396, where the 38.2% Fibonacci line is.
Areas of consideration:
- H4 time frame, 1st resistance at 106.396
- H4 time frame, 1st support at 104.648
EUR/USD:
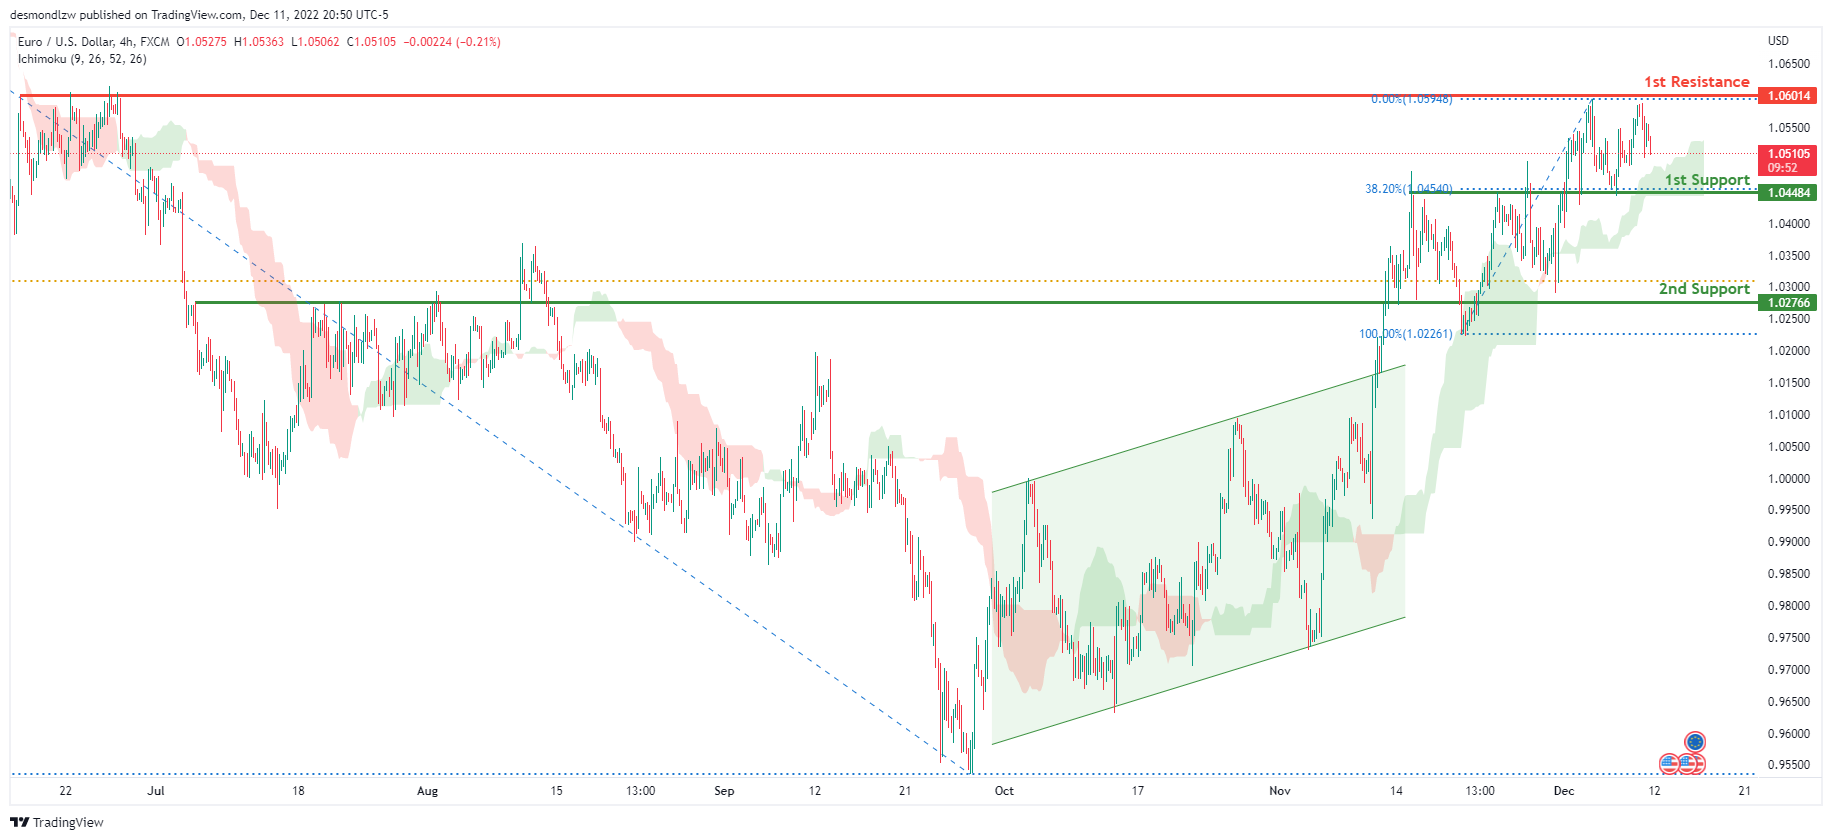
Looking at the H4 chart, my overall bias for EURUSD is bullish due to the current price being above the Ichimoku cloud, indicating a bullish market. To add confluence to this bias, price has also broken above the ascending bullish channel. If this bullish momentum continues, expect the price to possibly head towards the 1st resistance at 1.06014, where the previous swing high and 78.6% Fibonacci line are located., before heading towards the 2nd resistance at 1.07652, where the previous swing high is. In an alternate scenario, price could possibly head back down to break the 1st support level at 1.04484, where the previous high and 38.2% Fibonacci line are located before heading towards the 2nd support at 1.02766 where the 61.8% Fibonacci line is.
Areas of consideration :
- H4 1st resistance at 1.06014
- H4 1st support at 1.04484
- H4 2nd support at 1.02766
GBP/USD:
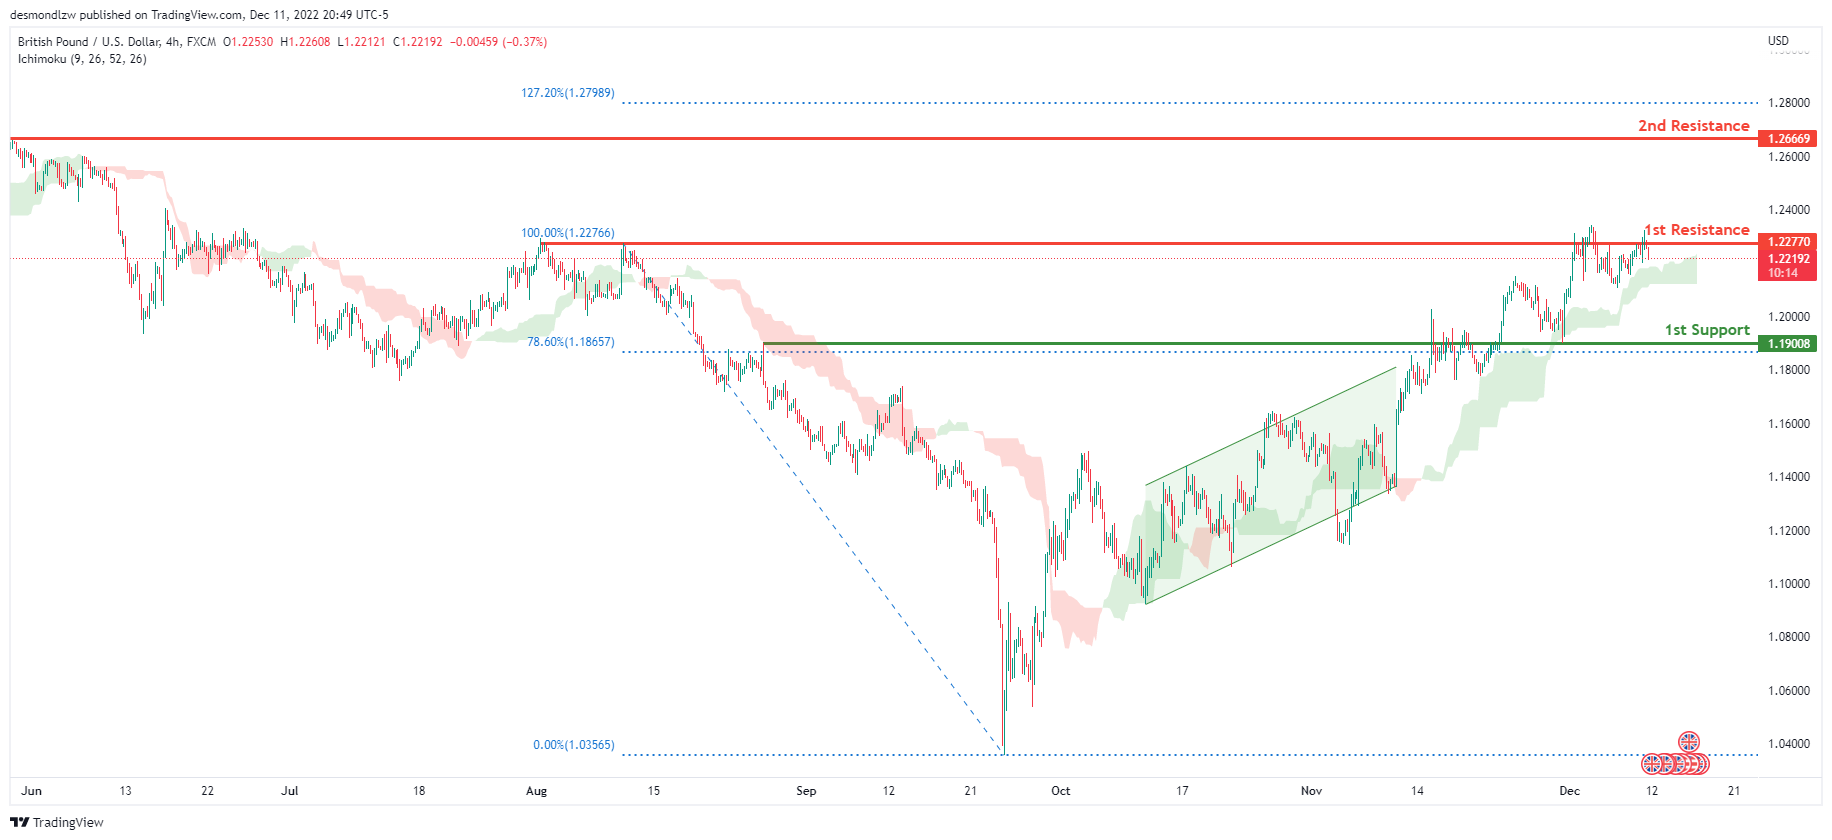
Looking at the H4 chart, my overall bias for GBPUSD is bullish due to the current price being above the Ichimoku cloud, indicating a bullish market. Expecting price to head back up to possibly break the 1st resistance line at 1.22770, where the previous high is, before heading towards the 2nd resistance at 1.26669, where the previous swing high is. In an alternative scenario, price could possibly head back down towards the 1st support at 1.19008, where the 78.6% Fibonacci line is.
Areas of consideration:
- H4 1st resistance at 1.22770
- H4 2nd resistance at 1.26669
- H4 1st support at 1.19008
USD/CHF:
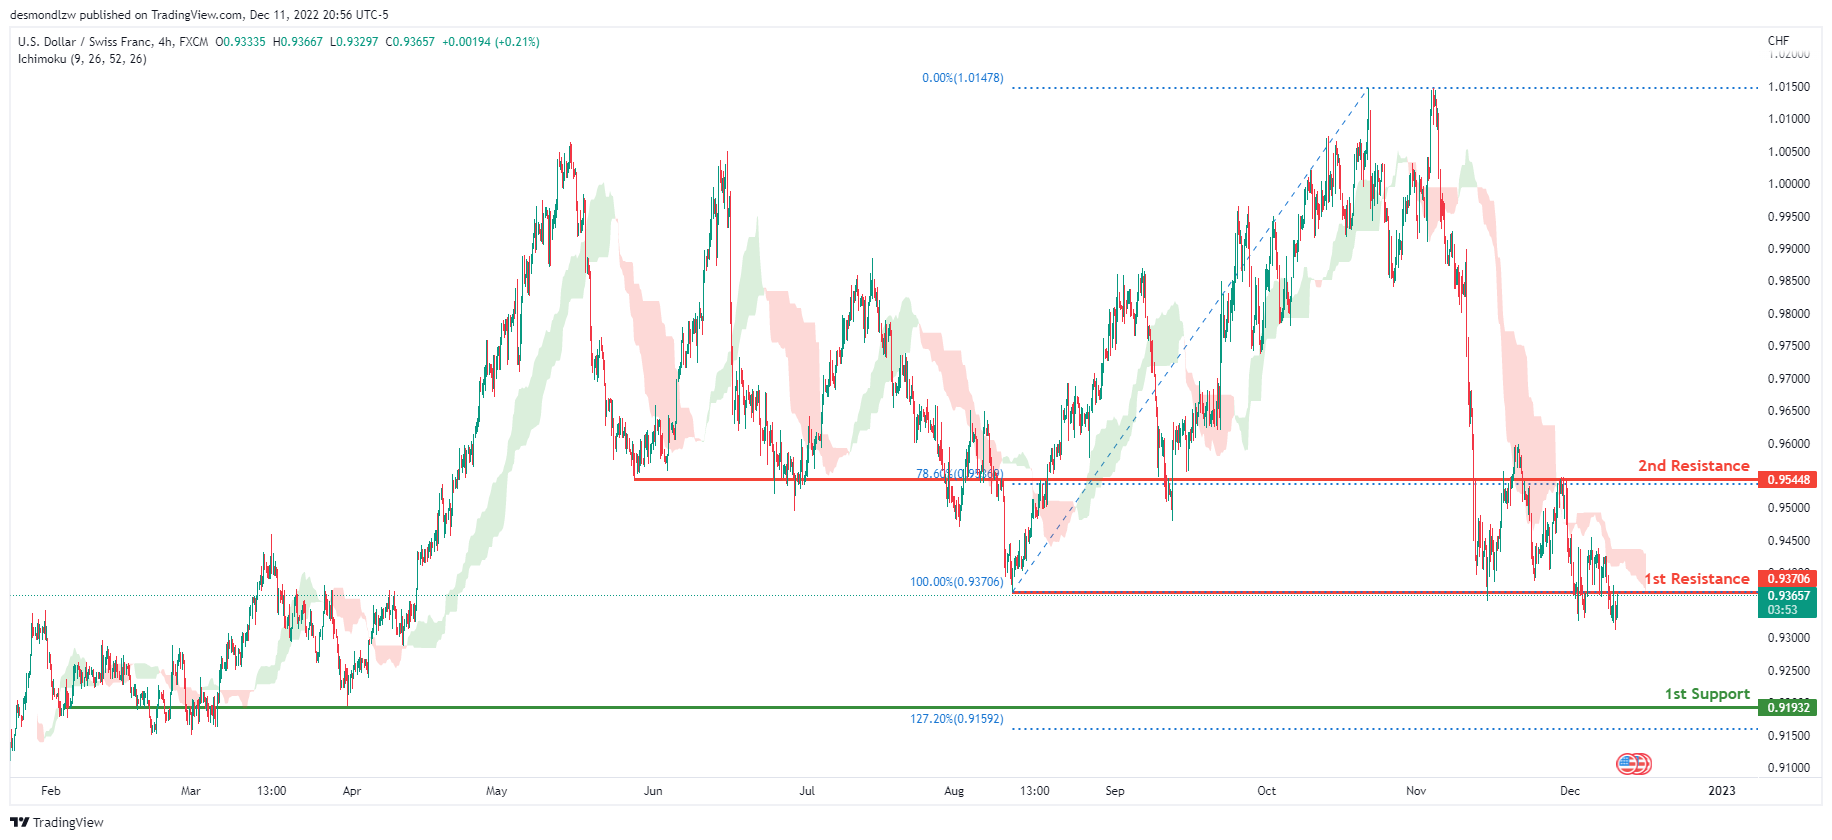
The overall bias for USDCHF on the H4 chart is bearish. In addition, the price is below the Ichimoku cloud, indicating a bearish market. If the current bearish trend continues, expect the price to head back down towards the 1st support line at 0.91932, where the previous swing low and 12.72% Fibonacci extension line is . In an alternative scenario, price could possibly head up towards the 1st resistance at 0.93706, where the previous swing low is .
Areas of consideration
- H4 1st support at 0.91932
- H4 1st resistance at 0.93706
XAU/USD (GOLD):
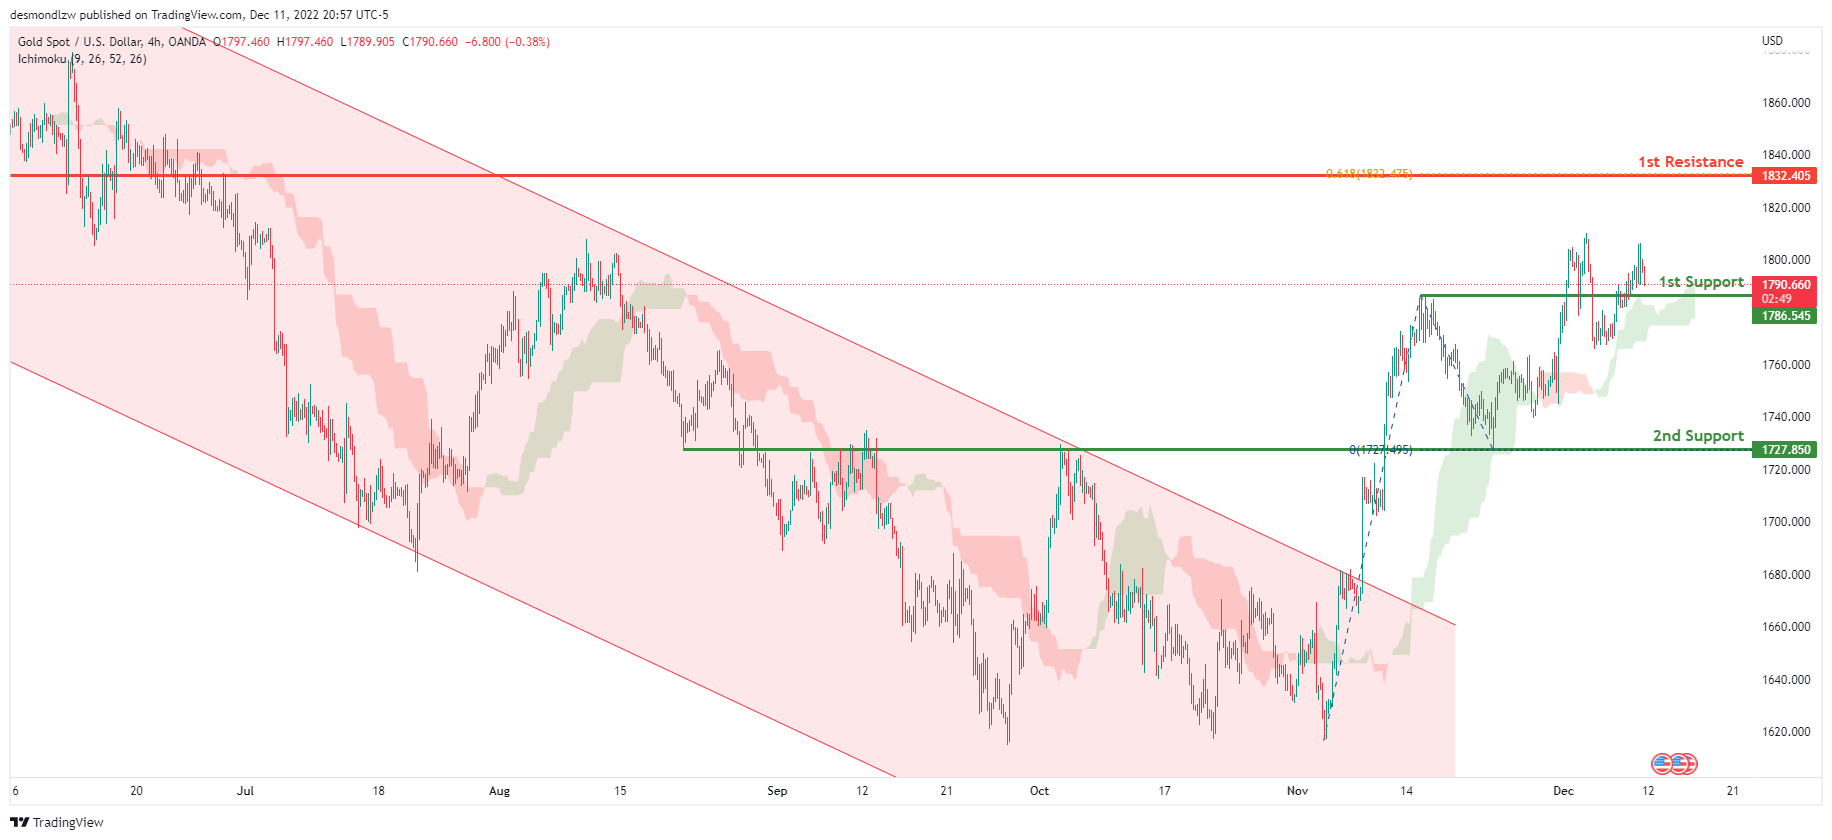
Looking at the H4 chart, my overall bias for XAUUSD is bullish due to the current price crossing above the Ichimoku cloud, indicating a bullish market. If this bullish momentum continues, expect the price to possibly head towards the 1st resistance at 1832.405, where the 61.8% Fibonacci projection line is. In an alternate scenario, price could possibly head back down towards the 1st support level at 1786.545, where the previous swing high is located
Areas of consideration:
- H4 time frame, 1st resistance at 1832.405
- H4 time frame, 1st support at 1786.545
AUD/USD:
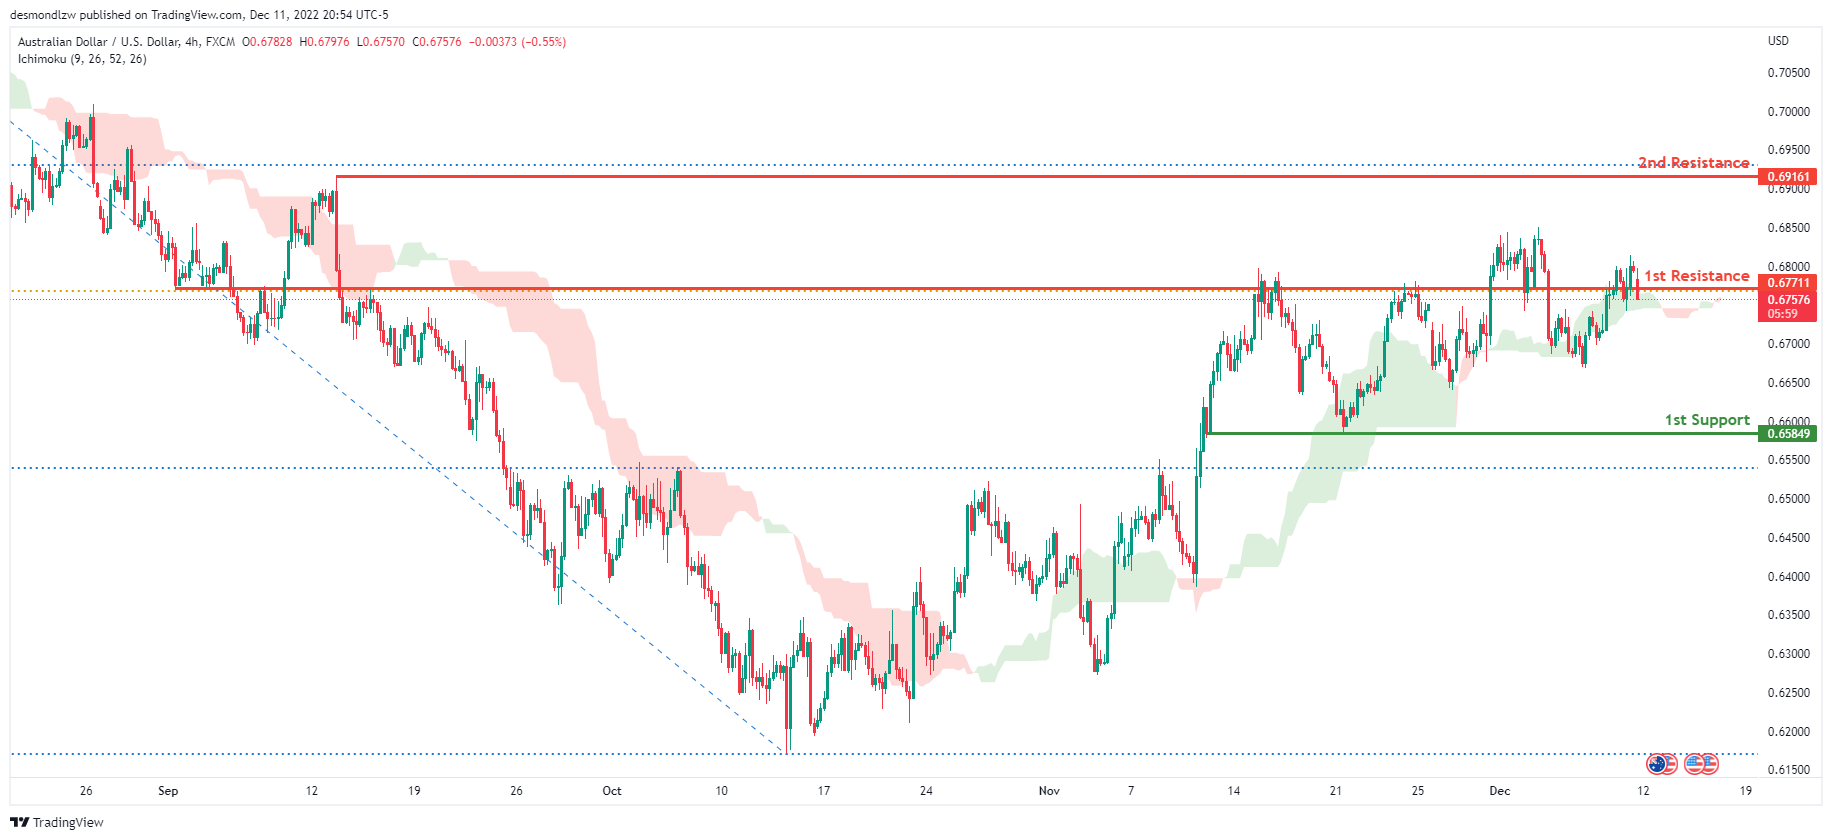
Looking at the H4 chart, my overall bias for AUDUSD is bullish due to the current price being above the Ichimoku cloud, indicating a bullish market. If this bullish momentum continues, expect the price to break the 1st resistance at 0.67711, where the 61.8% Fibonacci line is, before heading towards the 2nd resistance at 0.69161, where the 78.6% Fibonacci line is. In an alternative scenario, price could possibly head back down towards the 1st support line at 0.65849, where it is slightly above where the 38.2% Fibonacci line is.
Areas of consideration
- H4, 1st resistance at 0.67711
- H4, 2nd resistance at 0.69161
- H4, 1st support at 0.65849
NZD/USD:
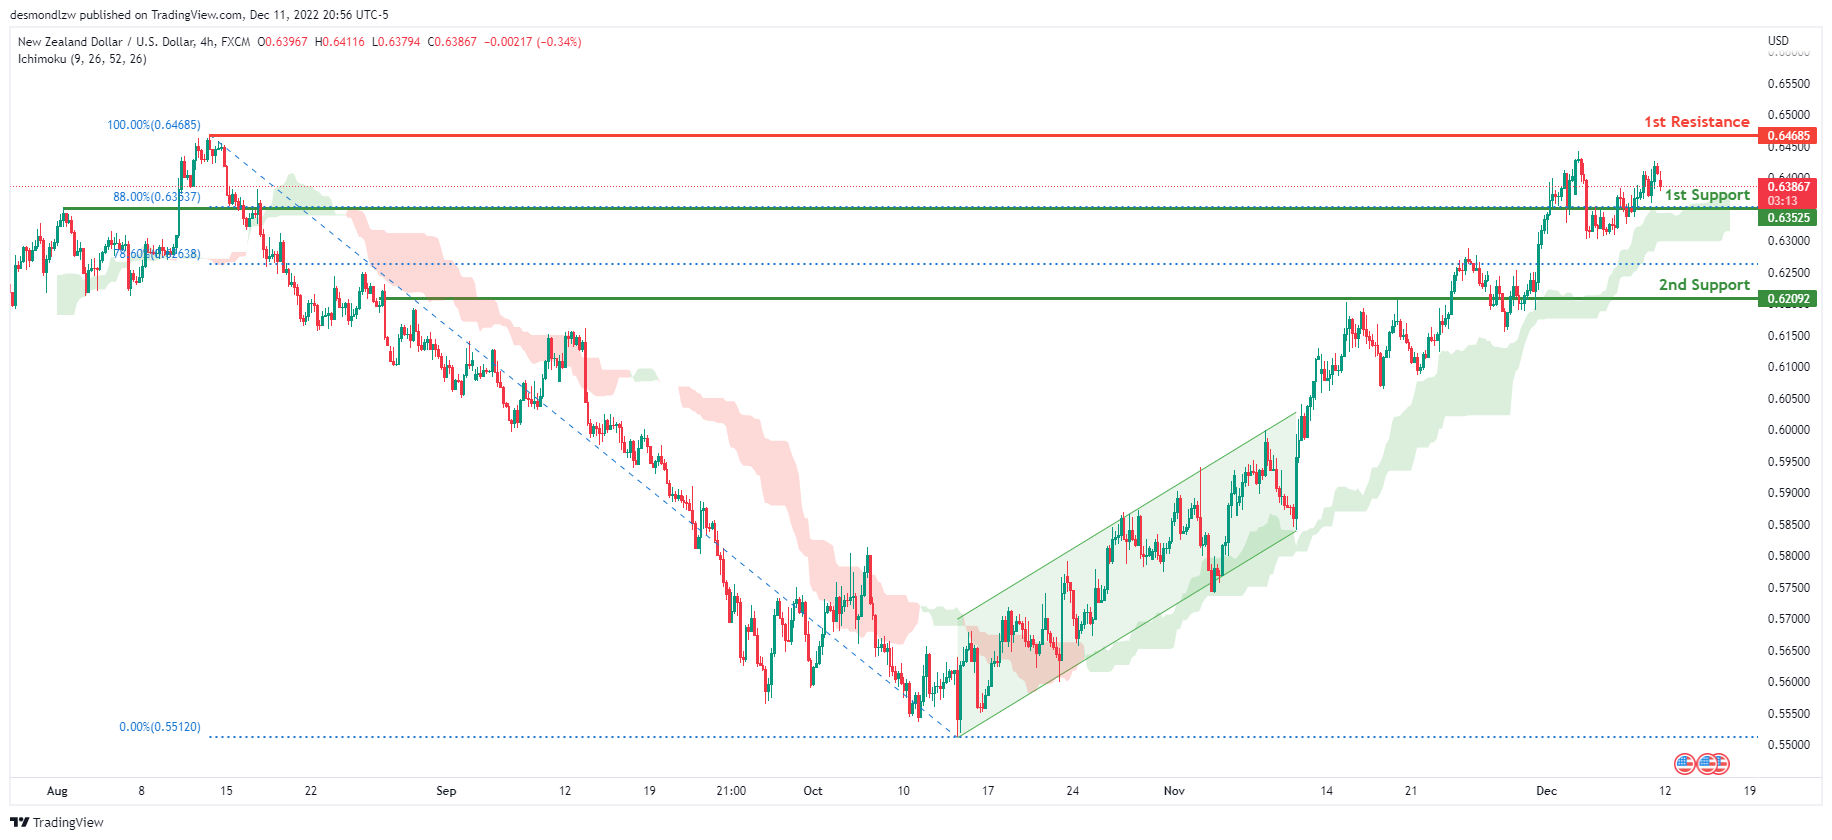
Looking at the H4 chart, my overall bias for NZDUSD is bullish due to the current price being above the Ichimoku cloud, indicating a bullish market.
To add confluence to this bias, price has broken out of the ascending channel. If this bullish momentum continues, expect the price to head up to the 1st resistance line at 0.64685, where the previous swing high is. Alternatively, the price may head back down towards the 1st support aat 0.63525, where the 88% Fibonacci line is.
Areas of consideration:
- H4 time frame, 1st resistance at 0.64685
- H4 time frame, 1st support at 0.63525
USD/CAD:
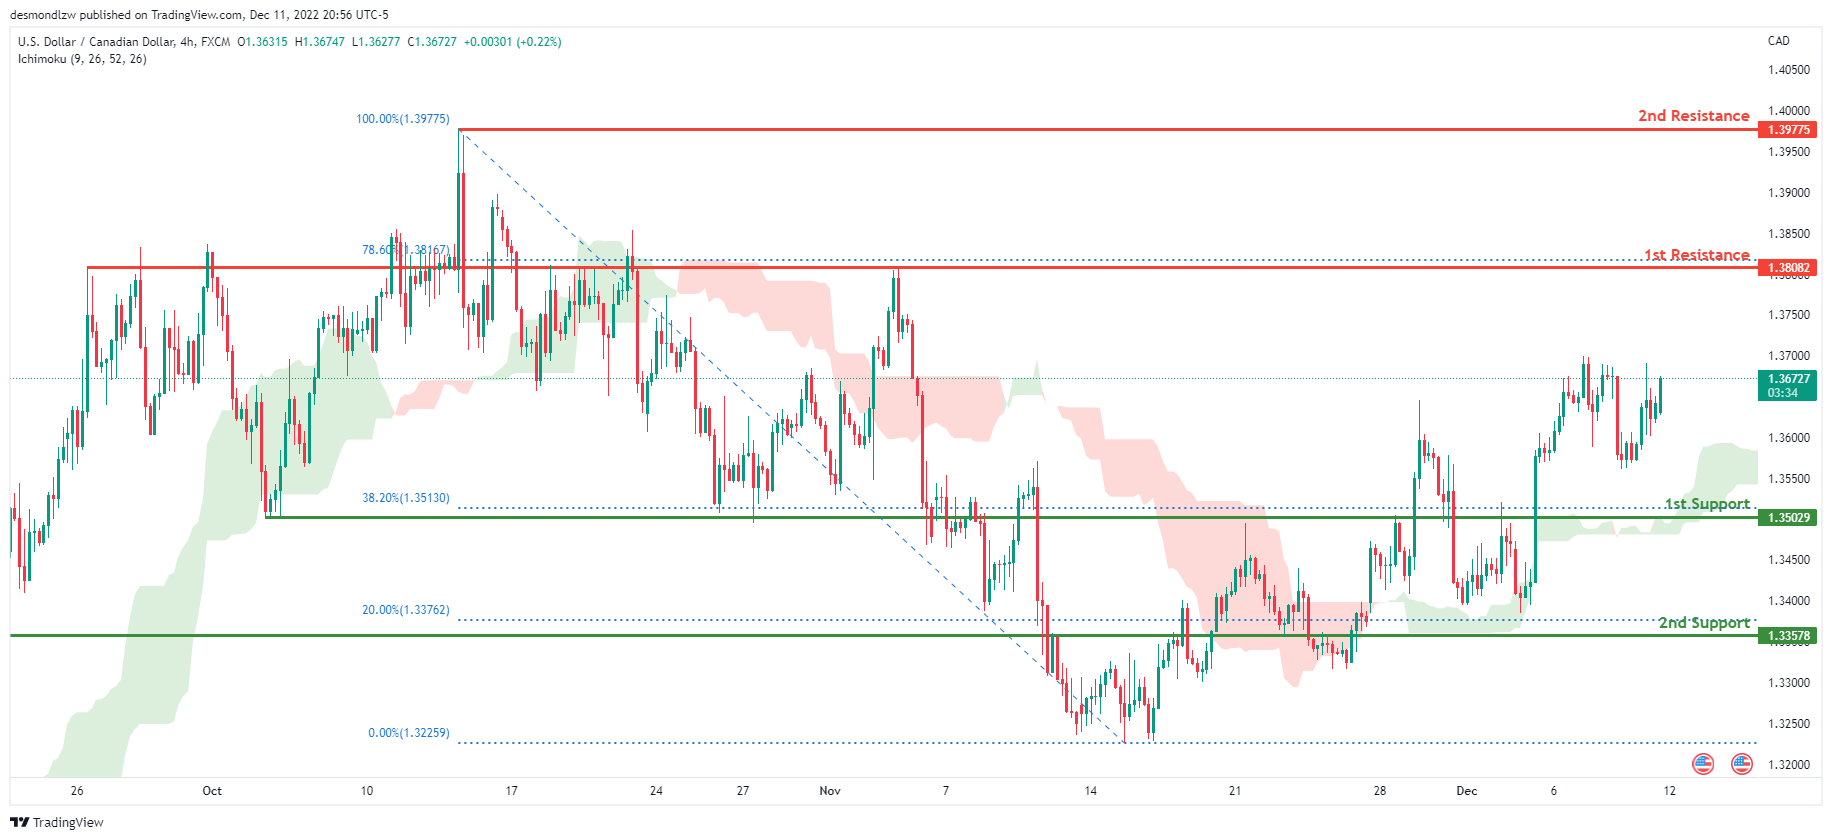
On the H4 chart, the overall bias for USDCAD is bullish. To add confluence to this, the price is above the Ichimoku cloud which indicates a bullish market. If this bullish momentum continues, expect the price to head towards 1st resistance line at 1.38082, where the 78.6% Fibonacci line is. In an alternative scenario, price could head back down to retest the 1st support at 1.35029, where the 38.2% Fibonacci line is.
Areas of consideration:
- H4 time frame, 1st resistance at 1.38082
- H4 time frame, 2nd resistance at 1.39775
- H4 time frame, 1st support at 1.35029
OIL:
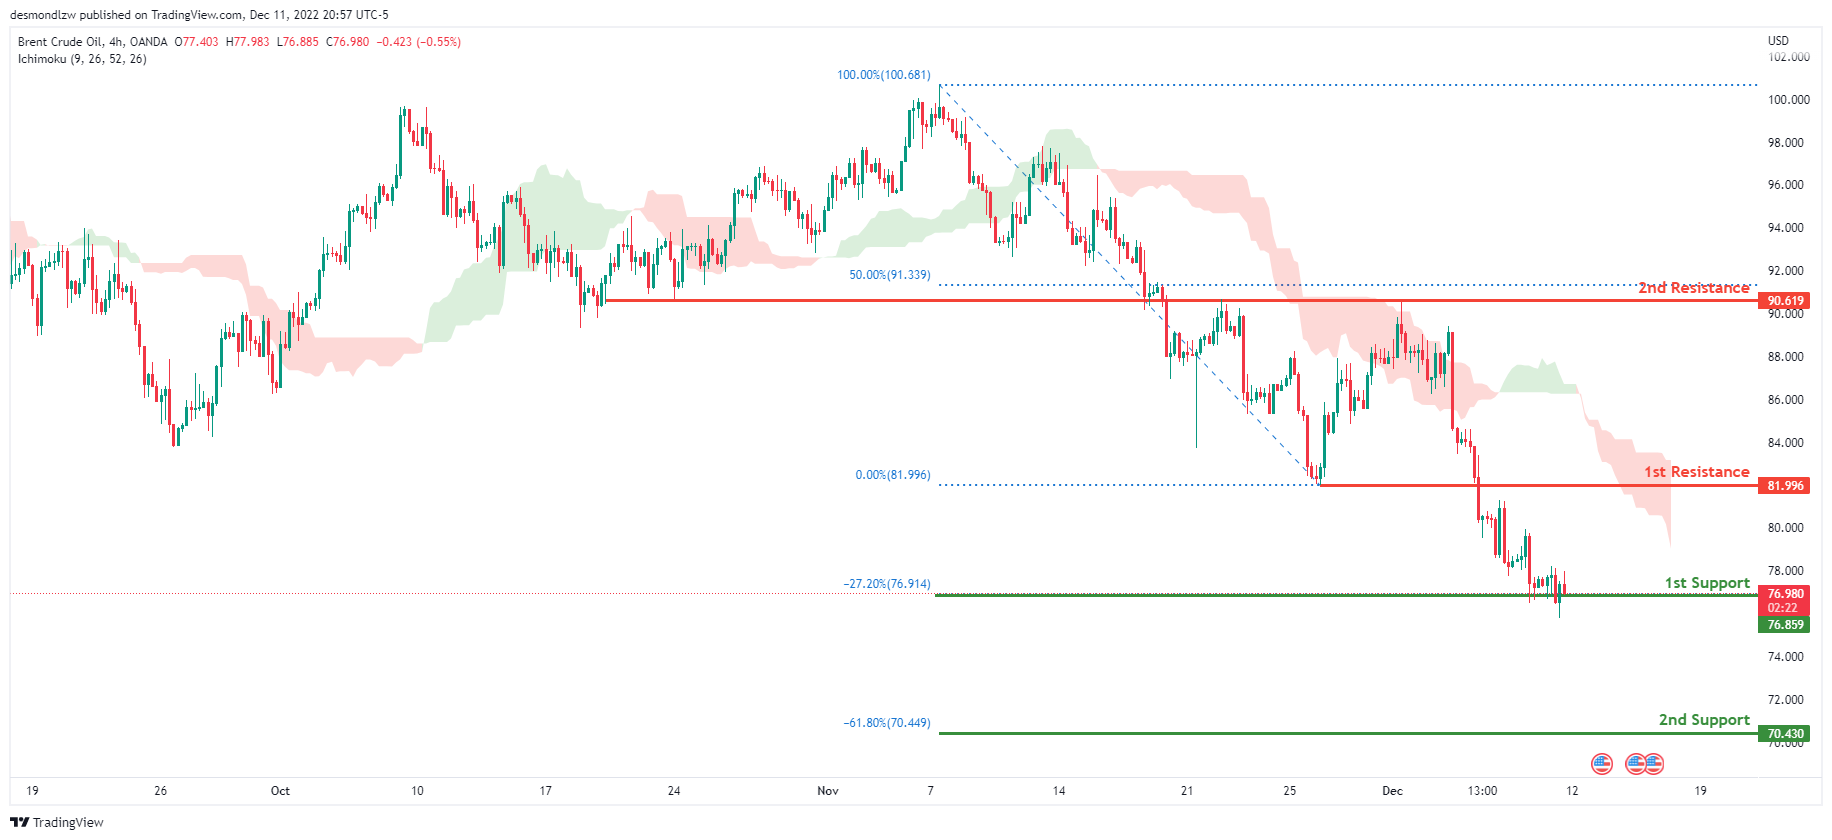
Looking at the H4 chart, my overall bias for BCOUSD is bearish due to the current price being below the Ichimoku cloud, indicating a bearish market. If this bearish momentum continues, expect price to possibly break the 1st support line at 76.859, where the -27.2% Fibonacci expansion line is, before heading towards the 2nd support at 70.430, where the -27.2% Fibonacci expansion line is. In an alternate scenario, price could possibly head back up to retest the 1st resistance line at 81.996, where the previous low is located.
Areas of consideration:
- H4 time frame, 1st resistance at 81.996
- H4 time frame, 1st support at 76.859
- H4 time frame, 2nd support at 70.430
Dow Jones Industrial Average:
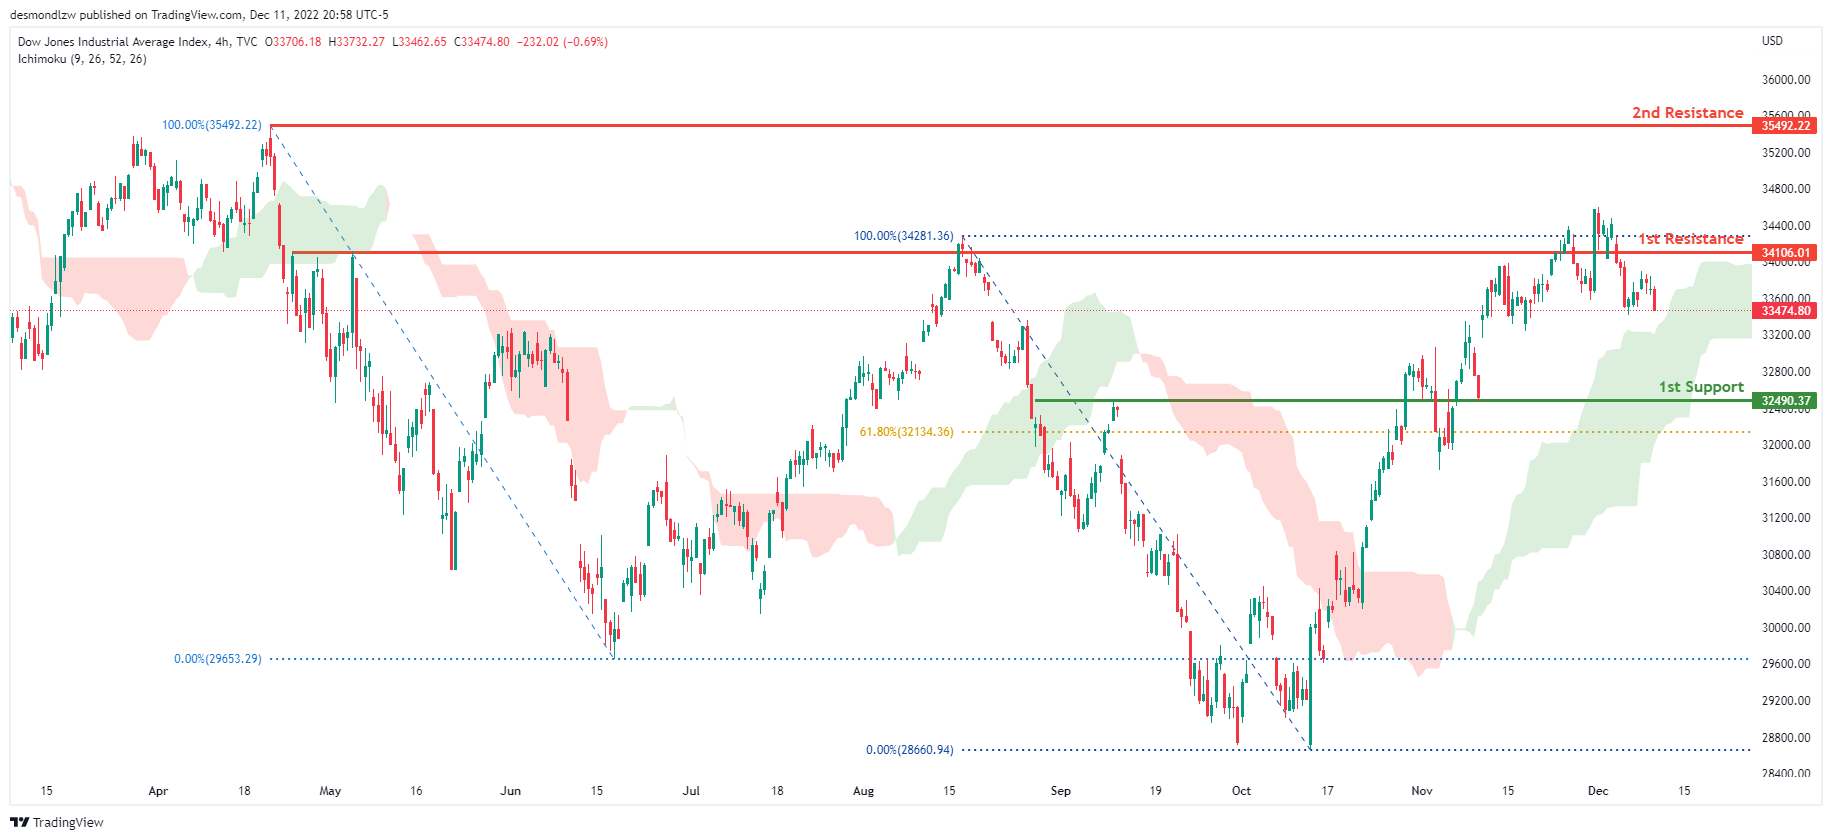
On the H4 chart, the overall bias for DJI is bullish. To add confluence to this, the price is above the Ichimoku cloud which indicates a bullish market. If this bullish momentum continues, expect the price to continue heading towards the 1st resistance line at 34106.01, where the previous swing high is. In an alternative scenario, price could head back down towards the 1st support at 32490.37, where the 61.8% Fibonacci line is.
Areas of consideration:
- H4 time frame, 1st support at 32490.37
- H4 time frame, 1st Resistance at 34106.01
DAX:
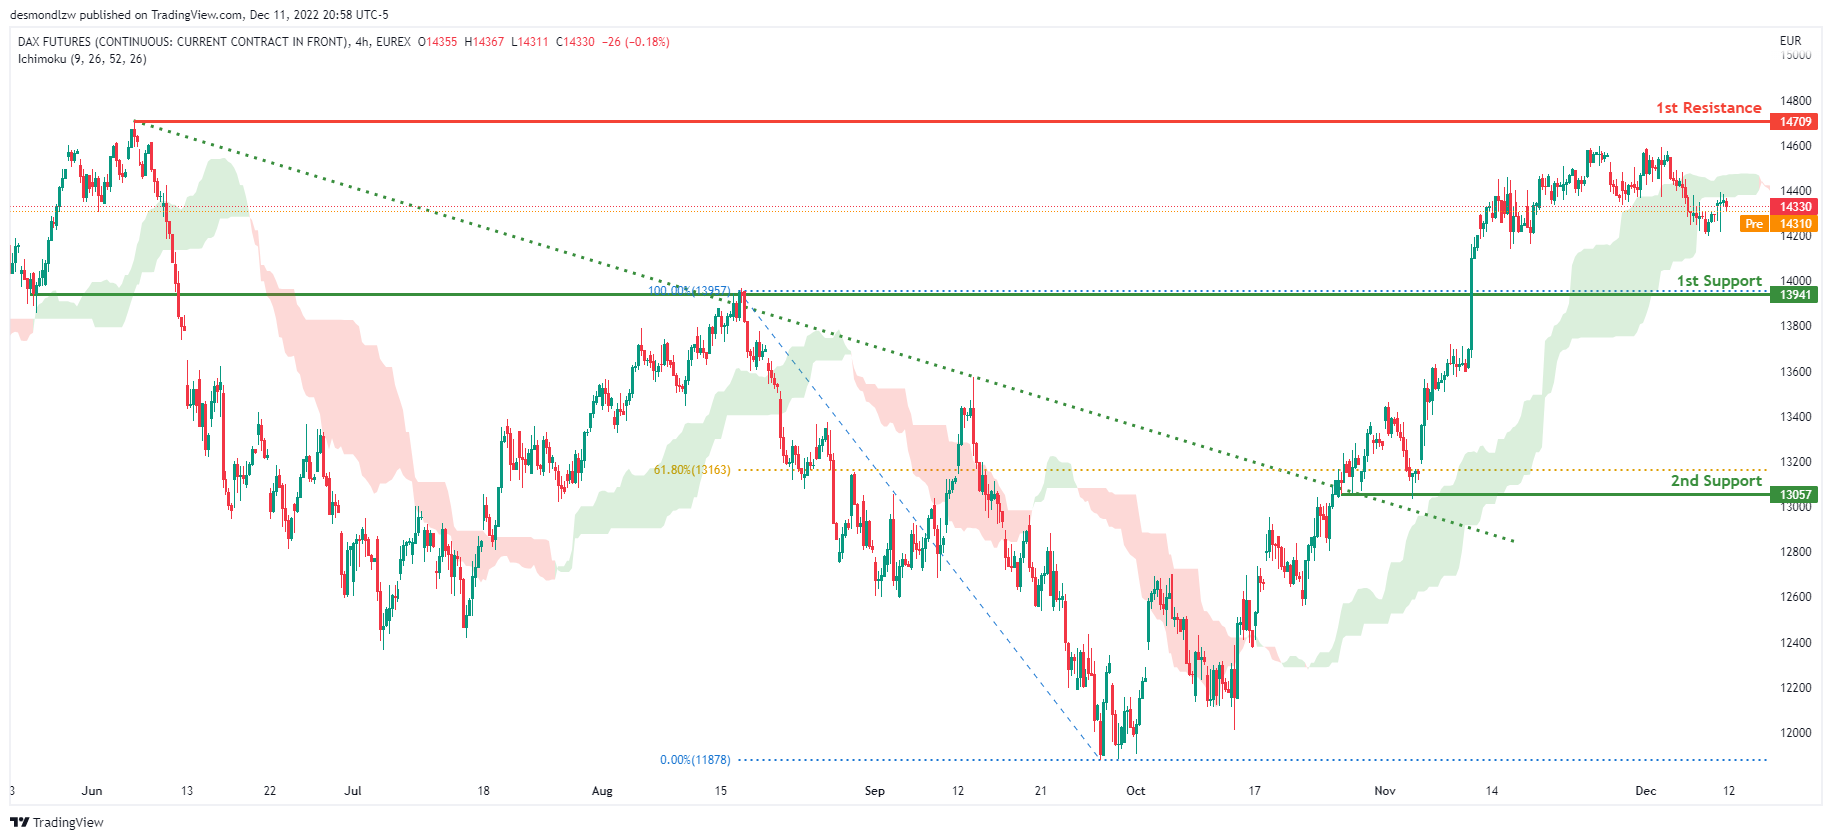
The H4 chart shows a bullish bias, with price breaking through the descending trendline and rising above the Ichimoku cloud. Price is expected to maintain its bullish momentum and rise to the first resistance level at 14709, where the previous swing high is located. Alternatively, the price could fall to the first support level at 13941, where the previous swing high was.
Areas of consideration:
- H4 time frame, 1st resistance is at 14709
- H4 time frame, 1st support is at 13941
ETHUSD:
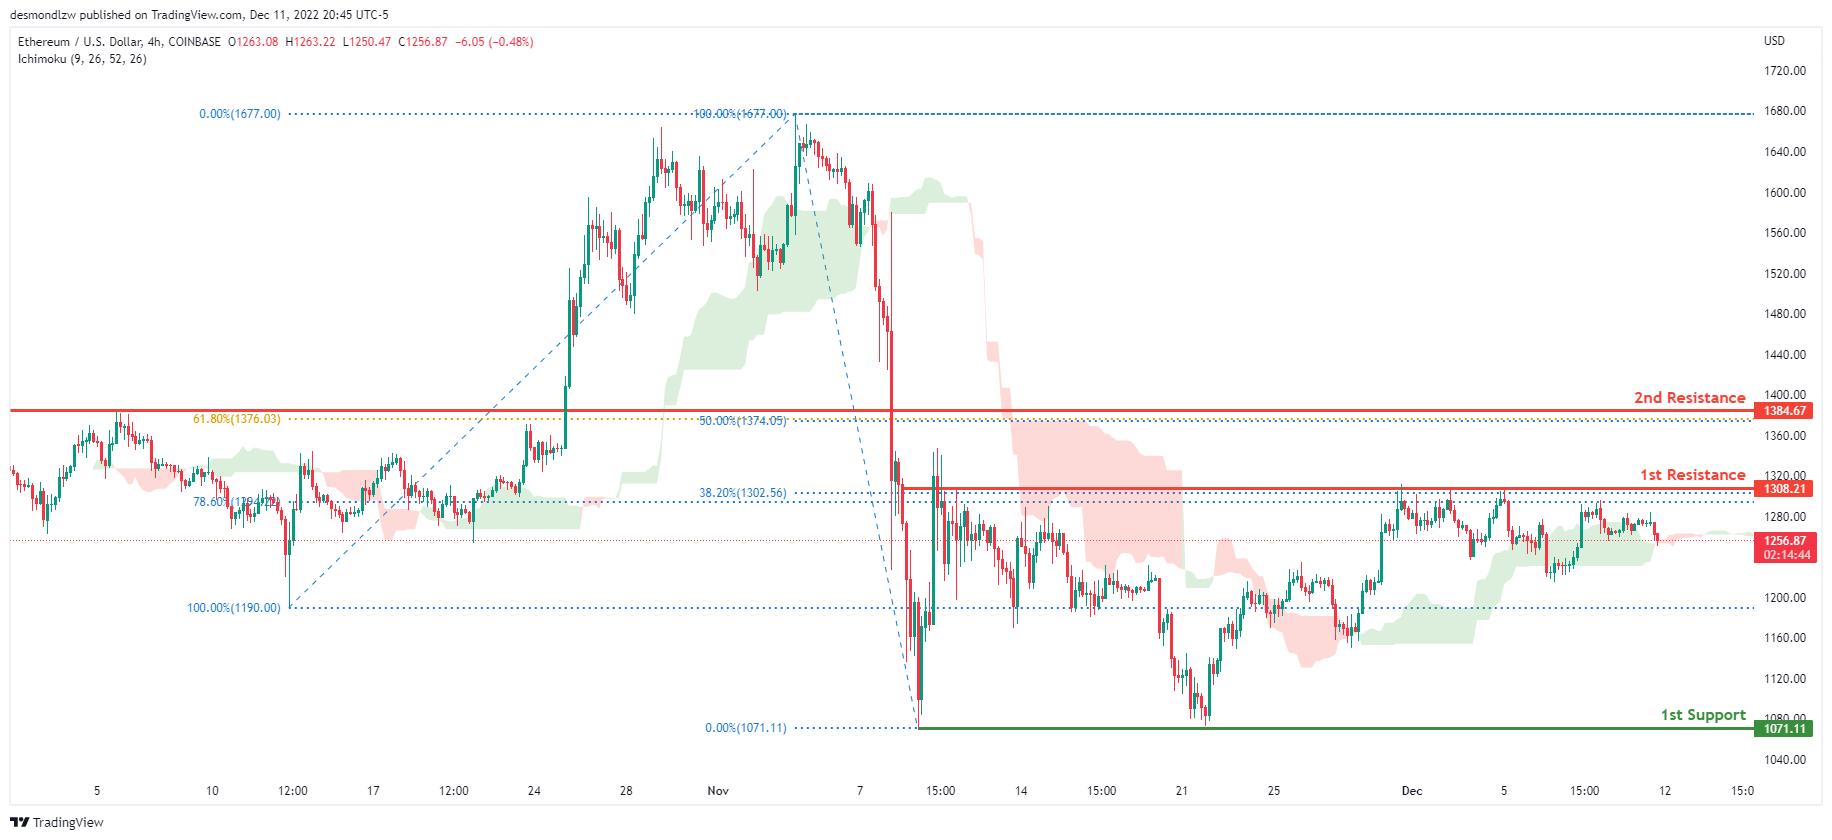
Looking at the H4 chart, my overall bias for ETHUSD is bearish due to the current price crossing above the Ichimoku cloud, indicating a bearish market. Expecting price to possibly head back down towards the 1st support at 1071.11, where the previous swing low is. In an alternative scenario, price could break the 1st resistance at 1308.21, where the 38.2% and 78.6% Fibonacci lines are before heading towards the 2nd resistance line at 1384.67, where the 50% and 61.8% Fibonacci lines are.
Areas of consideration:
- H4 time frame, 1st resistance of 1308.21
- H4 time frame, 2nd resistance of 1384.67
- H4 time frame, 1st support at 1071.11
BTCUSD:
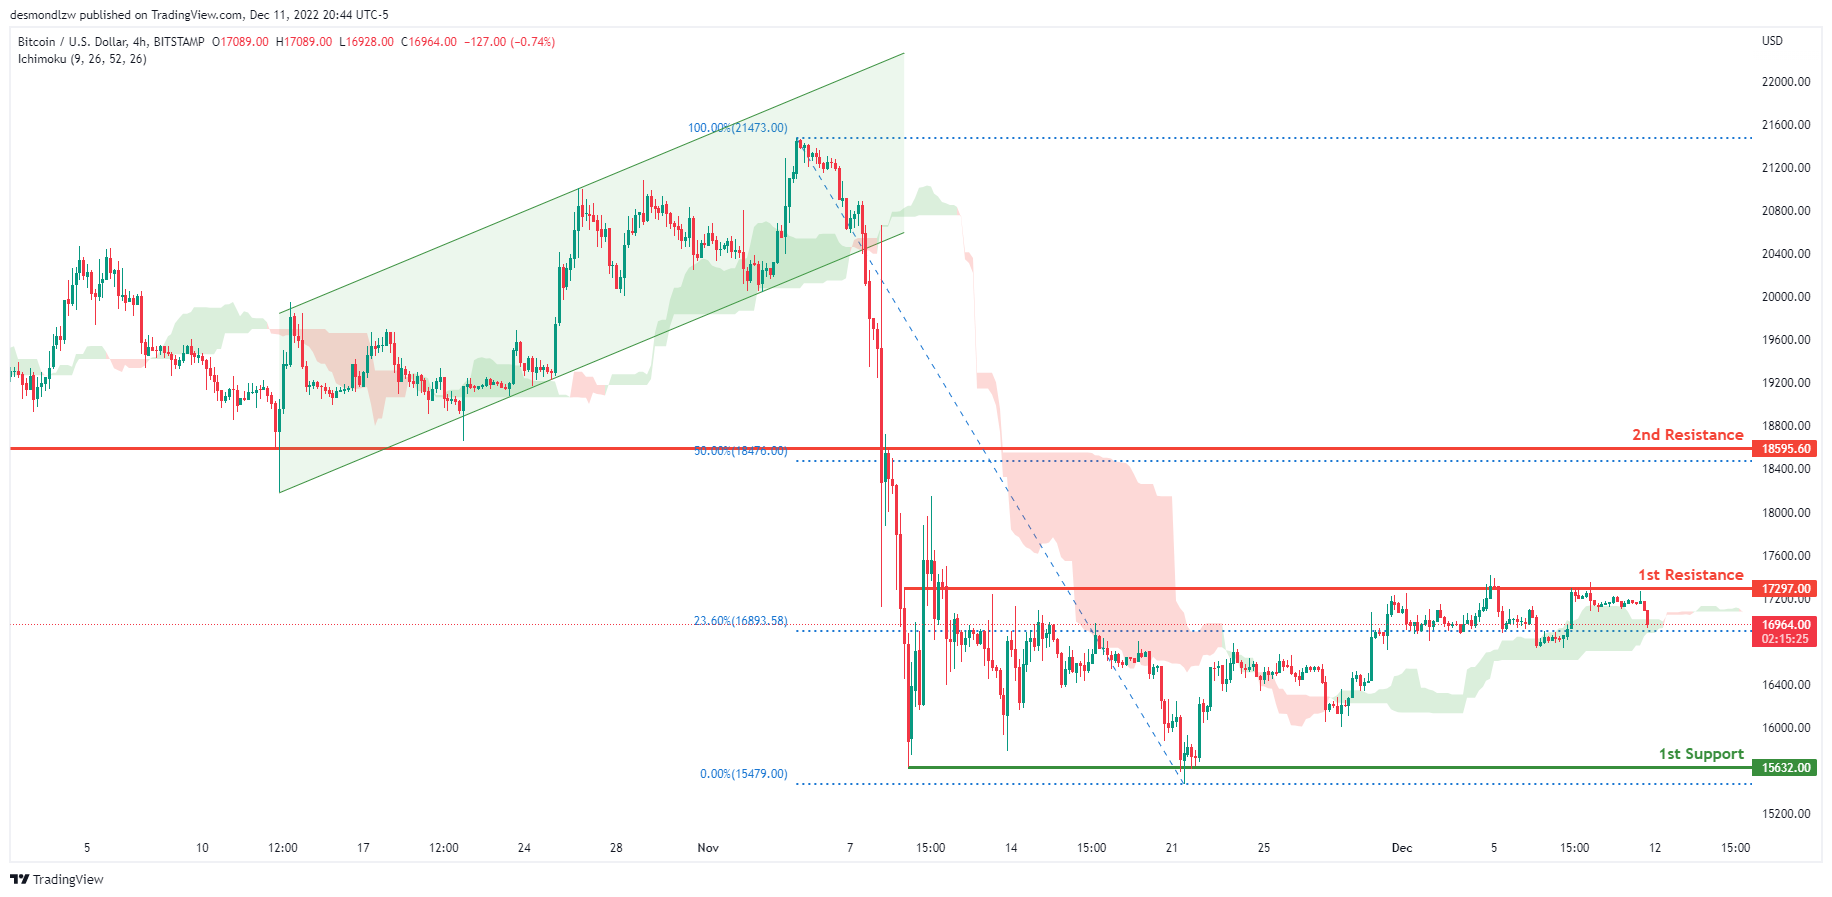
Looking at the H4 chart, my overall bias for BTCUSD is bearish due to the current price crossing below the Ichimoku cloud, indicating a bearish market. Expecting price to possibly head back down towards the 1st support at 15632.00, where the previous swing low is. In an alternative scenario, price could possibly break the 1st resistance at 17297.00, where the 23.6% Fibonacci line is before heading towards the 2nd resistance line at 18173.33, where the previous swing low is and 50% Fibonacci line are.
Areas of consideration:
- H4 time frame, 1st resistance 17297.00
- H4 time frame, 2nd resistance 18173.33
- H4 time frame, 1st support at 15632.00
S&P 500:
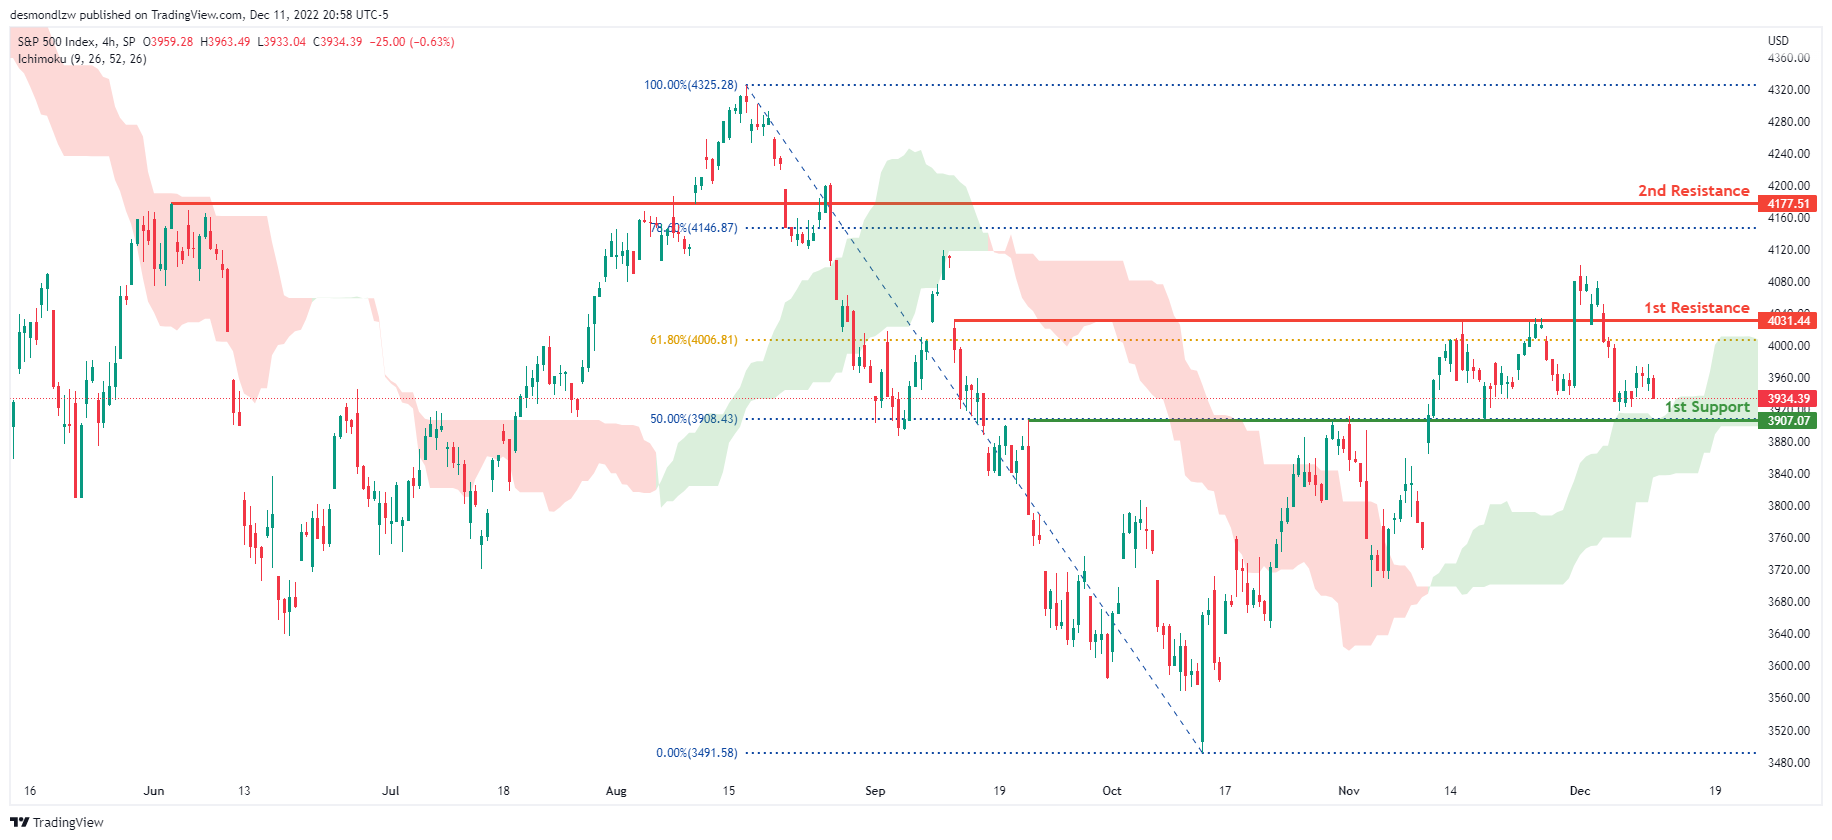
The overall bias for the S&500 on the H4 chart is bullish, with prices above the Ichimoku cloud. If the bullish momentum continues, the expected price to head towards the 1st resistance line is at 4031.44, where the 61.8% Fibonacci line is located. In an alternate scenario, price could return to the 1st support line at 3907.07, where the 50% Fibonacci line is located.
Areas of consideration:
- H4 time frame, 1st support at 3907.07
- H4 time frame, 1st resistance at 4031.44
Japan PPI slowed to 9.3% yoy in Nov, global commodity prices easing
Japan corporate goods price index, PPI, slowed from 9.4% yoy to 9.3% yoy in November, above expectation of 8.9% yoy. The index, at 118.5, was a record high. Yen-based import price index slowed notably from 42.3% yoy to 28.2% yoy.
"Companies were passing on rising raw material costs for a broad range of goods. But some goods saw the impact of recent easing of global commodity prices," a BOJ official told a briefing.
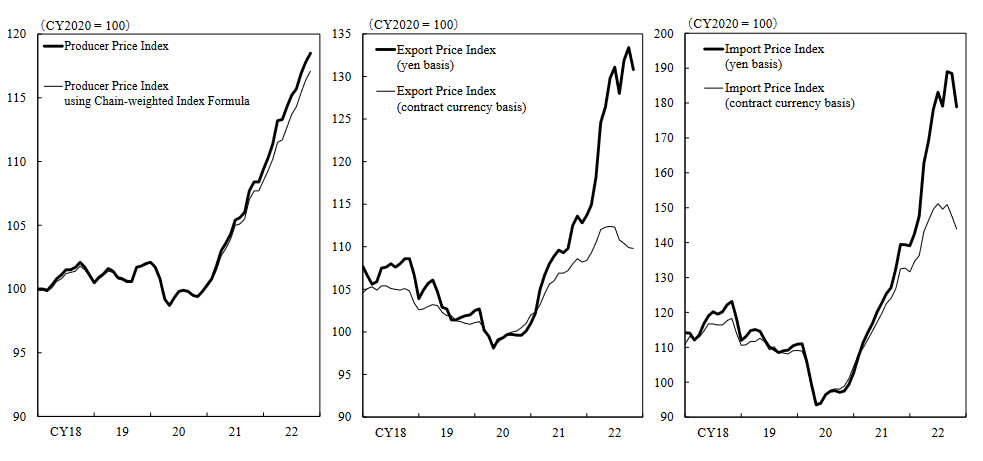
Also from Japan, MoF's Business Survey Index for all large industries rose from 0.4 to 0.7 in Q4. BSI large manufacturing, however, dropped from 1.7 to -3.6. BSI large non-manufacturing improved form -0.2 to 2.7. BSI medium all industries rose from -2.2 to 4.7. BSI small all industries rose from -15.9 to -6.0.
EUR/USD Poised for Additional Gains, Oil Price Takes Hit
Key Highlights
- EUR/USD could rise further above the 1.0585 resistance zone.
- A key bullish trend line is forming with support near 1.0485 on the 4-hours chart.
- GBP/USD aims an upside break above the 1.2350 resistance zone.
- Crude oil price extended its decline below the $73.50 support.
EUR/USD Technical Analysis
The Euro started a steady increase above 1.0420 against the US Dollar. EUR/USD even traded above the 1.0500 to move into a positive zone.
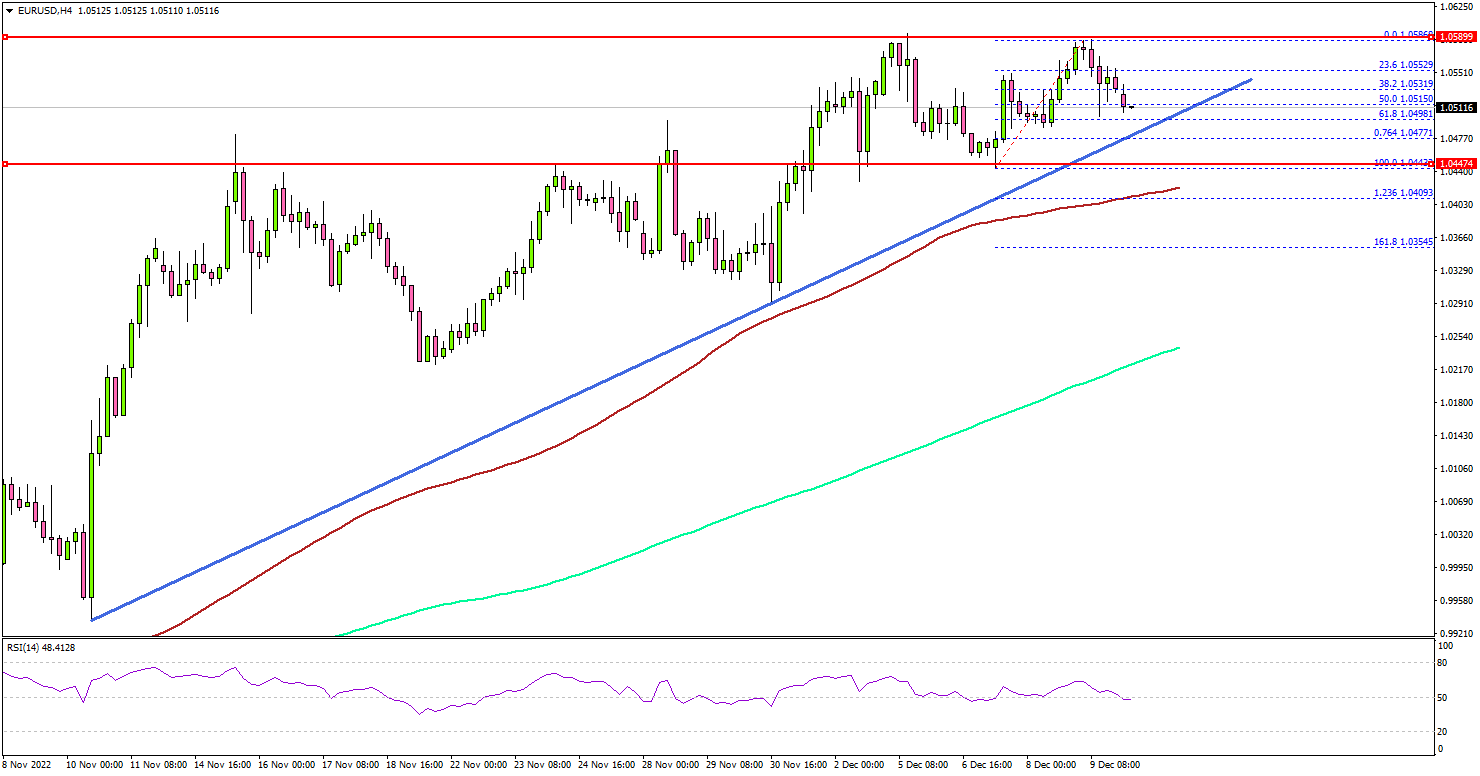
Looking at the 4-hours chart, the pair gained pace above the 1.0520 level. The pair even settled above the 1.0450 level, the 100 simple moving average (red, 4-hours), and the 200 simple moving average (green, 4-hours).
It traded as high as 1.0586 before the bears appeared. The pair is now consolidating gains above the 1.0500 level. An initial support is near the 1.0500 level. The next major support is near the 1.0480 zone.
There is also a key bullish trend line forming with support near 1.0485 on the same chart. Any more losses might send the pair towards the 1.0400 support zone and the 100 simple moving average (red, 4-hours).
On the upside, the pair is facing resistance near the 1.0550. The next major resistance may perhaps be near 1.0585. A clear move above the 1.0585 resistance might start another decent increase.
In the stated case, EUR/USD may perhaps test 1.0650. Any more gains could set the pace for a move towards the 1.0700 resistance zone.
Looking at crude oil price, there was a clear move below the $73.50 support and now there is a risk of more losses in the near term.
Economic Releases
- UK Industrial Production for Oct 2022 (MoM) - Forecast -0.3%, versus +0.2% previous.
- UK Manufacturing Production for Oct 2022 (MoM) - Forecast -0.1%, versus 0% previous.
OIL ($CL_F) Elliott Wave : Forecasting The Decline From Equal Legs Area
Hello fellow traders. In this technical blog we’re going to take a quick look at the Elliott Wave charts of OIL . As our members know, break of 09/27 low made incomplete bearish sequences in the cycle from the June peak. Consequently we were calling for further extension down within the cycle. Recently the commodity has given us nice 3 waves bounce which found sellers right at equal legs area as we expected. In the further text we are going to explain the Elliott Wave Forecast
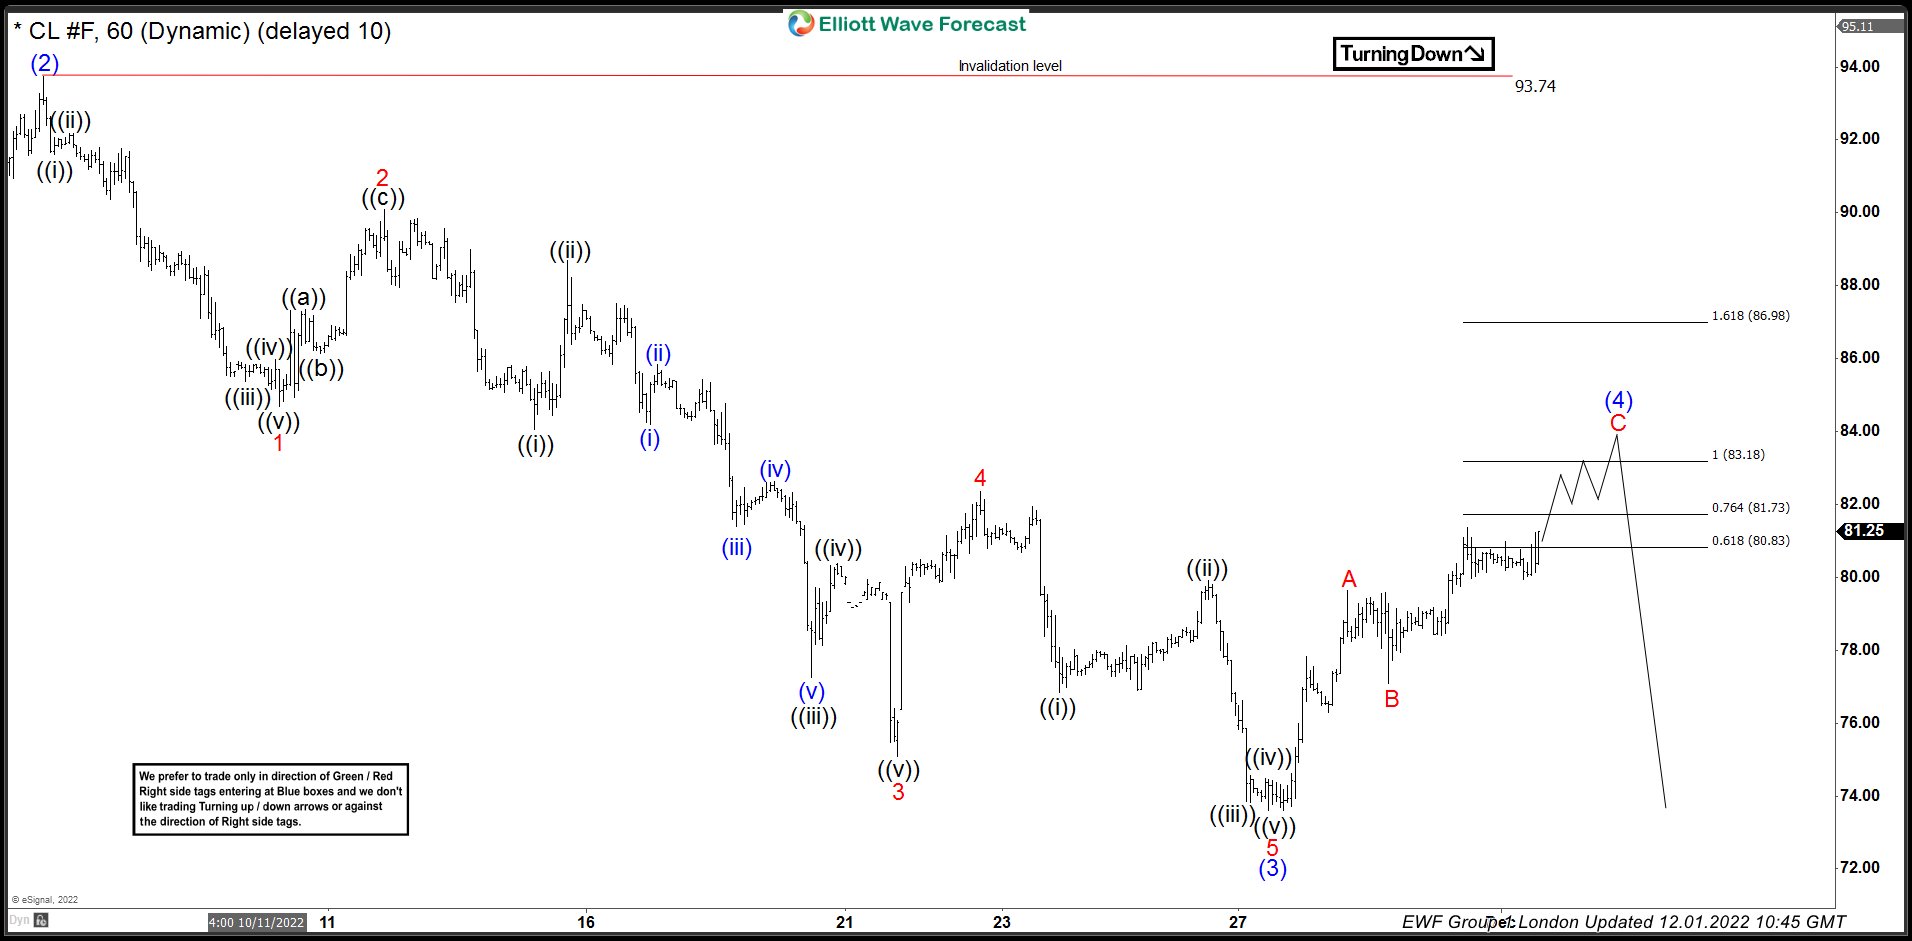
OIL H1 Elliott Wave Analysis 12.01.2022
OIL is correcting the short term cycle from the 93.74 peak. Recovery looks incomplete at the moment. The price is showing higher high sequences from the low, looking for extension up toward 83.18-86.98 area. At that zone buyers should be ideally taking profits and sellers can appear again. Consequently , we expect to see reaction from the marked area. Once OIL reaches mentioned area it should ideally make either decline toward new lows or larger 3 waves pull back at least.
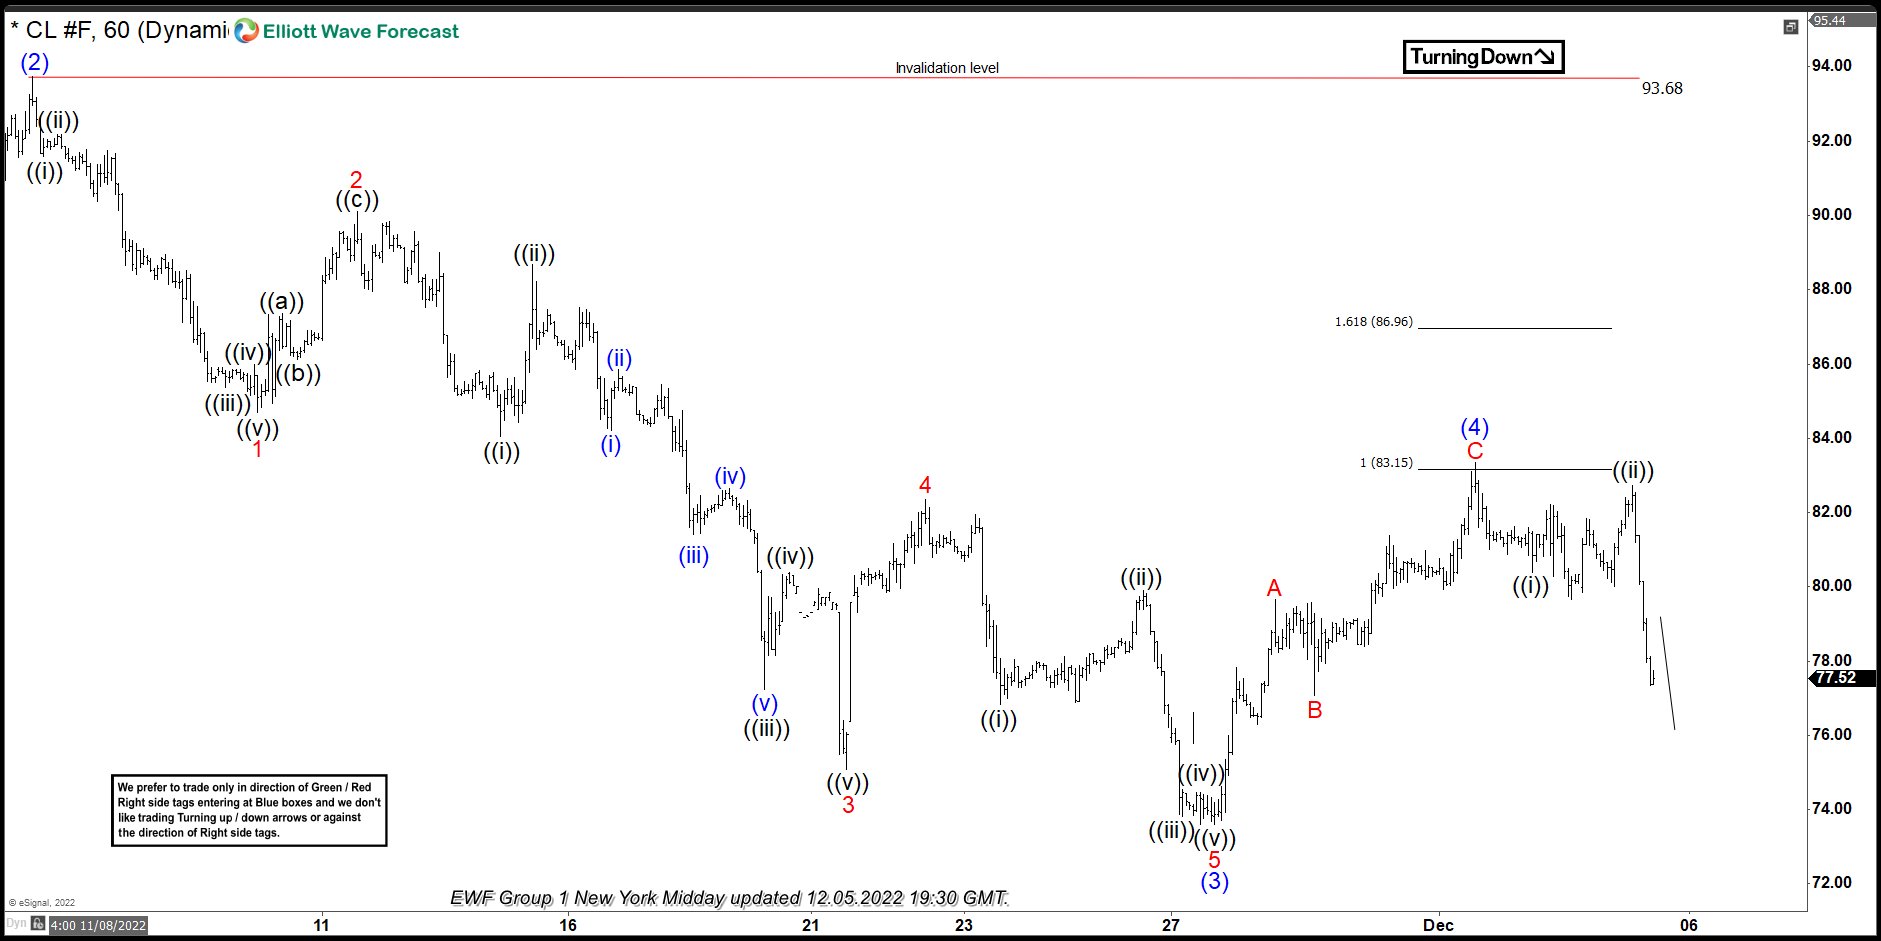
OIL H1 Elliott Wave Analysis 12.05.2022
Sellers appeared right at the marked extreme zone : 83.18-86.98 area and we got good reaction. Current view suggests (4) blue completed at 83.39 high. While below that high, we expect further decline to resume toward 71.28-67.57 area ideally.
EUR/USD Weekly Outlook
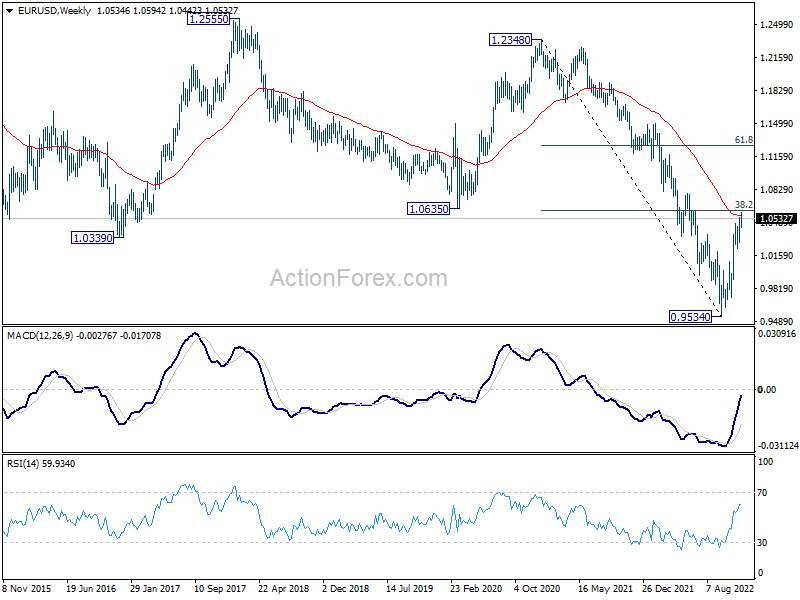
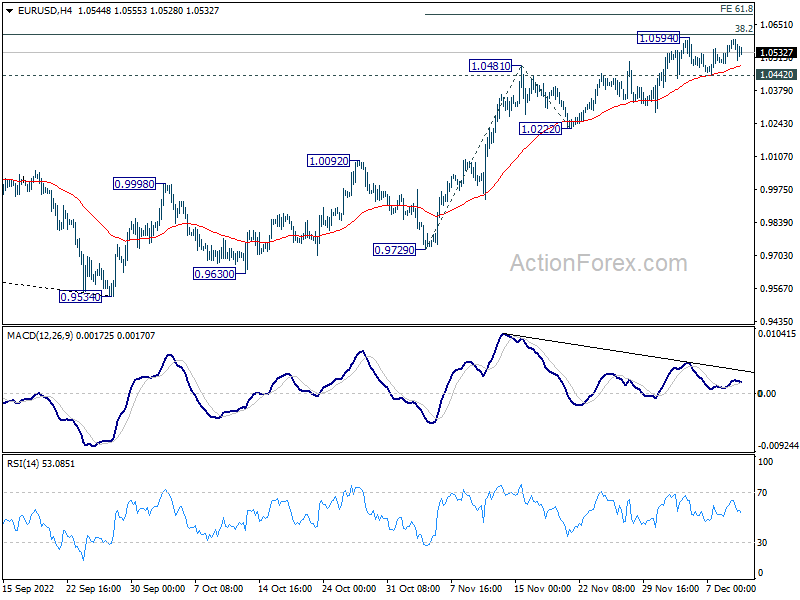
EUR/USD edged higher to 1.0594 last week but then turned sideway. Initial bias remains neutral this week first. On the downside, break of 1.0442 support will indicate rejection by 1.0609 fibonacci level. Bias will be back on the downside for 1.0222 support and below. However, firm break of 1.0594/0609 resistance zone will carry larger bullish implication. Next near term target is 61.8% projection of 0.9729 to 1.0481 from 1.0222 at 1.0687, and then 100% projection at 1.0974.
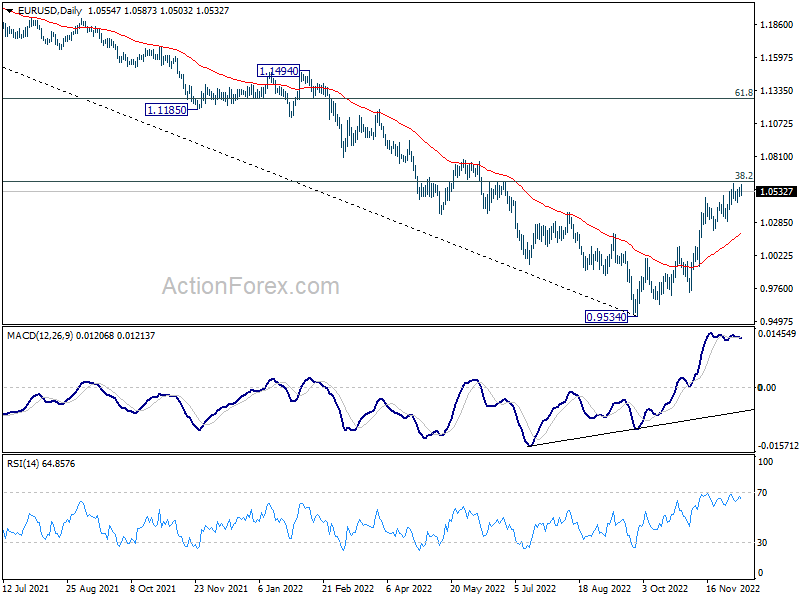
In the bigger picture, focus is now on 38.2% retracement of 1.2348 (2021 high) to 0.9534 at 1.0609. Rejection by 1.0609 will suggest that price actions from 0.9534 medium term bottom are developing into a corrective pattern. Thus, medium bearishness is retained for another fall through 0.9534 at a later stage. However, sustained break of 1.0609 will raise the chance of trend reversal and target 61.8% retracement at 1.1273.
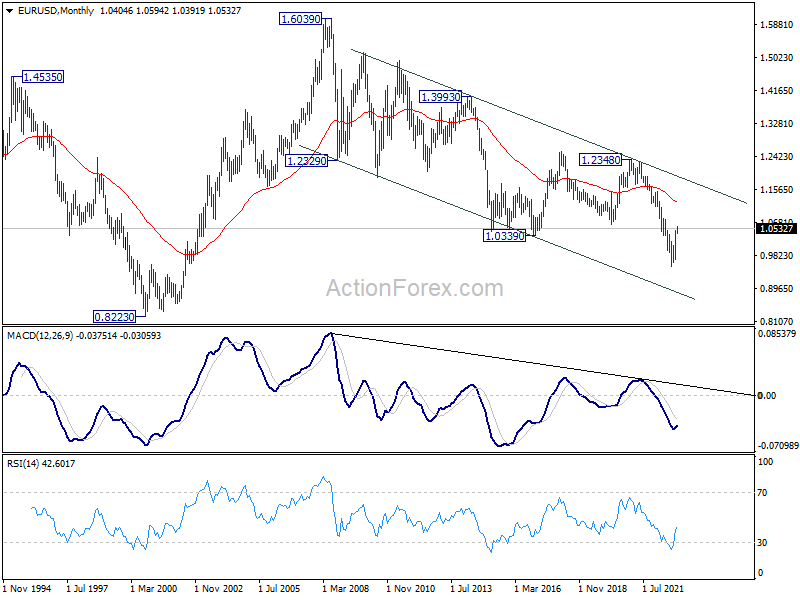
In the long term picture, as long as 1.0635 support turned resistance holds (2020 low), long term down trend from 1.6039 (2008) could still extend through 0.9534 at a later stage. However, sustained break of 1.0635 will confirm bottoming and at least turn long term outlook neutral.