

Sample Category Title
USD/CHF Daily Outlook
Daily Pivots: (S1) 0.9329; (P) 0.9378; (R1) 0.9412; More...
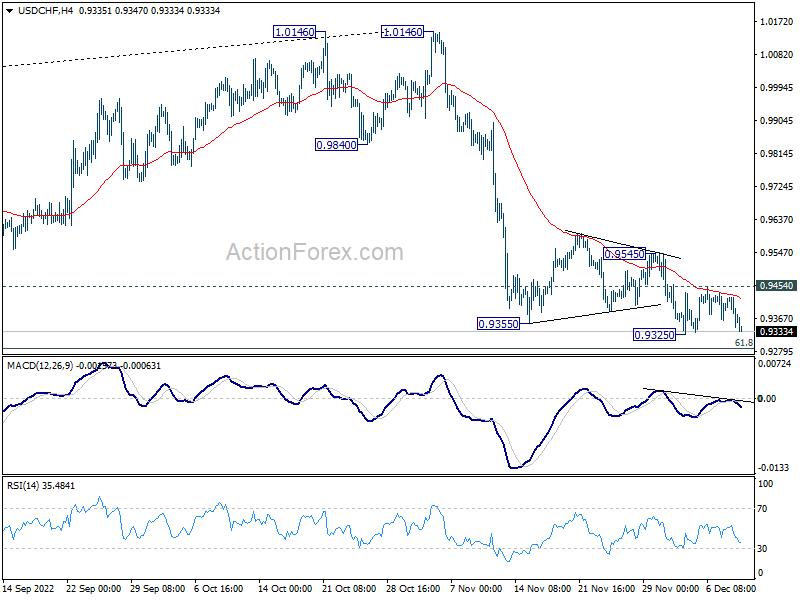
Intraday bias in USD/CHF remains neutral with focus on 0.9325 support. Firm break there will resume larger decline to 0.9287 fibonacci level. On the upside, however, break of 0.9454 resistance will now indicate short term bottoming. Intraday bias will be turned back to the upside for 0.9545 resistance and above.
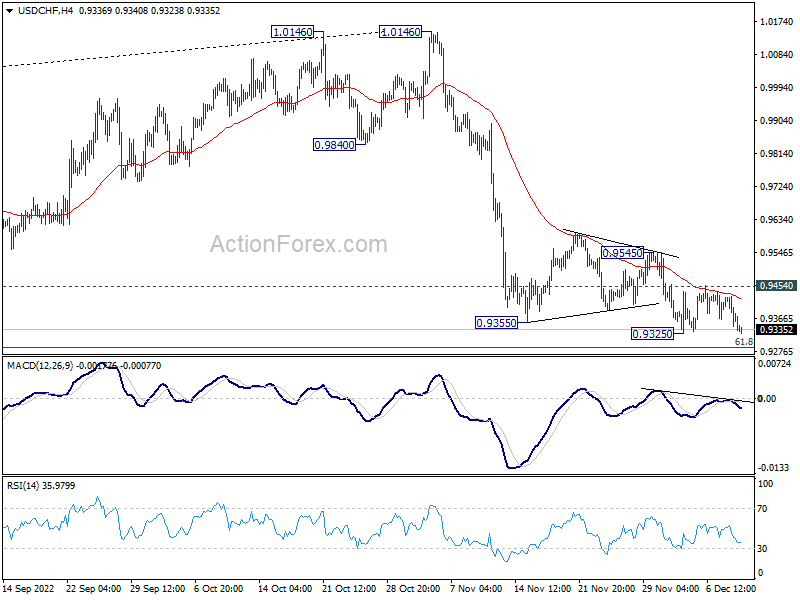
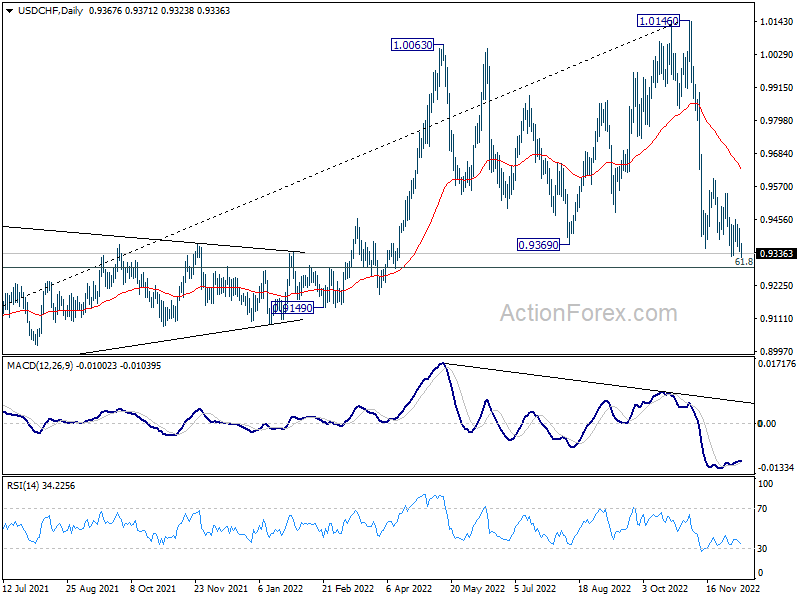
In the bigger picture, rise from 0.8756 (2021 low) has completed at 1.0146, well ahead of 1.0342 long term resistance (2016 high). Based on current downside momentum, fall from 1.0146 might be a medium term down trend itself. Break of 61.8% retracement of 0.8756 to 1.0146 at 0.9287 will pave the way to 0.8756. In any case, risk will stay on the downside as long as 55 day EMA (now at 0.9630) holds.
GBP/USD Daily Outlook
Daily Pivots: (S1) 1.2178; (P) 1.2213; (R1) 1.2271; More...
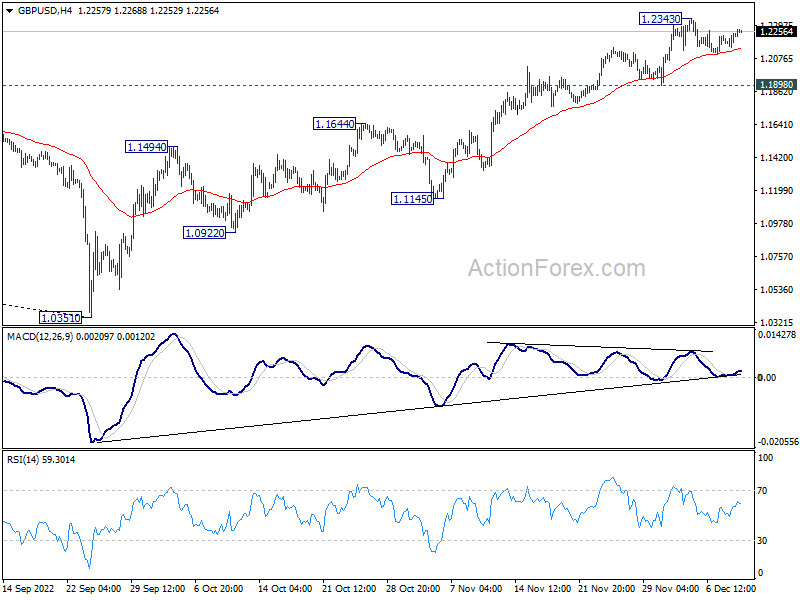
GBP/USD is still bounded in range trading below 1.2343 and intraday bias remains neutral at this point. Further rise remains mildly in favor as long as 1.1898 support holds. On the upside, break of 1.2343 will resume the rally from 1.0351 and target 1.2759 medium term fibonacci level next. However, firm break of 1.1898 support will confirm short term topping and turn bias back to the downside.
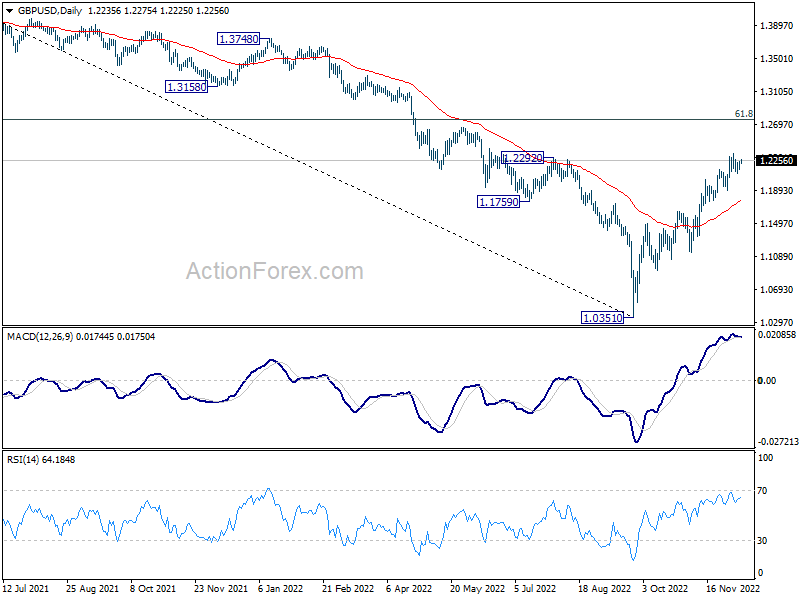
In the bigger picture, rise from 1.0351 medium term bottom is at least correcting whole down trend from 1.4248 (2021 high). Further rise is expected as long as 1.1644 resistance turned support holds. Next target is 61.8% retracement of 1.4248 to 1.0351 at 1.2759. Sustained break there will pave the way back to 1.4248.
EUR/USD Daily Outlook
Daily Pivots: (S1) 1.0508; (P) 1.0537; (R1) 1.0583; More...
With current rebound, focus is back on 1.0594/0609 resistance zone (1.0609 medium term fibonacci level) in EUR/USD. Firm break there will carry larger bullish implication. Next near term target is 61.8% projection of 0.9729 to 1.0481 from 1.0222 at 1.0687, and then 100% projection at 1.0974. Nevertheless, on the downside, break of 1.0442 support should confirm short term topping and turn bias back to the downside for 1.0222 support.
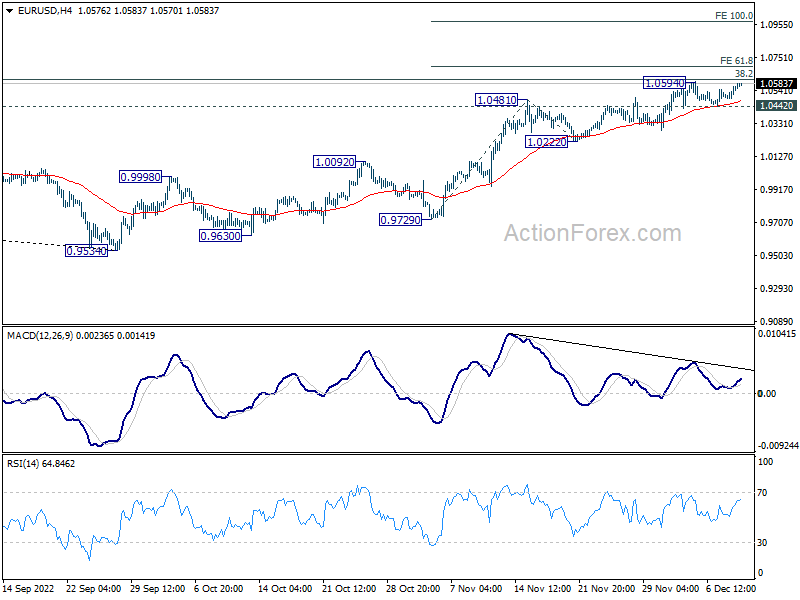
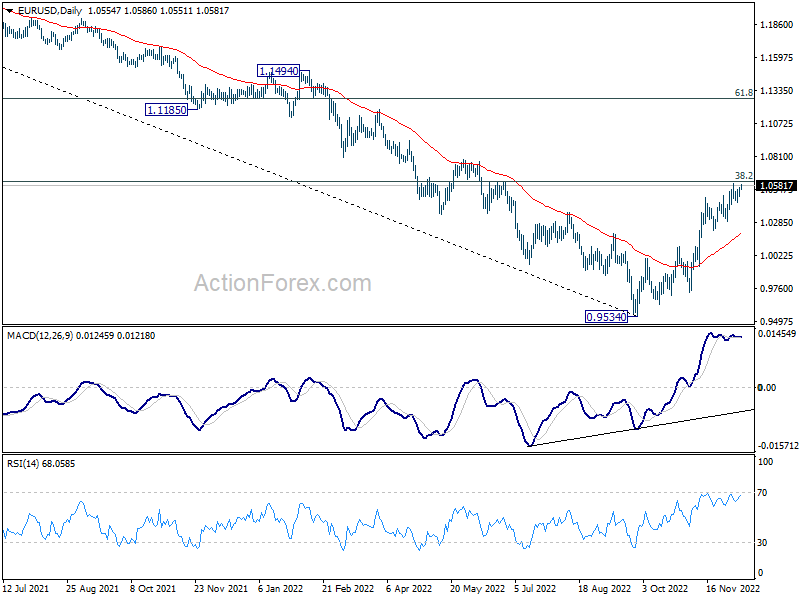
In the bigger picture, a medium term bottom was in place at 0.9534, on bullish convergence condition in daily MACD. Even as a corrective rise, rally from 0.9534 should target 38.2% retracement of 1.2348 (2021 high) to 0.9534 at 1.0609. Sustained trading above 55 week EMA (now at 1.0557) will raise the chance of trend reversal and target 61.8% retracement at 1.1273. However, rejection by 1.0609 will retain medium term bearishness for down trend resumption at a later stage.
Dollar Extending Decline, Ready for Downside Breakout?
Dollar is again under some selling pressure in Asian session and looks set to resume recent decline against European majors. Yet, with trading subdued, it's doubtful whether selloff in the greenback would sustain. Traders would more likely hold off large bets until next week's FOMC rate decision and economic projections. As for the week, Yen is currently the worst performer, followed by Canadian and Sterling. Euro and Swiss Franc are the strongest ones, followed by Dollar. Aussie and Kiwi are mixed.
Technically, USD/CHF is on the verge of breaking 0.9325 temporary low. But the key would lie in 0.9287 medium term fibonacci support (61.8% retracement of 0.8756 to 1.0146). Strong support could be seen there to bring sustainable rebound. And break of 0.9454 resistance should now confirms short term bottoming. EUR/USD's reaction to 38.2% retracement of 1.2348 (2021 high) to 0.9534 at 1.0609 should be watched simultaneously to gauge the Dollar's downside momentum.
In Asia, at the time of writing, Nikkei is up 1.26%. Hong Kong HSI is up 1.64%. China Shanghai SSE is up 0.08%. Singapore Strait Times is up 0.19%. Japan 10-year JGB yield is down -0.0018 at 0.255. Overnight, DOW rose 0.55%. S&P 500 rose 0.75%. NASDAQ rose 1.13%. 10-year yield rose 0.083 to 3.491, after falling to 3.448.
BoC Kozicki: We will be considering whether to increase rates further
BoC Governor Deputy Governor Sharon Kozicki said in speech yesterday, "going forward, we will be considering whether to increase rates further".
"By that, we mean that we expect our decisions will be more data-dependent," she said. "If we are surprised on the upside, we are still prepared to be forceful. But we recognize that we have raised interest rates rapidly and that their effects are working their way through the economy."
"In other words, we are moving from how much to raise interest rates to whether to raise interest rates," she added.
China CPI slowed to 1.6% yoy in Nov, core CPI down -0.6% yoy
China CPI slowed from 2.1% yoy to 1.6% yoy in November, below expectation of 1.7% yoy. Core CPI, excluding food and energy, was down -0.6% yoy, unchanged from October. Food prices slowed from 7.0% yoy to 3.7% yoy. Non-food prices were unchanged at 1.1% yoy.
"In November, due to the domestic epidemic, seasonal factors, and a higher base of comparison in the same period last year, CPI turned from rising to falling month on month and fell back year on year," said chief NBS statistician Dong Lijuan.
PPI was unchanged at -1.3% yoy, above expectation of -1.5% yoy. "In November, PPI rose slightly month on month as a result of price increases in coal, oil and non-ferrous metals, and continued to fall year on year due to a high base of comparison from the same period last year," added Dong.
Looking ahead
Canada will release capacity utilization. US will release PPI but a bigger focus would be on U of Michigan consumer sentiment.
EUR/USD Daily Outlook
Daily Pivots: (S1) 1.0508; (P) 1.0537; (R1) 1.0583; More...
With current rebound, focus is back on 1.0594/0609 resistance zone (1.0609 medium term fibonacci level) in EUR/USD. Firm break there will carry larger bullish implication. Next near term target is 61.8% projection of 0.9729 to 1.0481 from 1.0222 at 1.0687, and then 100% projection at 1.0974. Nevertheless, on the downside, break of 1.0442 support should confirm short term topping and turn bias back to the downside for 1.0222 support.
In the bigger picture, a medium term bottom was in place at 0.9534, on bullish convergence condition in daily MACD. Even as a corrective rise, rally from 0.9534 should target 38.2% retracement of 1.2348 (2021 high) to 0.9534 at 1.0609. Sustained trading above 55 week EMA (now at 1.0557) will raise the chance of trend reversal and target 61.8% retracement at 1.1273. However, rejection by 1.0609 will retain medium term bearishness for down trend resumption at a later stage.
Economic Indicators Update
| GMT | Ccy | Events | Actual | Forecast | Previous | Revised |
|---|---|---|---|---|---|---|
| 23:50 | JPY | Money Supply M2+CD Y/Y Nov | 3.10% | 3.00% | 3.10% | |
| 01:30 | CNY | CPI Y/Y Nov | 1.60% | 1.70% | 2.10% | |
| 01:30 | CNY | PPI Y/Y Nov | -1.30% | -1.50% | -1.30% | |
| 13:30 | CAD | Capacity Utilization Q3 | 83.00% | 83.80% | ||
| 13:30 | USD | PPI M/M Nov | 0.10% | 0.20% | ||
| 13:30 | USD | PPI Y/Y Nov | 7.40% | 8.00% | ||
| 13:30 | USD | PPI Core M/M Nov | 0.30% | 0.00% | ||
| 13:30 | USD | PPI Core Y/Y Nov | 6.00% | 6.70% | ||
| 15:00 | USD | Michigan Consumer Sentiment Index Dec P | 53.3 | 56.8 | ||
| 15:00 | USD | Wholesale Inventories Oct F | 0.80% | 0.80% |
Technical Outlook and Review
USD/JPY:
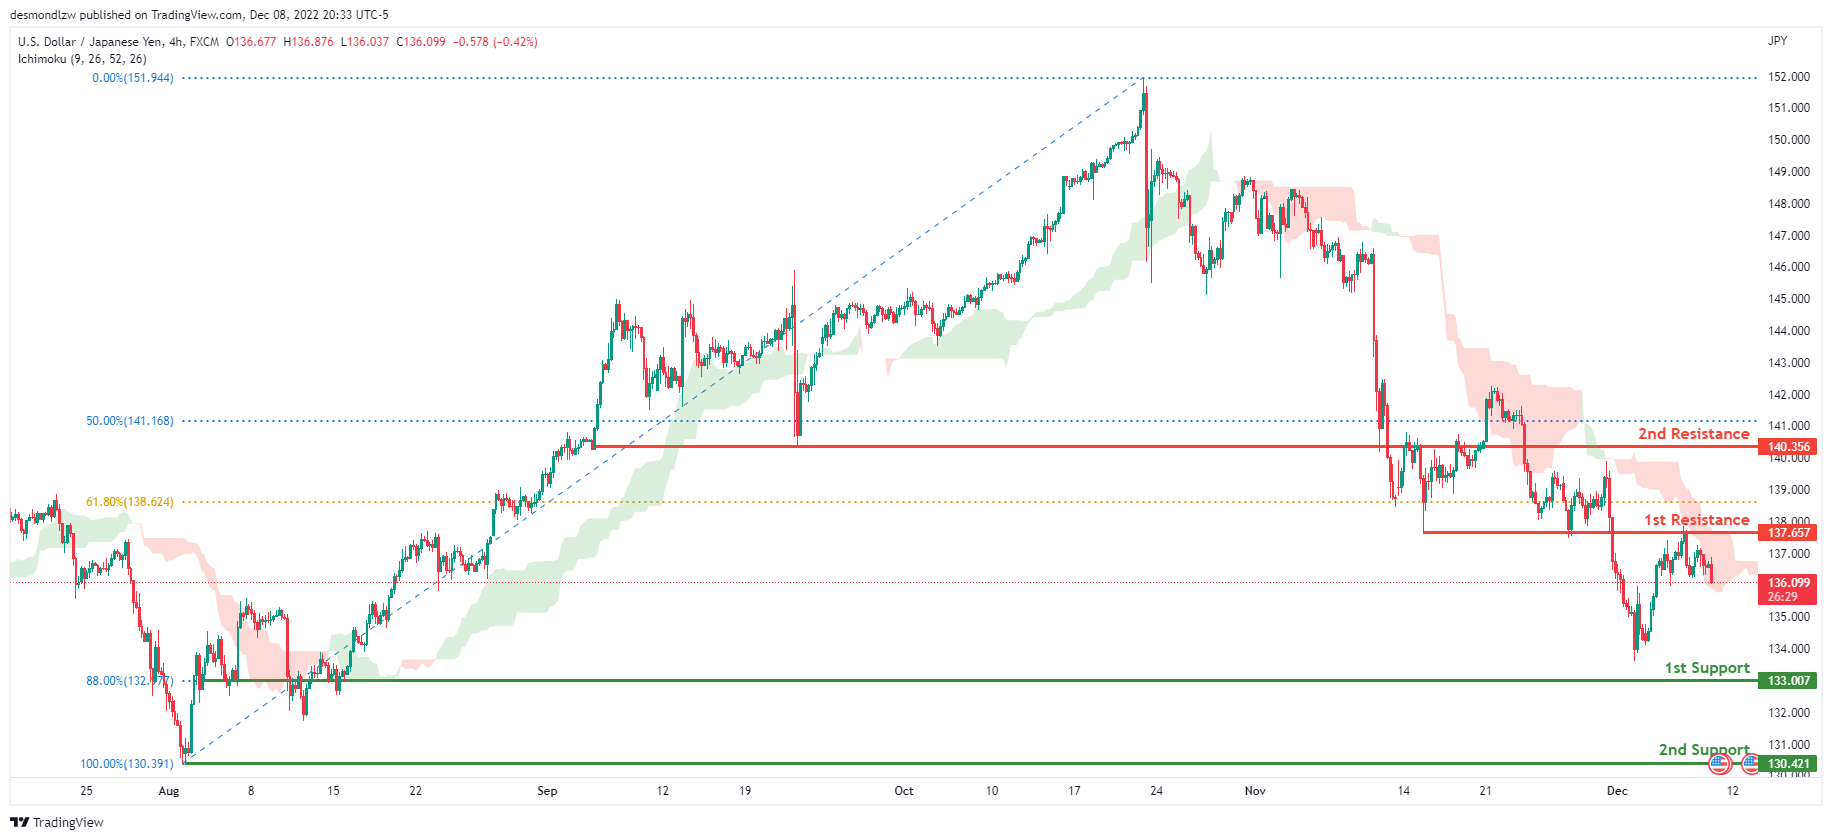
The current general bias for USDJPY on the H4 chart is bearish. To add confluence to this, the price is under the Ichimoku cloud which indicates a bearish market. If the bearish momentum continues, expect USDJPY to continue heading towards the 1st support at 133.007 where the 88% Fibonacci line is. In an alternative scenario, price could head back up to retest the 1st resistance line at 137.657, where the 61.8% Fibonacci line and previous low are located.
Areas of consideration:
- H4 time frame, 1st resistance at 137.657
- H4 time frame, 1st support at 133.007
DXY:
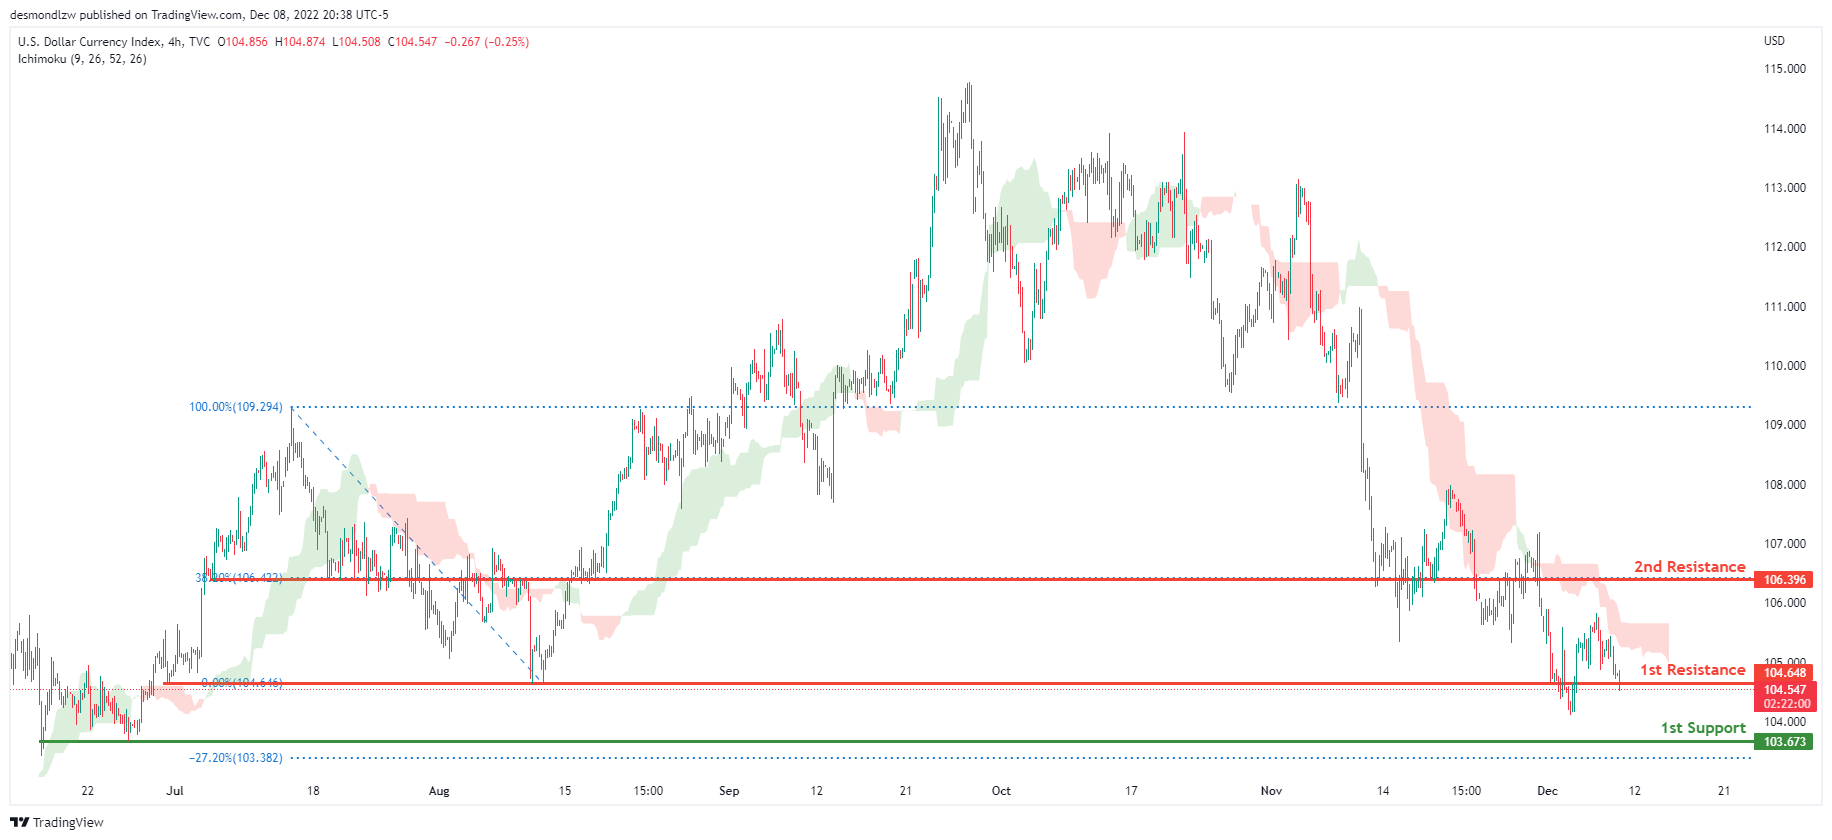
On the H4 chart, the overall bias for DXY is bearish. To add confluence to this, the price is below the Ichimoku cloud which indicates a bearish market. If this bearish momentum continues, expect the price to continue heading towards the 1st support line at 103.673, where the -27.2% Fibonacci expansion line and previous swing low is. In an alternative scenario, price could head back up and retest the 1st resistance line resistance at 104.648, where the previous swing low is.
Areas of consideration:
- H4 time frame, 1st resistance at 104.648
- H4 time frame, 1st support at 103.673
EUR/USD:
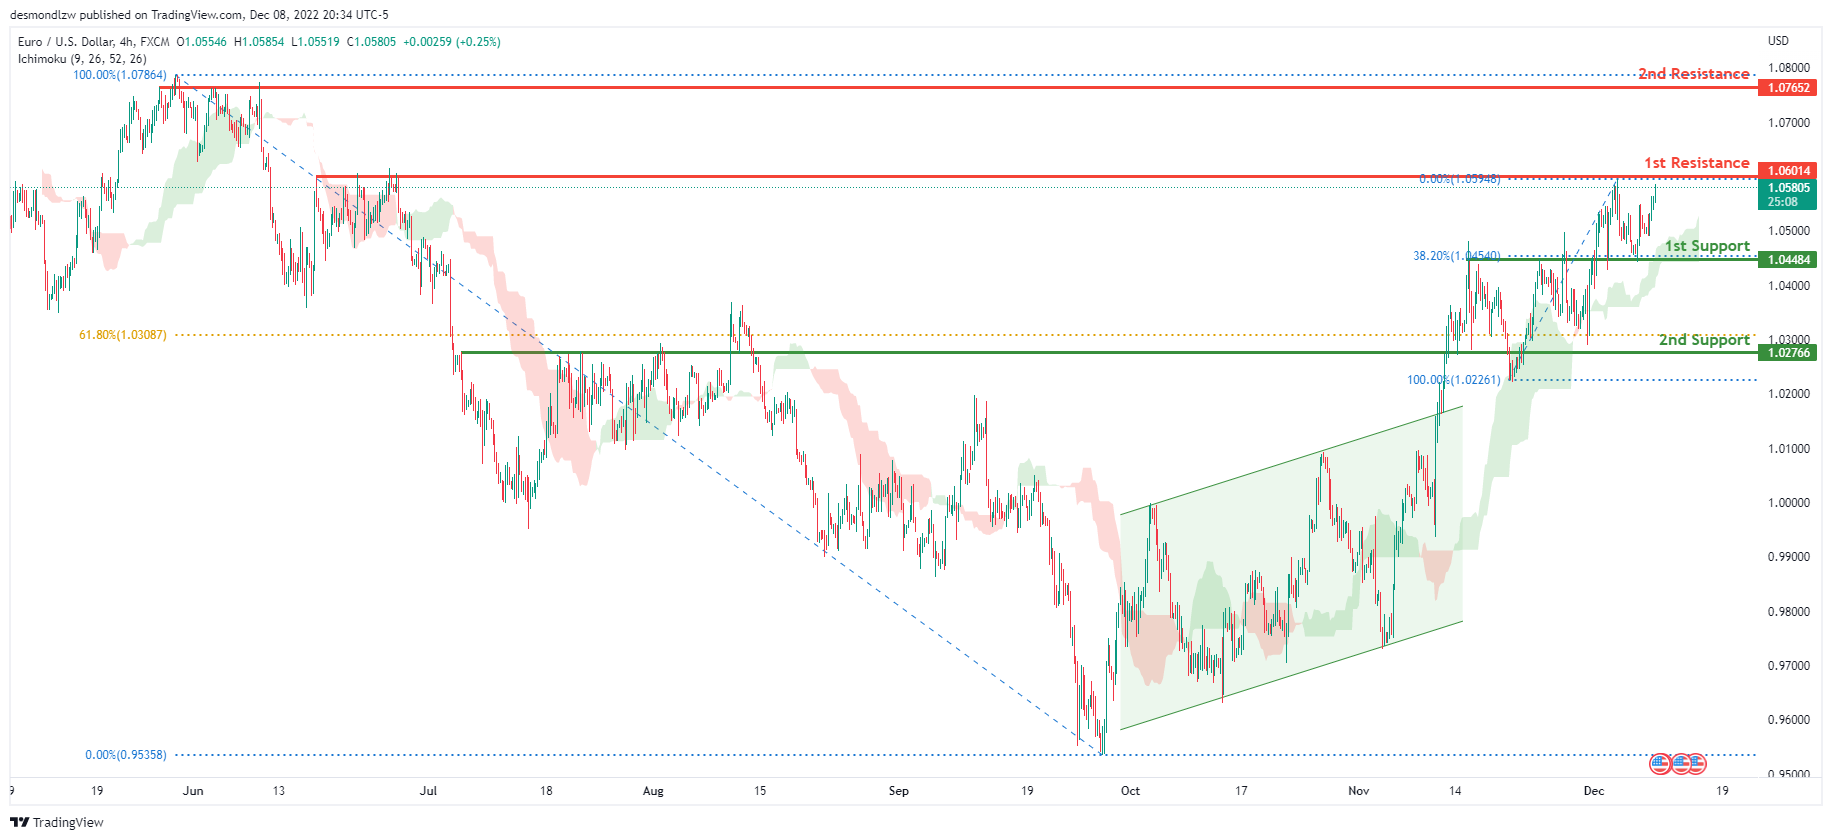
Looking at the H4 chart, my overall bias for EURUSD is bullish due to the current price being above the Ichimoku cloud, indicating a bullish market. To add confluence to this bias, price has also broken above the ascending bullish channel. If this bullish momentum continues, expect the price to possibly head towards the 1st resistance at 1.06014, where the previous swing high and 78.6% Fibonacci line are located., before heading towards the 2nd resistance at 1.07652, where the previous swing high is. In an alternate scenario, price could possibly head back down to break the 1st support level at 1.04484, where the previous high and 38.2% Fibonacci line are located before heading towards the 2nd support at 1.02766 where the 61.8% Fibonacci line is.
Areas of consideration :
- H4 1st resistance at 1.06014
- H4 1st support at 1.04484
- H4 2nd support at 1.02766
GBP/USD:
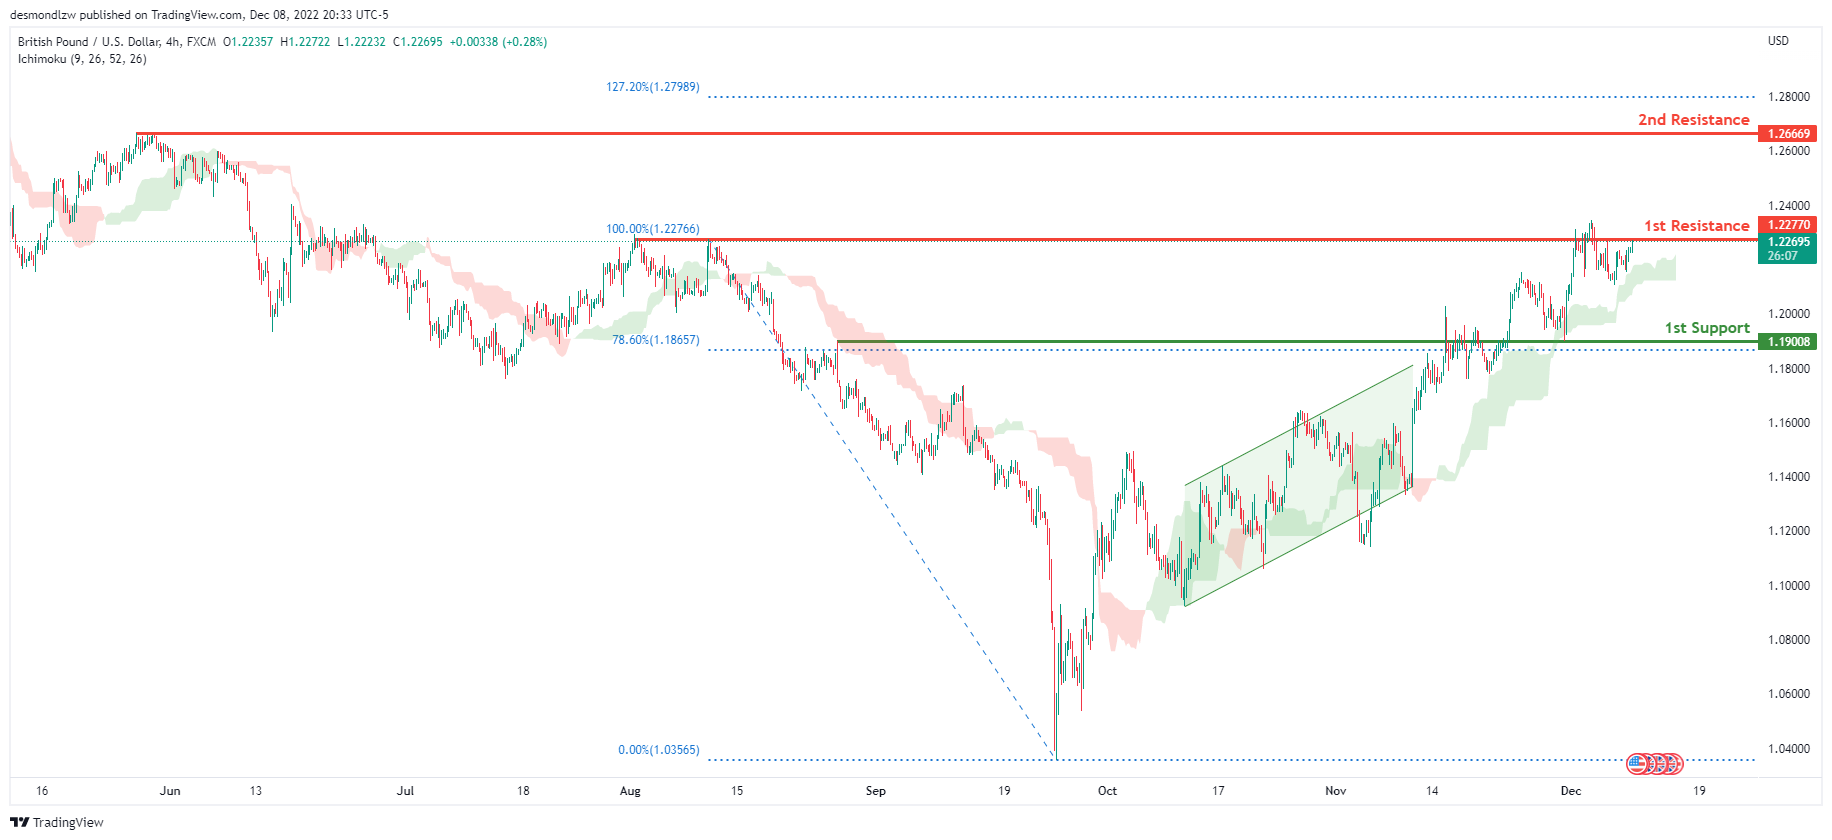
Looking at the H4 chart, my overall bias for GBPUSD is bullish due to the current price being above the Ichimoku cloud, indicating a bullish market. Expecting price to head back up to possibly break the 1st resistance line at 1.22770, where the previous high is, before heading towards the 2nd resistance at 1.26669, where the previous swing high is. In an alternative scenario, price could possibly head back down towards the 1st support at 1.19008, where the 78.6% Fibonacci line is.
Areas of consideration:
- H4 1st resistance at 1.22770
- H4 2nd resistance at 1.26669
- H4 1st support at 1.19008
USD/CHF:
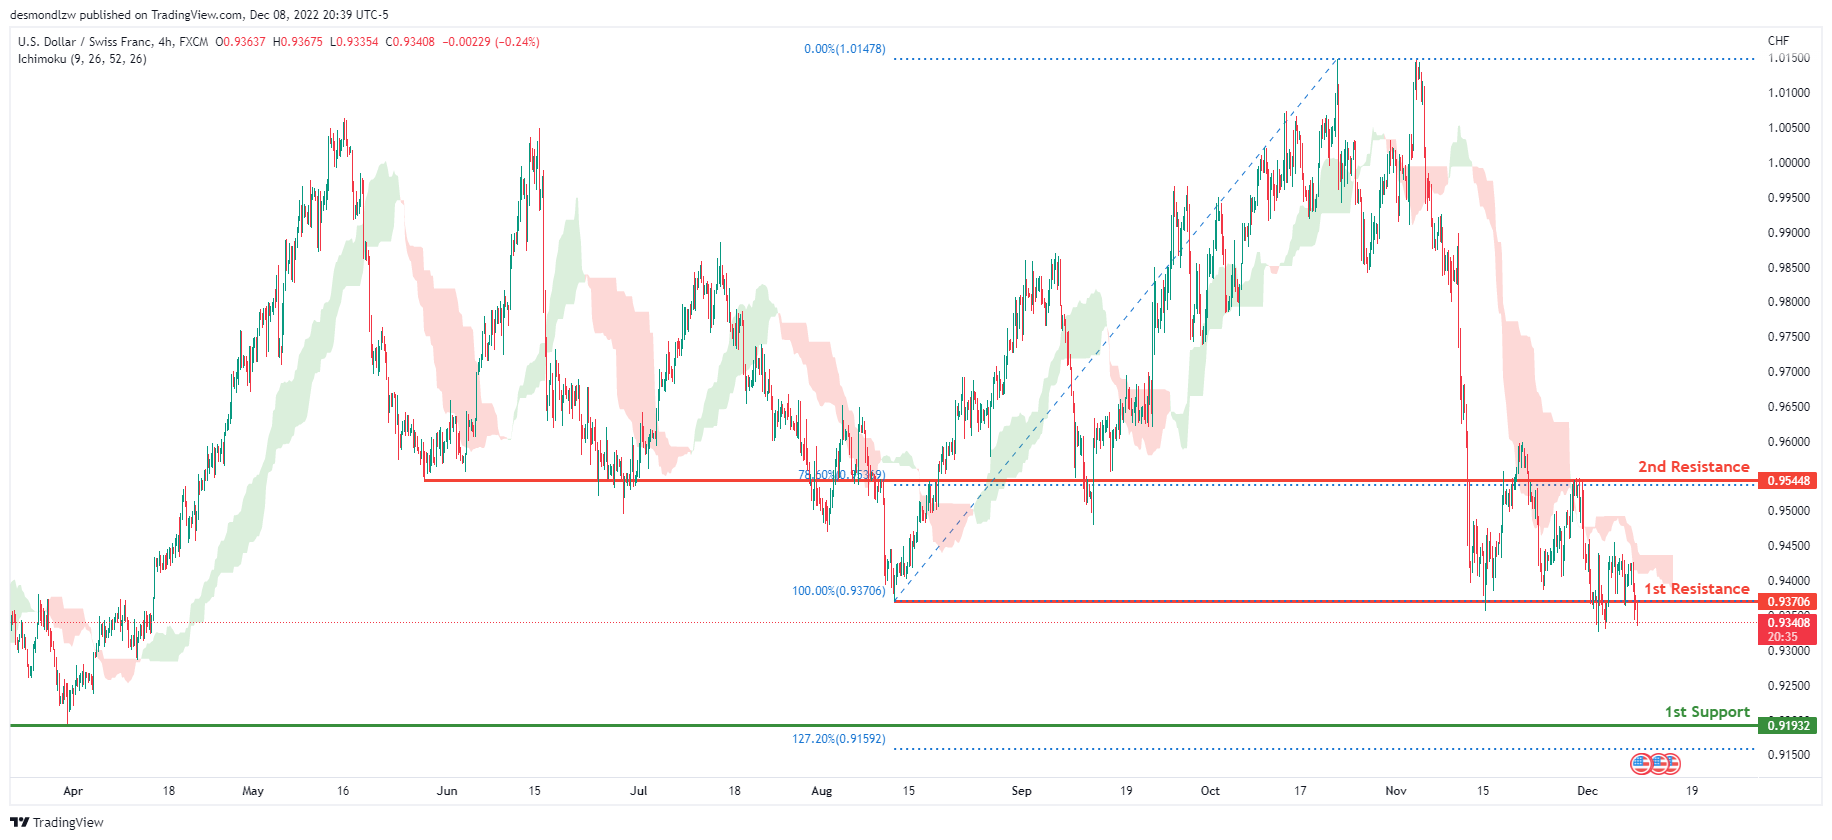
The overall bias for USDCHF on the H4 chart is bearish. In addition, the price is below the Ichimoku cloud, indicating a bearish market. If the current bearish trend continues, expect the price to head back down towards the 1st support line at 0.91932, where the previous swing low and 12.72% Fibonacci extension line is . In an alternative scenario, price could possibly head up towards the 1st resistance at 0.93706, where the previous swing low is .
Areas of consideration
- H4 1st support at 0.91932
- H4 1st resistance at 0.93706
XAU/USD (GOLD):
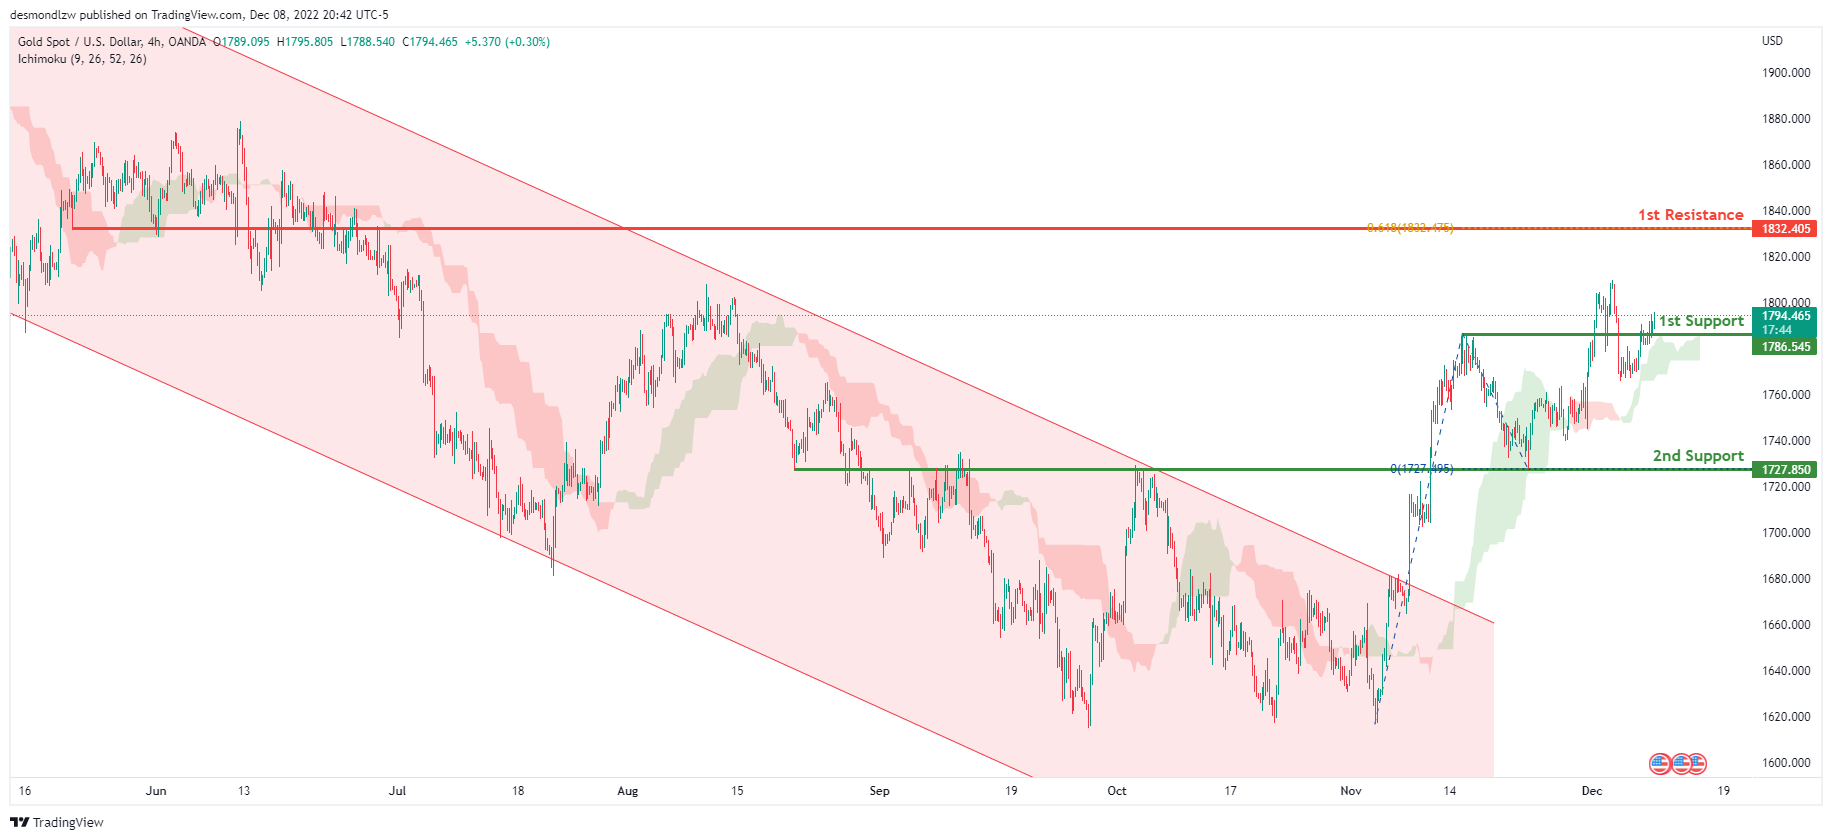
Looking at the H4 chart, my overall bias for XAUUSD is bullish due to the current price crossing above the Ichimoku cloud, indicating a bullish market. If this bullish momentum continues, expect the price to possibly head towards the 1st resistance at 1832.405, where the 61.8% Fibonacci projection line is. In an alternate scenario, price could possibly head back down towards the 1st support level at 1786.545, where the previous swing high is located
Areas of consideration:
- H4 time frame, 1st resistance at 1832.405
- H4 time frame, 1st support at 1786.545
AUD/USD:
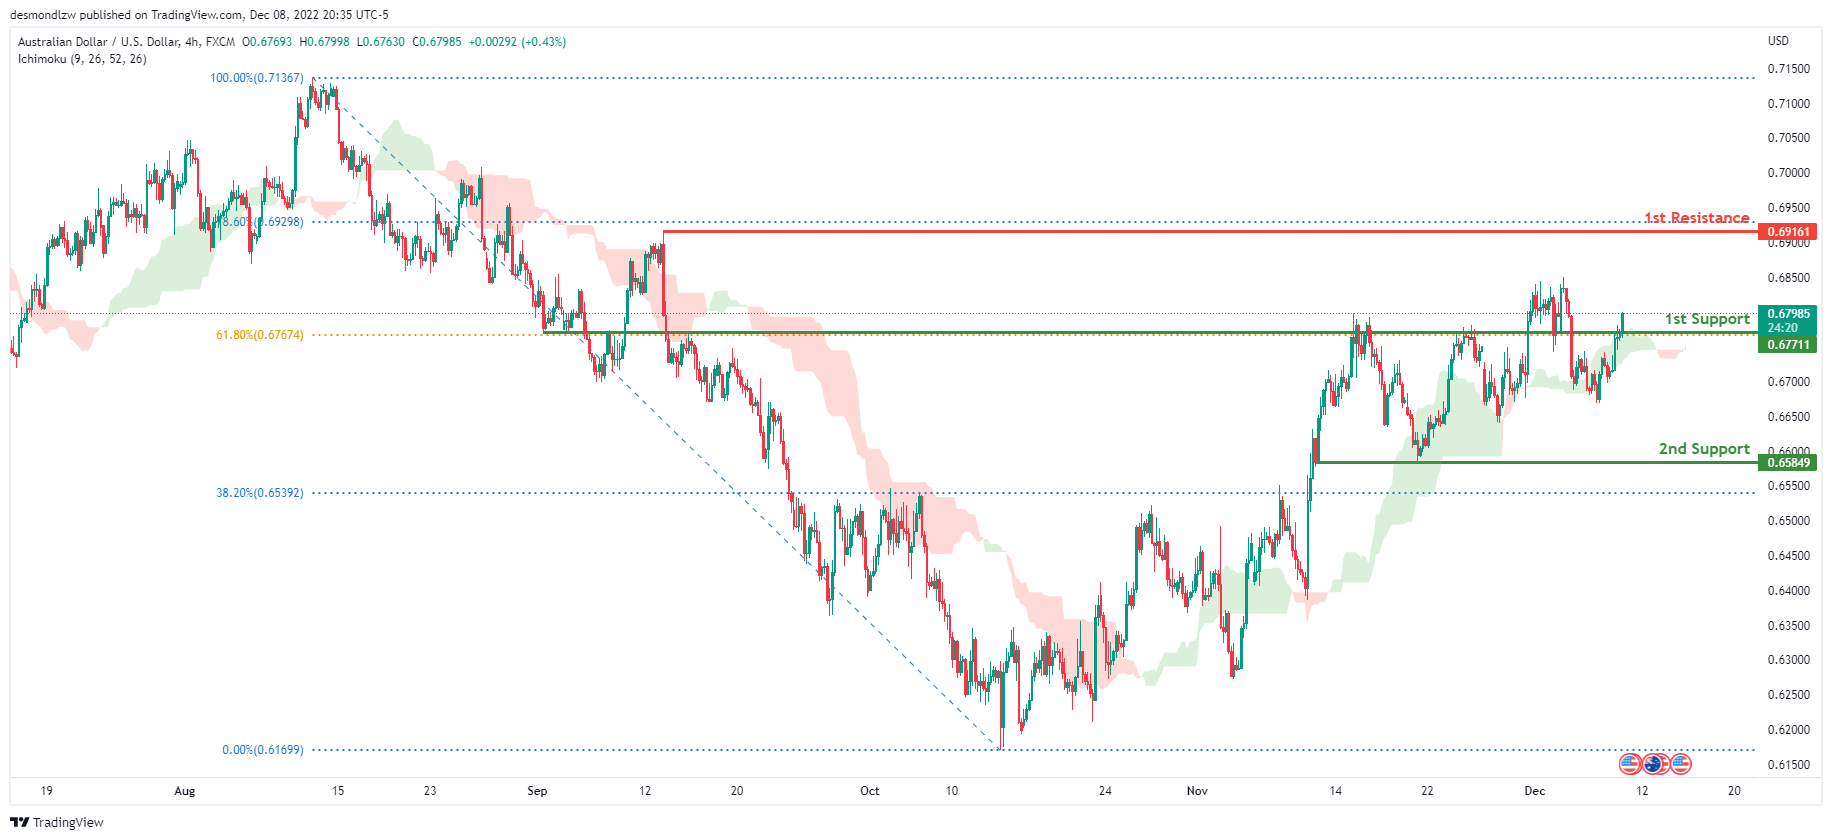
Looking at the H4 chart, my overall bias for AUDUSD is bullish due to the current price being above the Ichimoku cloud, indicating a bullish market.
If this bullish momentum continues, expect the price to head towards the 1st resistance at 0.69161, where the 78.6% Fibonacci line and previous swing high is. In an alternative scenario, price could possibly head back down to retest the 1st support line at 0.67711, where the 61.8% Fibonacci line is.
Areas of consideration
- H4, 1st resistance at 0.69161
- H4, 1st support at 0.67711
NZD/USD:
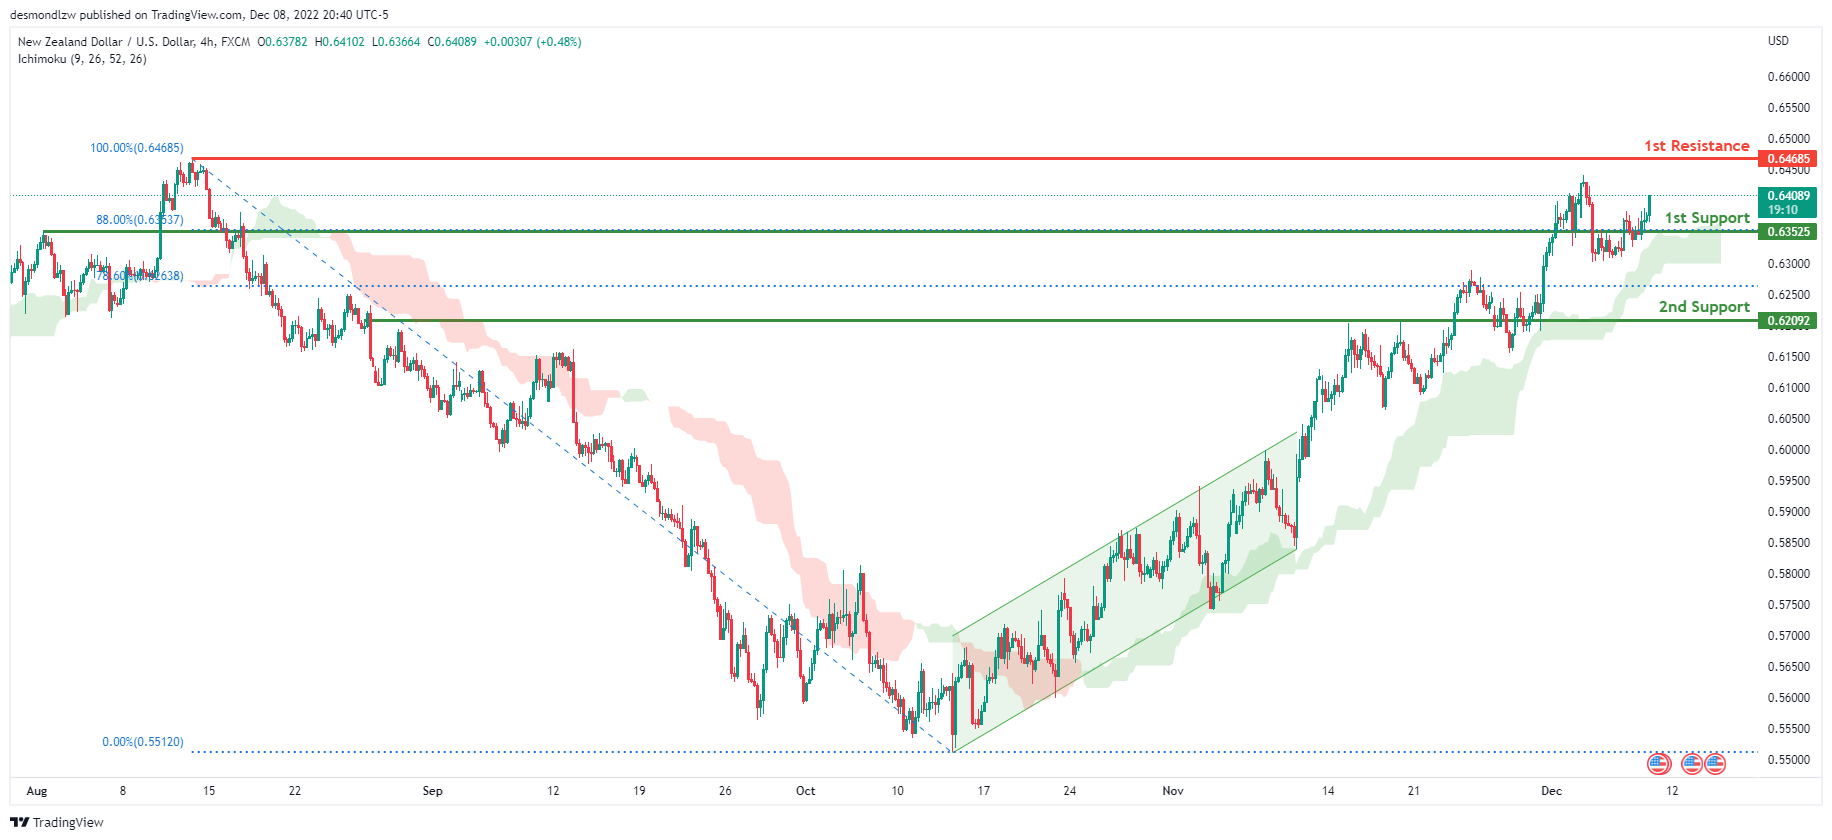
Looking at the H4 chart, my overall bias for NZDUSD is bullish due to the current price being above the Ichimoku cloud, indicating a bullish market.
To add confluence to this bias, price has broken out of the ascending channel. If this bullish momentum continues, expect the price to head up to the 1st resistance line at 0.64685, where the previous swing high is. Alternatively, the price may head back down towards the 1st support aat 0.63525, where the 88% Fibonacci line is.
Areas of consideration:
- H4 time frame, 1st resistance at 0.64685
- H4 time frame, 1st support at 0.63525
USD/CAD:
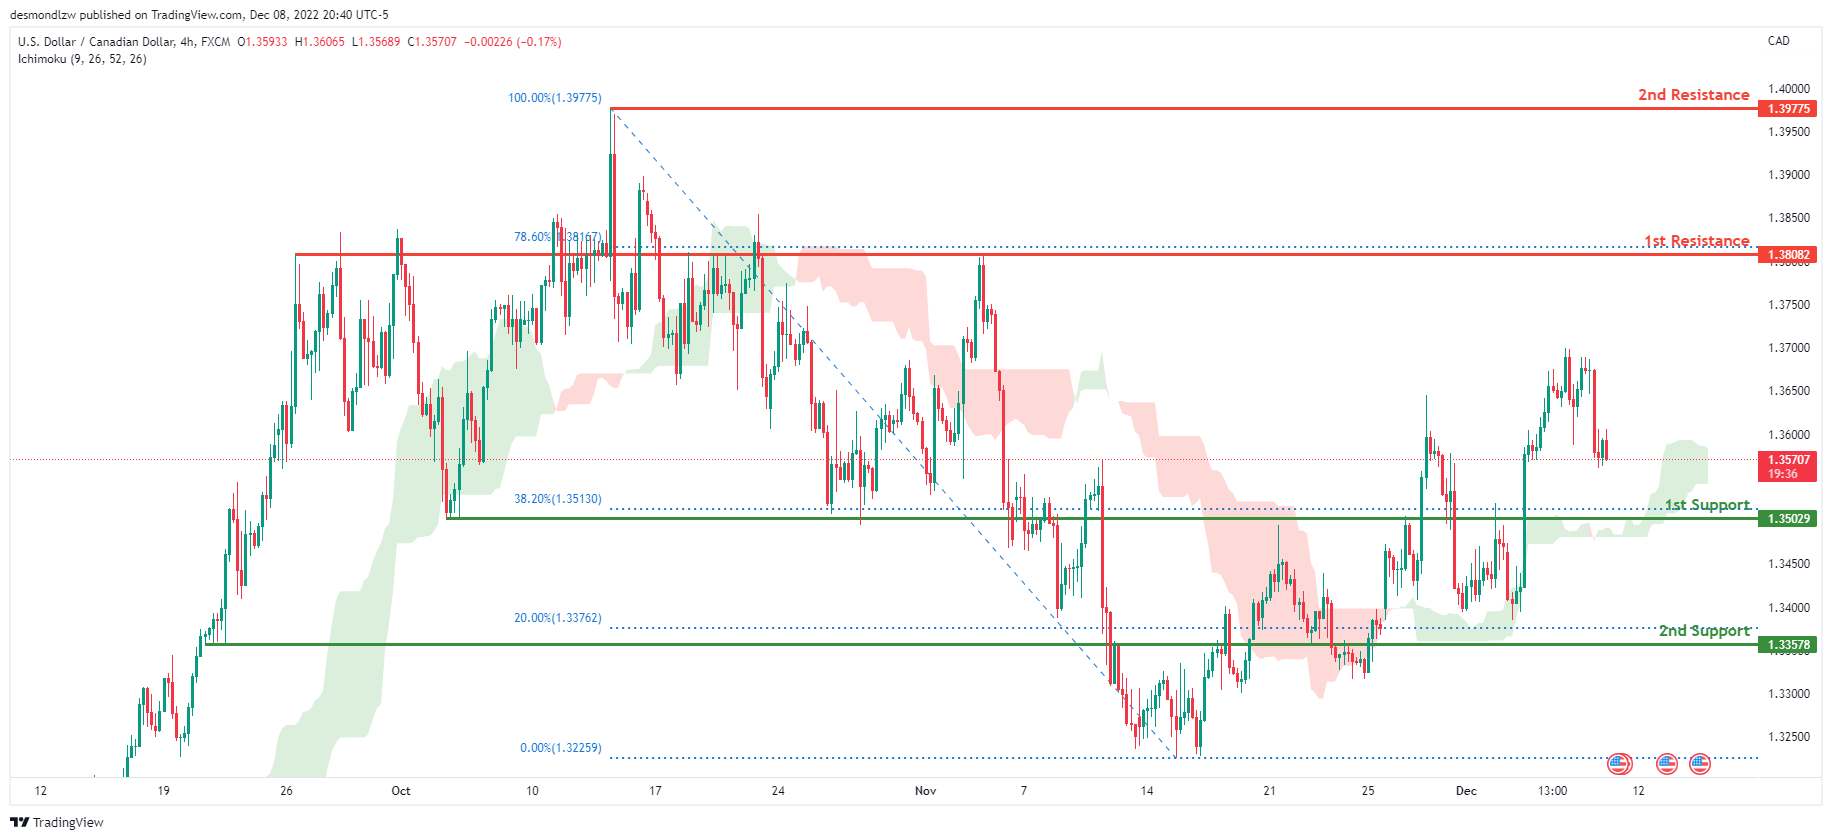
On the H4 chart, the overall bias for USDCAD is bullish. To add confluence to this, the price is above the Ichimoku cloud which indicates a bullish market. If this bullish momentum continues, expect the price to head towards 1st resistance line at 1.38082, where the 78.6% Fibonacci line is. In an alternative scenario, price could head back down to retest the 1st support at 1.35029, where the 38.2% Fibonacci line is.
Areas of consideration:
- H4 time frame, 1st resistance at 1.38082
- H4 time frame, 2nd resistance at 1.39775
- H4 time frame, 1st support at 1.35029
OIL:
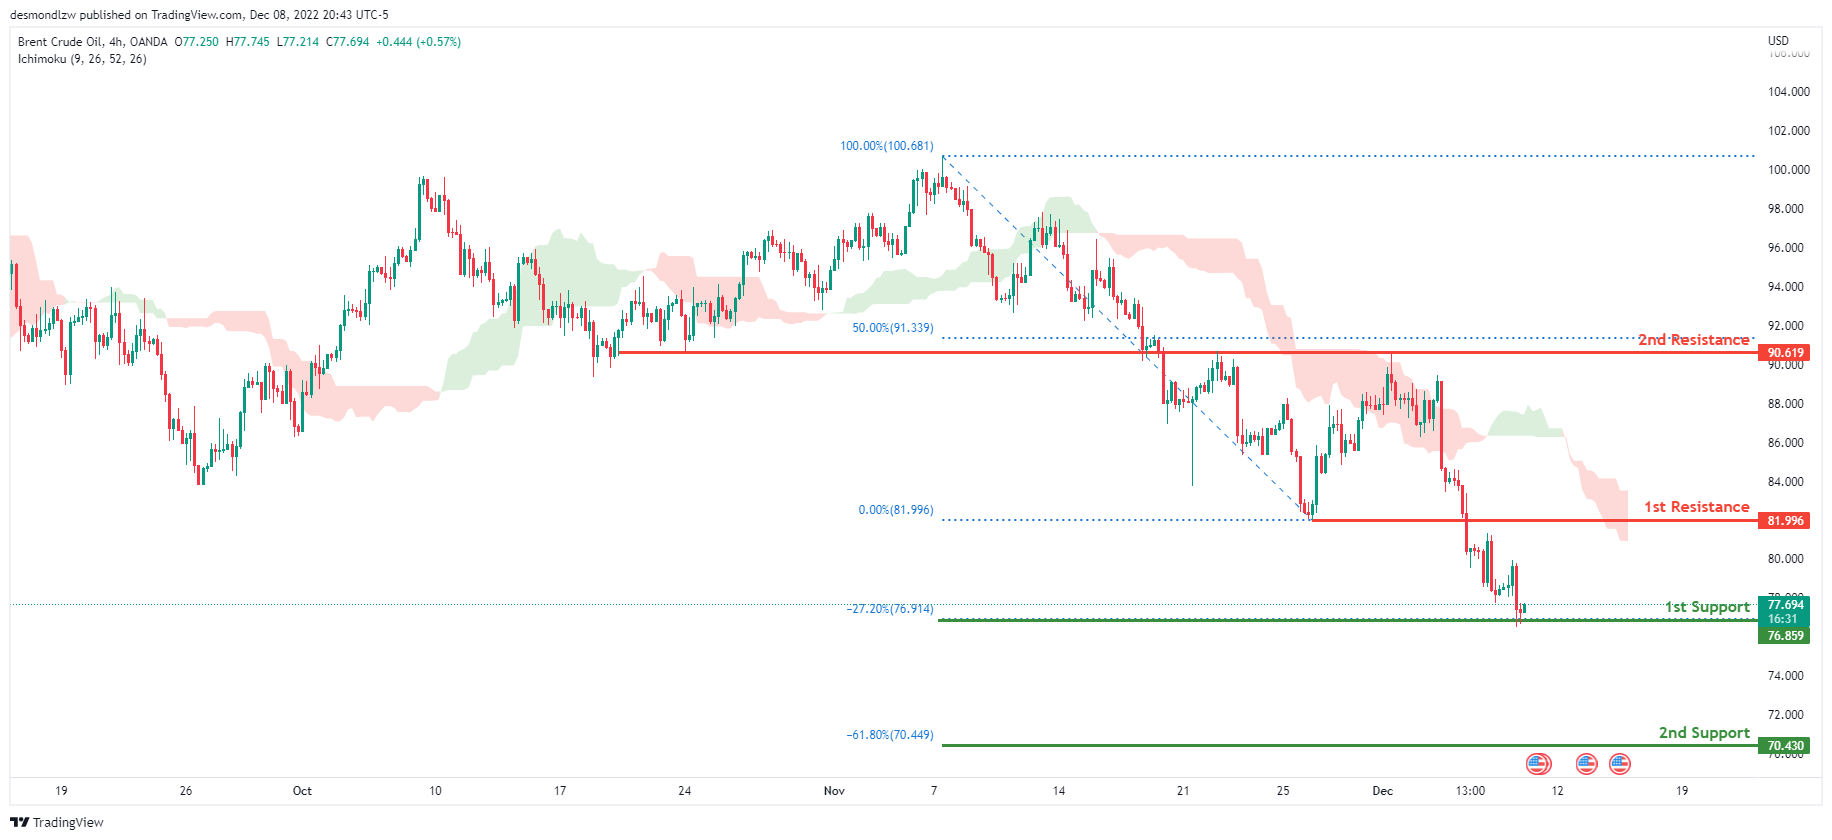
Looking at the H4 chart, my overall bias for BCOUSD is bearish due to the current price being below the Ichimoku cloud, indicating a bearish market. If this bearish momentum continues, expect price to possibly break the 1st support line at 76.859, where the -27.2% Fibonacci expansion line is, before heading towards the 2nd support at 70.430, where the -27.2% Fibonacci expansion line is. In an alternate scenario, price could possibly head back up to retest the 1st resistance line at 81.996, where the previous low is located.
Areas of consideration:
- H4 time frame, 1st resistance at 81.996
- H4 time frame, 1st support at 76.859
- H4 time frame, 2nd support at 70.430
Dow Jones Industrial Average:
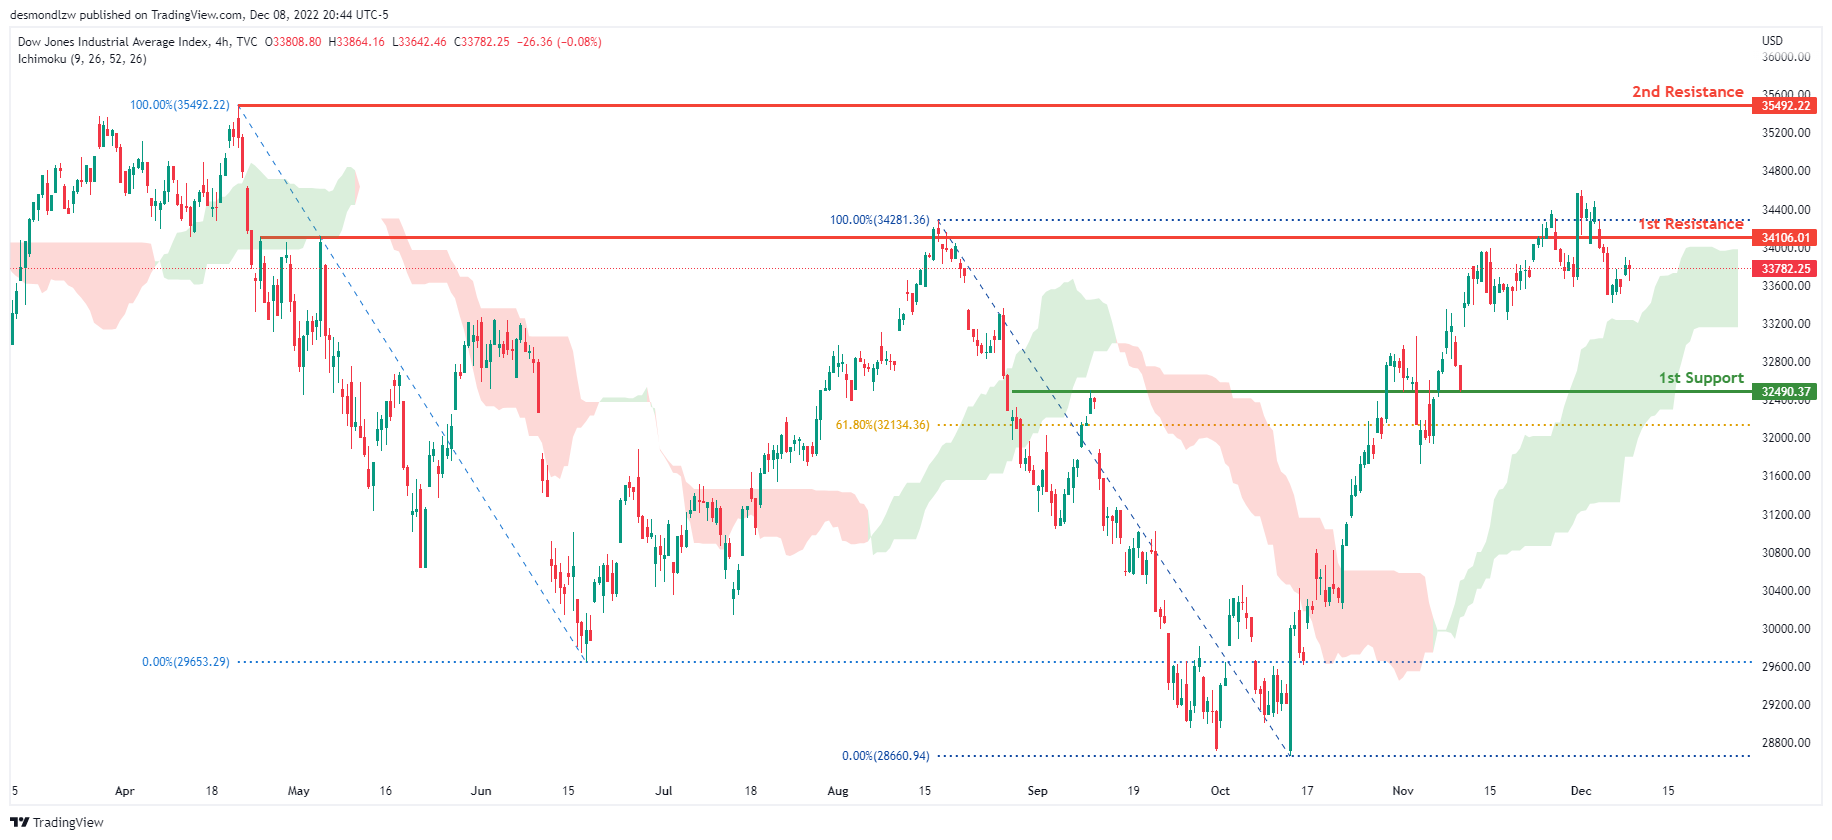
On the H4 chart, the overall bias for DJI is bullish. To add confluence to this, the price is above the Ichimoku cloud which indicates a bullish market. If this bullish momentum continues, expect the price to continue heading towards the 1st resistance line at 34106.01, where the previous swing high is. In an alternative scenario, price could head back down towards the 1st support at 32490.37, where the 61.8% Fibonacci line is.
Areas of consideration:
- H4 time frame, 1st support at 32490.37
- H4 time frame, 1st Resistance at 34106.01
DAX:
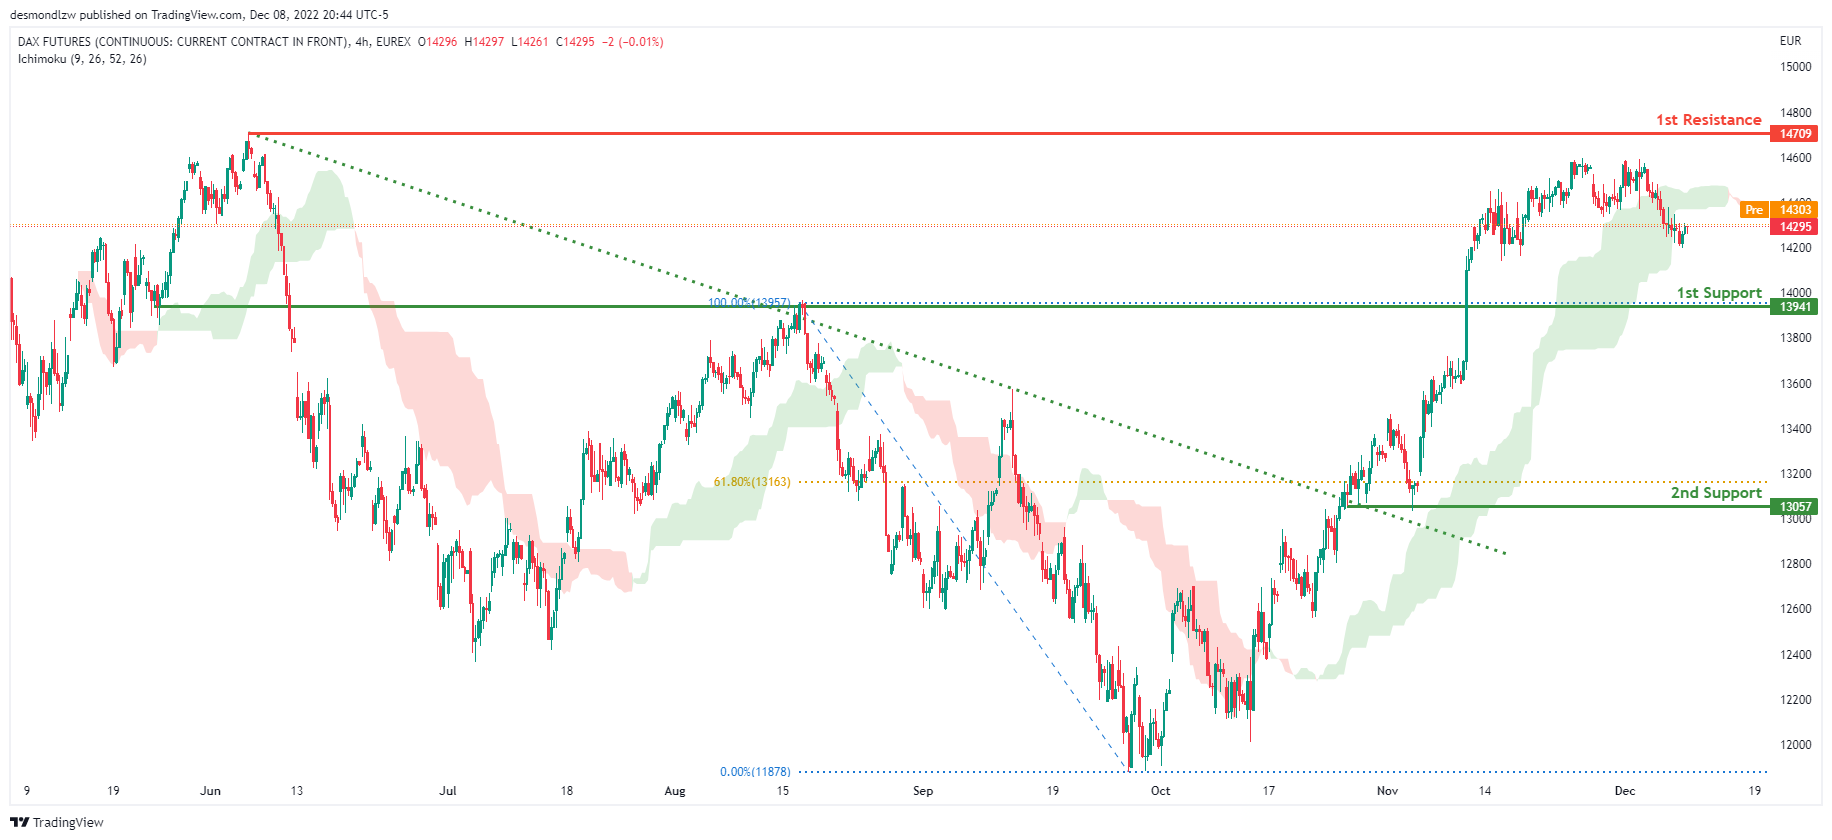
The H4 chart shows a bullish bias, with price breaking through the descending trendline and rising above the Ichimoku cloud. Price is expected to maintain its bullish momentum and rise to the first resistance level at 14709, where the previous swing high is located. Alternatively, the price could fall to the first support level at 13941, where the previous swing high was.
Areas of consideration:
- H4 time frame, 1st resistance is at 14709
- H4 time frame, 1st support is at 13941
ETHUSD:
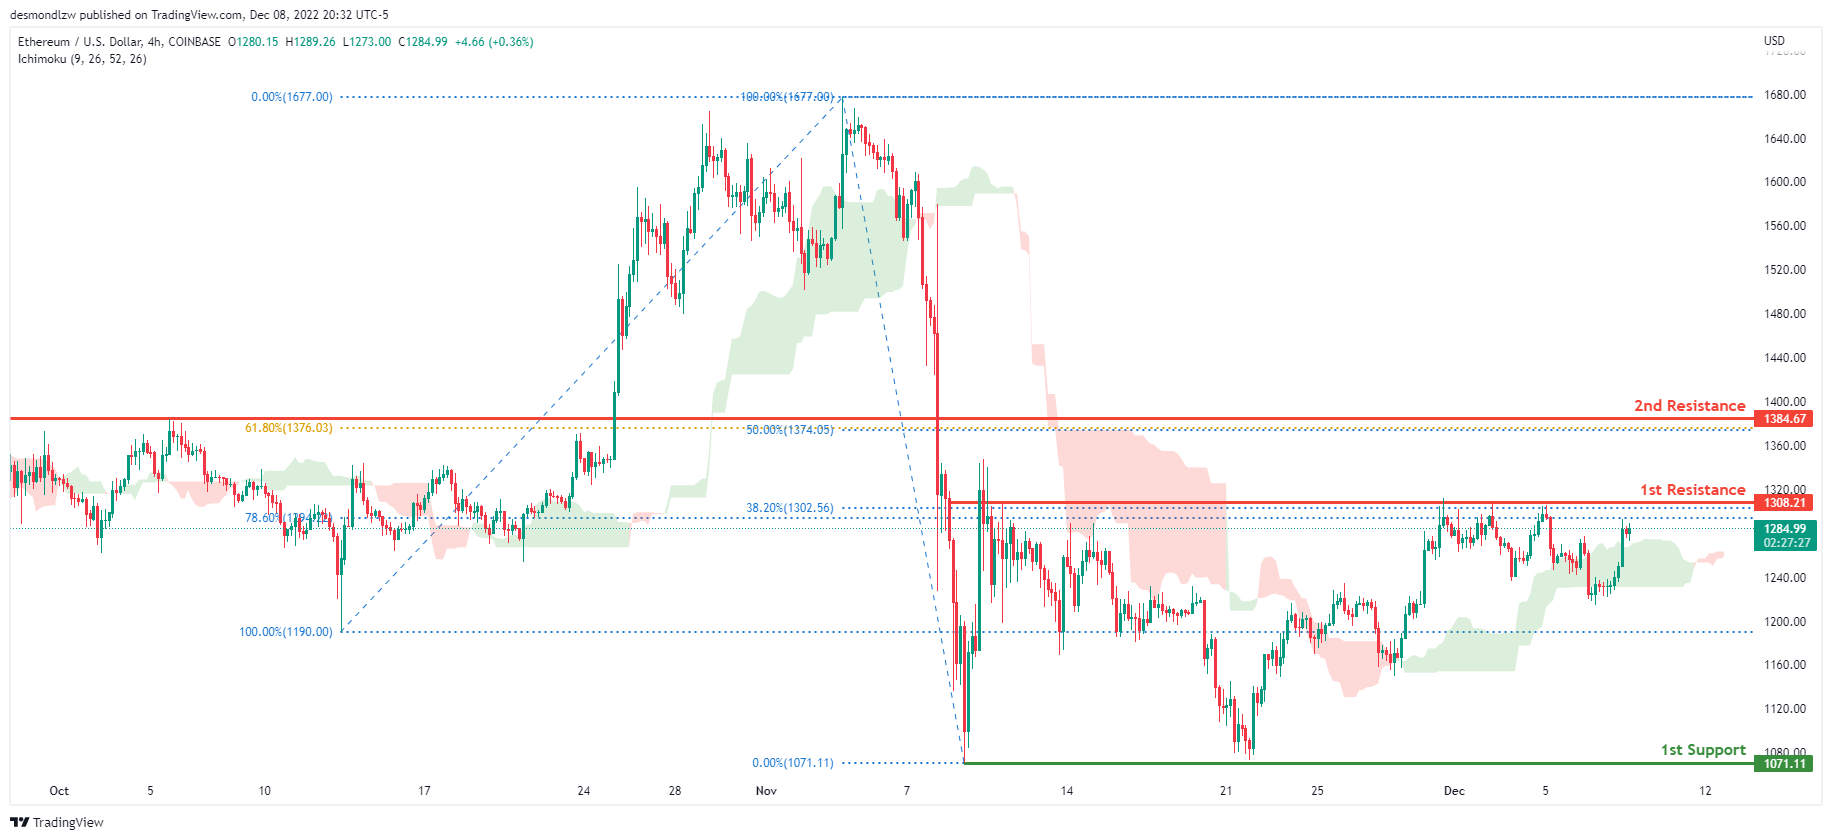
Looking at the H4 chart, my overall bias for ETHUSD is bullish due to the current price being above the Ichimoku cloud, indicating a bullish market. Expecting price to possibly break the 1st resistance at 1308.21, where the 38.2% and 78.6% Fibonacci lines are before heading towards the 2nd resistance line at 1384.67, where the 50% and 61.8% Fibonacci lines are. In an alternative scenario, price could head back down towards the 1st support at 1071.11, where the previous swing low is.
Areas of consideration:
- H4 time frame, 1st resistance of 1308.21
- H4 time frame, 2nd resistance of 1384.67
- H4 time frame, 1st support at 1071.11
BTCUSD:
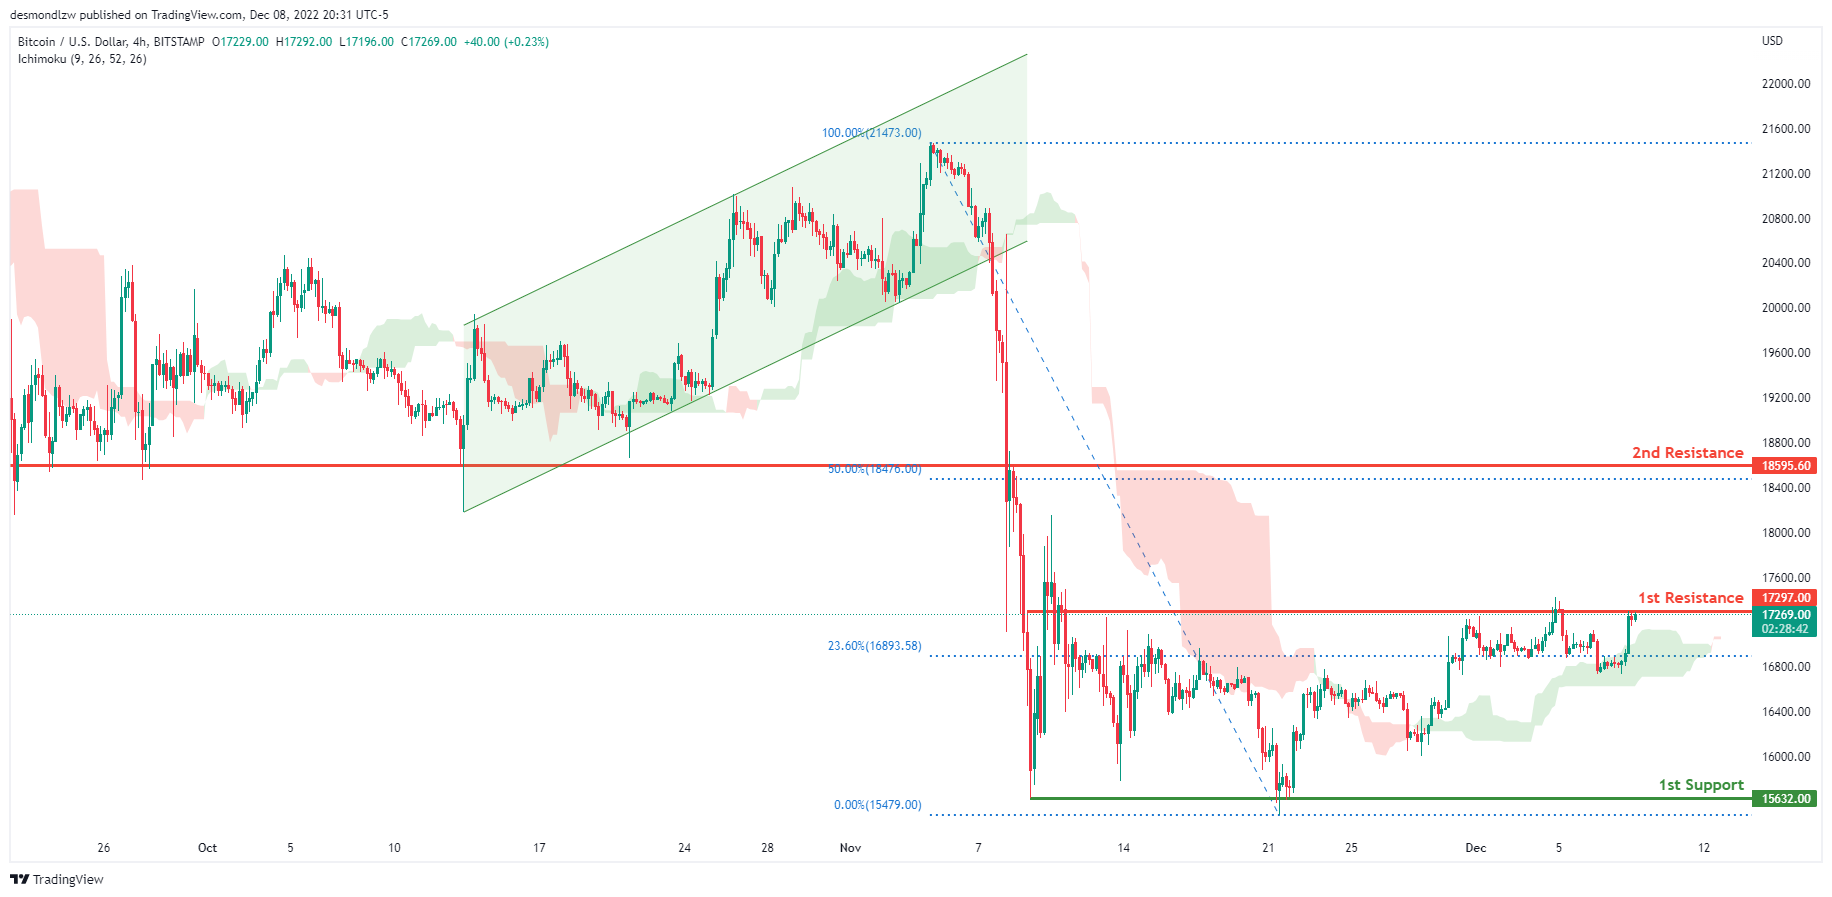
Looking at the H4 chart, my overall bias for BTCUSD is bullish due to the current price crossing above the Ichimoku cloud, indicating a bullish market. Expecting price to possibly break the 1st resistance at 17297.00, where the 23.6% Fibonacci line is before heading towards the 2nd resistance line at 18173.33, where the previous swing low is and 50% Fibonacci line are. In an alternative scenario, price could possibly head back down towards the 1st support at 15632.00, where the previous swing low is.
Areas of consideration:
- H4 time frame, 1st resistance 17297.00
- H4 time frame, 2nd resistance 18173.33
- H4 time frame, 1st support at 15632.00
S&P 500:
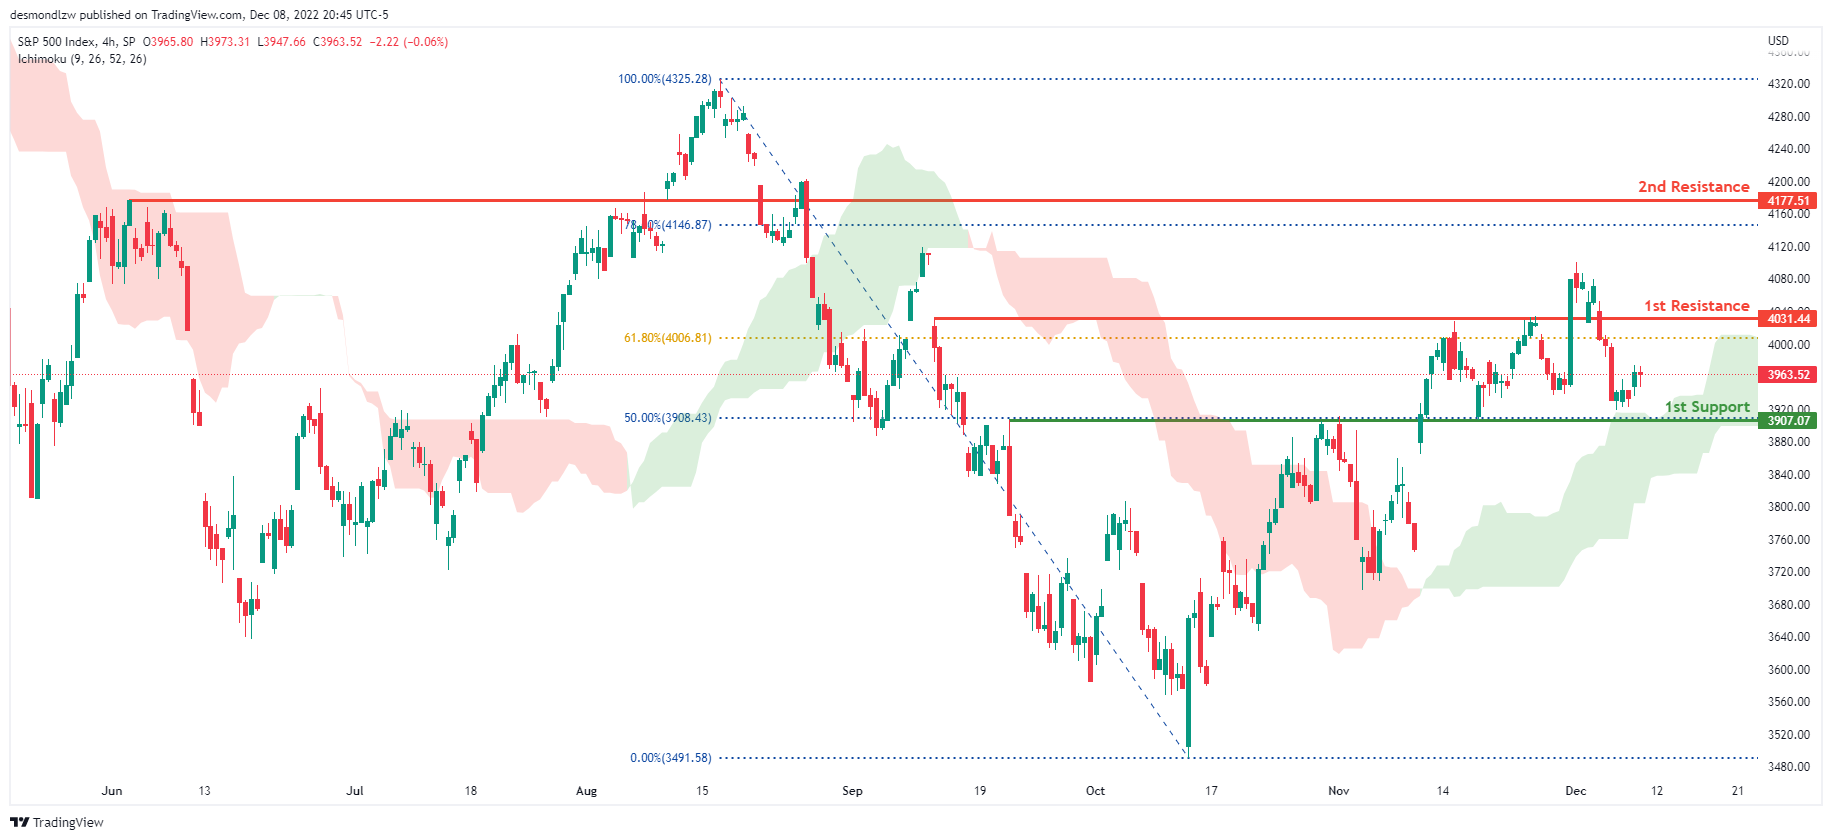
The overall bias for the S&500 on the H4 chart is bullish, with prices above the Ichimoku cloud. If the bullish momentum continues, the expected price to head towards the 1st resistance line is at 4031.44, where the 61.8% Fibonacci line is located. In an alternate scenario, price could return to the 1st support line at 3907.07, where the 50% Fibonacci line is located.
Areas of consideration:
- H4 time frame, 1st support at 3907.07
- H4 time frame, 1st resistance at 4031.44
China CPI slowed to 1.6% yoy in Nov, core CPI down -0.6% yoy
China CPI slowed from 2.1% yoy to 1.6% yoy in November, below expectation of 1.7% yoy. Core CPI, excluding food and energy, was down -0.6% yoy, unchanged from October. Food prices slowed from 7.0% yoy to 3.7% yoy. Non-food prices were unchanged at 1.1% yoy.
"In November, due to the domestic epidemic, seasonal factors, and a higher base of comparison in the same period last year, CPI turned from rising to falling month on month and fell back year on year," said chief NBS statistician Dong Lijuan.
PPI was unchanged at -1.3% yoy, above expectation of -1.5% yoy. "In November, PPI rose slightly month on month as a result of price increases in coal, oil and non-ferrous metals, and continued to fall year on year due to a high base of comparison from the same period last year," added Dong.
BoC Kozicki: We will be considering whether to increase rates further
BoC Governor Deputy Governor Sharon Kozicki said in speech yesterday, "going forward, we will be considering whether to increase rates further".
"By that, we mean that we expect our decisions will be more data-dependent," she said. "If we are surprised on the upside, we are still prepared to be forceful. But we recognize that we have raised interest rates rapidly and that their effects are working their way through the economy."
"In other words, we are moving from how much to raise interest rates to whether to raise interest rates," she added.
USD/JPY Faces Uphill Task, This Resistance Is The Key
Key Highlights
- USD/JPY corrected higher from the 133.60 zone.
- A crucial bearish trend line is in place with resistance near 137.50 on the 4-hours chart.
- EUR/USD and GBP/USD are consolidating gains above support zones.
- Gold price might aim a fresh increase towards the $1,825 resistance.
USD/JPY Technical Analysis
The US Dollar started a major decline below the 142.00 support against the Japanese Yen. USD/JPY traded as low as 133.61 before it started an upside correction.
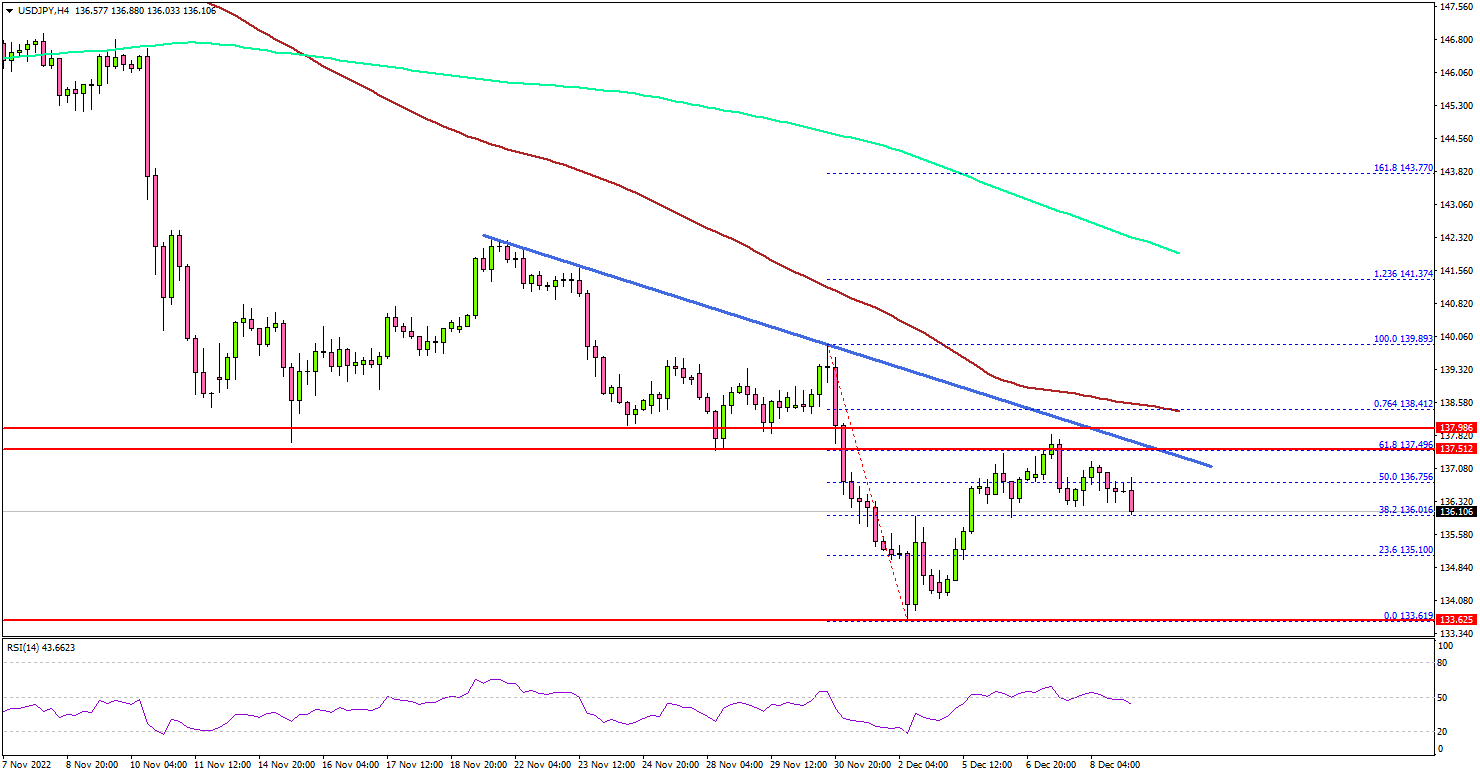
Looking at the 4-hours chart, the pair corrected above the 135.00 resistance zone. There was a move above the 50% Fib retracement level of the downward move from the 139.89 swing high to 133.61 low.
However, the pair faced a strong resistance near the 137.50 zone and it stayed below the 100 simple moving average (red, 4-hours), and the 200 simple moving average (green, 4-hours). There is also a crucial bearish trend line in place with resistance near 137.50 on the same chart.
On the upside, the pair is facing resistance near the 137.50. The next major resistance may perhaps be near 138.50 and the 100 simple moving average (red, 4-hours). A clear move above the 138.50 resistance might start another decent increase.
In the stated case, USD/JPY may perhaps test 140.00. Any more gains could set the pace for a move towards the 142.50 resistance zone.
If there is no upside break, the pair might start a fresh decline. An initial support is near the 136.00 level. The next major support is near the 135.00 zone. Any more losses might send the pair towards the 133.60 support zone.
Looking at gold price, the bulls are seen active and there are chances of a fresh increase towards the $1,825 resistance zone.
Economic Releases
- US Producer Price Index for Nov 2022 (MoM) – Forecast +0.1%, versus +0.2% previous.
- US Producer Price Index for Nov 2022 (YoY) – Forecast +7.4%, versus +8.0% previous.
- Michigan Consumer Sentiment Index for Dec 2022 (Prelim) – Forecast 53.3, versus 56.8 previous.
Cliff Notes: Growth Prospects to Diverge as New Year Begins
Key insights from the week that was.
This week, Australia’s Q3 GDP report and the outcome of the December RBA Board meeting provided a broad update on the health of Australia’s economy and its outlook. Offshore, the growing divergence between developed and developing markets’ growth prospects remained in focus.
Q3 GDP for Australia came in slightly under the market’s expectation at 0.6%, 6.9%yr. Household spending was the key support in the three months to September, with a further reduction in the savings rate and robust nominal income gains facilitating a 1.1% lift in consumption. This does however represent a clear slowdown in the pace of consumption growth from the first half of the year, indicating that the reopening effect is fading.
As spending patterns continue to normalise and the full effect of rapidly rising interest rates and inflation’s hit to real incomes is felt, consumption growth will slow further. Some components of household spending are already beginning to wilt under these headwinds, as evinced by the 11.2% decline in real estate turnover which subtracted 0.2ppts from GDP growth in Q3. Conditions for business investment meanwhile remain mixed. In short, supply issues, and on occasion the weather, are limiting the pace at which the sector’s pipeline of work can progress. Though, with capacity tight and tax incentives continuing to support, business remains constructive on the outlook for investment over the coming year.
After 13 consecutive quarters of surplus, Australia’s current account meanwhile slipped into deficit in Q3, ending the longest run of surpluses in the history of the series which dates back to 1959. This was predominately driven by the trade surplus narrowing from $42bn at June to $31bn in September – still an elevated level versus history. As was subsequently highlighted by the October trade balance, in part due to global conflict and uncertainty, fuel and food exports are at record highs and are likely to show continued strength. Note though, the flip-side of record resource sector profitability is an outsized flow of dividends to foreign shareholders. In Q3, Australia’s net income deficit rose to 4.4% of GDP, roughly in line with the peak during the 2007 commodity price boom.
Commodity markets were a broader point of discussion for the Westpac Economics team this week, both with respect to the diverging growth prospects of developed and developing nations heading into 2023 and amid the global green transition. Our newest video series ‘Commodities in Transition’ seeks to delve deeply into both with a view to assessing the implications for Australia’s exports and national income.
On Australia’s outlook, the December RBA Board meeting was also informative. As discussed by Chief Economist Bill Evans, having delivered another 25bp hike, the RBA retained its tightening bias heading into the new year, noting the “Board expects to increase interest rates further over the period ahead, but it is not on a pre-set course”. Further, concern continued to be shown over the potential threat to the economy of high inflation becoming entrenched. Westpac continues to expect additional 25bp increases at the February, March and May meetings, taking the cash rate to a peak of 3.85% which is then expected to be retained until 2024, when we see a series of interest rate cuts beginning.
Moving offshore, the market this week showed increasing confidence in China’s outlook and, by association, that of developing Asia. The two have a strong connection, with China receiving a large and growing dividend from Asia’s economic development and, ahead, their shift to renewable power generation and society’s electrification – structural changes which China has a leading role in globally.
However, the focus of most market participants currently is China’s path out of COVID-zero. On this front, news remains positive, with a further easing of testing and isolation rules seen over the week as well as the relaxation of the requirement to show a negative test to enter public transport, retail and offices in major tier 1 cities. Authorities are also working hard to improve confidence amongst consumers, the intent being to increase households willingness to spend in line with their capacity. A progressive end to COVID-zero restrictions at the same time as residential construction begins to rebound and investment in heavy and technological infrastructure continues to show strength is a heady mix for China GDP growth, which we see rebounding from 3.5% in 2022 to 6.0% in 2023.
Finally to the US and Europe. Ahead of their final central bank meetings for 2022 next week, comments by policy makers and the data flow was very light. For the US, a strong nonfarm payrolls print last Friday and ISM services report this week has done little to assuage the market of growing fears of recession in 2023, with the S&P Global services PMI in contrast signalling a weak state of affairs for small and medium-sized firms in the sector.
As we have long argued, albeit for different reasons, the risks of recession in the US are similar to those for Europe heading into the new year. It is therefore unsurprising that both the US dollar and US term interest rates are near their recent lows as we go to print. With European risks to crystalise earlier in 2023 than the US, we forecast a trend decline in the US dollar over the coming year, continuing into 2024 as rate cuts commence in both jurisdictions.
Australian Economy Likely to Stall in the Second half of 2023
The messages from the recent national accounts support our pessimistic growth outlook.
The recent national accounts for the September quarter were largely in line with our expectations and they further emphasised some of the key developments we see in the Australian economy that will lay the foundations for a modest growth outlook in 2023 and 2024.
We continue to forecast a slowdown in the growth profile for the Australian economy from 2.6% in 2022 to 1.0% in 2023 and 2.0% in 2024.
The key to this profile is the consumer.
Household consumption is forecast to slow from around 2% (6 month annualised) in the first half of 2023 to near zero in the second half. That would see growth through the year of 1.0%.
The first half will benefit from the spill over of the momentum in the second half of 2022 which is expected at around a 4% pace (six month annualised) while the building negative forces of a rising interest rate burden; the fading reopening of the economy; a much more modest fall in the savings rate than we saw in 2021 and 2022; a damaging negative wealth effect from falling house prices and negative real wages growth will weigh heavily on the household sector.
Consistent with a depressing outlook for domestic sales and the expiry of the tax allowances in June, business equipment investment is forecast to contract by around 7% in the second half of 2023. This hit to activity will be compounded by a contraction in new residential investment and in home renovation activity.
A six month period of a stagnant economy and no growth in household spending will alert the RBA to the need to ease policy settings in 2024. Overall output growth in 2024 is forecast to improve to 2%, with the bulk of that expansion (1.5%) coming in the second half of the year.
Inflation will be lower in 2024 (at 3%) than the RBA’s current forecast of 3.25%, allowing the RBA to cut rates by around 100 basis points through that year.
The sharp economic slowdown in 2023 will be partly engineered by the need for the RBA to continue lifting the cash rate in the first half of 2023 as wages growth and inflation remain uncomfortably high and growth holds in at a “respectable pace” – particularly in the opening quarter.
The themes which are discussed below from the September quarter national accounts are expected to extend through 2023.
Risks to the profile are evenly balanced.
Inflation and wages may fall much more quickly than we envisage allowing the RBA to bring forward the rate cuts and avoid the last hike (to 3.85%) we are anticipating for May.
On the other hand, inflation throughout 2023 may be stickier than we expect. The RBA would be unable to cut rates in 2024, as anticipated, condemning the Australian economy to another very difficult year with weak growth and no prospect of any interest rate relief.
While there is mounting evidence that relief from supply side inflation is in prospect demand factors remain uncertain.
Through 2023 businesses need to embrace that difficult growth outlook and desist from excessive price increases or out bidding competitors for scarce labour. In general, the prospect of flat growth should convince businesses that large wage increases and rising prices will be unsustainable by the second half of 2023.
The observations below on the recent evidence on the evolution of the economy are supportive of our assessment.
The Australian economy expanded by 0.6% in the September quarter for annual growth of 5.9%
Household spending growth slowed in the quarter from 2.1% in the June quarter, to 1.1%, although it did contribute all the 0.6ppts of overall growth. Motor vehicles sales and operations (0.4ppts); hotels, cafes and restaurants (0.4ppts); and transport services (0.3 ppt’s) contributed most of the 1.1ppt growth in household consumption. While not as strong as in the June quarter, the opening up effect was once again apparent as a key driver of consumer spending, although there were some examples (recreation and leisure) where the opening up effect has already faded (that the ABS advise that this surprise slowing in recreation was more apparent in the goods component than services, as well as gambling).
Part of this lift in spending was funded by a further fall in the household savings rate from 8.3%, in June, to 6.9%, although the major fall from a peak of 19.4% in September 2021 (associated with the delta lockdowns) has largely worked its way through.
In reviewing the household cash flow for the September quarter, we estimate that household incomes lifted by $8.2bn; were boosted by interest and dividend payments of $4.5bn but were reduced by a substantial leakage of $5.1bn in higher interest payments as rising interest rates bite. That fall in the savings rate released $4.2bn in free funds supporting a nominal increase in spending of around $10bn.
As a point of comparison with the June quarter we note that interest payments only increased by $1.4bn while the boost from the fall in the savings rate was $9.5bn for an overall boost in nominal spending of $11.4bn.
That comparison with the June and September quarters highlights the rebalancing of the falling savings rate and rising interest cost that will weigh even more heavily on spending as we go forward.
Prospects for growth in consumer spending are easing as the reopening effect fades and the savings rate settles back at a more normal level. However, given the accumulated $260bn in excess household savings it is likely that the savings rate will fall below equilibrium (judged to around 6%) as households draw on these excess balances. We expect that through 2023 that savings rate can drift down to around 3% but our forecasts anticipate that the boost to available spending power will be more than offset by the rising interest cost.
Consumer spending was also boosted by household incomes in the September quarter.
Compensation of employees rose 3.2% (including 2.7% in wages and salaries) in the quarter up from growth in the June quarter of 2.5% (2.2% in wages and salaries).
However, households were challenged by a sharp increase (2.0%) in the household consumption deflator up from 1.5% in the June quarter and the fastest quarterly gain since March 1988.
The weakness in housing activity was not only apparent in property turnover (subtracted 0.2ppts from growth) but a 2.2% decline in renovation work.
Business investment was generally lack lustre (up 0.7%) with a 3.0% fall in machinery and equipment being offset by a 4.3% increase in non-residential construction.
There are some clear themes in the latest set of national accounts.
Household spending, boosted by a falling savings rate, continues to be the driver of growth largely through the reopening lift from travel; accommodation and hospitality; and motor vehicle purchases.
Some specific drag is apparent in the weak real estate market.
As we move forward, the reopening effect will fade; property weakness will linger; the savings rate will find a floor; and consumer spending growth will continue to slow.
In addition, the drag on incomes from rising interest rates will intensify through 2023 just as we saw the drag lift from $1.4bn in the June quarter to $4.5bn in the September quarter.
But price and wage pressures are building, and it is these contrasting forces that will challenge policy. Our forecasts continue to embed a lift to a peak of 3.85% in the RBA cash rate by May next year.