Sample Category Title
(BOC) Bank of Canada increases policy interest rate by 50 basis points, continues quantitative tightening
The Bank of Canada today increased its target for the overnight rate to 4¼%, with the Bank Rate at 4½% and the deposit rate at 4¼%. The Bank is also continuing its policy of quantitative tightening.
Inflation around the world remains high and broadly based. Global economic growth is slowing, although it is proving more resilient than was expected at the time of the October Monetary Policy Report (MPR). In the United States, the economy is weakening but consumption continues to be solid and the labour market remains overheated. The gradual easing of global supply bottlenecks continues, although further progress could be disrupted by geopolitical events.
In Canada, GDP growth in the third quarter was stronger than expected, and the economy continued to operate in excess demand. Canada's labour market remains tight, with unemployment near historic lows. While commodity exports have been strong, there is growing evidence that tighter monetary policy is restraining domestic demand: consumption moderated in the third quarter, and housing market activity continues to decline. Overall, the data since the October MPR support the Bank's outlook that growth will essentially stall through the end of this year and the first half of next year.
CPI inflation remained at 6.9% in October, with many of the goods and services Canadians regularly buy showing large price increases. Measures of core inflation remain around 5%. Three-month rates of change in core inflation have come down, an early indicator that price pressures may be losing momentum. However, inflation is still too high and short-term inflation expectations remain elevated. The longer that consumers and businesses expect inflation to be above the target, the greater the risk that elevated inflation becomes entrenched.
Looking ahead, Governing Council will be considering whether the policy interest rate needs to rise further to bring supply and demand back into balance and return inflation to target. Governing Council continues to assess how tighter monetary policy is working to slow demand, how supply challenges are resolving, and how inflation and inflation expectations are responding. Quantitative tightening is complementing increases in the policy rate. We are resolute in our commitment to achieving the 2% inflation target and restoring price stability for Canadians.
Information note
The next scheduled date for announcing the overnight rate target is January 25, 2023. The Bank will publish its next full outlook for the economy and inflation, including risks to the projection, in the MPR at the same time.
Oil Seems to Be Heading for $62
WTI crude is down to $73, while Brent is approaching $78, losing 2% since the start of the day and almost 10% since the beginning of the month. Despite rumours about possible quotas cut, OPEC+ keep them for another two months, leading the price to drop. We expect pressure on prices to persist soon, with prices likely to plunge into the $62-65 area.
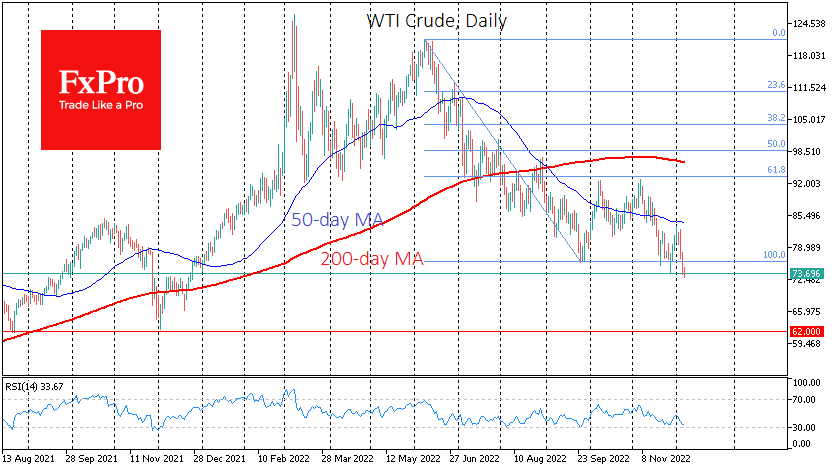
Despite Russia’s warnings that the imposition of price caps on its oil from G7 and Australia will cause an uncontrollable price spike, the market reaction is quite the opposite. Oil always looks like a leveraged bet on the economic cycle, dropping sharply during the economic slowdown. In addition, the price cap did not cause an immediate supply shock while demand prospects have worsened due to the threat of recessions in the eurozone, the UK and the US in coming months.
Oil traders are not yet frightened by the risks of reducing the global oil supply. Experience with Russian gas substitution has been better than initially feared. For oil, there is also an expectation that the decline in Russian production will be smooth enough, allowing other producers to ramp up supply to increase their market share.
A purely technical view of the price dynamics suggests that the decline is far from over. Oil rewrote the September lows at the end of November and has updated them again today. This looks like a second downside momentum after the corrective pullback from the end of September to 61.8% of the first leg down from June to September. The downside target in this pattern is levelled at 161.8% of the actual move. This is close to $50 per barrel WTI in our case.
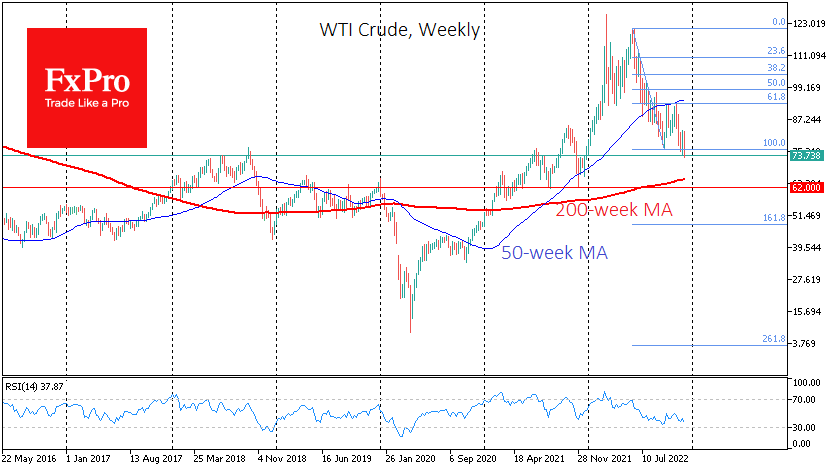
However, such an ambitious plan by the oil bears is worth breaking into several intermediate steps. The first support looks to be the $70 area, from which the US government has promised to resume buying oil for reserves. We still need to determine if these purchases will be unlimited, forming a firm ‘floor’ for the price.
The next, deeper support line appears to be the $62-65 area, where the oil turned from a decline to a rise in August and December last year. This is where prices could fall before the end of the year if the US and eurozone economies stop surprising with economic data and China continues to slow.
A plunge towards $50 is possible if the global economy is on the verge of a downturn and oil producers such as sanctioned Russia, Iran, and Venezuela can hold off cutting their production to supplement their budgets.
Aussie Shrugs Off Soft GDP
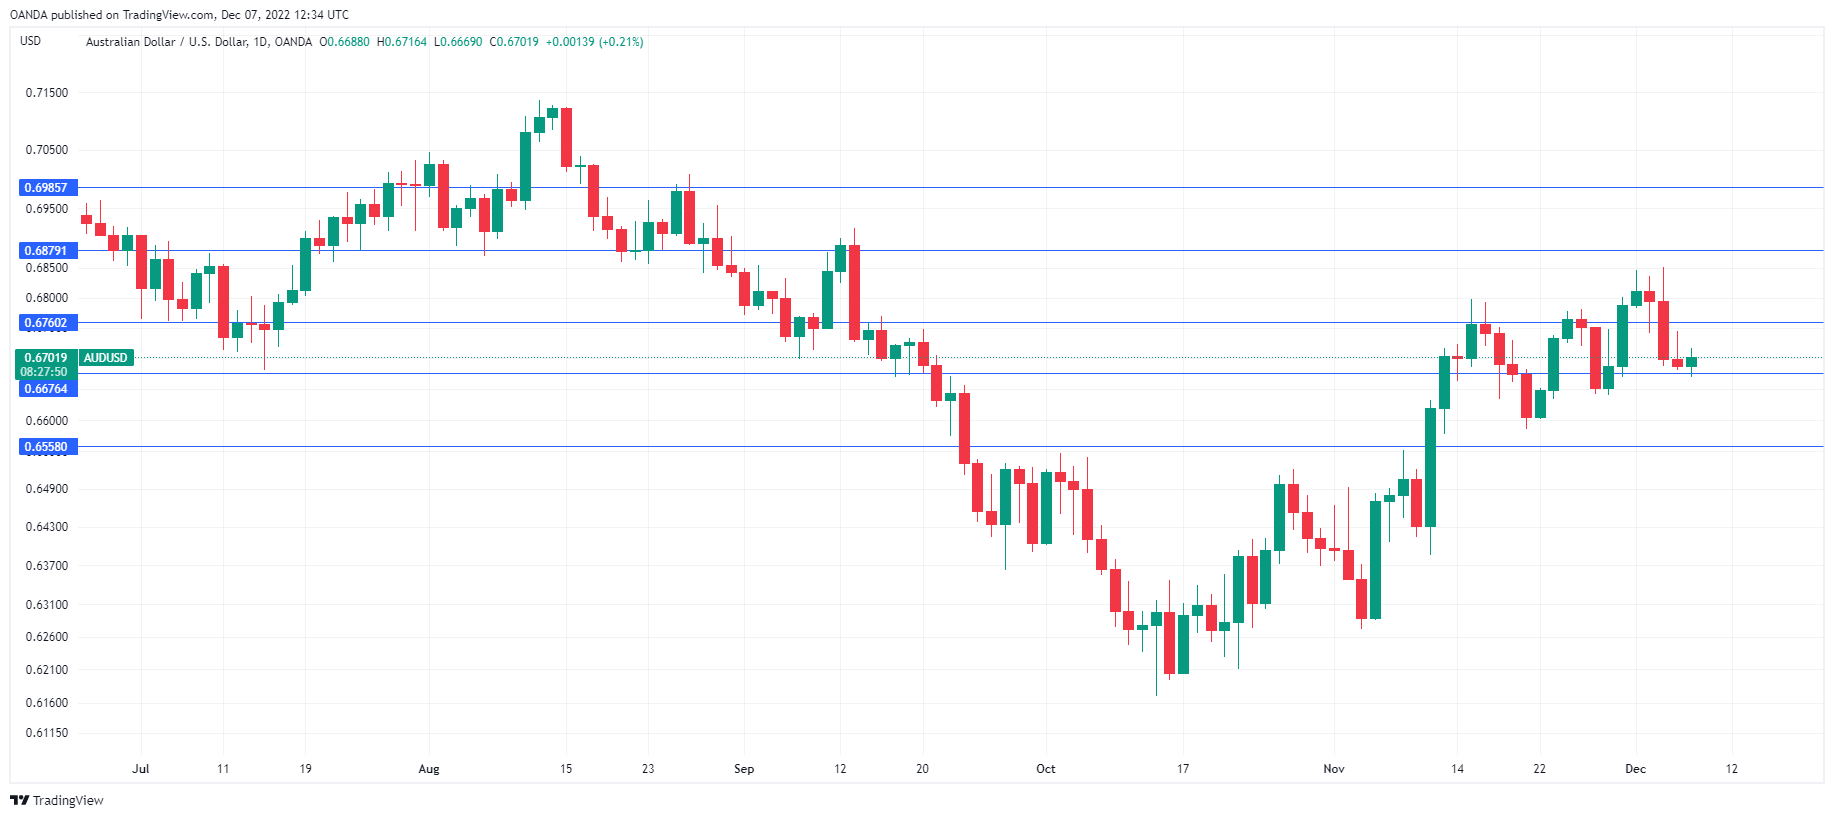
The Australian dollar is showing limited movement for a second successive day. In European trade, AUD/USD is trading at 0.6696, up 0.12%.
Australia’s GDP misses forecast
Australia’s economy underperformed in Q3, with a modest gain of 0.6% m/m. This was lower than the Q2 print of 0.9% and beneath the 0.7% consensus and also marked the weakest quarterly growth this year. Annual GDP climbed 5.9%, an improvement from 3.6% in Q2 but shy of the consensus of 6.2%. The RBA is projecting that GDP will continue to slow through to 2024. The economy is showing clear signs of slowing down. Services, manufacturing and construction PMIs are all in decline. There was more bad news this week – Current Account for Q3 showed a deficit for the first time since 2019 and Company Operating Profits fell by 12.4% in the third quarter.
Household spending remains strong, but high inflation continues to erode savings and consumers will have no choice but to cut back on spending at some point. Inflation has been more persistent than the RBA anticipated, and Governor Lowe has reiterated that inflation is a “scourge” that must be defeated. The RBA would prefer to avoid a recession, but it will be a tricky task to guide the economy to a soft landing.
The RBA raised rates by 25 bp on Tuesday, bringing the cash rate to 3.10%. The move was widely expected. As a result, the Australian dollar showed a muted response. There was little of note in Governor Lowe’s rate statement, which was almost identical to the November statement. Lowe noted that the RBA expects to increase rates, but “is not on a pre-set course” and rate decisions would be data-dependent. This last point may seem obvious, but events such as consumer spending, employment and inflation will be key drivers which determine rate policy in the early part of 2023.
There is a great deal of uncertainty as to the terminal rate, which forecasts ranging from 3.3% all the way to 3.8%. This means there is some life left in the current rate cycle, and there is a strong possibility that the RBA will deliver another 25 bp hike at its next meeting in February.
AUD/USD Technical
- AUD/USD tested support at 0.6676 earlier. Next, there is support at 0.6558
- There is resistance at 0.6760 and 0.6878
The End of the Bear-Market Rally?
Equity markets are struggling again on Wednesday, with the latest Chinese trade data highlighting the challenges facing the global economy going into 2023.
It would appear the recovery in stocks - bear-market rally, or otherwise - has run out of steam, and investors are left wondering whether what follows next is another test of the lows or simply a correction of that impressive two-month surge.
The difficulty investors have now is balancing the coming end of the tightening cycle with a potential global recession next year amid heavily discounted valuations. There's clearly an urge to take advantage of the latter without any real foresight into how bad the decline is going to be, which is what makes it tricky. And also why some are referring to the move since October as a bear-market rally.
A terrible trade report
That confusion is oddly encapsulated by what we're seeing in China right now, even if the moving parts are a little different. Of course, China is not immune to the global growth outlook, quite the opposite in fact, but the Covid evolution is very much unique to it.
On the one hand, investors are keen to celebrate the move away from zero-Covid with new relaxation measures being announced on an almost daily basis. On the other, the economic data has been pretty dreadful and the trade data overnight captures both its domestic struggles and the global decline.
Imports and exports continued to decline rapidly last month and that's not a trend that's likely to improve greatly in the months ahead. Sure, a relaxation of Covid curbs could stimulate more local demand but even that is clouded by the impact of a global slowdown, even recession, and how smoothly China is able to remove restrictions without overwhelming the health service. It's easy to forget how challenging that was for other countries. Next year is going to be far from straight forward and the concerning numbers in the trade data may capture that better than the optimism over the end of zero-Covid.
An end to the RBI tightening cycle?
There may be some more relief in India, where the central bank raised rates by 35 basis points to 6.25% in what may be the final action in its tightening campaign. A lot can change between now and February but there's every chance that inflation will ease early next year, enabling the MPC to move to a holding stance, and not put any further strain on the economy.
Will $70 be a floor in oil?
There's been a lot to absorb for oil traders over the last week, some of which have created more questions than answers. The trade data from China was obviously another blow as it pointed to weakening global demand, as has become the norm from manufacturing and trade data around the world recently.
But at the same time, the country is finally navigating away from zero-Covid, a policy that's often this year been a counter-force against the slow re-introduction of OPEC+ crude and the war in Ukraine. Now, with the balance in the market seemingly tilted towards oversupply, the reopening of China could prove supportive of the crude price.
Ultimately, the movements in oil markets depend on multiple moving parts which is why we're seeing so much volatility but the trend has been negative for a number of weeks. The question is how much weaker it will get before OPEC+ steps in once more. Of course, the Biden administration has indicated it could start purchasing crude for the SPR when the price falls to $70 a barrel which could provide at least a temporary floor.
An eye on PPI
Gold traders clearly already have an eye on Friday's US PPI report after the jobs report setback. While a good PPI number won't heal all wounds, it could provide further evidence that inflation is cooling and allow for a less hawkish Fed next week.
The yellow metal peaked around $1,810 last week and is now consolidating in the $1,760-1,780 range. There's clearly still plenty of bullish appetite there but there will be setbacks along the way, as we're seeing now. The PPI could potentially be another. A break below $1,760 could see a bigger correction, with the next big level of support coming around $1,730 which has been very significant in recent months.
In need of an improvement in risk appetite
Deteriorating risk appetite is the last thing bitcoin needed right now, having missed out on the inflation relief rally amid the FTX fallout. It's broken back below $17,000 but remains broadly around the levels it traded around for the last week or so. Risk appetite probably needs to improve significantly for bitcoin to break higher from here and so many will be hoping for a favourable PPI number on Friday and some less hawkish commentary from the Fed next week. And, of course, no further terrible news either on the FTX front or related to it.
EUR/USD Mid-Day Outlook
Daily Pivots: (S1) 1.0440; (P) 1.0486; (R1) 1.0514; More...
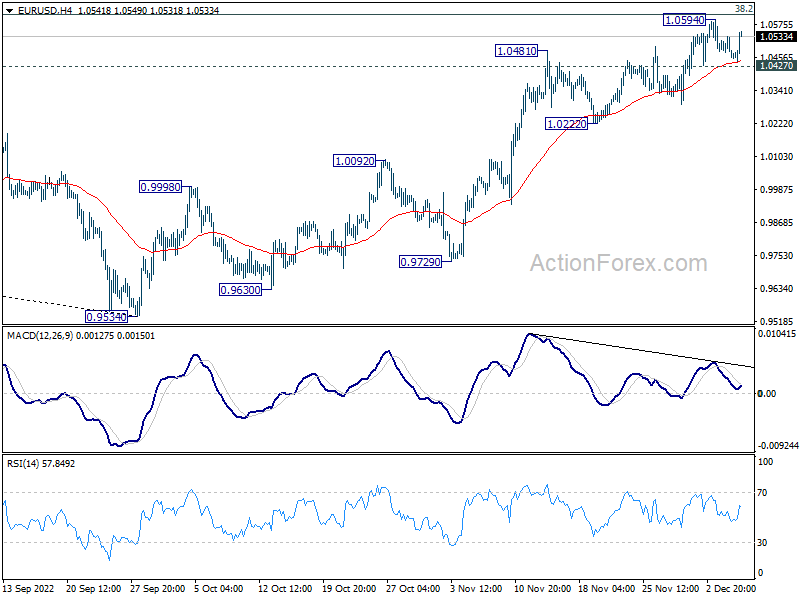
Intraday bias in EUR/USD remains on neutral and outlook is unchanged. Considering bearish divergence condition in 4 hour MACD, break of 1.0427 minor support will indicate short term topping at 1.0594, after rejection by 1.0609 fibonacci level. Intraday bias will be turned back to the downside for 1.0222 support and possibly below. Nevertheless, firm break of 1.0594 will resume larger rise from 0.9534.
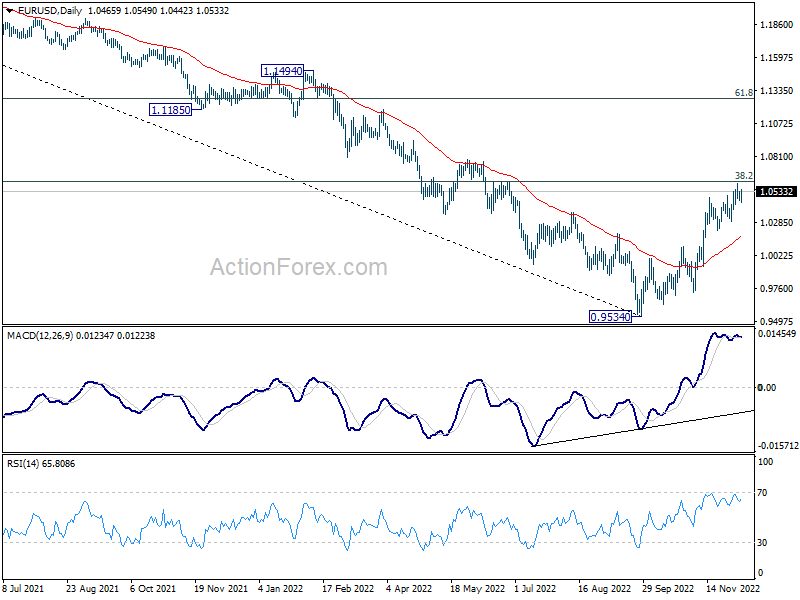
In the bigger picture, a medium term bottom was in place at 0.9534, on bullish convergence condition in daily MACD. Even as a corrective rise, rally from 0.9534 should target 38.2% retracement of 1.2348 (2021 high) to 0.9534 at 1.0609. Sustained trading above 55 week EMA (now at 1.0566) will raise the chance of trend reversal and target 61.8% retracement at 1.1273. However, rejection by 1.0609 will retain medium term bearishness for down trend resumption at a later stage.
GBP/USD Mid-Day Outlook
Daily Pivots: (S1) 1.2084; (P) 1.2177; (R1) 1.2225; More...
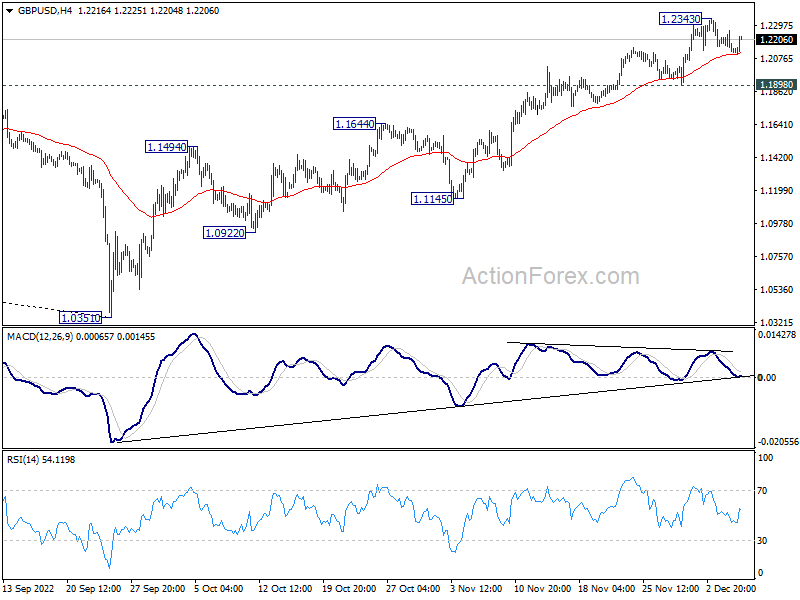
Intraday bias in GBP/USD stays neutral and further rally is expected as long as 1.1898 support holds. Above 1.2343 will resume the rise from 1.0351 and target 1.2759 medium term fibonacci level next. However, firm break of 1.1898 support will confirm short term topping and turn bias back to the downside.
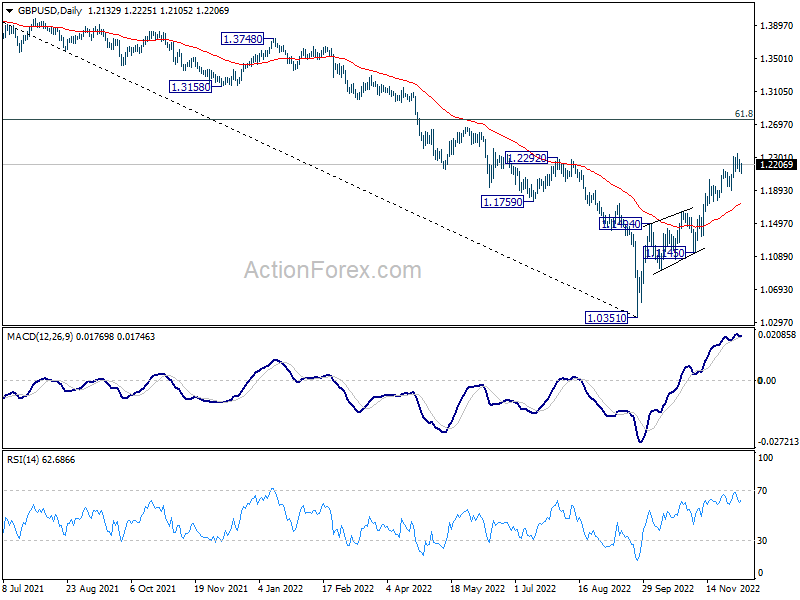
In the bigger picture, rise from 1.0351 medium term bottom is at least correcting whole down trend from 1.4248 (2021 high). Further rise is expected as long as 1.1644 resistance turned support holds. Next target is 61.8% retracement of 1.4248 to 1.0351 at 1.2759. Sustained break there will pave the way back to 1.4248.
USD/CHF Mid-Day Outlook
Daily Pivots: (S1) 0.9383; (P) 0.9419; (R1) 0.9458; More...
Intraday bias in USD/CHF stays neutral and outlook is unchanged. Considering bullish convergence condition in 4 hour MACD, break of 0.9545 will indicate short term bottoming at 0.9325. Intraday bias will be back on the upside for 55 day EMA (now at 0.9652). On the downside, below 0.9325 will resume the near term decline and target 0.9287 fibonacci level.
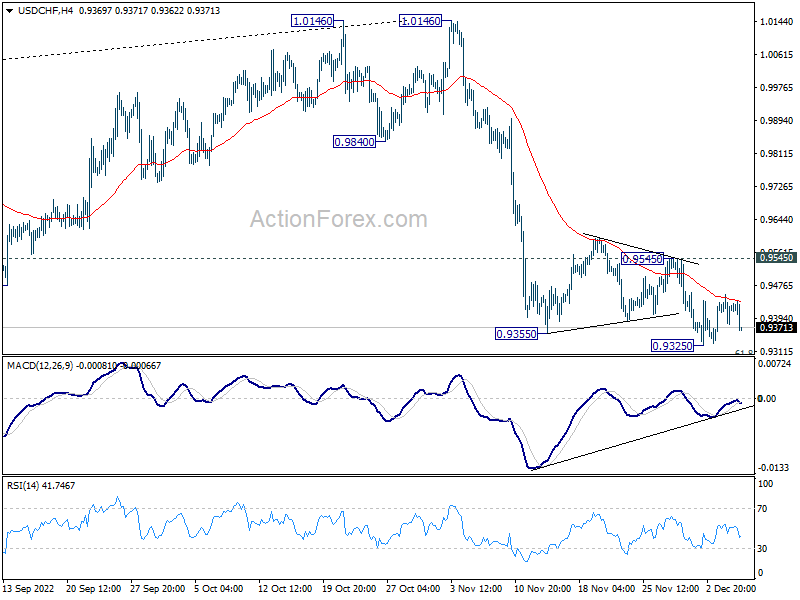
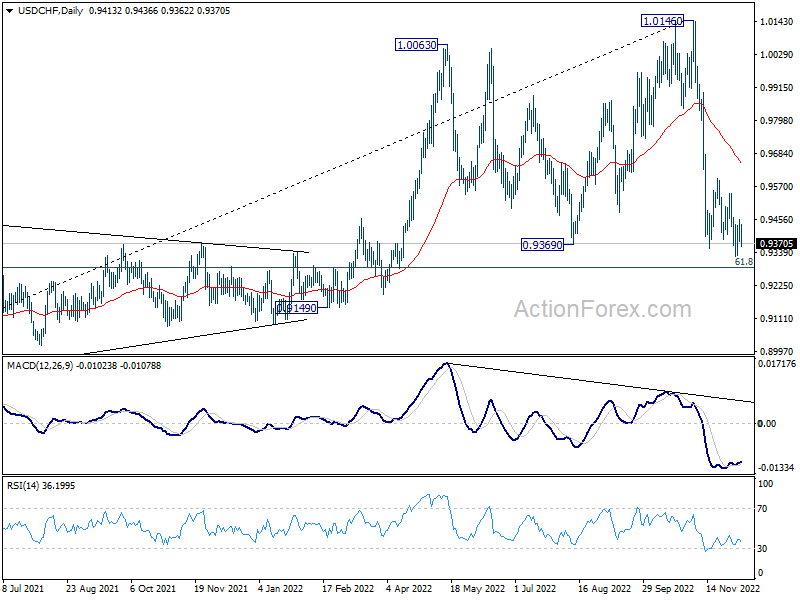
In the bigger picture, rise from 0.8756 (2021 low) has completed at 1.0146, well ahead of 1.0342 long term resistance (2016 high). Based on current downside momentum, fall from 1.0146 might be a medium term down trend itself. Break of 61.8% retracement of 0.8756 to 1.0146 at 0.9287 will pave the way to 0.8756. In any case, risk will stay on the downside as long as 55 day EMA (now at 0.9690) holds.
USD/JPY Mid-Day Outlook
Daily Pivots: (S1) 136.20; (P) 136.81; (R1) 137.66; More...
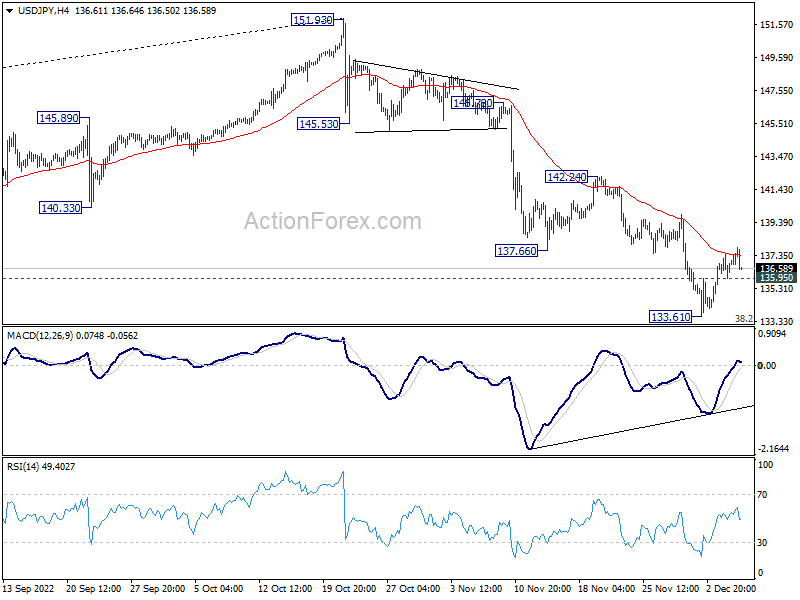
Intraday bias in USD/JPY stays mildly on the upside at this point. Rebound from 133.61 short term bottom should target 55 day EMA (now at 141.41). However, break of 135.95 minor support will turn bias back to the downside for retesting 133.61 low instead.
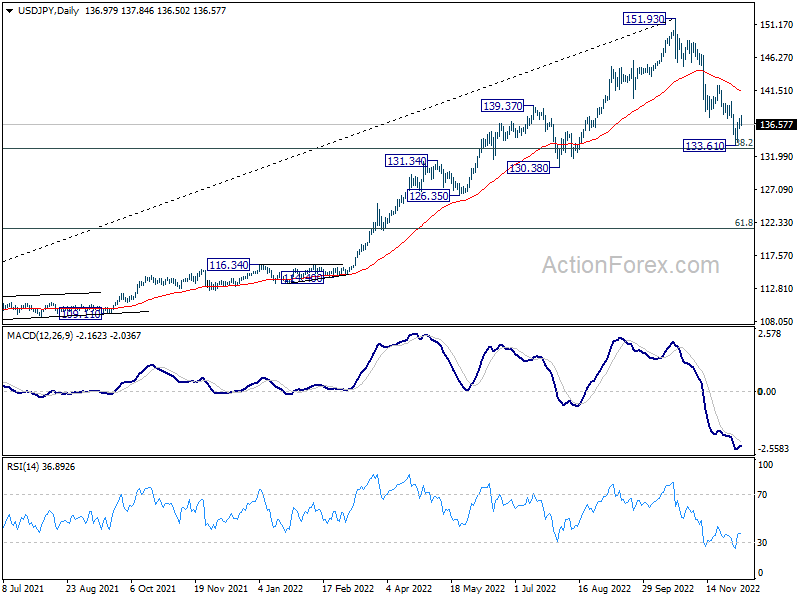
In the bigger picture, a medium term top should be formed at 151.93. Fall from there is correcting larger up trend from 102.58. It's too early to call for bearish trend reversal. But even as a corrective move, such decline should target 38.2% retracement of 102.58 to 151.93 at 133.07, or further to 55 week EMA (now at 131.33). Some support should be seen around this zone to bring rebound. However, sustained break of 55 week EMA will pave the way to 61.8% retracement at 121.43.
The Fed: What Happens After the Fed Reaches the Terminal Rate
Yesterday, several major CEOs gave interviews to financial media in the context of a couple of major investor conferences. Their comments left a sour note for the markets, and tech stocks led a move lower in US equities which fed over into the Asian and European stocks. Aside from the less than optimistic outlook, it underscored a brewing debate about the Fed. The results of that debate could be the difference between a mild (or no) recession, and an economic "hurricane".
First, the disappointing news
What captured most of the attention were comments from Walmart's CEO and the CEO of JPMorgan. The latter has been quite a bit more outspoken about worries of a pending recession. In fact, the "economic hurricane" phrasing was his invention. The issue is that several CEOs echoed a sentiment: that consumer demand was slowing.
Walmart was seeing a trend where consumers were being more conservative in their buying habits, focusing on household essentials and holding back from things like electronics. This dovetailed with the CEO of Union Pacific, who said that shipping volumes were down.
Still good, but for how long?
Jamie Dimon, as the CEO of one of the largest consumer banks in the US, would have some insight into how his customers were spending their money. He pointed to spending this year being 10% higher than last year. Which sounds good, but inflation has to be factored into that. He also pointed out that savings that people had accumulated during the pandemic and thanks to the stimulus were running out, and that might mean further credit crunch in the first half of next year.
This is where the discrepancy starts to show: What will the Fed do. For now, the Fed is raising rates to stave off inflation, and are expected to level out at around 5.0%. This makes borrowing costs significantly higher, which would make buying things with credit cards, or taking out loans, much more difficult.
History won't repeat itself?
In the past, the Fed has hiked rates right up until there was an economic downturn, and then quickly cut in order to support the economy. Particularly to support the jobs market, which is their second mandate. But Dimon is warning this might not be the case this time, as inflation remains elevated, the Fed might be much more concerned with restoring monetary stability. This would make the recession harder, since there wouldn't be the sudden influx of cheaper credit that happened with previous recessions.
The relative strength in the jobs market contributes to that view. Even if the economy slips into contraction, with over 10 million job openings, it could be some time before the unemployment rate starts to tick up. Unemployment is a lagging indicator, and that lag might be even more extended this time around. Which could mean that the more rosy expectations of a quick "pivot" by the Fed next year might not play out.
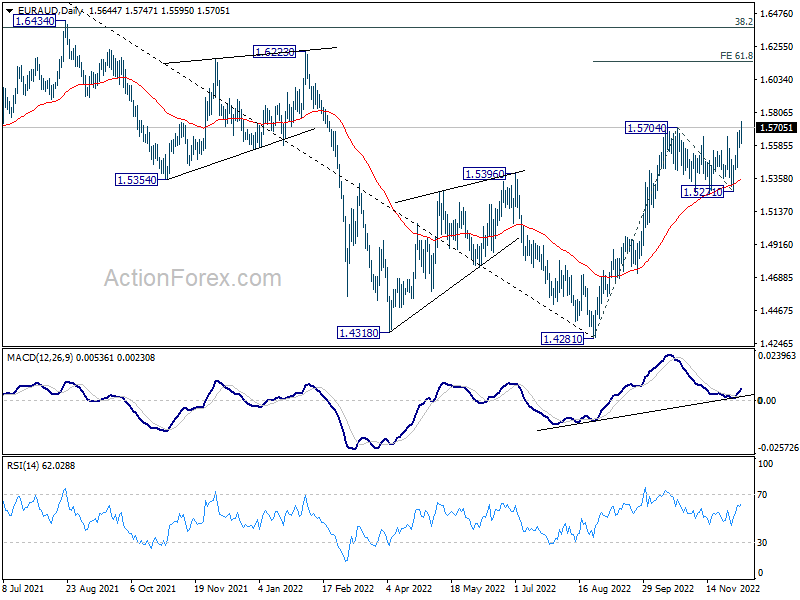
EUR/AUD Mid-Day Outlook
Daily Pivots: (S1) 1.5586; (P) 1.5638; (R1) 1.5701; More...
EUR/AUD's break of 1.5704 resistance indicates resumption of whole rise from 1.4281. Intraday bias is back on the upside. Next target is 61.8% projection of 1.4281 to 1.5704 from 1.5271 at 1.6150. For now, near term outlook will remain bullish as long as 1.5271 support holds, in case of retreat.
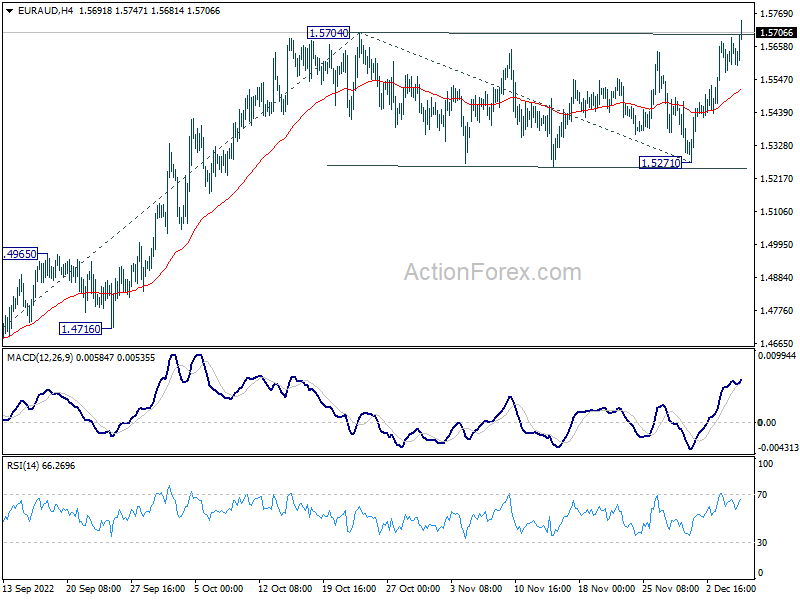
In the bigger picture, a medium term bottom should be in place at 1.4281, on bullish convergence condition in daily MACD. Further rise would be seen back to 1.6434 key resistance next. Break of 1.5271 support is needed to indicate reversal. Otherwise, further rally will remain in favor.