Sample Category Title
XAG/USD: Bulls Targeting 24.788 on a Double Zigzag Pattern
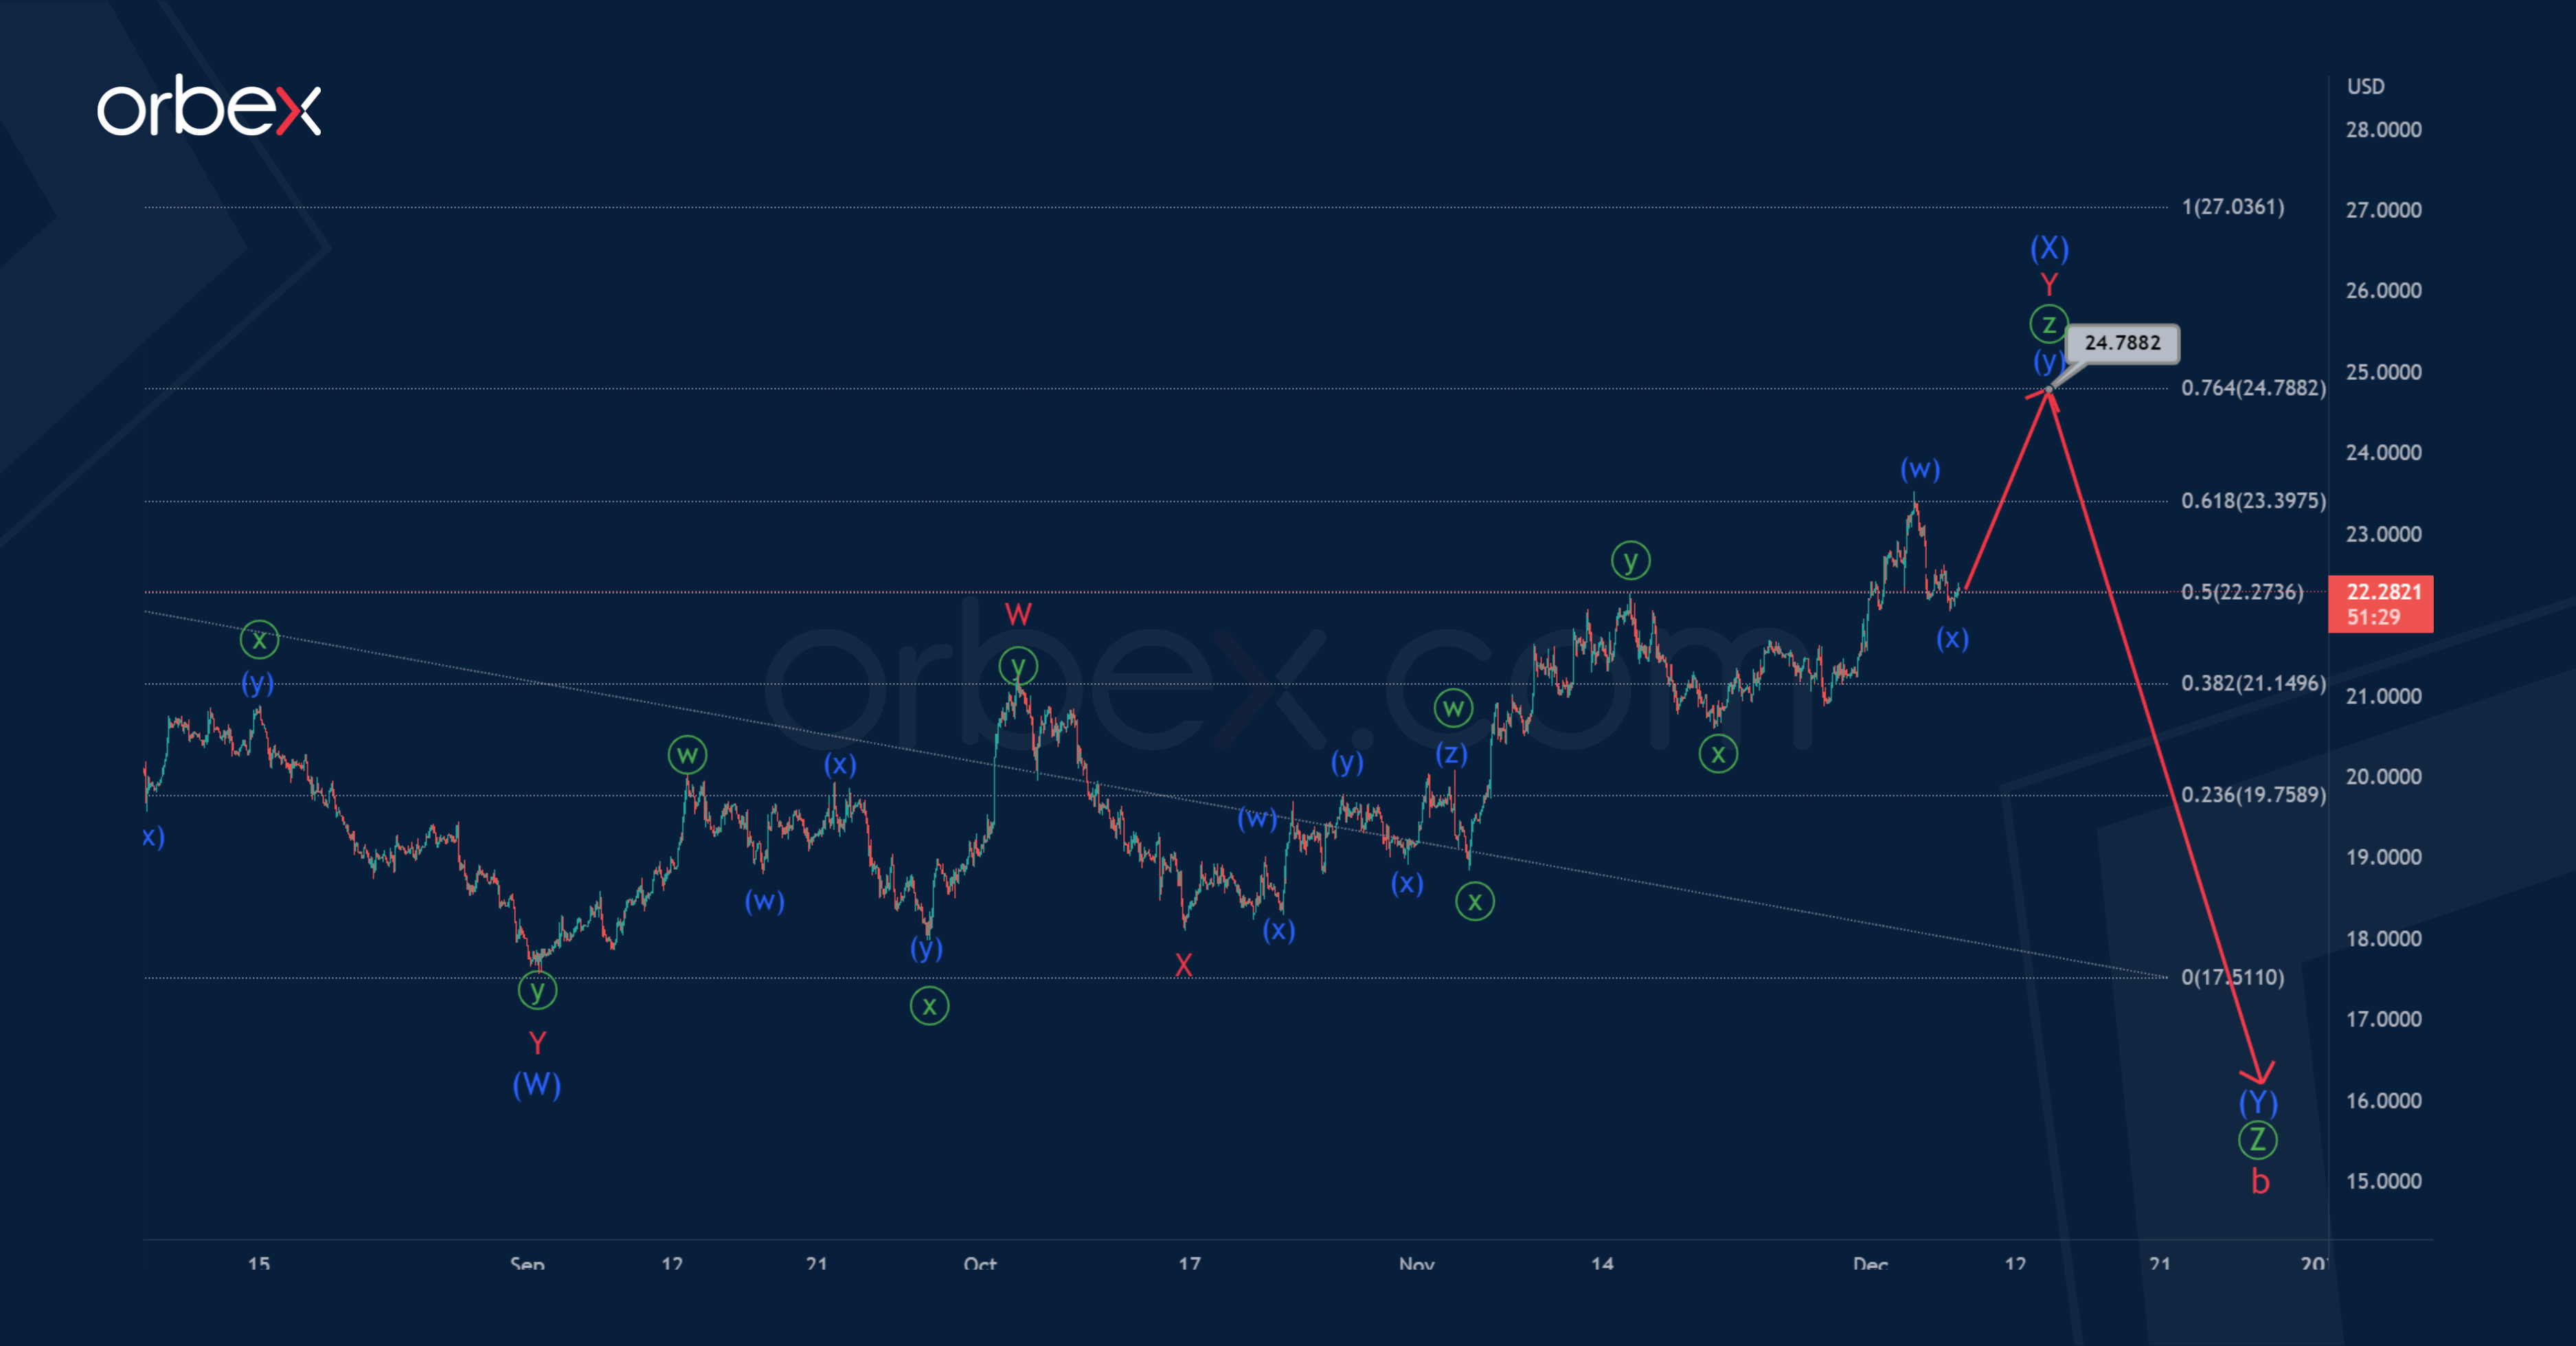
Looking at the 1H timeframe, we see the development of the corrective wave b, which is part of the global zigzag. Correction b most likely takes the form of a triple zigzag Ⓦ-Ⓧ-Ⓨ-Ⓧ-Ⓩ. The first four primary waves are completed, and the last wave Ⓩ is still under construction.
It is assumed that the primary wave Ⓩ will be a double zigzag of the intermediate degree (W)-(X)-(Y). After the end of the actionary wave (W), the price began an upward movement in the intervening wave (X). Like wave (W), intervening wave (X) may end in the form of a minor double zigzag W-X-Y.
The end of the bullish trend is expected near 24.788. At that level, wave (X) will be at 76.4% of wave (W).
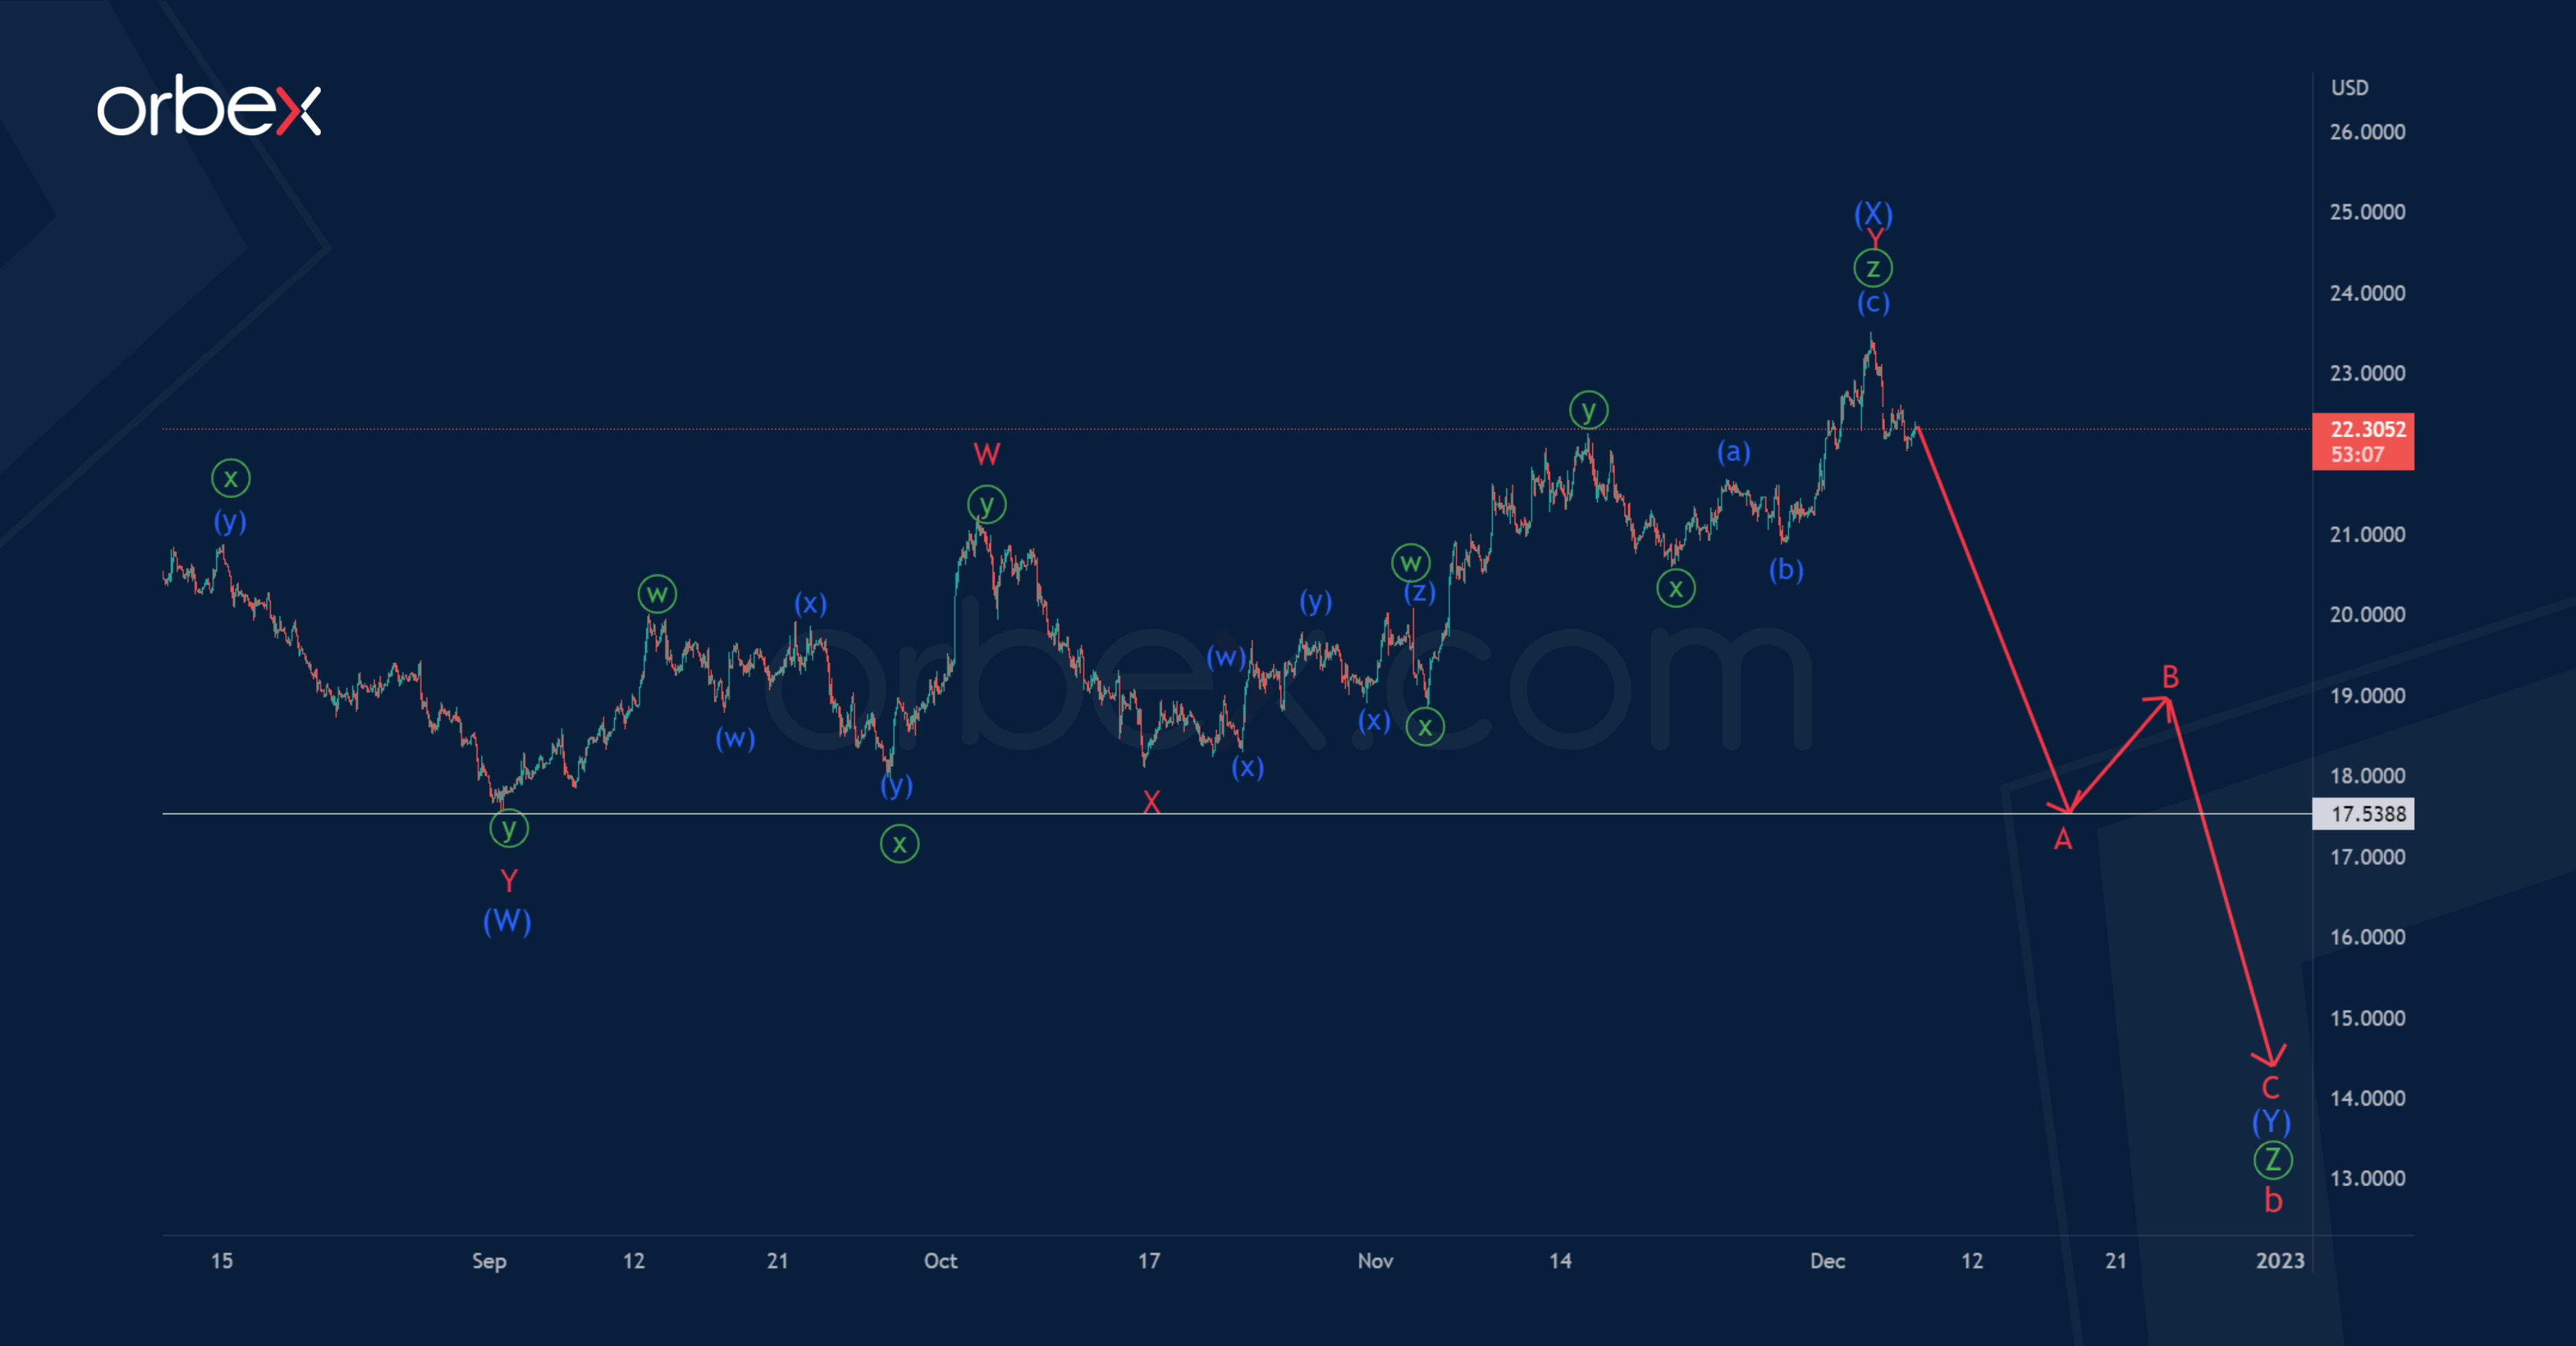
According to an alternative scenario, the XAGUSD pair has completed the construction of an ascending intervening wave (X) of the intermediate degree. As in the main version, it has the form of a double zigzag W-X-Y.
Thus, in the next coming trading days, we can expect a fall in the XAGUSD rate and the formation of a bearish actionary wave (Y). Perhaps this wave will have a standard zigzag shape A-B-C, as shown in the chart.
The first target, where the bears are aimed, is located at the previous minimum of 17.538, which was marked by the actionary intermediate wave (W).
FTSE 100 Consolidates Gains
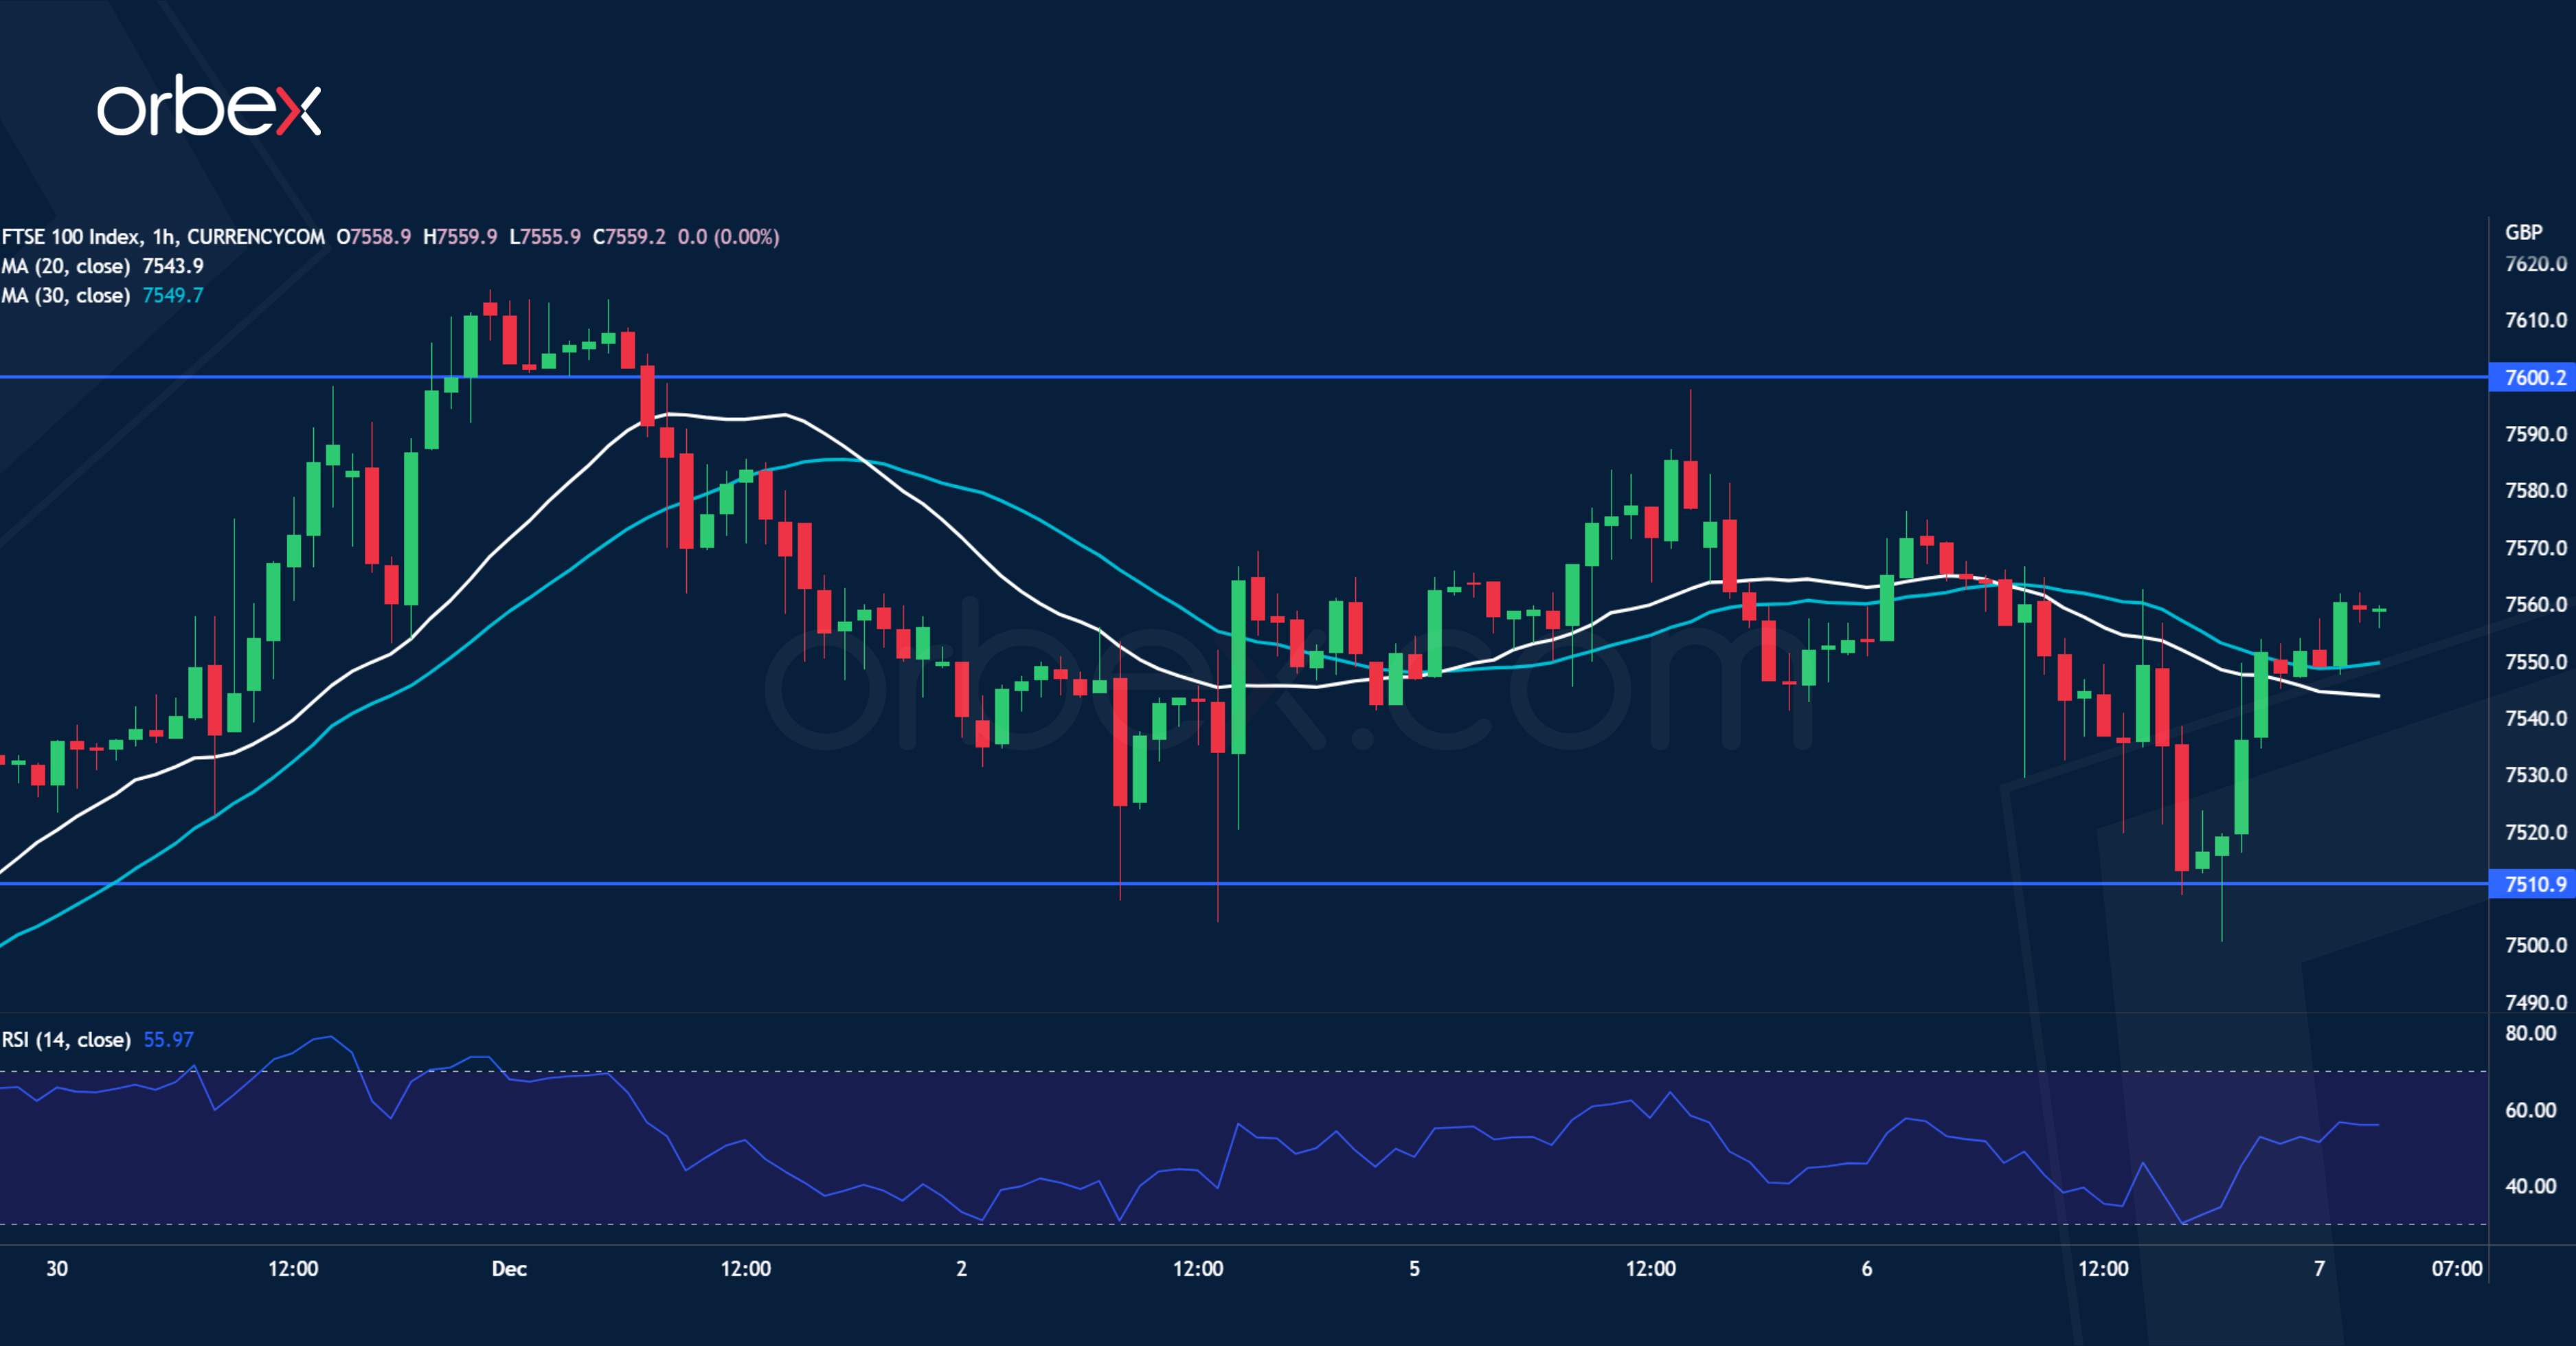
The FTSE 100 falters as traders ponder the Fed’s potential stance next week. The bulls are testing the major supply zone from this year’s highs around 7630 where strong downward pressure could be expected. As the daily RSI shot into the overbought area, a combination of profit-taking and fresh selling could weigh on the short-term price action. 7510 is the first support then 7440 next to the moving averages is an important area of confluence. A rally above the psychological level of 7600 could extend gains above 7700.
AUD/USD Struggles for Support
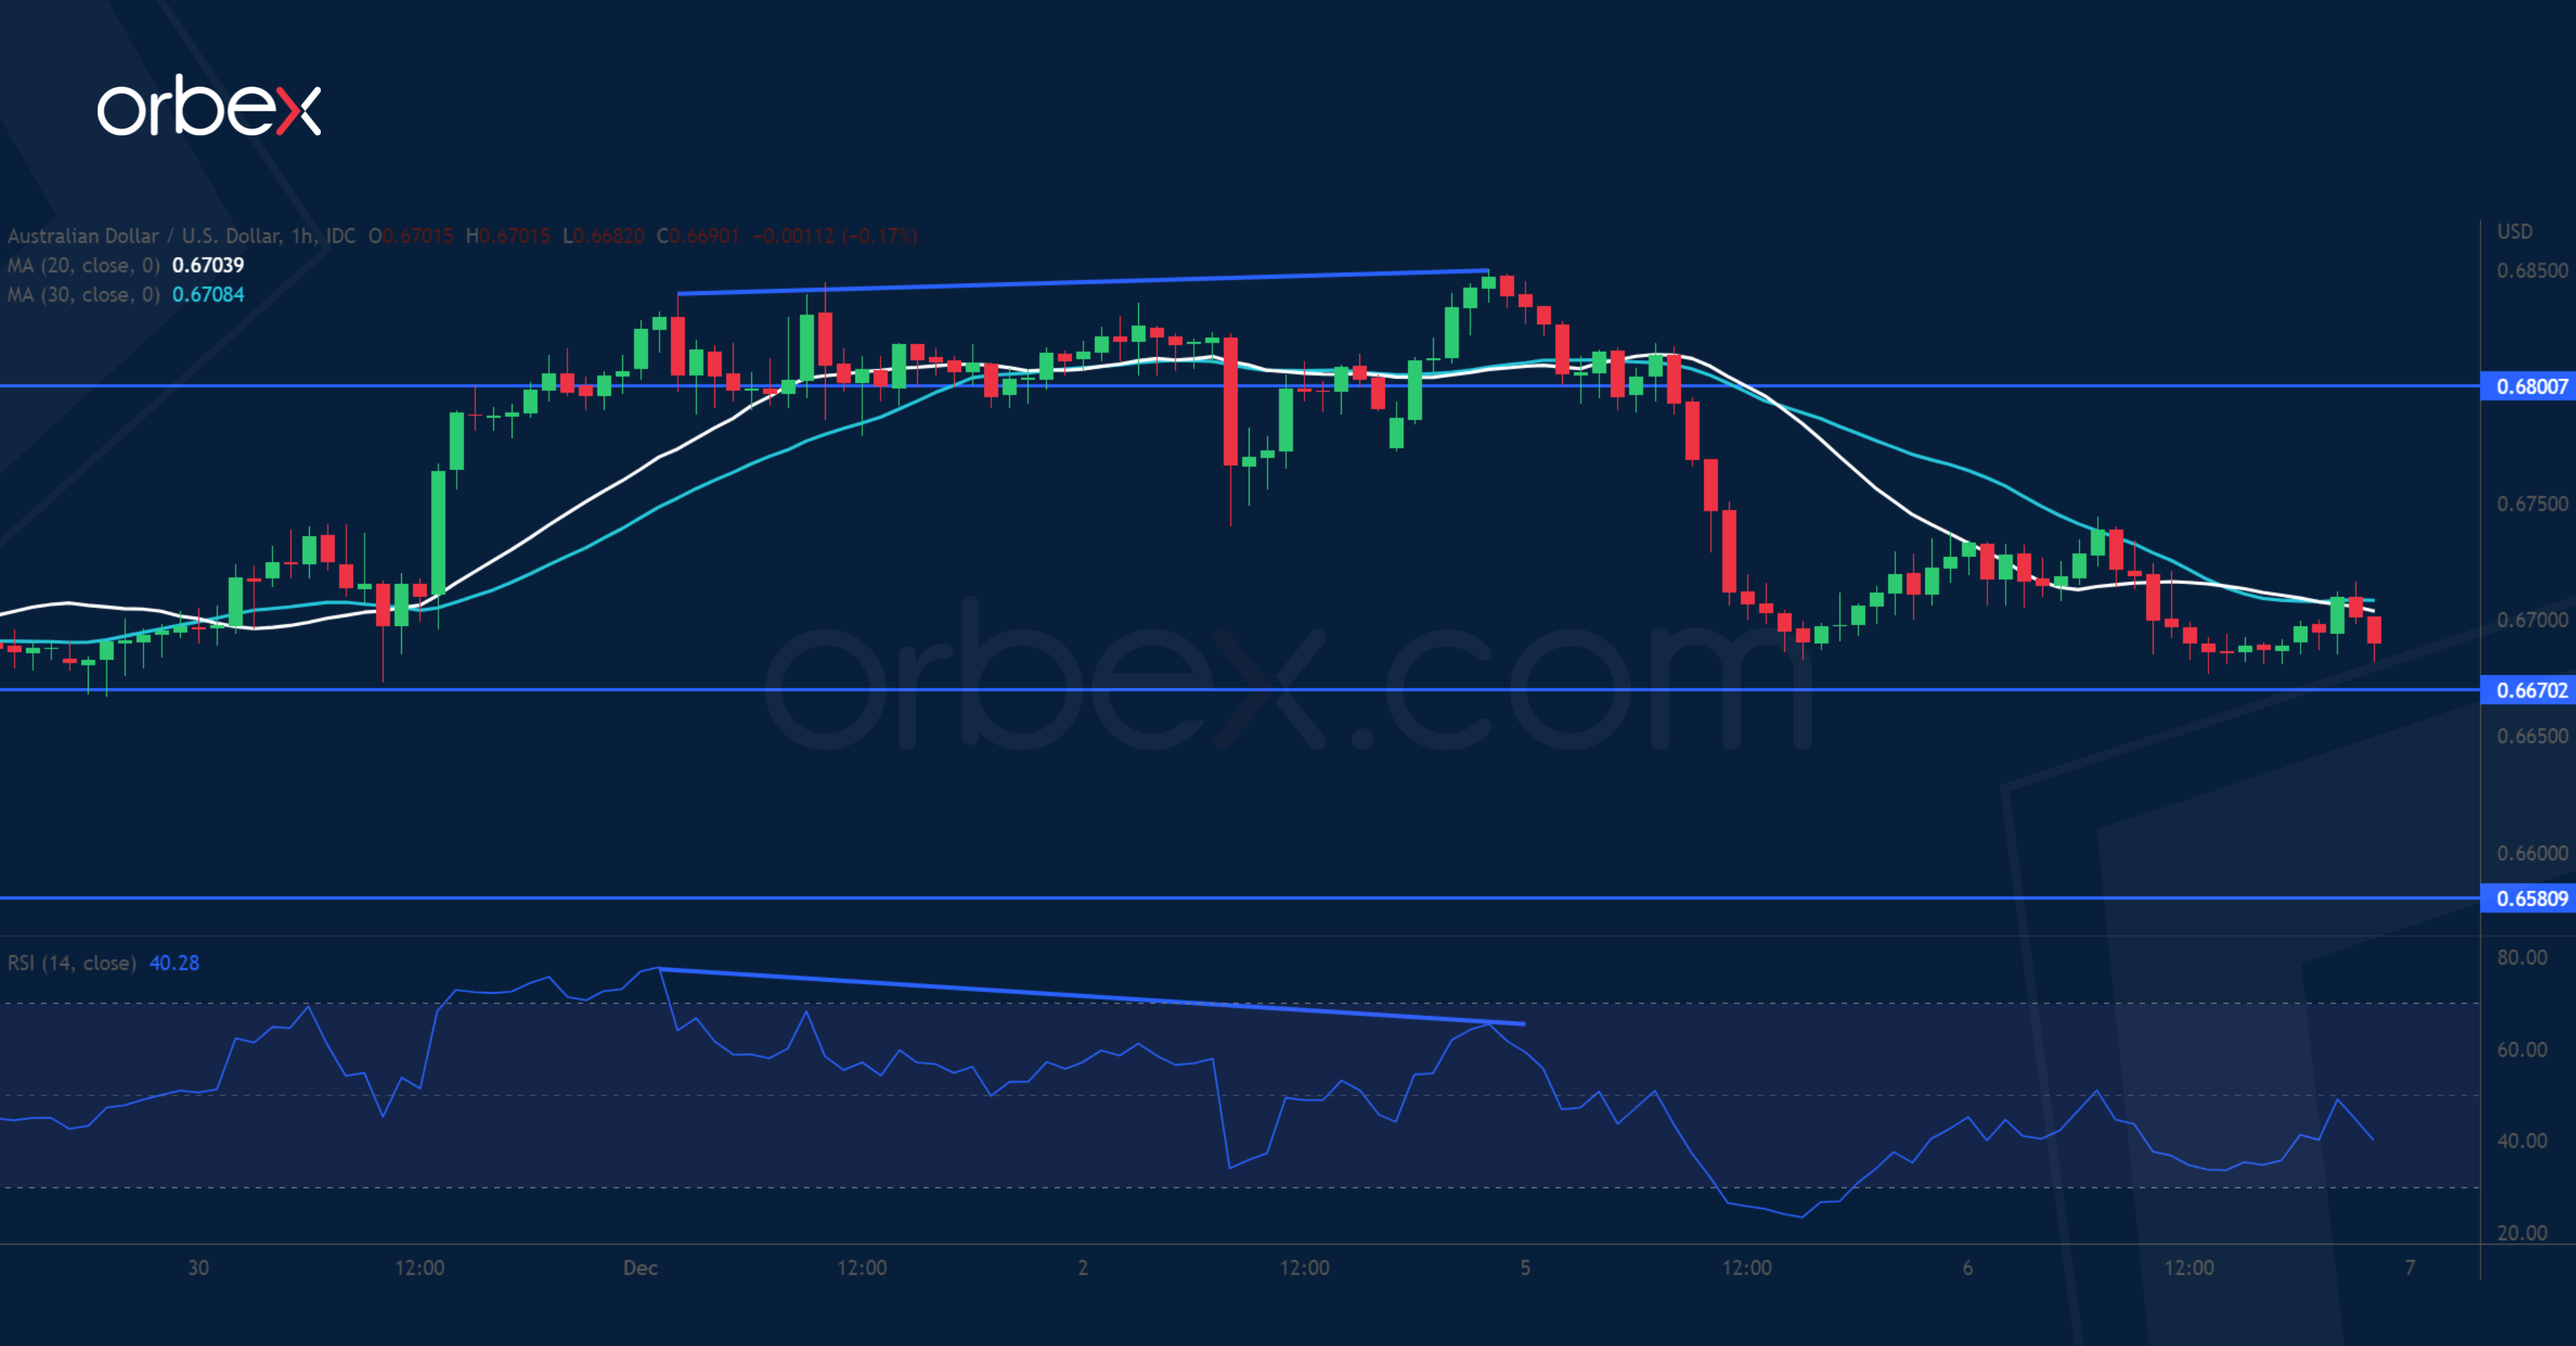
The Australian dollar softened after the RBA lifted its cash rate by 25bp as expected. On the daily chart, the pair has been grinding up along the 20-day moving average. September’s high of 0.6900 may prove to be a tough level to crack. A bearish RSI divergence indicates a slowdown in the upward momentum. An initial break below 0.6800 triggered the first round of profit-taking, turning it into a fresh resistance. 0.6670 is the immediate level to gauge follow-up interests and its breach would send the aussie to 0.6580.
EUR/USD Hits Resistance
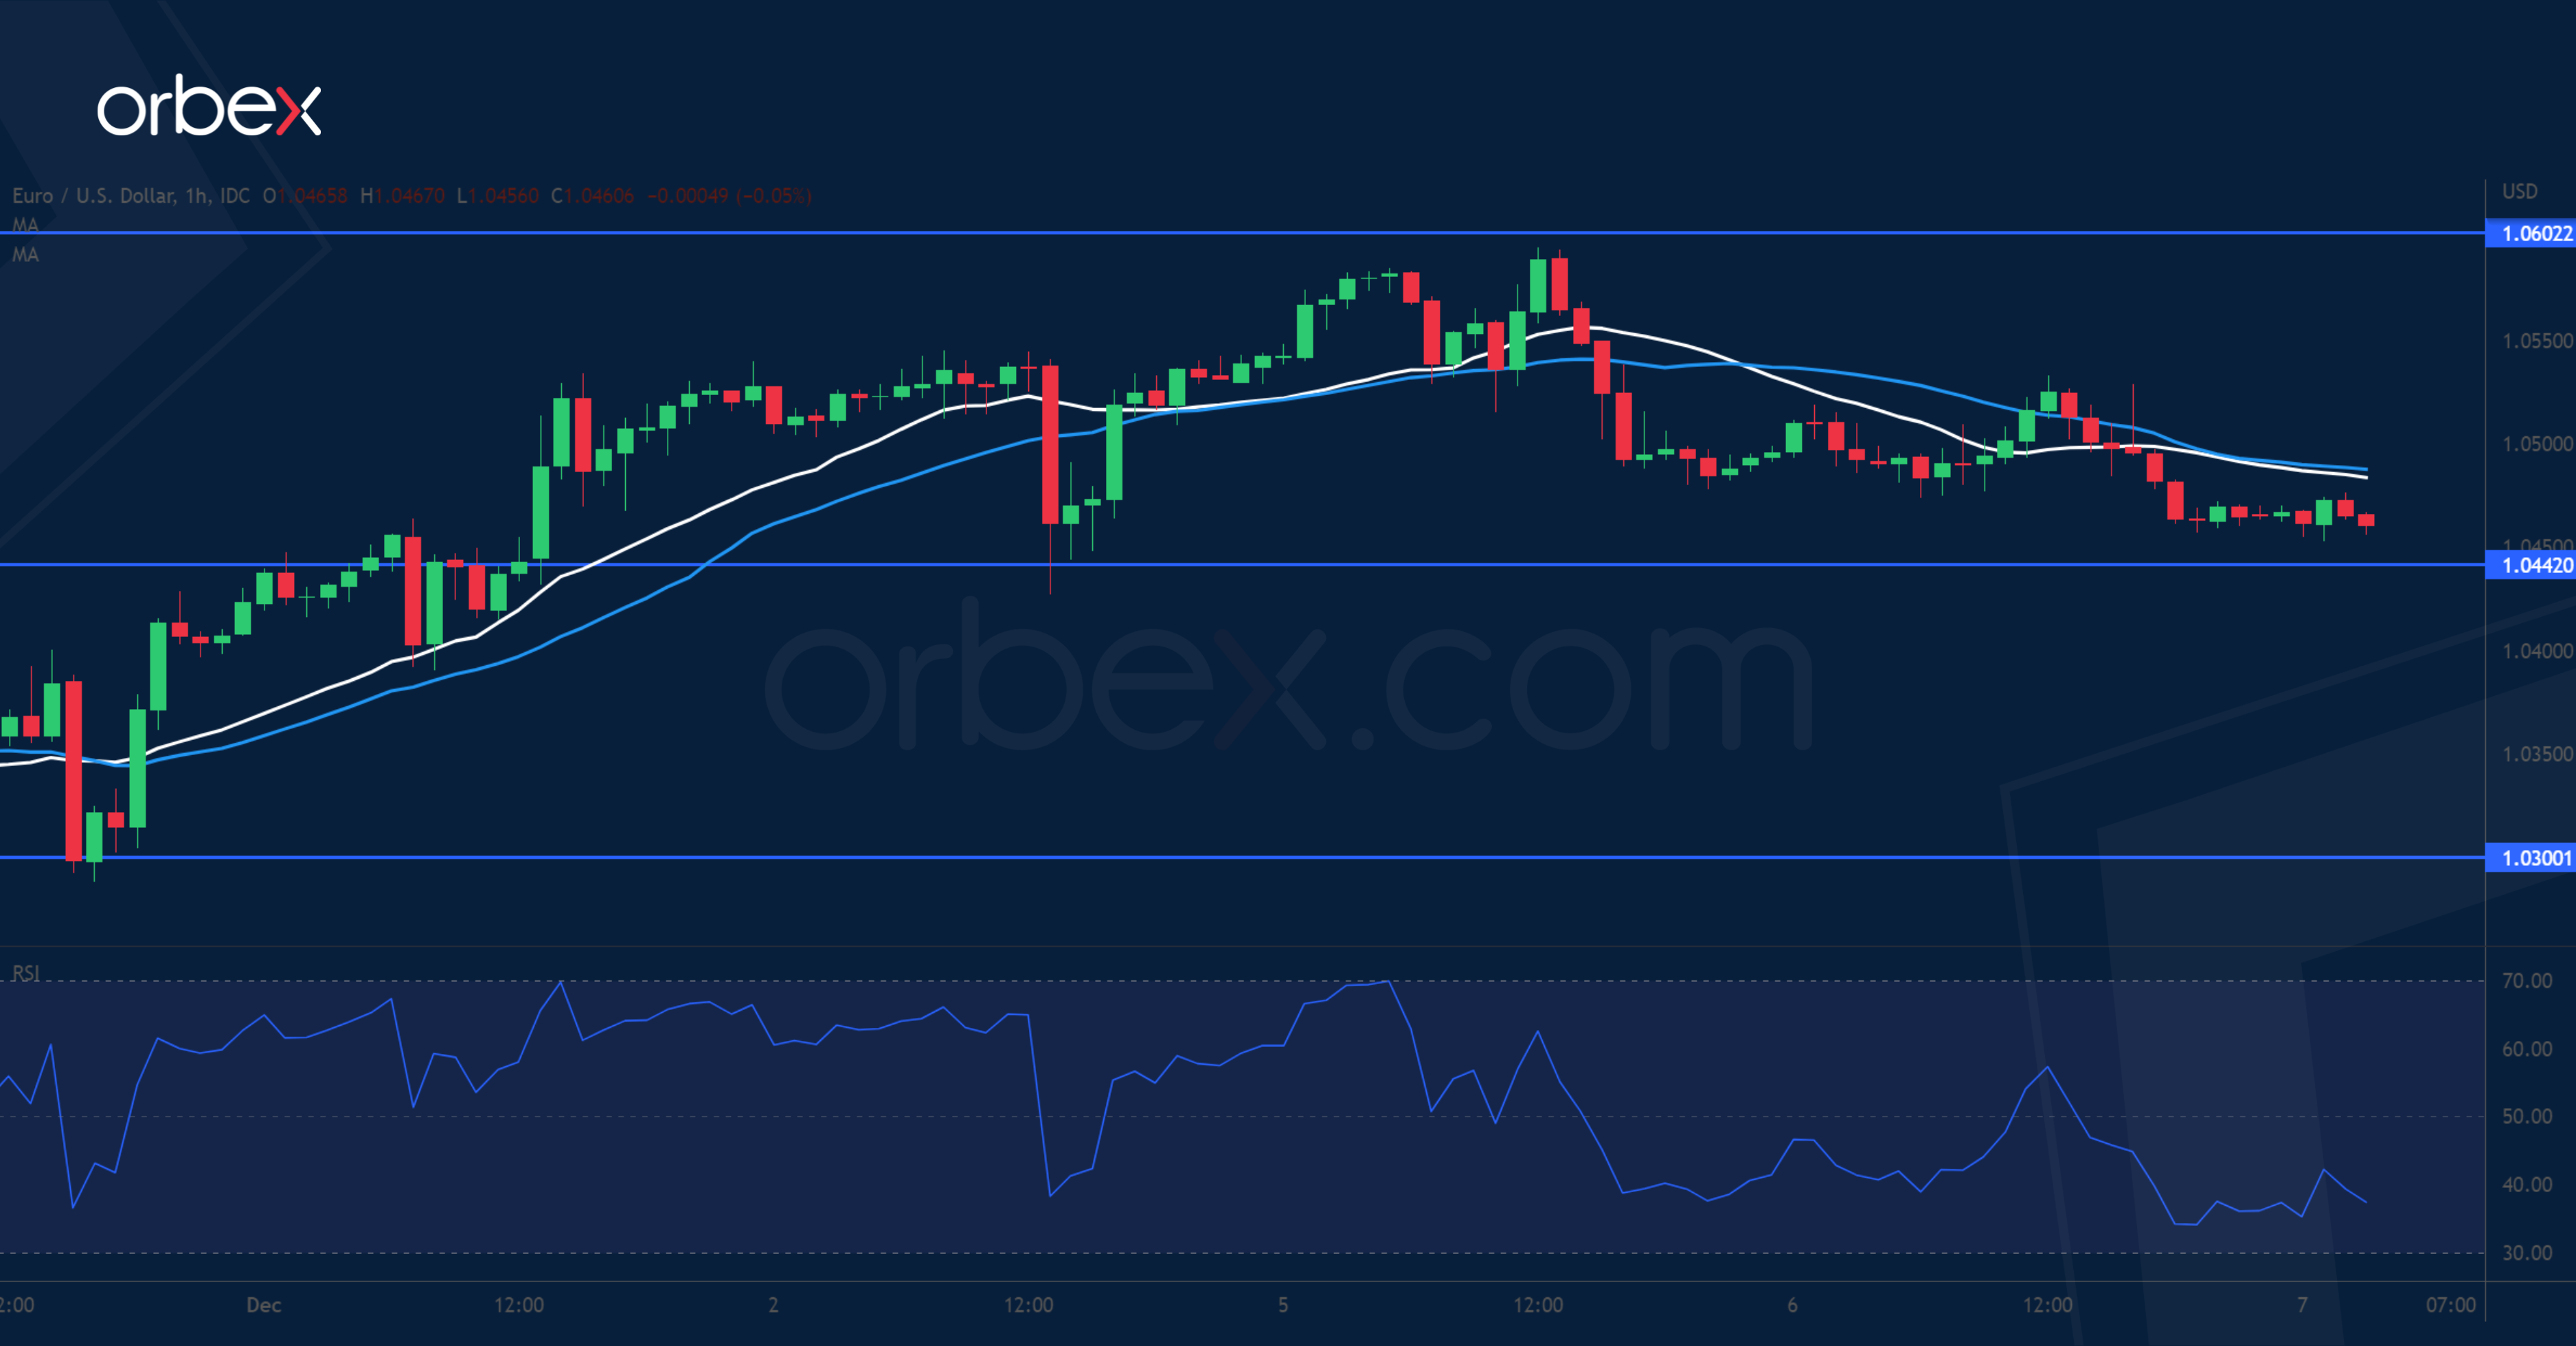
The US dollar edges higher as dovish incentives for the Fed fade amid robust data. The pair came under pressure at 1.0600 which is a supply zone from last June’s sell-off. The directional bias remains up in the short-term and the bulls may see a pullback as an opportunity to stake in. 1.0440 near the previous top is the first support. Further down, the previous daily lows of 1.0300 and 1.0220 on the 30-day moving average might counteract a deeper correction. A close back above 1.0600 could lift the euro towards 1.0800.
Looser-Covid Policy Rally on Chinese Stock Markets Fades Out
Markets
US stock markets lost more dash yesterday, ceding again up to 2% (Nasdaq) in the close and completely erasing the exaggerated reaction to last week’s dovish interpreted Fed Chair Powell speech. Technically, the S&P 500 failed to really test the September high at 4119, with first support in the 3905/3912 area now very nearby. A break lower would end the upleg in this year’s downward trend which started mid-October. Whereas stocks and bonds sold off in lockstep earlier this week, this wasn’t the case yesterday. Traditional risk dynamics were at play with risk aversion helping core bonds a hand. On top, oil prices remain in tail spin, with Brent crude crashing almost over $10/b in two sessions to the lowest levels since early January (<$80/b). Near empty eco calendars, barely any central bank talk (black periods ahead of next week’s final policy meetings) and end-of-year conditions keep investors side-lined for a second session straight. Traded volumes in US Treasuries were very low. Daily changes on the US yield curve ranged between -2 bps (2-yr) and -4.3 bps (30-yr). The US 10-yr yield holds above the previous (June) cycle high at 3.5% which serves as support together with 3.42% (50% retracement on August/October leap higher). German yields shed 5 bps (30-yr) to 8 bps (10-yr). The German 10-yr yield for now holds above the October low at 1.77% with similar 50% retracement on the Aug/Oct move higher further away at 1.61%. The trade-weighted dollar closed higher on a daily basis, but it might have been somewhat more given the risk setting. DXY ended at 105.58 from 105.16, but gently makes more headway this morning. At least two additional big figures are necessary to really call-off the downside alert. EUR/USD closed at 1.0467 from an open at 1.0491 and slides towards 1.0450 this morning. USD/JPY strange enough kept its upward bias as well, changing hands around 137.75 this morning. EUR/GBP in technical trading slowly gets further away from key support at 0.8559/67 without real news.
The looser-Covid policy rally on Chinese stock markets fades out this morning as trade data serve as a rude awakening. The trade surplus fell more than expected as the global growth slowdown bites into exports (-8.7% Y/Y) while the strict Covid policy dampens domestic demand. Imports fell by 10.6% Y/Y. Today’s eco calendar remains empty on both sides of the Atlantic with the Bank of Canada policy rate decision the key event. Markets and economists are split between a 25 bps and a 50 bps rate hike (bringing the key rate to 4% or 4.25%), but are eager to hear about the BoC’s future guidance. Governor Macklem has been amongst the most aggressive ones amongst big central banks when it comes to inflation fighting. Sticking with a tightening bias, like the RBA earlier this week, would add to our feeling that global rate markets are too complacent about central bank intentions for 2023.
News Headline
After three consecutive steps of 50 bps, the Reserve Bank of India today raised its policy rate by 35 bps, bringing it to 6.25% (5-1 majority). The move was expected by the majority of analysts. The MPC also decided (4-2 majority) to remain focused on the withdrawal of accommodation to ensure that inflation remains within the target going forward, while supporting growth. The MPC was of the view that further calibrated monetary policy action is warranted to keep inflation expectations anchored, break core inflation persistence and contain second round effects. The RBI lowered its growth forecast for the financial year 2022-23 to 6.8% from 7.0%. The forecast for inflation remains unchanged at 6.7%. The 5-y Indian bond yield rose about 7 bps to 7.18%. The Indian rupee gained marginally in a first reaction and currently trades near USD/INR 82,55.
Australian growth slowed to 0.6% Q/Q in Q3 from a 0.9% growth pace in Q2. Y/Y growth printed at 5.9% from 3.2%, but a figure north of 6.0% was expected. Household consumption (1.1% growth, 0.6% contribution) remained the main driver behind growth, but slowed from a 2.1% quarterly growth in Q2. Net exports made a small negative contribution (0.2%). Inventories added slightly positive (0.2%). The savings ratio declined from 8.3% to 6.9% and might be an indication that consumers have less spare capacity to spend as rates are rising while inflation remains high. Australian yields showed no clear direction this morning. The Aussie dollar also trades little changed near AUD/USD 0.669.
GBP/JPY Daily Outlook
Daily Pivots: (S1) 165.78; (P) 166.64; (R1) 167.13; More...
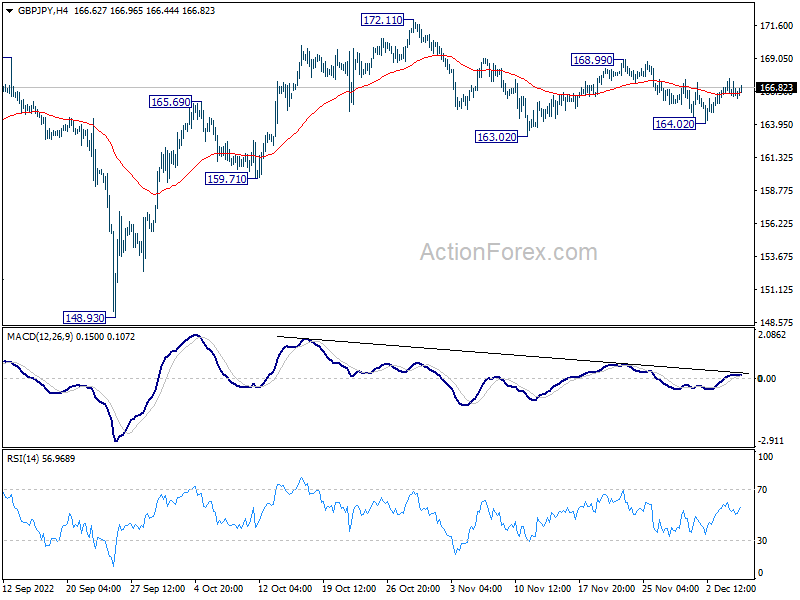
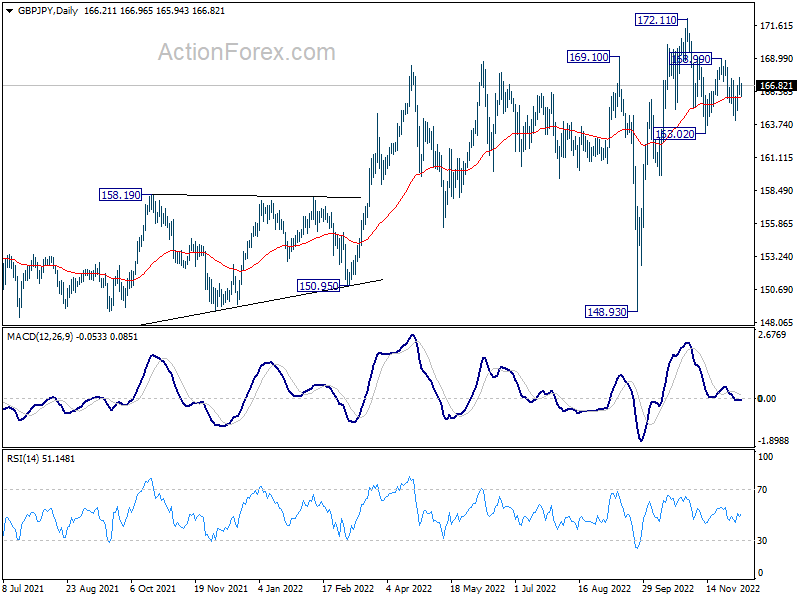
Intraday bias in GBP/JPY stays neutral at this point. On the downside, break of 164.02 should resume the whole fall from 172.11 through 163.02 support. Nevertheless, on the upside, break of 168.99 resistance will bring stronger rebound to retest 172.11 high instead.
In the bigger picture, medium term upside momentum has been diminishing as seen in bearish divergence condition in weekly MACD. Sustained break of 55 week EMA (now at 160.66) will argue that it's already correcting whole up trend from 123.94 (2020 low). Nevertheless, before that, such up trend could still extend through 172.11 high.
EUR/JPY Daily Outlook
Daily Pivots: (S1) 143.03; (P) 143.51; (R1) 143.93; More....
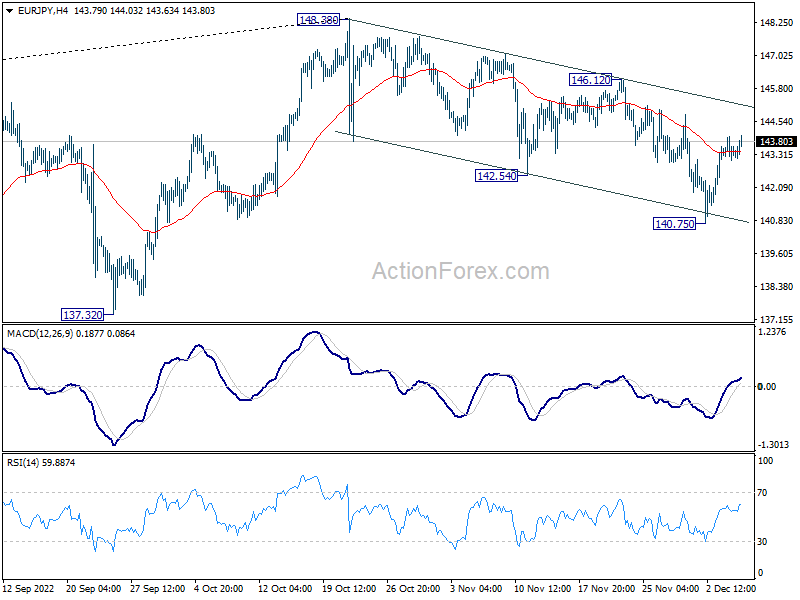
Intraday bias in EUR/JPY stays neutral at this point. Further decline could be seen as long as 146.12 resistance holds. Break of 140.75 will resume the fall from 148.38. However, break of 146.12 resistance will indicate that correction from 148.38 has completed. Bias will be back on the upside for retesting 148.38.
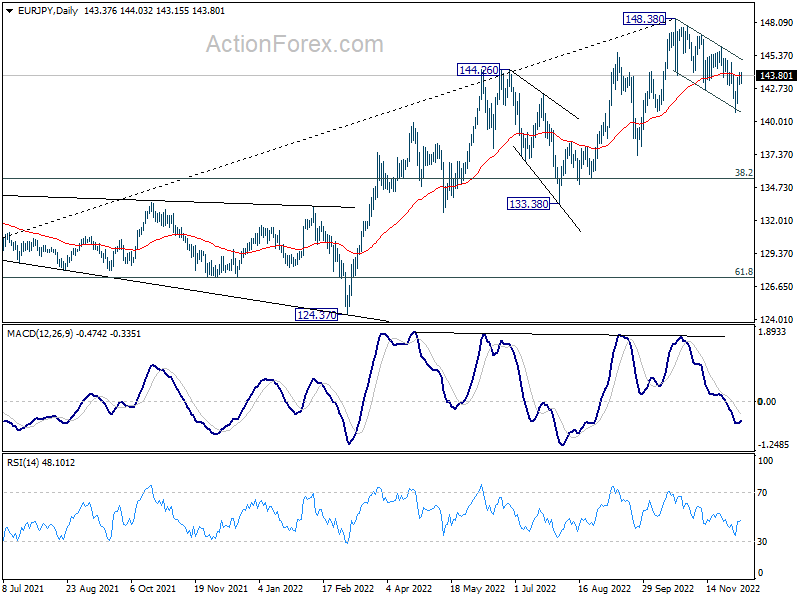
In the bigger picture, considering bearish divergence condition in weekly MACD, 148.38 could be a medium term top already. Fall from there is probably correcting whole up trend from 114.42 (2020 low). Deeper decline would be seen to 55 week EMA (now at 137.37), or further to 38.2% retracement of 114.42 to 148.38 at 135.40 before completion.
EUR/GBP Daily Outlook
Daily Pivots: (S1) 0.8591; (P) 0.8612; (R1) 0.8647; More...
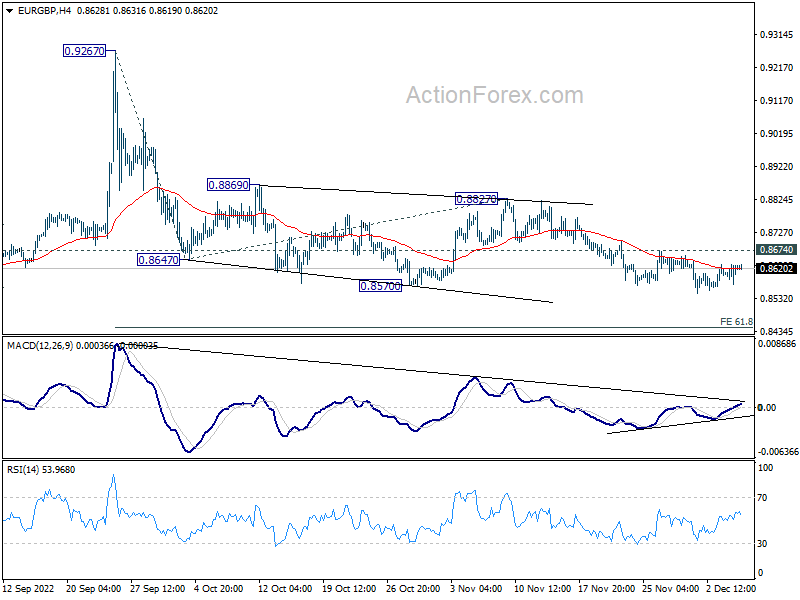
Further decline remains in favor with 0.8674 resistance intact. Current fall from 0.9267 should target 61.8% projection of 0.9267 to 0.8647 from 0.8827 at 0.8444 next. On the upside, above 0.8674 minor resistance will indicate short term bottoming, and bring stronger rebound back to 0.8827 instead.
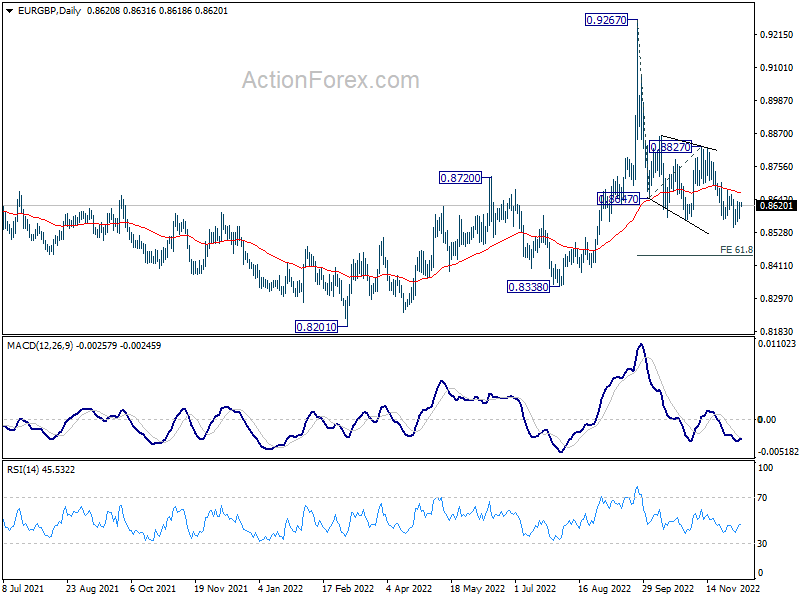
In the bigger picture, current development suggests that fall from 0.9267 is a down leg inside long term range pattern. Deeper fall could be seen towards 0.8201/8338 support zone. But strong support should be seen there to bring reversal. Nevertheless, firm break of 0.8827 resistance will turn favor to the case that such decline is merely a correction in the up trend from 0.8201. That is, further rally would be seen at a later stage through 0.9267.
EUR/AUD Daily Outlook
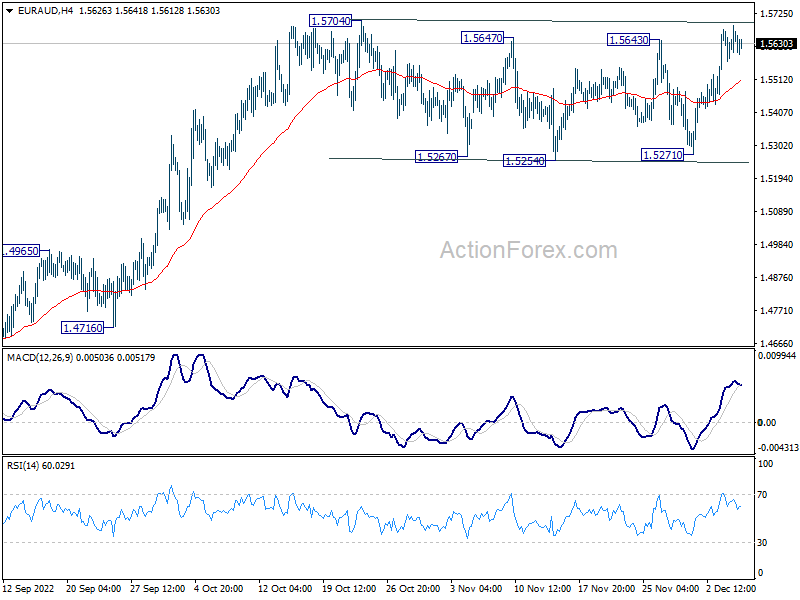
Daily Pivots: (S1) 1.5586; (P) 1.5638; (R1) 1.5701; More...
Sideway consolidation continues in EUR/AUD and intraday bias remains neutral first. In case of another fall, downside should be contained by 55 day EMA (now at 1.5360) to bring rebound. On the upside, decisive break of 1.5704 will resume larger rise from 1.4281. However, sustained trading below 55 day EMA will bring deeper correction towards 1.4965 resistance turned support.
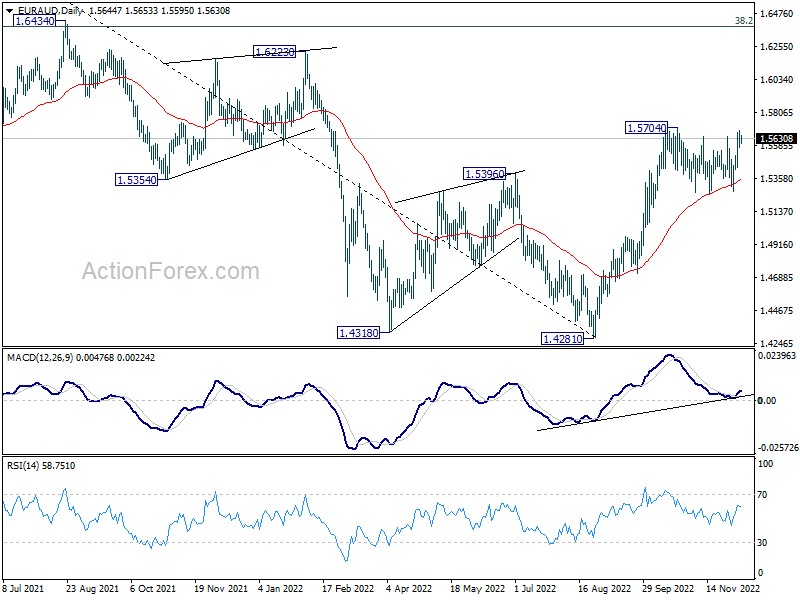
In the bigger picture, a medium term bottom should be in place at 1.4281, on bullish convergence condition in daily MACD. Further rise would be seen back to 1.6434 key resistance next. Break of 1.4965 resistance turned support is needed to indicate reversal. Otherwise, further rally will remain in favor.
EUR/CHF Daily Outlook
Daily Pivots: (S1) 0.9841; (P) 0.9875; (R1) 0.9894; More....
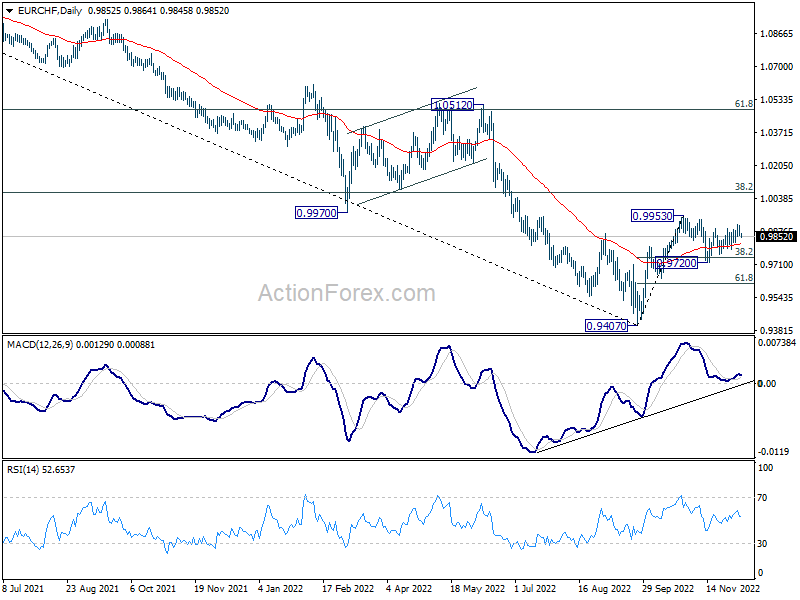
EUR/CHF is still bounded in consolidation pattern from 0.9953 and intraday bias remains neutral. On the upside, firm break of 0.9953 resistance will resume larger rally from 0.9407 to 1.0072 fibonacci level. However, break of 0.9720 will extend the decline from 0.9953 to 61.8% retracement of 0.8407 to 0.9953 at 0.9616.
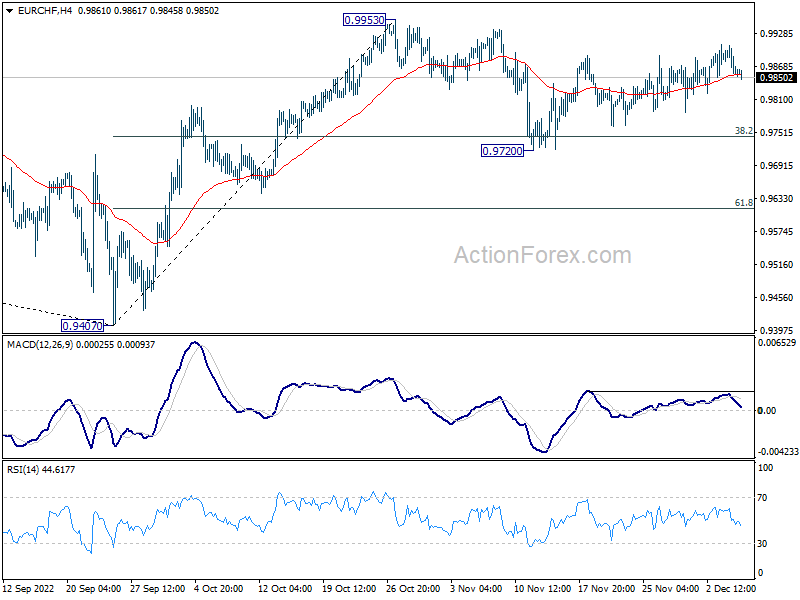
In the bigger picture, prior rejection by 0.9970 support turned resistance retains medium term bearishness. That is, while 0.9407 is a medium term bottom, price actions from there would develope into a corrective pattern rather than a reversal. Down trend resumption through 0.9407 is mildly favored at a later stage. This will remain the favored case now, as long 38.2% retracement of 1.1149 to 0.9407 at 1.0072 holds.