Sample Category Title
Euro Rises But Capped in Range Against Dollar
Euro and, to a lesser extent, Sterling, are picking up some buying today but both are stuck in range against the greenback. There is no clear unified theme in the markets. Canadian and Australian Dollar are weak, but New Zealand Dollar is strong. Swiss Franc is trailing other Europeans higher but Yen is heading down, with Dollar.
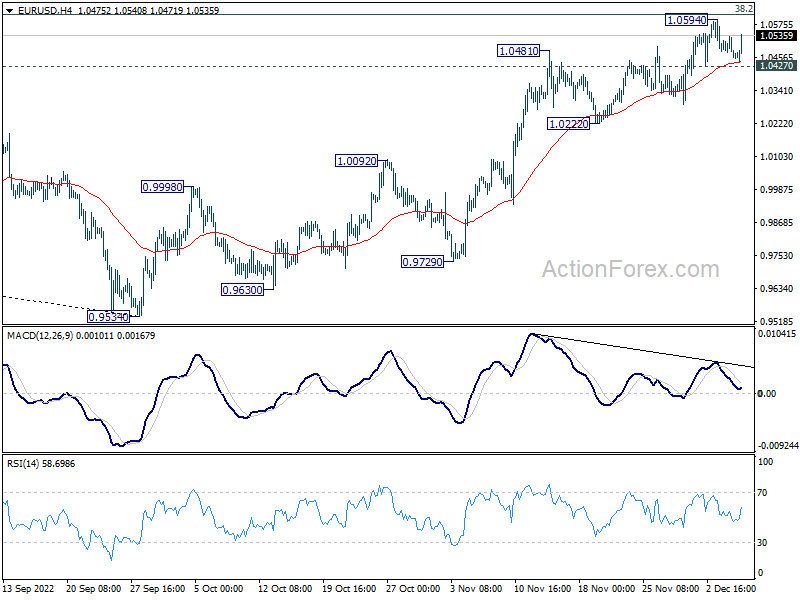
Technically, to confirm Euro's strength, EUR/USD will need to break through 1.0594 resistance to resume recent rally from 0.9534 at least. More ideally, EUR/CHF will also have to break through 0.9953 resistance to resume the rise from 0.9407. Otherwise, we'll stay skeptical about the underlying momentum.
In Europe, at the time of writing, FTSE is up 0.09%. DAX is down -0.32%. CAC is down-0.35%. Germany 10-year yield is down -0.0032 at 1.800. Earlier in Asia, Nikkei dropped -0.72%. Hong Kong HSI dropped -3.22%. China Shanghai SSE dropped -0.40%. Singapore Strait Times dropped -0.83%. Japan 10-year JGB yield rose 0.0022 to 0.255.
WTI oil hits new 2022 low as down trend resumes
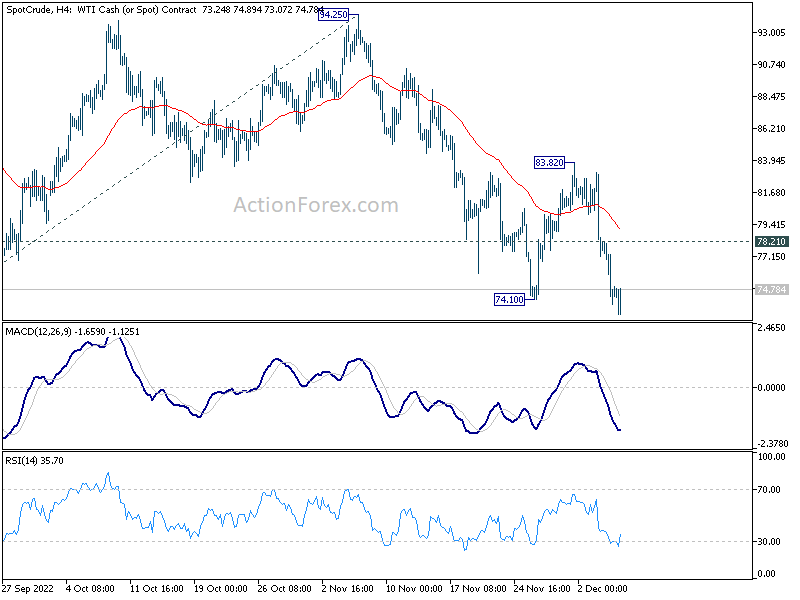
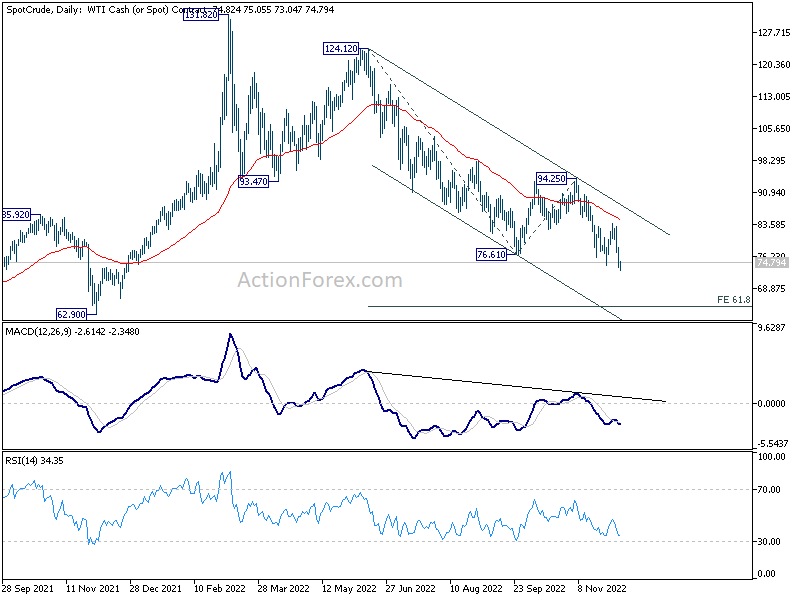
WTI oil crude oil extends recent decline and hit the lowest level for the year. Today's move is part of the selloff in reaction to OPEC+ decision to stick with their existing pace of production cut, rather then raising it. Overall risk sentiment is not helping while China's easing of pandemic restrictions is largely ignore.
With 74.10 support broke, WTI is resuming whole down trend from 131.82. Further decline is now expected as long as 78.21 minor support holds. Next target is 61.8% projection of 124.12 to 76.61. from 94.25 at 64.88. Break of 78.21 will delay the bearish case, but risk will stays on the downside with 83.82 resistance intact.
BoJ Nakamura: Inflation not accompanied by wage increases yet
BoJ board member Toyoaki Nakamura said, "recent price rises aren't accompanied by wage increases yet". He added that Japan is far from the situation where wage inflation spiral becomes a concern. The central bank needs to continue with ultra-loose monetary policy for the time being.
"Tightening monetary policy at a time when demand continues to remain lower than supply would put huge pressure on corporate and household activity," he warned.
He expects inflation to slow next year as energy and food price rises fade.
Australia AiG services fell to 45.6, deepening contraction
Australia AiG Performance of Services dropped -2.1 pts to 45.6 in November, signaling contraction for a third month. Sales rose 1.5 to 42.8. Employment dropped -6.1 to 47.8. New orders dropped -4.8 to 49.7. Input prices dropped -3.6 to 74.0. Selling prices rose 2.2 to 64.4. Average wages rose 3.8 to 68.6.
Innes Willox, Chief Executive of the national employer association Ai Group, said: "The deteriorating economic outlook is clearly weighing on Australia's services sector. The Australian PSI indicated a deepening contraction in the services sector, with three months of declining results. Steep falls in indicators for employment and new orders in November reveal weakening demand for services, while ongoing labour shortages continue to constrain the supply side."
Australia GDP grew 0.6% qoq in Q3, terms of trade deteriorated
Australia GDP grew 0.6% qoq in Q3, below expectation of 0.7% qoq. Household spending rose 1.1%, contributing 0.6% to GDP. Compensation of employees increased 3.2%, the strongest rise since December quarter 2006. Net trade detracted -0.2% from GDP, with a 2.7% increase in exports offset by a 3.9% rise in imports. The terms of trade fell -6.6%, the largest fall since June quarter 2009, as import prices increased and export prices fell.
AUD/NZD extending decline, targets 1.0437
New Zealand Dollar is clearly overwhelming its Australia counter part recently. AUD/NZD's decline continues on expectation of diverging central bank policy paths, even though tightening is expected to in the early part of next year. While RBNZ's terminal rate might be 5.50%, 4.00% looks a bit stretch for RBA based on current outlook.
As for AUD/NZD, further decline is expected as long as 1.0657 minor resistance holds. Next near term target is 100% projection of 1.1489 to 1.0883 from 1.1043 at 1.0437. Such development could retrain Aussie's rebound elsewhere.
EUR/AUD Mid-Day Outlook
Daily Pivots: (S1) 1.5586; (P) 1.5638; (R1) 1.5701; More...
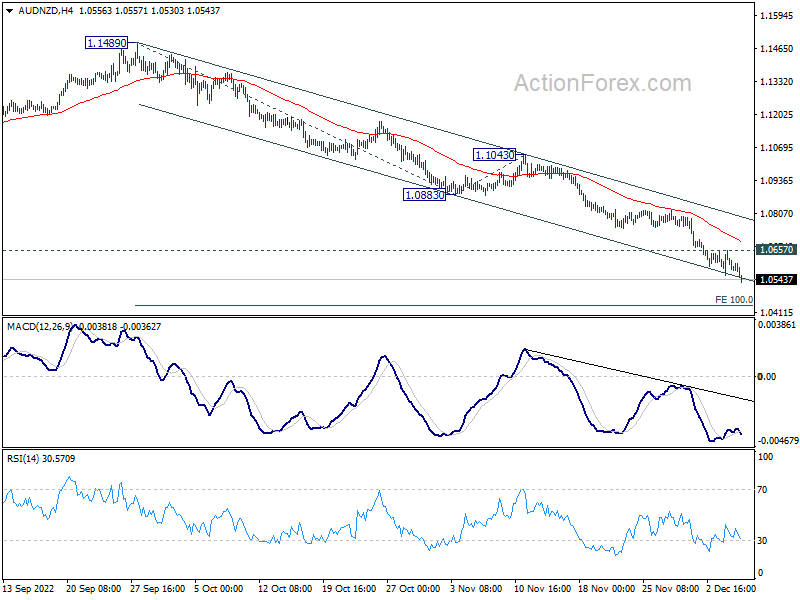
EUR/AUD's break of 1.5704 resistance indicates resumption of whole rise from 1.4281. Intraday bias is back on the upside. Next target is 61.8% projection of 1.4281 to 1.5704 from 1.5271 at 1.6150. For now, near term outlook will remain bullish as long as 1.5271 support holds, in case of retreat.
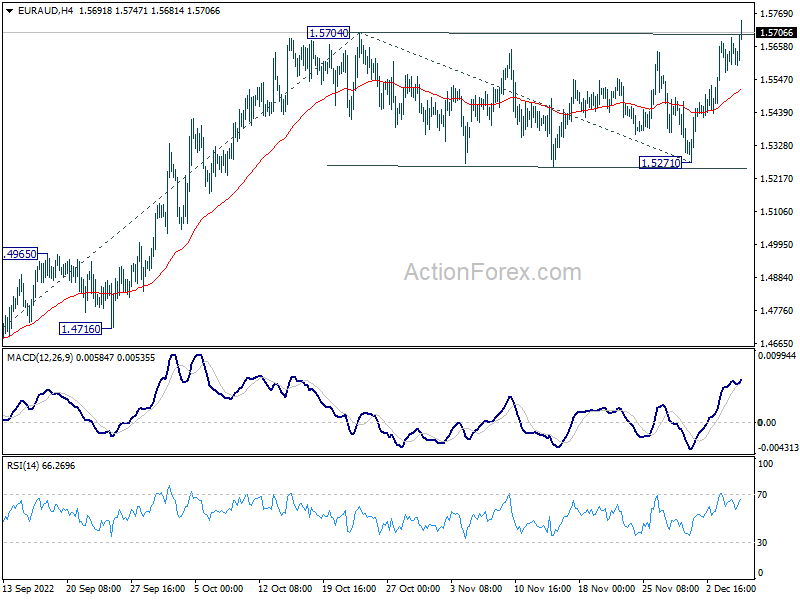
In the bigger picture, a medium term bottom should be in place at 1.4281, on bullish convergence condition in daily MACD. Further rise would be seen back to 1.6434 key resistance next. Break of 1.5271 support is needed to indicate reversal. Otherwise, further rally will remain in favor.
Economic Indicators Update
| GMT | Ccy | Events | Actual | Forecast | Previous | Revised |
|---|---|---|---|---|---|---|
| 21:30 | AUD | AiG Performance of Services Index Nov | 45.6 | 47.7 | ||
| 00:30 | AUD | GDP Q/Q Q3 | 0.60% | 0.70% | 0.90% | |
| 03:00 | CNY | Trade Balance (USD) Nov | 69.8B | 79.1B | 85.2B | |
| 03:00 | CNY | Exports (USD) Y/Y Nov | -8.70% | -3.50% | -0.30% | |
| 03:00 | CNY | Imports (USD) Y/Y Nov | -10.60% | -6.00% | -0.70% | |
| 03:00 | CNY | Trade Balance (CNY) Nov | 494B | 580B | 587B | |
| 03:00 | CNY | Exports (CNY) Y/Y Nov | 0.90% | 7% | ||
| 03:00 | CNY | Imports (CNY) Y/Y Nov | -1.10% | 4.10% | 6.80% | |
| 05:00 | JPY | Leading Economic Index Oct P | 99 | 96.6 | 97.5 | |
| 06:45 | CHF | Unemployment Rate Nov | 2.00% | 2.10% | 2.10% | |
| 07:00 | EUR | Germany Industrial Production M/M Oct | -0.10% | -0.60% | 0.60% | |
| 07:45 | EUR | France Trade Balance (EUR) Oct | -12.2B | -15.9B | -17.5B | -17.2B |
| 08:00 | CHF | Foreign Currency Reserves (CHF) Nov | 790B | 817B | ||
| 09:00 | EUR | Italy Retail Sales M/M Oct | -0.40% | 0.10% | 0.50% | |
| 10:00 | EUR | Eurozone GDP Q/Q Q3 F | 0.30% | 0.20% | 0.20% | |
| 10:00 | EUR | Eurozone Employment Change Q/Q Q3 F | 0.30% | 0.20% | 0.20% | |
| 13:30 | USD | Nonfarm Productivity Q3 | 0.80% | 0.30% | 0.30% | |
| 13:30 | USD | Unit Labor Costs Q3 | 2.40% | 3.50% | 3.50% | |
| 15:00 | CAD | BoC Interest Rate Decision | 4.25% | 3.75% | ||
| 15:30 | USD | Crude Oil Inventories | -3.5M | -12.6M |
AUD/NZD extending decline, targets 1.0437
New Zealand Dollar is clearly overwhelming its Australia counter part recently. AUD/NZD's decline continues on expectation of diverging central bank policy paths, even though tightening is expected to in the early part of next year. While RBNZ's terminal rate might be 5.50%, 4.00% looks a bit stretch for RBA based on current outlook.
As for AUD/NZD, further decline is expected as long as 1.0657 minor resistance holds. Next near term target is 100% projection of 1.1489 to 1.0883 from 1.1043 at 1.0437. Such development could retrain Aussie's rebound elsewhere.
WTI oil hits new 2022 low as down trend resumes
WTI oil crude oil extends recent decline and hit the lowest level for the year. Today's move is part of the selloff in reaction to OPEC+ decision to stick with their existing pace of production cut, rather then raising it. Overall risk sentiment is not helping while China's easing of pandemic restrictions is largely ignore.
With 74.10 support broke, WTI is resuming whole down trend from 131.82. Further decline is now expected as long as 78.21 minor support holds. Next target is 61.8% projection of 124.12 to 76.61. from 94.25 at 64.88. Break of 78.21 will delay the bearish case, but risk will stays on the downside with 83.82 resistance intact.
GBPCHF Wave Analysis
- GBPCHF reversed from resistance level 1.1530
- Likely to fall to support level 1.1330
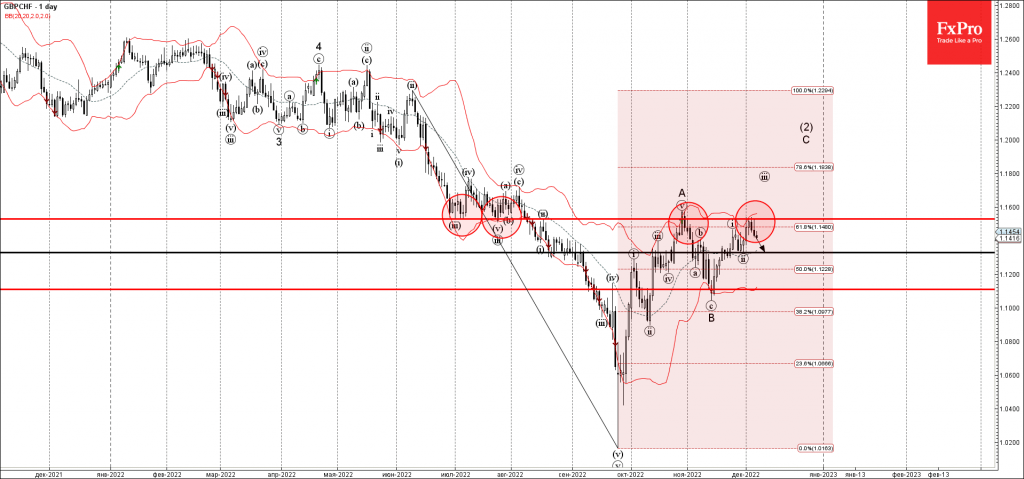
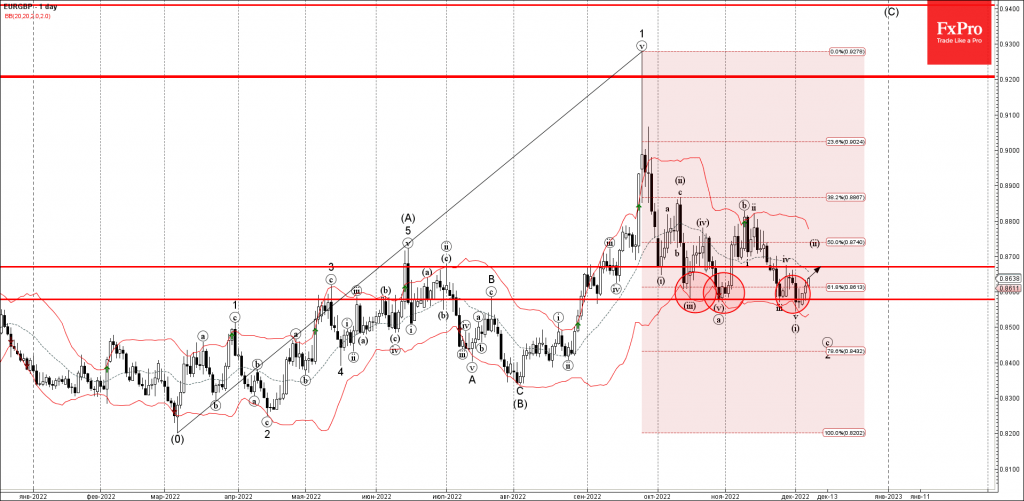
GBPCHF recently reversed down from the powerful resistance level 1.1530 (former double bottom from July), strengthened by the upper daily Bollinger Band and the 61.8% Fibonacci correction of the downward impulse from June.
The downward reversal from the resistance level 1.1530 stopped the earlier short-term impulse waves (iii) and C.
GBPCHF can be expected to fall further toward the next support level 1.1330 (low of the previous minor correction (ii)).
EURGBP Wave Analysis
- EURGBP reversed from support level 0.8580
- Likely to rise to resistance level 0.8670
EURGBP recently reversed up from the key support level 0.8580 (which has been reversing the price from the start of September), standing near the lower daily Bollinger Band.
The upward reversal from the support level 0.8580 started the active short-term correction (ii) – which belongs to wave (c) from the start of November.
EURGBP can be expected to rise further toward the next resistance level 0.8670 (top of the previous minor correction iv).
All Eyes on the Bank of Canada
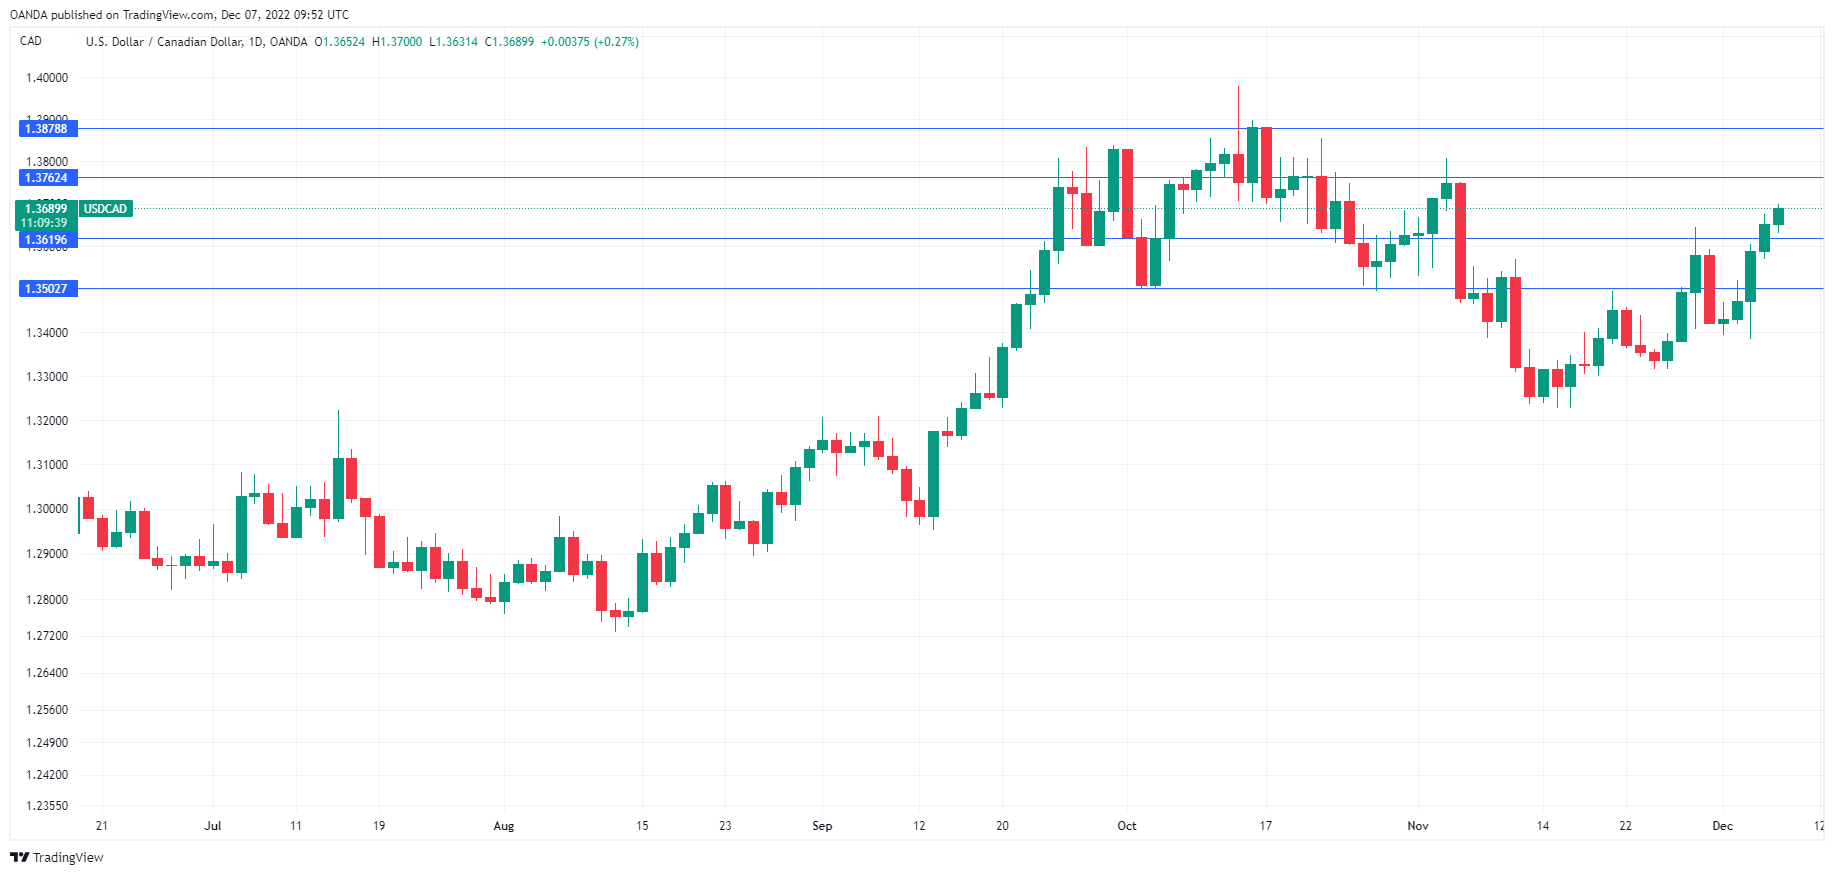
The Canadian dollar has edged lower on Wednesday. In the European session, USD/CAD is trading at 1.3686, up 0.25%. December has started on the wrong foot, as the Canadian dollar is yet to post a winning session.
Will BoC push the 25 or 50 button?
The Bank of Canada hasn’t hesitated to put the rate pedal to the floor, as it continues to battle high inflation. In July, the BoC raised rates by a full point but has been gradually easing since then, delivering a 75 bp hike followed by a 50 bp increase. Will the easing trend continue at today’s policy meeting? The markets have priced in a 72% likelihood of a 25 bp move, which would bring the cash rate to an even 4.0%. A 50-bp hike would be considered a surprise hawkish move and would likely give the Canadian dollar a boost.
The previous meeting in October was also live, with a 50/50 split over whether the BoC would raise rates by 50 or 75 bp. In the end, the BoC opted for the smaller hike, with Governor Macklem warning that he expected a ‘significant slowing of the economy to occur’. Investors will be keeping an eye on the rate statement and Macklem’s follow-up presser to see if his view has changed or not. Inflation was unchanged in October at 6.9% but is well below the 8.1% clip in June. Macklem’s comments about the health of the economy and the direction of inflation could affect the movement of the Canadian dollar.
With the New Year just around the corner, what can we expect from the BoC in 2023? The terminal rate is projected at around 4.5%, which would mean several more rate hikes early next year. Of course, rate policy will be heavily dictated by key data such as employment, consumer spending and inflation. In addition, the BoC will want to keep pace (or close to it) with the Federal Reserve, which is widely expected to raise rates by 50 bp next week, to prevent the Canadian dollar from falling further.
USD/CAD Technical
- There is resistance at 1.3762 and 1.3879
- USD/CAD has support at 1.3619 and 1.3502
Covid Lockdowns Hinders China’s Trade
Last month, China’s harsh lockdown measures negatively impacted foreign trade. Exports fell by 8.7% YoY; imports lost 10.6% YoY. Economists, on average, were expecting half the rate of decline. Trade surplus shrank to $69.84B in November from $85.15B a month earlier and is much weaker than the forecasted $79B.
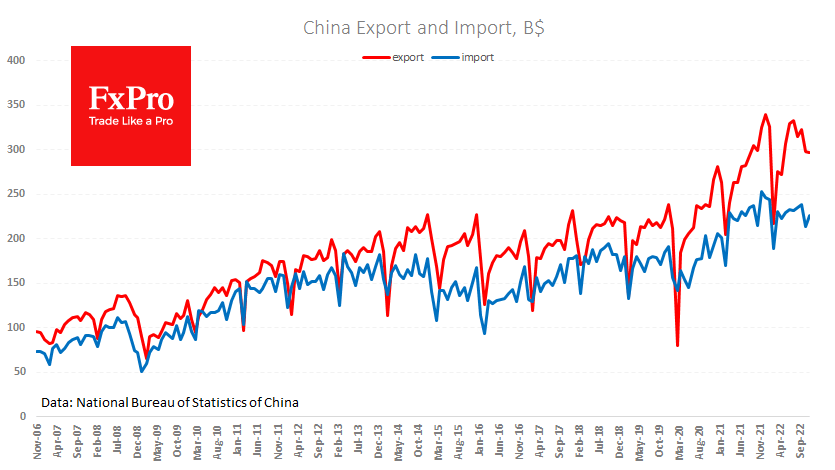
Overall, the figures are far from disastrous. Cumulatively, over 11 months, exports are up 9.1%, and imports are up 2%, marking a slowdown but not yet a decline. This is the high price of tight travel restrictions, easing gently in recent weeks. The loosening of these restrictions looks more like a concern for the economy but not a concession to protesters.
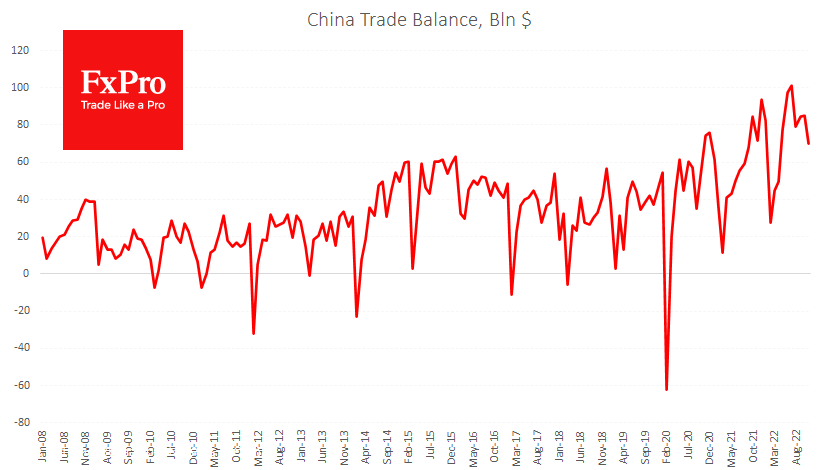
China’s foreign trade decrease in November should also be seen as a sign of how monetary tightening and the severity of energy prices in Europe are hurting the economy. For markets, such data is a new reason to reduce risk appetite, which we see early on Wednesday. Also, since the beginning of the week, the offshore renminbi has stabilised just below 7.0 to the dollar after an impressive 5.5% increase during November.
The released batch of data may be followed by further easing the zero- covid policy to avoid unnecessarily restraining of the economy. Still, it is also possible that we will see further monetary policy easing (good for the stocks and bad for the renminbi).
NZDUSD in a Wait-and-See Mode
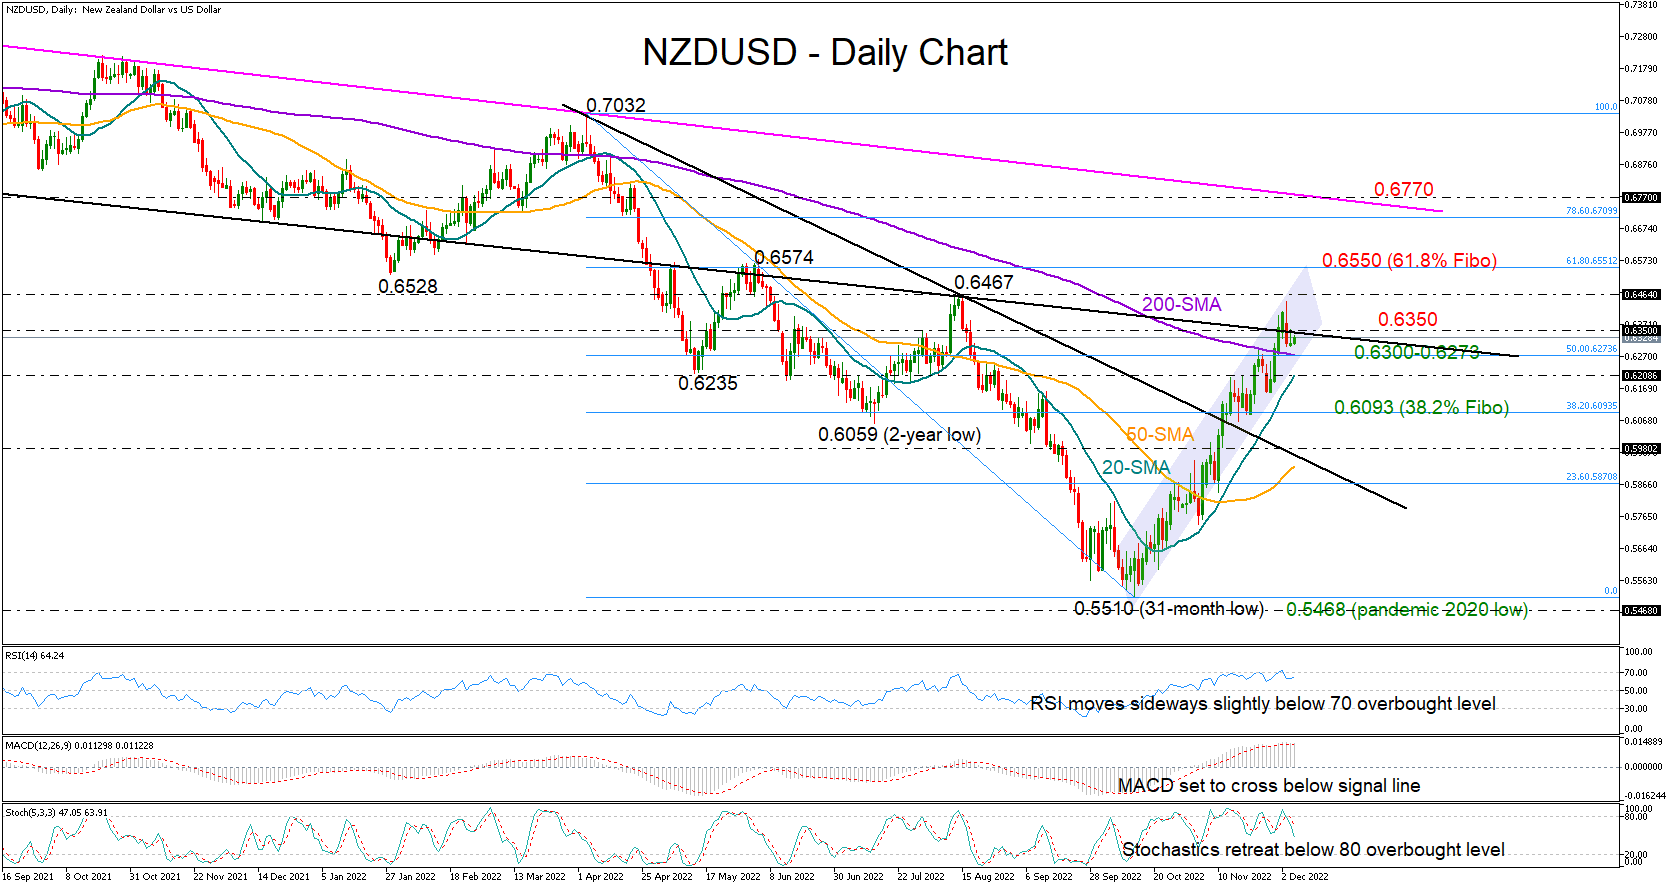
NZDUSD came under pressure marginally below the August high of 0.6467 at the start of the week, having gained almost 15% since the bottom at a 31-month high of 0.5510 in mid-October.
Market sentiment may remain tepid, according to the momentum indicators. With the RSI losing steam near its 70 overbought mark, the stochastics struggling to post new highs above 80, and the MACD set to cross below its red signal line, a downside correction cannot be ruled out.
The bearish scenario, however, may not come into play unless the price retreats below the 0.6300 round-level and the 200-day simple moving average (SMA), which currently overlaps with the 50% Fibonacci retracement of the 0.7032-0.5510 downleg. The 20-day SMA could next support the market around 0.6212. If selling forces dominate, the decline could stretch towards the 38.2% Fibonacci of 0.6093.
Alternatively, a close above the 0.6350 barrier could get an extension towards the August resistance area of 0.6467. Slightly higher, the 61.8% Fibonacci of 0.6550 could be another spot to keep a close eye. A successful move above that bar may stage a quick rally towards the crucial long-term descending trendline that joins all the highs from February 2021 at 0.6770.
In brief, NZDUSD is in a neutral mode in the short-term picture, waiting for a new direction either above 0.6350 or below 0.6300-0.6273.
USDJPY Advances after the Rebound Off the 200-day SMA
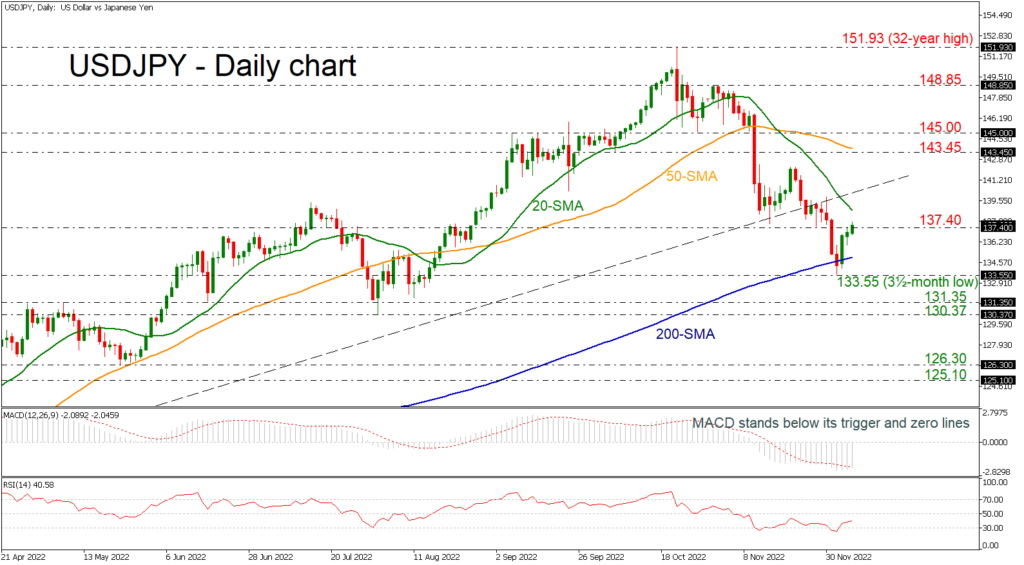
USDJPY recently bounced off the 200-day simple moving average (SMA) after the fall towards the three-and-half-month low of 133.55. The price is trying to create a bullish correction as in the short-term timeframe the bias is bearish.
Technically, the MACD is gaining some momentum above its trigger line in the negative region, while the RSI is sloping slightly upwards to confirm the recent upside movement. However, the 20- and 40-day SMAs are still moving down, approaching the current market price.
Should the price move up, the 20-day SMA at 138.75, which the bears were unable to break the last month, could provide immediate resistance. Moving higher, the focus will shift to the 143.45-145.00 area, which encapsulates the 50-day SMA.
In the alternative scenario, traders would eagerly be looking for a break lower, meeting the 200-day SMA at 135.00. If that’s the case, the rally could last until the 133.55 barrier, ahead of the 130.37-131.35 support zone, confirming the near-term bearish outlook.
Summarizing, USDJPY has been negative over the last one-and-a-half-months despite the latest upside movement. Any moves beneath the 200-day SMA may change the broader outlook to bearish as well.
USD/JPY: Recovery Gains Pace But Needs More Evidence for Reversal Signal
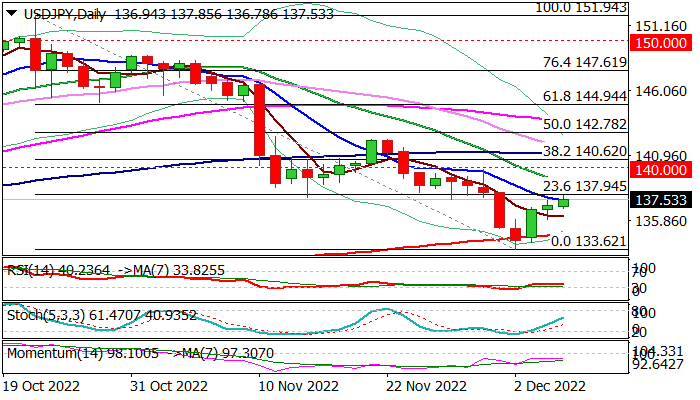
The USDJPY advances for the third consecutive day and cracks initial barrier at 137.94 (Fibo 23.6% of 151.94/133.62 descend).
The dollar received fresh boost from renewed warnings from economists that the US economy is heading into recession, despite recent encouraging signals from solid US economic data which revived hopes that the largest world economy may skip recession.
Recovery emerged after a bear-trap under ascending 200DMA, with initial signals of reversal pattern forming on daily chart, though bulls would require more evidence, as overall structure is still bearish.
Break of 137.94 would generate initial bullish signal which would require lift above pivotal barriers at 140.00/60 (psychological / Fibo 38.2% of 151.94/133.62) to sideline short-term bears.
Broken 5DMA (136.17) marks initial support which should keep the downside protected and maintain bear-term bullish bias.
Caution on drop below 200DMA (134.83) loss of which would signal bearish continuation.
Res: 137.94; 138.81; 140.00; 140.62
Sup: 136.78; 136.17; 134.83; 133.62