

Sample Category Title
Elliott Wave View: Oil (CL) Extending Lower in Wave 5
Short term Elliott Wave View in Oil (CL) suggests that the cycle from 6.13.2022 high is in progress as a 5 waves impulse. Down from 6.13.2022 high, wave (1) ended at 76.25 and rally in wave (2) ended at 93.74. Oil then resumes lower in wave (3) towards 73.6. Wave (4) corrective rally is in the form of a zigzag Elliott Wave structure. Up from wave (3) low on 11.28.2022, wave A ended at 79.65 and pullback in wave B ended at 77.08. Final leg higher wave C ended at 83.34 which also completed wave (4). Wave C of (4) ended at the 100% – 161.8% extension of wave A at 83.34 – 86.86.
Oil has resumed lower in wave (5). Internal subdivision of wave (5) is in the form of an impulse. Down from wave (4), wave ((i)) ended at 80.38 and rally in wave ((ii)) ended at 82.72. The commodity then resumed lower in wave ((iii)) towards 76.77 and wave ((iv)) ended at 77.88. Expect wave ((v)) to end soon which should complete wave 1 in higher degree. Afterwards, it should rally in wave 2 to correct cycle from 12.1.2022 high before the decline resumes. Near term, as far as pivot at 83.34 high stays intact, expect rally to fail in 3, 7, or 11 swing for further downside.
Oil 60 Minutes Elliott Wave Chart
https://www.youtube.com/watch?v=Ij0E7ME1XGc
Equities, Oil Fall, Brent Below $80pb for the First Time Since January
Equities extend the downside recovery, following the failure to clear an important year-to-date resistance last week, which was the S&P500’s year-to-date descending channel top at around the 4080 level. The index cleared the first bearish target, at 3956 level, the minor 23.6% retracement on the latest rebound and tested its 100-DMA to the downside, but managed to close above that level. Nasdaq slumped 2%, with Apple retreating more than 2.50% while Amazon lost 3% as investors dumped technology stocks faster than the others.
And even oil giants joined the selloff this week. Exxon lost more than 2.50% both on Monday and on Tuesday, as the latest drop in oil prices didn’t help improve the mood.
The American crude lost more than 7% since the weekly open. If Monday’s fall was mostly driven by a global market selloff, yesterday’s selloff was definitely due to the EIA revising its oil production forecast higher for next year, after having cut this prediction for the past five months.
So, now, the EIA expects the US to pump around 12.34 mio barrels per day in 2023, approaching the historical high production of 2019.
Yesterday’s selloff sent the barrel of Brent crude below the $80 mark for the first time since the very beginning of this year, and pulled the barrel of American crude a couple of cents below the late November dip, at around $73.40. And even the API data – which showed a 6.4-mio-barrel drop in US oil inventories couldn’t bring the oil bulls in. The more official EIA data is due today. Trend and momentum indicators hint that the recession fears could well push the barrel of oil toward the $70pb despite falling oil reserves in the US.
Russian oil price cap is a warning for OPEC
What’s good about the falling oil prices is that the Russian oil cap becomes somehow meaningless as prices fall, though the Europeans said to revise the cap every two months. For now, there is not much to worry apart from a couple of vessels carrying Russian oil that are stuck near Turkey as Turks ask insurance apparently to let them sail away.
But here is the thing. The fact that the G7, the EU and Australia agreed to cap the price of Russian oil gave a strong message to the rest of the oil producers: they could do the same with OPEC.
So far, US President Joe Biden reassured OPEC that this is not a ‘buyers’ league’ and that the decisions apply only to Russia. But we can’t stop thinking that if OPEC goes severely against the US’ will to stop messing around with oil prices, there is no reason we won’t see a buyers’ league emerge from the darkness.
Sour Risk Sentiment and China Eases COVID-19 Restrictions
Market movers today
Today we get German industrial production data for October. Consensus is looking for a 0.6% m/m drop compared to a similar increase in September. Final Q3 GDP data from the euro area is also out and expected to confirm that the euro area economy kept its head above water in Q3.
Sweden releases industrial orders, household consumption and GDP indicator for October. Production figures have held up but both NIER and PMIs point to a slowdown with weak order inflow, which should start to show up in the production figures. The decline in household consumption should continue and probably accelerate and this will probably show up in the GDP figure as well. Q3 GDP came out stronger than we had anticipated and today's release will give the first indication of growth in Q4.
Industrial production data is also out from Norway.
On the central bank front, ECB's Lane and Panetta are due to speak ahead of the seven-day quiet period into the December 15-meeting.
The 60 second overview
China: The Chinese health authorities this morning announced that they will allow the use of home quarantine for some Covid patients and scrap test requirements for most public venues. In all, 10 new measures were introduced immediately. This is the second round of easing of Covod restrictions in China. When the first easing was introduced in November it spurred a strong rally in Chinese equities. Hang Seng is up 1.2% this morning as most other markets are in red.
Risk sentiment: The 'rate fears' and US investment banks warning about job cuts and slower growth ahead weighed on risk sentiment yesterday. US stocks ended in red with Nasdaq taking the lead down 2.4%.
US yield inversion intensify. The sour risk sentiment supported US treasuries and 10Y yields dropped 6bp to 3.52% - a level last seen in September. The 2s10s US treasury curve continues to invert, the clearest market signal that a recession is on its way. The inversion is now at 82bp. A level only exceeded by the inversion of 1978 and 1982, when Fed Chairman Volcker hiked policy rates aggressively to counter double-digit inflation. He succeeded in bringing inflation under control. But the price was two deep and long-lasting recessions.
Oil lower: The reaction in the oil market was also text-book. Brent oil is now below USD 80 per barrel and close to the lowest level this year. The newly introduced G7 oil price cap has so far done little to support prices. Russia said yesterday they are considering a 'price floor' or maximum discounts to benchmark that its oil can be sold at. But for now oil is back trading on the growth outlook and less on price caps/price floors.
Equities: Equities were lower on Tuesday, with US markets down 1-2%. Risk-off with all cyclicals underperforming, but especially the growth oriented ones. Communications, tech, consumer discretionary sold off the most while defensives outperformed.
FI: The global bond market rallied again as the focus returns to the global recession risk rather than the strong US labour market report released on Friday last week. However, the 10Y BTPS-Bund spread continues to tighten despite the increased risk of a recession, expectations of QT from ECB and repayment of the TLTRO.
FX: CHF, SEK, NZD and USD rose vis-à-vis GBP, NOK and CAD yesterday. USD/NOK rebounded back to around 10.00 level and NOK/SEK dropped to around 1.04.
Credit: Credit markets were in slight risk-off mode on Tuesday. Itrax main widened 0.9bp to close at 91bp, while Itrax Xover widened 4.6bp to close at 461.8bp. Primary market activity picked up slightly, relative to Monday, but was still fairly muted.
Nordic macro
Sweden: A string of data from Sweden this morning: production data, industrial orders, household consumption and the GDP indicator. All of these are for October and will hence give a first glance of Q4 which we expect to be a quarter of negative growth. Production figures have so far held up better than expected but both NIER and PMI surveys point to a clear slowdown with weak order inflow. We also get the monthly budget numbers from the Swedish National Debt Office and their forecast is for a surplus of SEK28.7bn in November.
EUR/USD Daily Outlook
Daily Pivots: (S1) 1.0440; (P) 1.0486; (R1) 1.0514; More...
Intraday bias in EUR/USD remains neutral for the moment. Considering bearish divergence condition in 4 hour MACD, break of 1.0427 minor support will indicate short term topping at 1.0594, after rejection by 1.0609 fibonacci level. Intraday bias will be turned back to the downside for 1.0222 support and possibly below.
In the bigger picture, a medium term bottom was in place at 0.9534, on bullish convergence condition in daily MACD. Even as a corrective rise, rally from 0.9534 should target 38.2% retracement of 1.2348 (2021 high) to 0.9534 at 1.0609. Sustained trading above 55 week EMA (now at 1.0566) will raise the chance of trend reversal and target 61.8% retracement at 1.1273. However, rejection by 1.0609 will retain medium term bearishness for down trend resumption at a later stage.
GBP/USD Daily Outlook
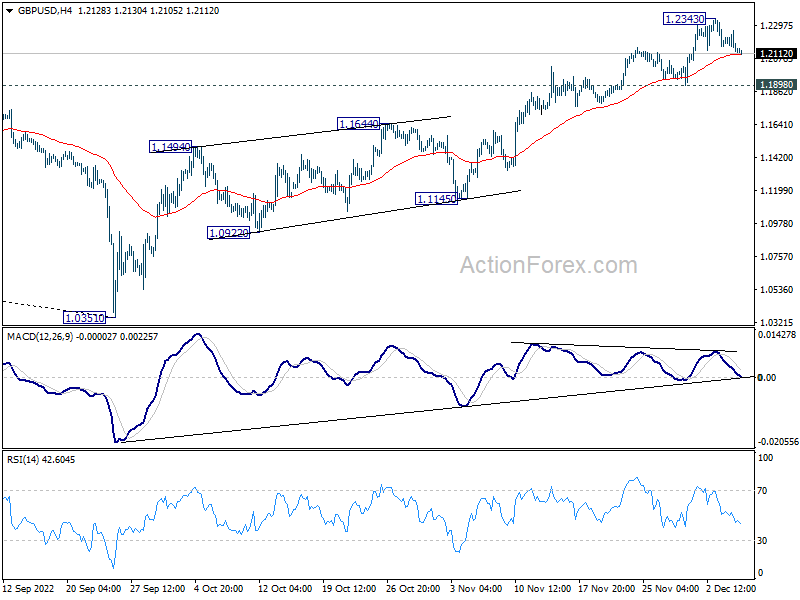
Daily Pivots: (S1) 1.2084; (P) 1.2177; (R1) 1.2225; More...
Intraday bias in GBP/USD remains neutral at this point. Further rally is expected as long as 1.1898 support holds. Above 1.2343 will resume the rise from 1.0351 and target 1.2759 medium term fibonacci level next. However, firm break of 1.1898 support will confirm short term topping and turn bias back to the downside.
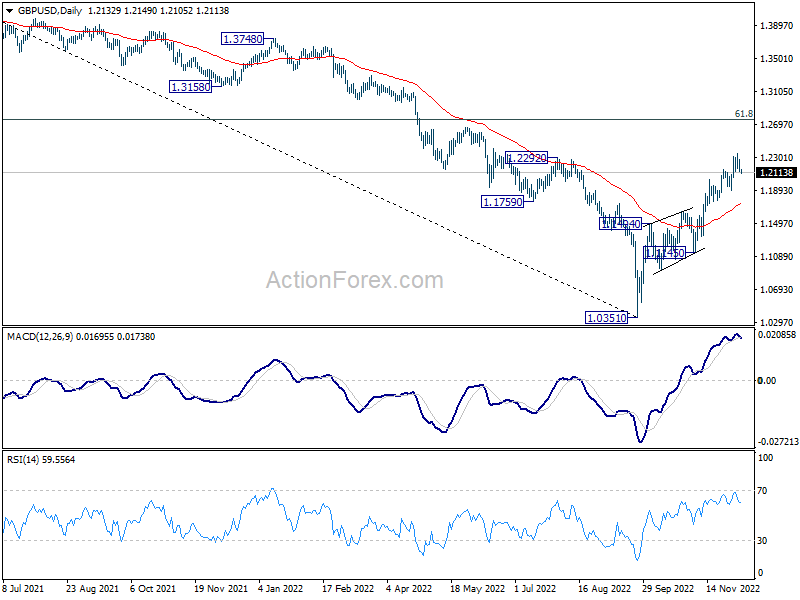
In the bigger picture, rise from 1.0351 medium term bottom is at least correcting whole down trend from 1.4248 (2021 high). Further rise is expected as long as 1.1644 resistance turned support holds. Next target is 61.8% retracement of 1.4248 to 1.0351 at 1.2759. Sustained break there will pave the way back to 1.4248.
USD/CHF Daily Outlook
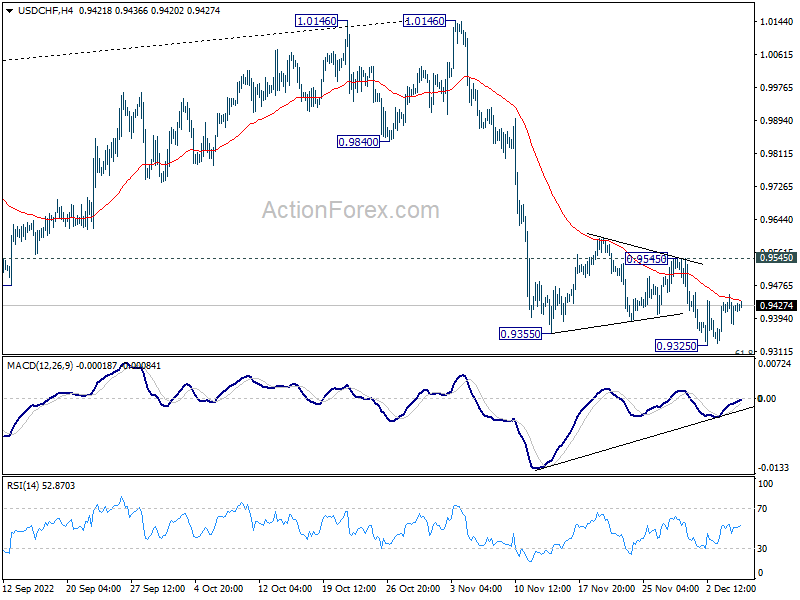
Daily Pivots: (S1) 0.9383; (P) 0.9419; (R1) 0.9458; More...
Intraday bias in USD/CHF stays neutral at this point. Considering bullish convergence condition in 4 hour MACD, break of 0.9545 will indicate short term bottoming at 0.9325. Intraday bias will be back on the upside for 55 day EMA (now at 0.9652). On the downside, below 0.9325 will target 0.9287 fibonacci level.
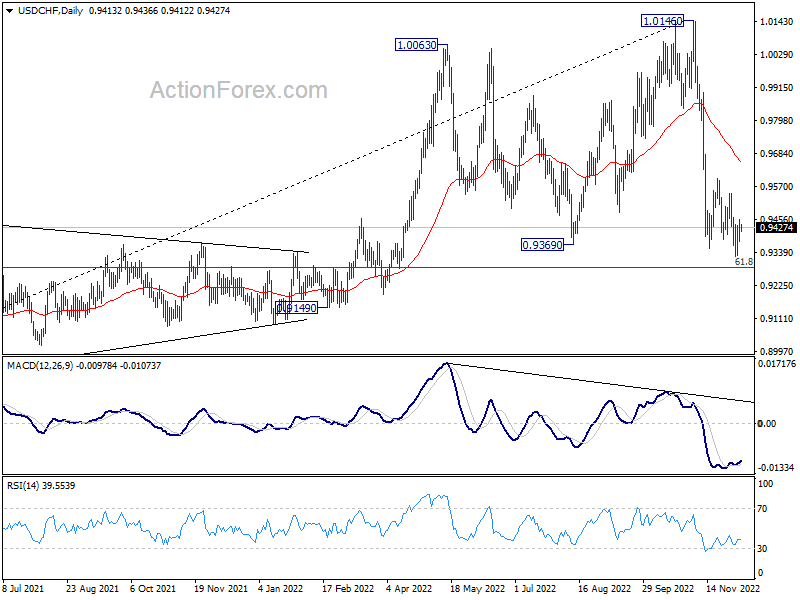
In the bigger picture, rise from 0.8756 (2021 low) has completed at 1.0146, well ahead of 1.0342 long term resistance (2016 high). Based on current downside momentum, fall from 1.0146 might be a medium term down trend itself. Break of 61.8% retracement of 0.8756 to 1.0146 at 0.9287 will pave the way to 0.8756. In any case, risk will stay on the downside as long as 55 day EMA (now at 0.9690) holds.
USD/JPY Daily Outlook
Daily Pivots: (S1) 136.20; (P) 136.81; (R1) 137.66; More...
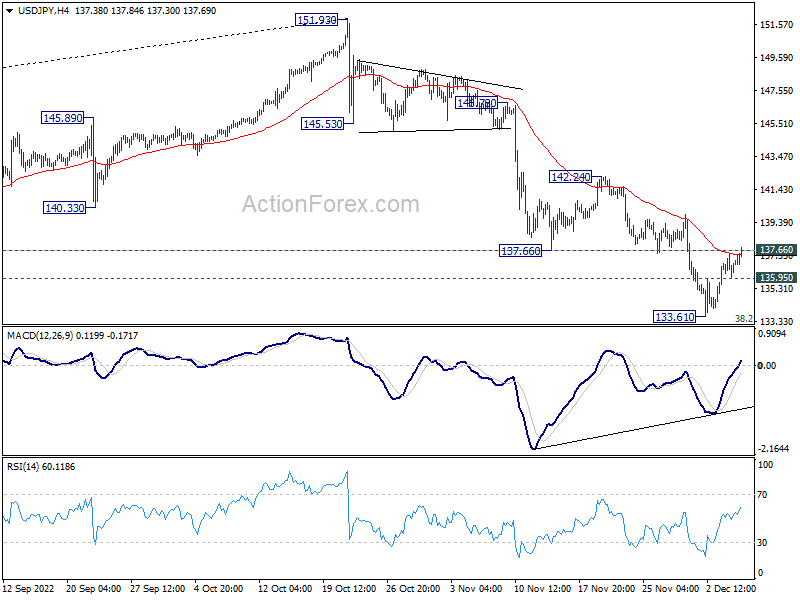
USD/JPY's break of 137.66 support turned resistance suggests short term bottoming at 133.61, on bullish convergence condition in 4 hour MACD, ahead of 133.07 medium term fibonacci level. Intraday bias is back on the upside for 55 day EMA (now at 141.41). On the downside, below 135.95 minor support will bring retest of 133.61 instead.
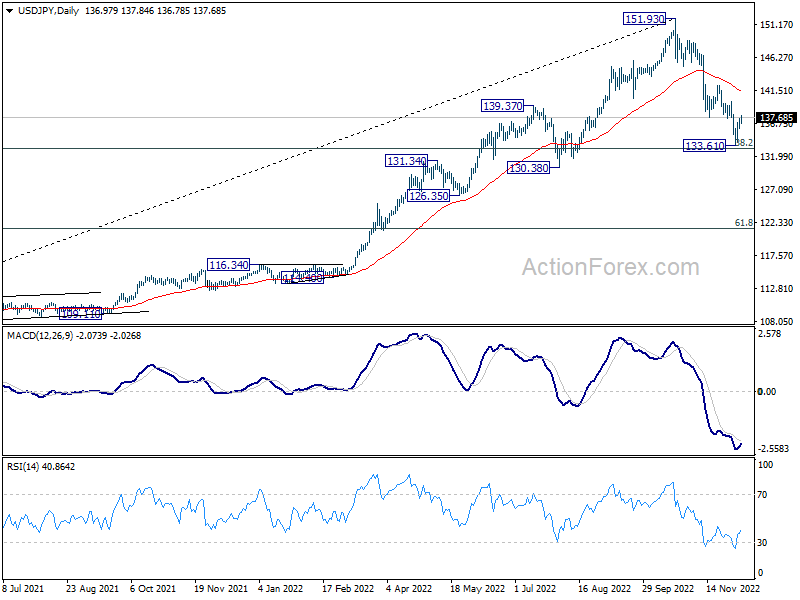
In the bigger picture, a medium term top should be formed at 151.93. Fall from there is correcting larger up trend from 102.58. It's too early to call for bearish trend reversal. But even as a corrective move, such decline should target 38.2% retracement of 102.58 to 151.93 at 133.07, or further to 55 week EMA (now at 131.33). Some support should be seen around this zone to bring rebound. However, sustained break of 55 week EMA will pave the way to 61.8% retracement at 121.43.
USD/CAD Daily Outlook
Daily Pivots: (S1) 1.3590; (P) 1.3633; (R1) 1.3695; More....
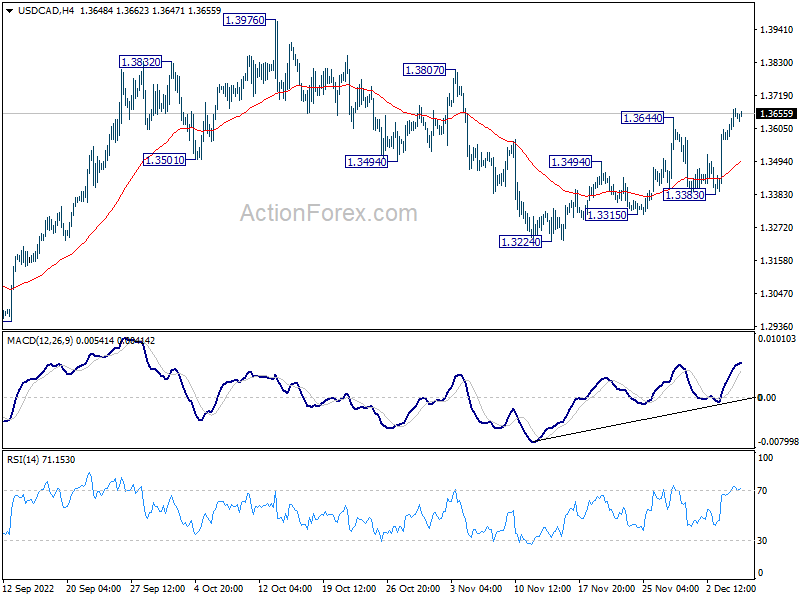
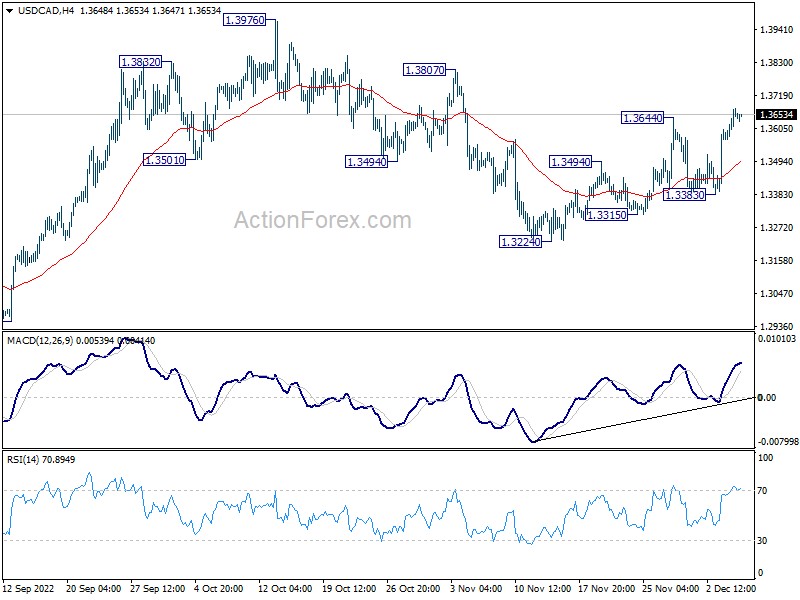
USD/CAD's rally from 1.3224 resumed by breaking 1.3644 and intraday bias is back on the upside. Current development is in line with the case that correction from 1.3976 has completed at 1.3224. Further rise should be seen to 1.3807 resistance first, and then 1.3976. For now, this will remain the favored case as long as 1.3383 support holds, in case of retreat.
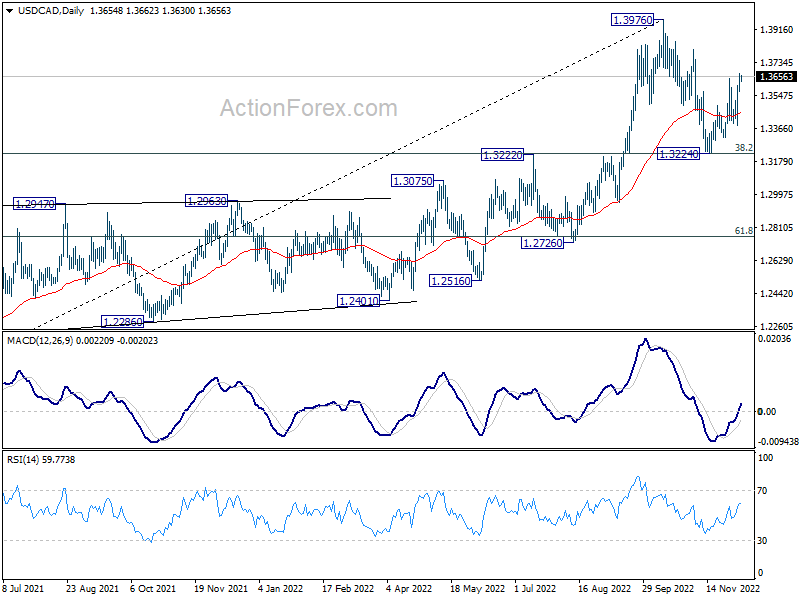
In the bigger picture, as long as 1.3222 cluster support (38.2% retracement of 1.2005 to 1.3976 at 1.3223) holds, larger up trend from 1.2005 (2021 low) is still expected to resume through 1.3976 high at a later stage. However, firm break of 1.3222/3 will indicate that the trend might have reversed. Deeper fall would be seen to next cluster support at 1.2726 (61.8% retracement at 1.2758).
AUD/USD Daily Report
Daily Pivots: (S1) 0.6665; (P) 0.6704; (R1) 0.6728; More...
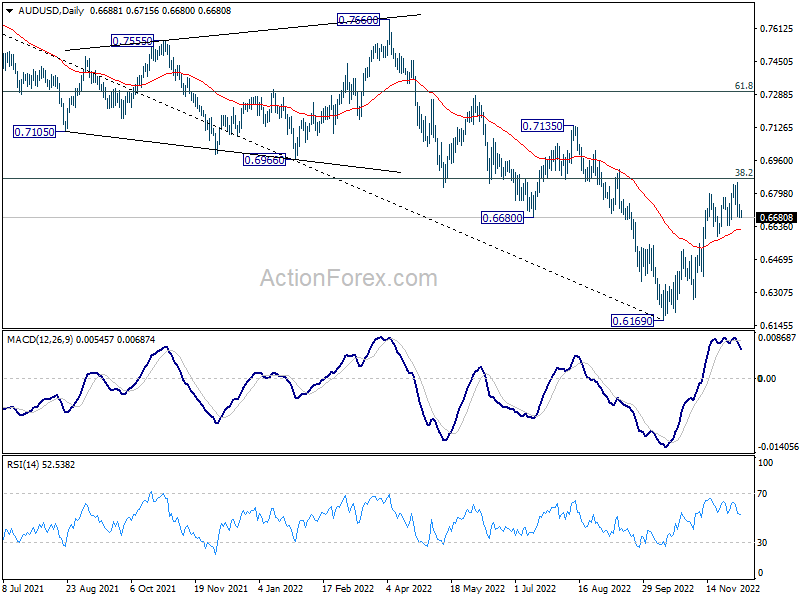
Intraday bias in AUD/USD remains neutral for the moment. Considering bearish divergence condition in 4 hour MACD, break of 0.6641 support should indicate short term topping, following rejection by 0.6871 fibonacci level. Intraday bias will be back on the downside for 0.6521 resistance turned support first.
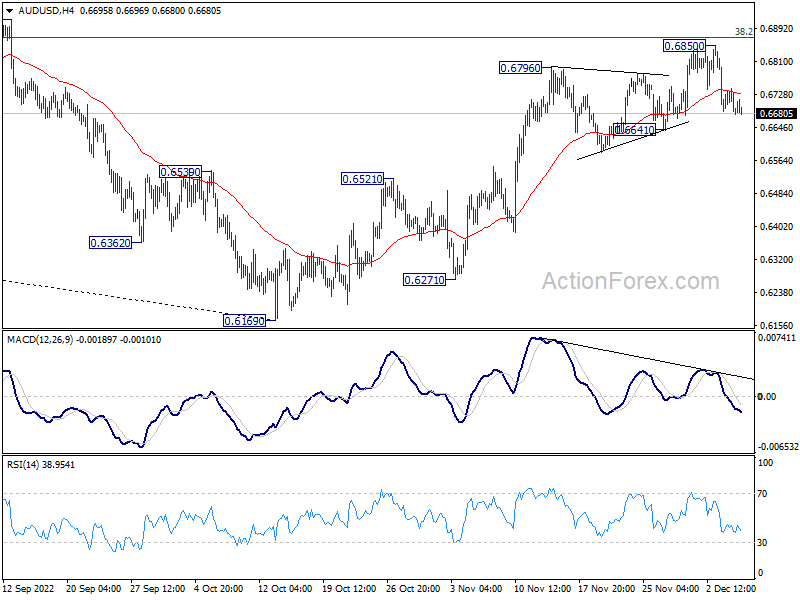
In the bigger picture, a medium term bottom is in place at 0.6160 already. But it's too early to call for trend reversal. Nevertheless, even as a corrective move, rise from 0.6169 should target 38.2% retracement of 0.8006 to 0.6169 at 0.6871. Sustained trading above 55 week EMA (now at 0.6922) will raise the chance of the start of a bullish up trend. However, rejection by 0.6781 or 55 week EMA, followed by 0.6521 resistance turned support and retain medium term bearishness.
Markets Directionless, CAD Awaits BoC
Overall, the markets continue to trade in a mixed manner. US stocks declined for a second day overnight, but the selloff didn't continue in Asia. Sentiment is somewhat supported by optimism of easing restrictions in China. In the currency markets, Yen is currently the worst performer for the week, followed by Aussie. Canadian Dollar is also soft as focus turns to BoC rate hike today. Dollar is recovering but lacks clear momentum, except versus Loonie. European majors are mixed, with Swiss Franc slightly stronger.
Technically, USD/CAD's break of 1.3644 resistance indicates resumption of whole rise from 1.3224. Further rally is now in favor towards 1.3807 resistance next. But equivalent move is not seen in other Dollar pairs yet. Eyes will be on 0.6641 support in AUD/USD, 1.0427 minor support in EUR/USD, and 137.66 resistance in USD/JPY.
In Asia, Nikkei dropped -0.64%. Hong Kong HSI is down -0.04%. China Shanghai SSE is down -0.39%. Singapore Strait Times is down -0.07%. Japan 10-year JGB yield is down -0.0025 at 0.250. Overnight, DOW dropped -1.03%. S&P 500 dropped -1.44%. NASDAQ dropped -2.00%. 10-year yield dropped -0.086 to 3.513.
BoJ Nakamura: Inflation not accompanied by wage increases yet
BoJ board member Toyoaki Nakamura said, "recent price rises aren't accompanied by wage increases yet". He added that Japan is far from the situation where wage inflation spiral becomes a concern. The central bank needs to continue with ultra-loose monetary policy for the time being.
"Tightening monetary policy at a time when demand continues to remain lower than supply would put huge pressure on corporate and household activity," he warned.
He expects inflation to slow next year as energy and food price rises fade.
Australia AiG services fell to 45.6, deepening contraction
Australia AiG Performance of Services dropped -2.1 pts to 45.6 in November, signaling contraction for a third month. Sales rose 1.5 to 42.8. Employment dropped -6.1 to 47.8. New orders dropped -4.8 to 49.7. Input prices dropped -3.6 to 74.0. Selling prices rose 2.2 to 64.4. Average wages rose 3.8 to 68.6.
Innes Willox, Chief Executive of the national employer association Ai Group, said: "The deteriorating economic outlook is clearly weighing on Australia's services sector. The Australian PSI indicated a deepening contraction in the services sector, with three months of declining results. Steep falls in indicators for employment and new orders in November reveal weakening demand for services, while ongoing labour shortages continue to constrain the supply side."
Australia GDP grew 0.6% qoq in Q3, terms of trade deteriorated
Australia GDP grew 0.6% qoq in Q3, below expectation of 0.7% qoq. Household spending rose 1.1%, contributing 0.6% to GDP. Compensation of employees increased 3.2%, the strongest rise since December quarter 2006. Net trade detracted -0.2% from GDP, with a 2.7% increase in exports offset by a 3.9% rise in imports. The terms of trade fell -6.6%, the largest fall since June quarter 2009, as import prices increased and export prices fell.
CAD/JPY struggling at 100, eyes on BoC hike
BoC is widely expected to continue with tightening today. But opinion on the size of the rate hike is split, with odds slightly in favor to 50 than 25. The main question, though, is not about how much the hike is, but how BoC would indicate the path forward. That is, how close interest is to the terminal rate. This is what the statement would be scrutinized for.
Some suggested readings on BoC:
- BOC Interest Rate Decision: Foreshadowing the Fed?
- Can the BoC Meeting Deliver Any Surprises?
- Bank of Canada Hiking Cycle Could Be Drawing to a Close
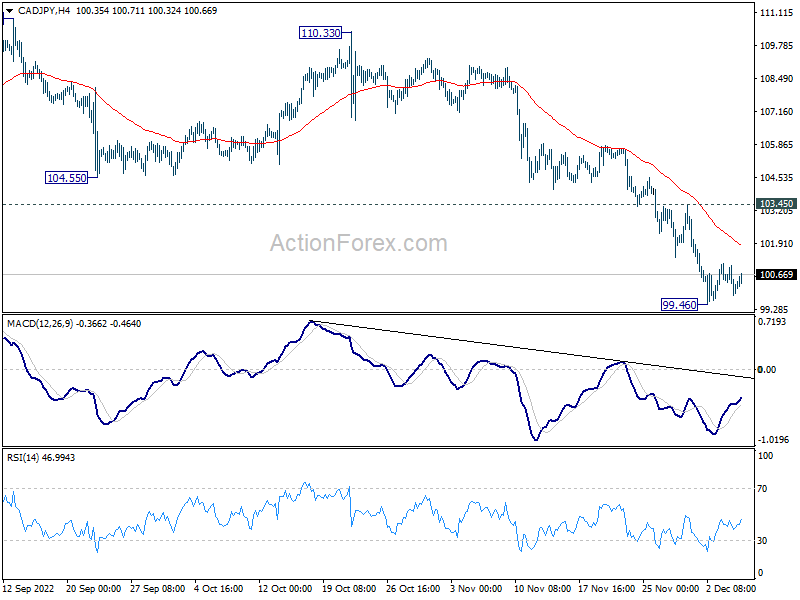
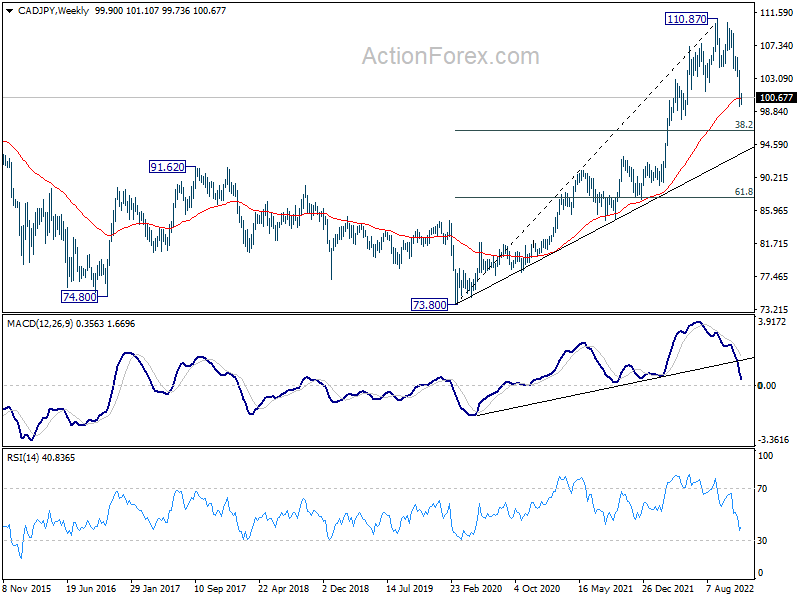
CAD/JPY's decline halted last week after hitting 99.46, but it's just struggling around 100 handle, with no momentum for a solid rebound. For now, deeper fall is expected as long as 4 hour 55 EMA (now at 101.88) holds. Break of 99.46 will resume the decline from 110.87 as a long term correction. CAD/JPY should have a take on 38.2% retracement of 73.80 to 110.87 at 96.70 before forming a bottom.
Elsewhere
Swiss unemployment rate and foreign currency reserves, Germany industrial production, France trade balance, Italy retail sales, Eurozone GDP final will be released in European session. US will release Q3 non-farm productivity later in the day.
AUD/USD Daily Report
Daily Pivots: (S1) 0.6665; (P) 0.6704; (R1) 0.6728; More...
Intraday bias in AUD/USD remains neutral for the moment. Considering bearish divergence condition in 4 hour MACD, break of 0.6641 support should indicate short term topping, following rejection by 0.6871 fibonacci level. Intraday bias will be back on the downside for 0.6521 resistance turned support first.
In the bigger picture, a medium term bottom is in place at 0.6160 already. But it's too early to call for trend reversal. Nevertheless, even as a corrective move, rise from 0.6169 should target 38.2% retracement of 0.8006 to 0.6169 at 0.6871. Sustained trading above 55 week EMA (now at 0.6922) will raise the chance of the start of a bullish up trend. However, rejection by 0.6781 or 55 week EMA, followed by 0.6521 resistance turned support and retain medium term bearishness.
Economic Indicators Update
| GMT | Ccy | Events | Actual | Forecast | Previous | Revised |
|---|---|---|---|---|---|---|
| 21:30 | AUD | AiG Performance of Services Index Nov | 45.6 | 47.7 | ||
| 00:30 | AUD | GDP Q/Q Q3 | 0.60% | 0.70% | 0.90% | |
| 03:00 | CNY | Trade Balance (USD) Nov | 69.8B | 79.1B | 85.2B | |
| 03:00 | CNY | Exports (USD) Y/Y Nov | -8.70% | -3.50% | -0.30% | |
| 03:00 | CNY | Imports (USD) Y/Y Nov | -10.60% | -6.00% | -0.70% | |
| 03:00 | CNY | Trade Balance (CNY) Nov | 494B | 580B | 587B | |
| 03:00 | CNY | Exports (CNY) Y/Y Nov | 0.90% | 7% | ||
| 03:00 | CNY | Imports (CNY) Y/Y Nov | -1.10% | 4.10% | 6.80% | |
| 05:00 | JPY | Leading Economic Index Oct P | 99.0 | 96.6 | 97.5 | |
| 06:45 | CHF | Unemployment Rate Nov | 2.10% | 2.10% | ||
| 07:00 | EUR | Germany Industrial Production M/M Oct | -0.60% | 0.60% | ||
| 07:45 | EUR | France Trade Balance (EUR) Oct | -15.9B | -17.5B | ||
| 08:00 | CHF | Foreign Currency Reserves (CHF) Nov | 817B | |||
| 09:00 | EUR | Italy Retail Sales M/M Oct | 0.10% | 0.50% | ||
| 10:00 | EUR | Eurozone GDP Q/Q Q3 F | 0.20% | 0.20% | ||
| 10:00 | EUR | Eurozone Employment Change Q/Q Q3 F | 0.20% | 0.20% | ||
| 13:30 | USD | Nonfarm Productivity Q3 | 0.30% | 0.30% | ||
| 13:30 | USD | Unit Labor Costs Q3 | 3.50% | 3.50% | ||
| 15:00 | CAD | BoC Interest Rate Decision | 4.25% | 3.75% | ||
| 15:30 | USD | Crude Oil Inventories | -3.5M | -12.6M |