

Sample Category Title
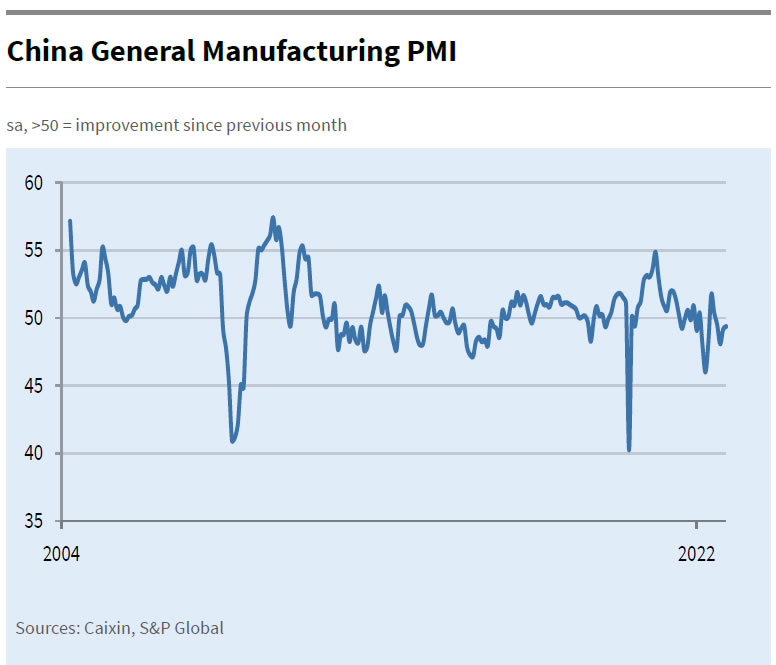
China Caixin PMI Manufacturing rose to 49.4 in Nov, pandemic continued to take a toll
China Caixin PMI Manufacturing rose from 49.2 to 49.4 in November, above expectation of 48.6. Caixin said that Covid-19 restrictions continued to constrain output. New orders fell, albeit at softest rate in four months. Supply chain delays worsened.
Wang Zhe, Senior Economist at Caixin Insight Group said: "Overall, the pandemic continued to take a toll on the economy. Output contracted, total demand was under pressure, overseas demand remained weak, employment deteriorated, logistics was sluggish, and manufacturers faced growing operating pressure. As the measure for suppliers' delivery times is negatively correlated to the PMI, the fall in the measure partially offset the drop in the PMI, leading the decline in November manufacturing activity to be underestimated."
BoJ Noguchi: Must maintain monetary easing
BoJ board member Asahi Noguchi said the central bank must continue to maintain monetary easing, keep interest rates at low levels now as achievement of 2% inflation target remains uncertain.
"While not as much as other countries, Japan's consumer prices have risen sharply. This increase is driven mostly by rising imported goods prices," he said. "What's more important in deciding monetary policy is trend inflation based on domestic macro-economic factors, which remains at low levels."
Inflation is likely to fall back below 2% once these cost-push factors dissipate.
Fed Powell: Makes Sense to start slowing, as soon as in Dec
Fed Chair Jerome Powell indicated in a speech that it "makes sense" to start slowing the pace of tightening as soon as in December. But, the level of the terminal rate, and the time to stay there are now more significant than when to start slowing down.
"Monetary policy affects the economy and inflation with uncertain lags, and the full effects of our rapid tightening so far are yet to be felt," Powell said. "Thus, it makes sense to moderate the pace of our rate increases as we approach the level of restraint that will be sufficient to bring inflation down. The time for moderating the pace of rate increases may come as soon as the December meeting," he added.
But Powell also indicated, "the timing of that moderation is far less significant than the questions of how much further we will need to raise rates to control inflation, and the length of time it will be necessary to hold policy at a restrictive level. It is likely that restoring price stability will require holding policy at a restrictive level for some time. History cautions strongly against prematurely loosening policy. We will stay the course until the job is done."
Technical Outlook and Review
USD/JPY:
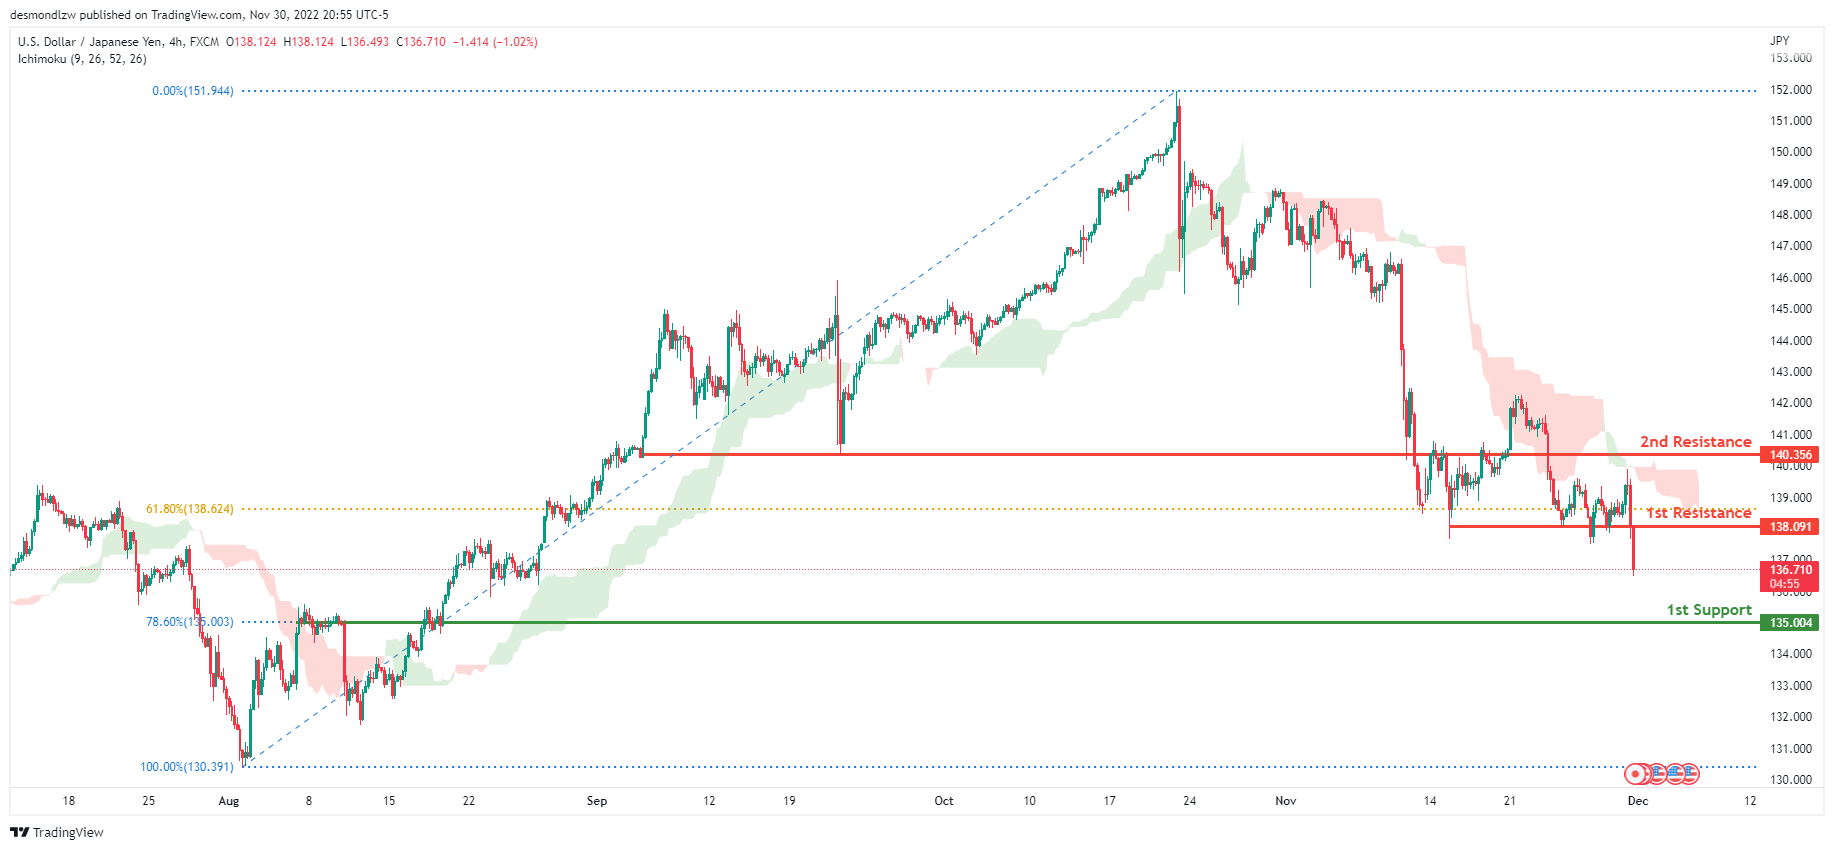
The current general bias for USDJPY on the H4 chart is bearish. To add confluence to this, the price is under the Ichimoku cloud which indicates a bearish market. If the bearish momentum continues, expect USDJPY to head towards the 1st support line at 135.004, where the 78.6% Fibonacci line is located. In an alternative scenario, price could go up to retest the 1st resistance line at 138.091, where the 61.8% Fibonacci line and previous low are located.
Areas of consideration:
- H4 time frame, 1st resistance at 138.091
- H4 time frame, 1st support at 135.004
DXY:
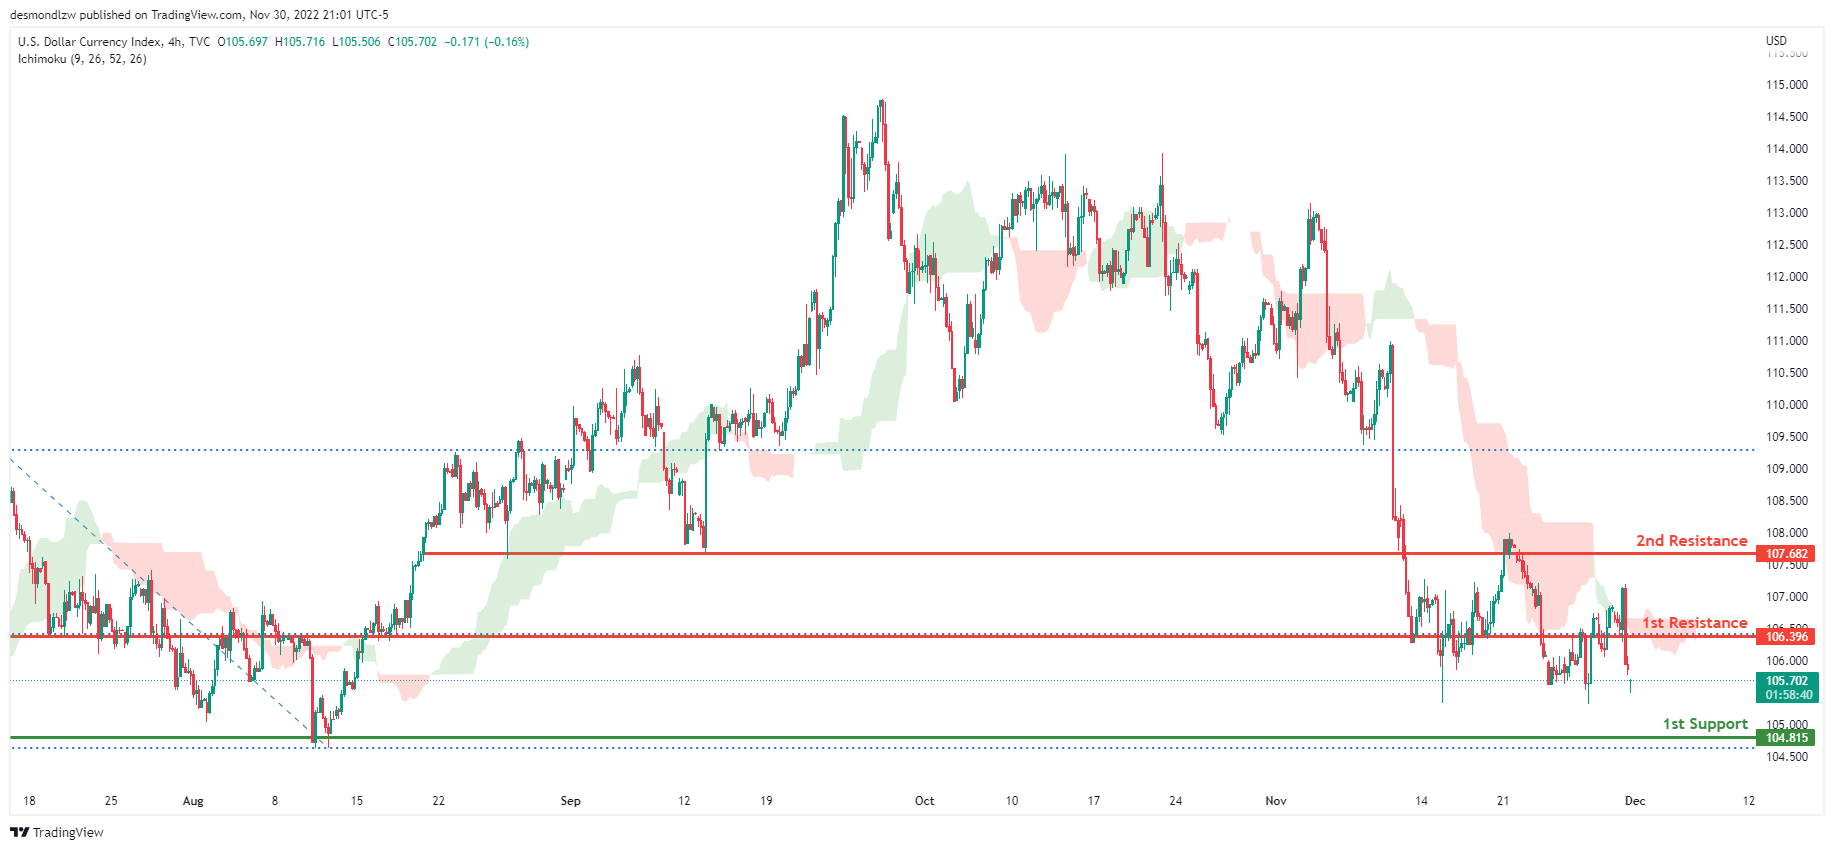
On the H4 chart, the overall bias for DXY is bearish. To add confluence to this, the price is crossing below the Ichimoku cloud which indicates a bearish market. If this bearish momentum continues, expect the price to continue heading towards the 1st support line at 104.815, where the previous swing low is. In an alternative scenario, price could head back up and retest the 1st resistance line resistance at 106.396, where the 38.2% Fibonacci line lies.
Areas of consideration:
- H4 time frame, 1st resistance at 106.396
- H4 time frame, 1st support at 104.815
EUR/USD:
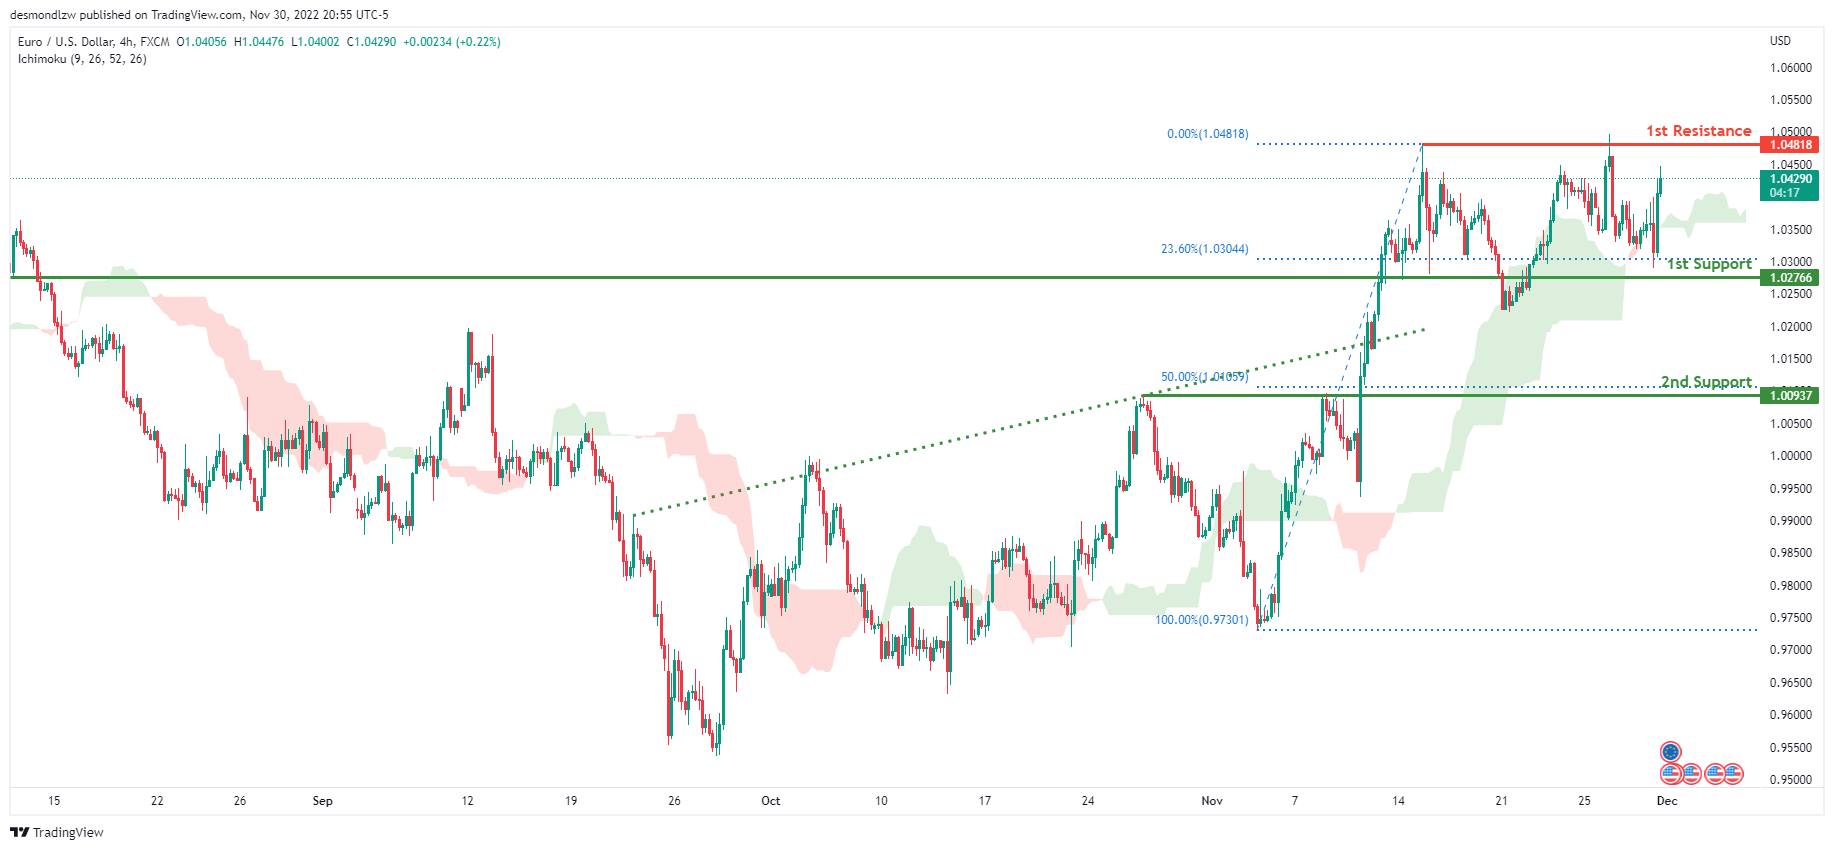
Looking at the H4 chart, my overall bias for EURUSD is bullish due to the current price being above the Ichimoku cloud, indicating a bullish market. To add confluence to this bias, price has also broken above the ascending trend line. If this bullish momentum continues, expect the price to possibly head towards the 1st resistance at 1.04818, where the previous swing high is located. In an alternate scenario, price could possibly head back down towards the 1st support level at 1.02766, where the 23.6% Fibonacci line is located, before heading towards the 2nd support at 1.00937, where the 50% Fibonacci line is.
Areas of consideration :
- H4 1st resistance at 1.04818
- H4 1st support at 1.02766
- H4 2nd support at 1.00937
GBP/USD:
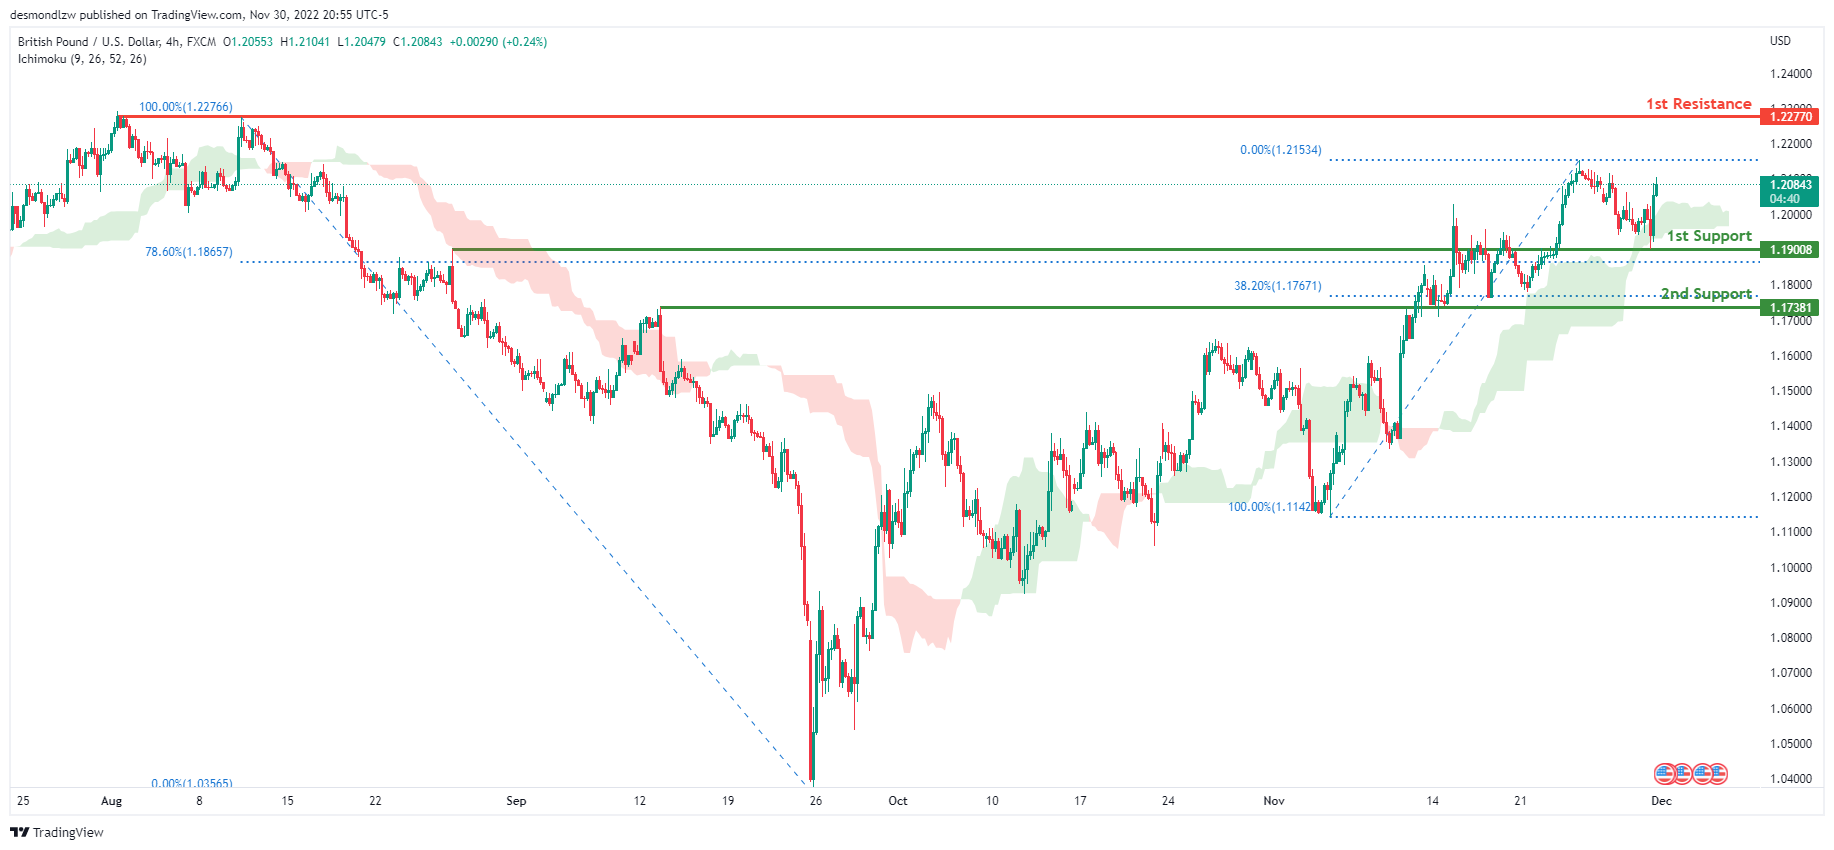
Looking at the H4 chart, my overall bias for GBPUSD is bullish due to the current price being above the Ichimoku cloud, indicating a bullish market. Expecting price to possibly head towards the 1st resistance line at 1.22770, where the previous swing high is. In an alternative scenario, price could possibly head back down to retest the 1st support line at 1.19008, where the 78.6% Fibonacci line is.
Areas of consideration:
- H4 1st resistance at 1.22770
- H4 1st support at 1.19008
USD/CHF:
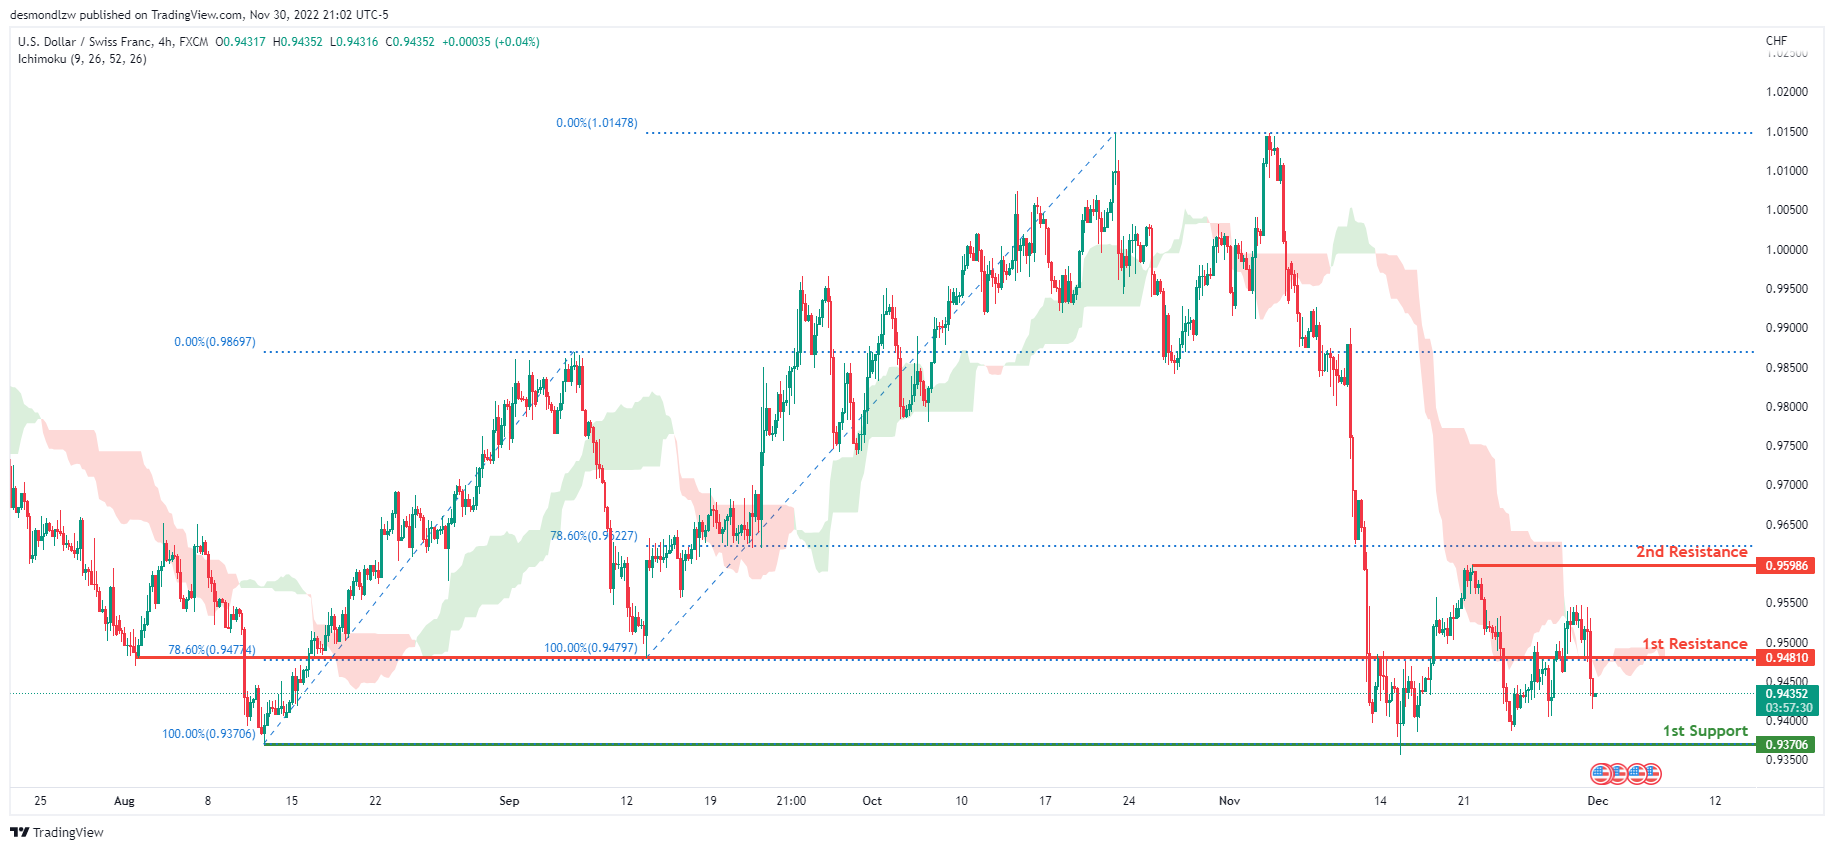
The overall bias for USDCHF on the H4 chart is bearish. In addition, the price is below the Ichimoku cloud, indicating a bearish market. If the current bearish trend continues, expect price to continue heading towards the 1st support line at 0.93706, where the previous swing low is. In an alternative scenario, price could possibly head back up towards the 1st resistance line at 0.94810 where the 78.6% Fibonacci line is.
Areas of consideration
- H4 1st support at 0.93706
- H4 1st resistance at 0.94810
XAU/USD (GOLD):
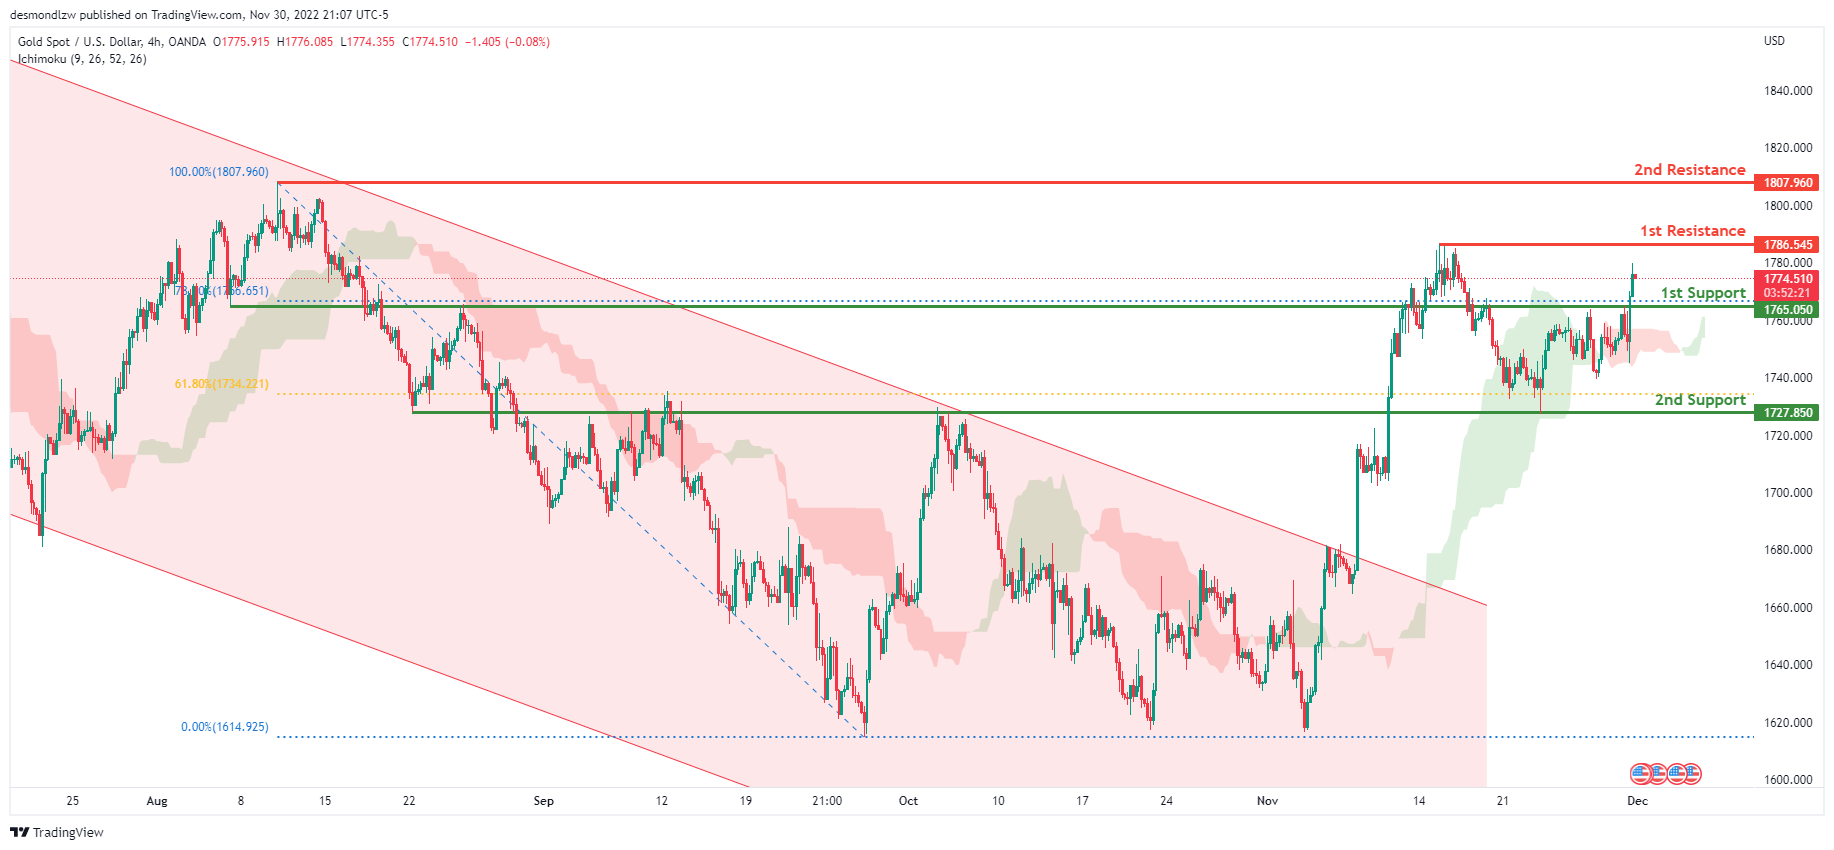
Looking at the H4 chart, my overall bias for XAUUSD is bullish due to the current price crossing above the Ichimoku cloud, indicating a bullish market. If this bullish momentum continues, expect the price to possibly continue heading towards the 1st resistance at 1786.545, where the previous swing high is located. In an alternate scenario, price could possibly head back down towards the 1st support level at 1765.050, where the 78.6% Fibonacci line is located.
Areas of consideration:
- H4 time frame, 1st resistance at 1786.545
- H4 time frame, 1st support at 1765.050
AUD/USD:
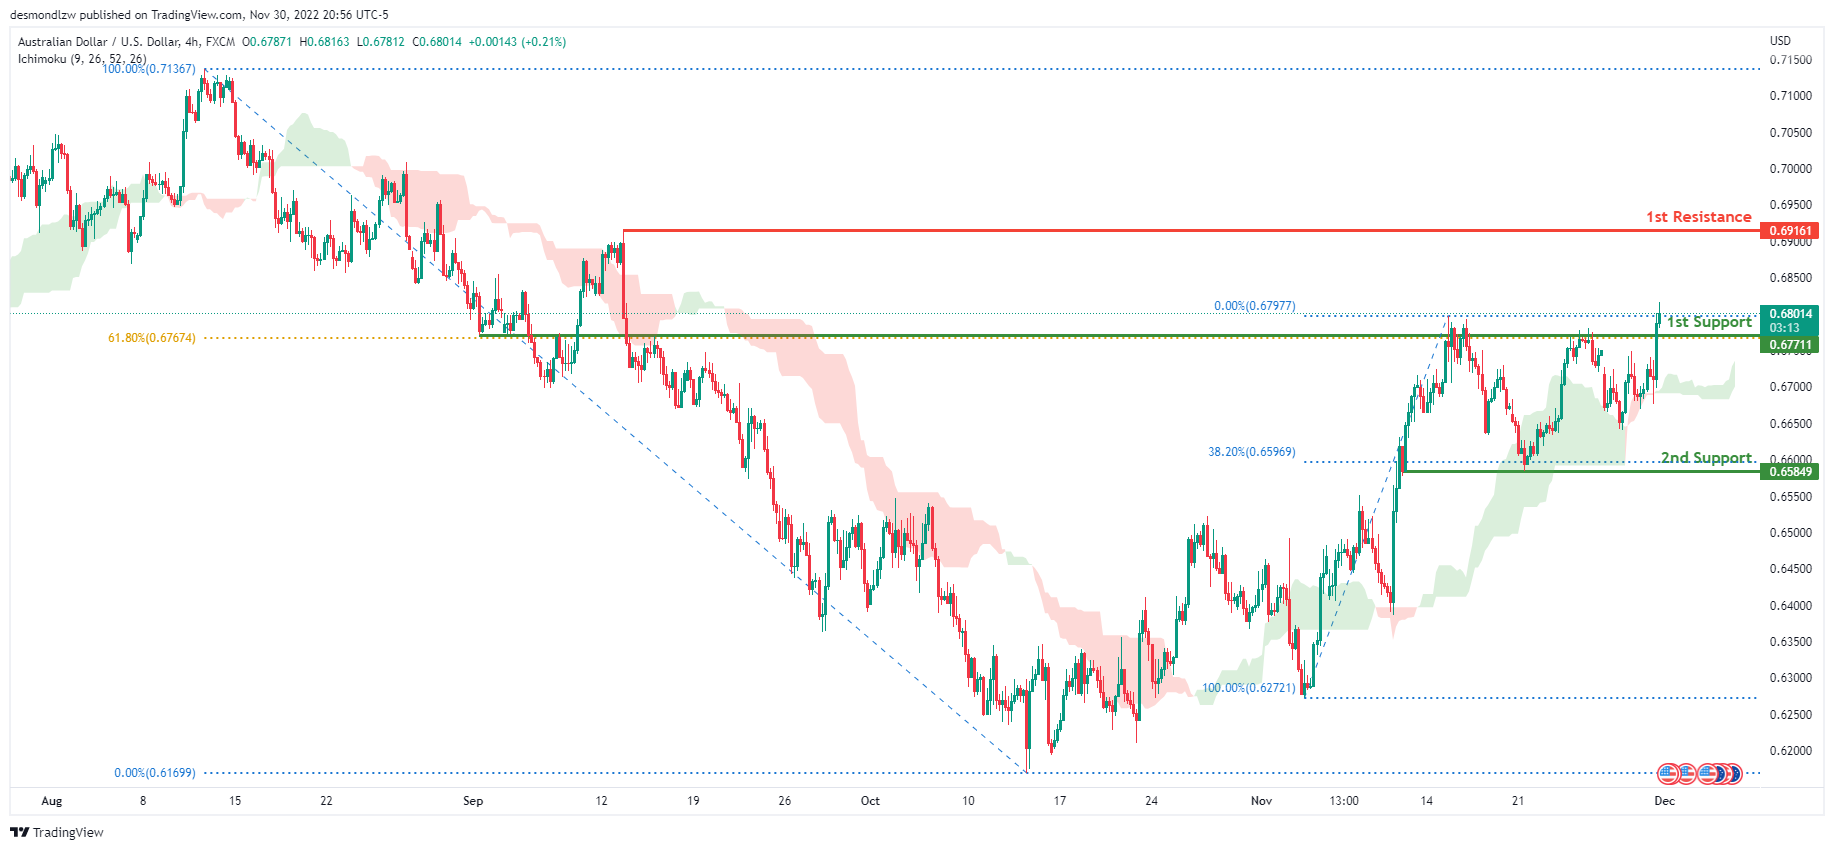
Looking at the H4 chart, my overall bias for AUDUSD is bullish due to the current price being above the Ichimoku cloud, indicating a bullish market. Expecting price to continue heading towards the 1st resistance at 0.69161, where the previous swing high is. In an alternative scenario, price could possibly head back down to retest the 1st support line at 0.67711 where the 61.8% Fibonacci line is.
Areas of consideration
- H4, 1st resistance at 0.69161
- H4, 1st support at 0.67711
NZD/USD:
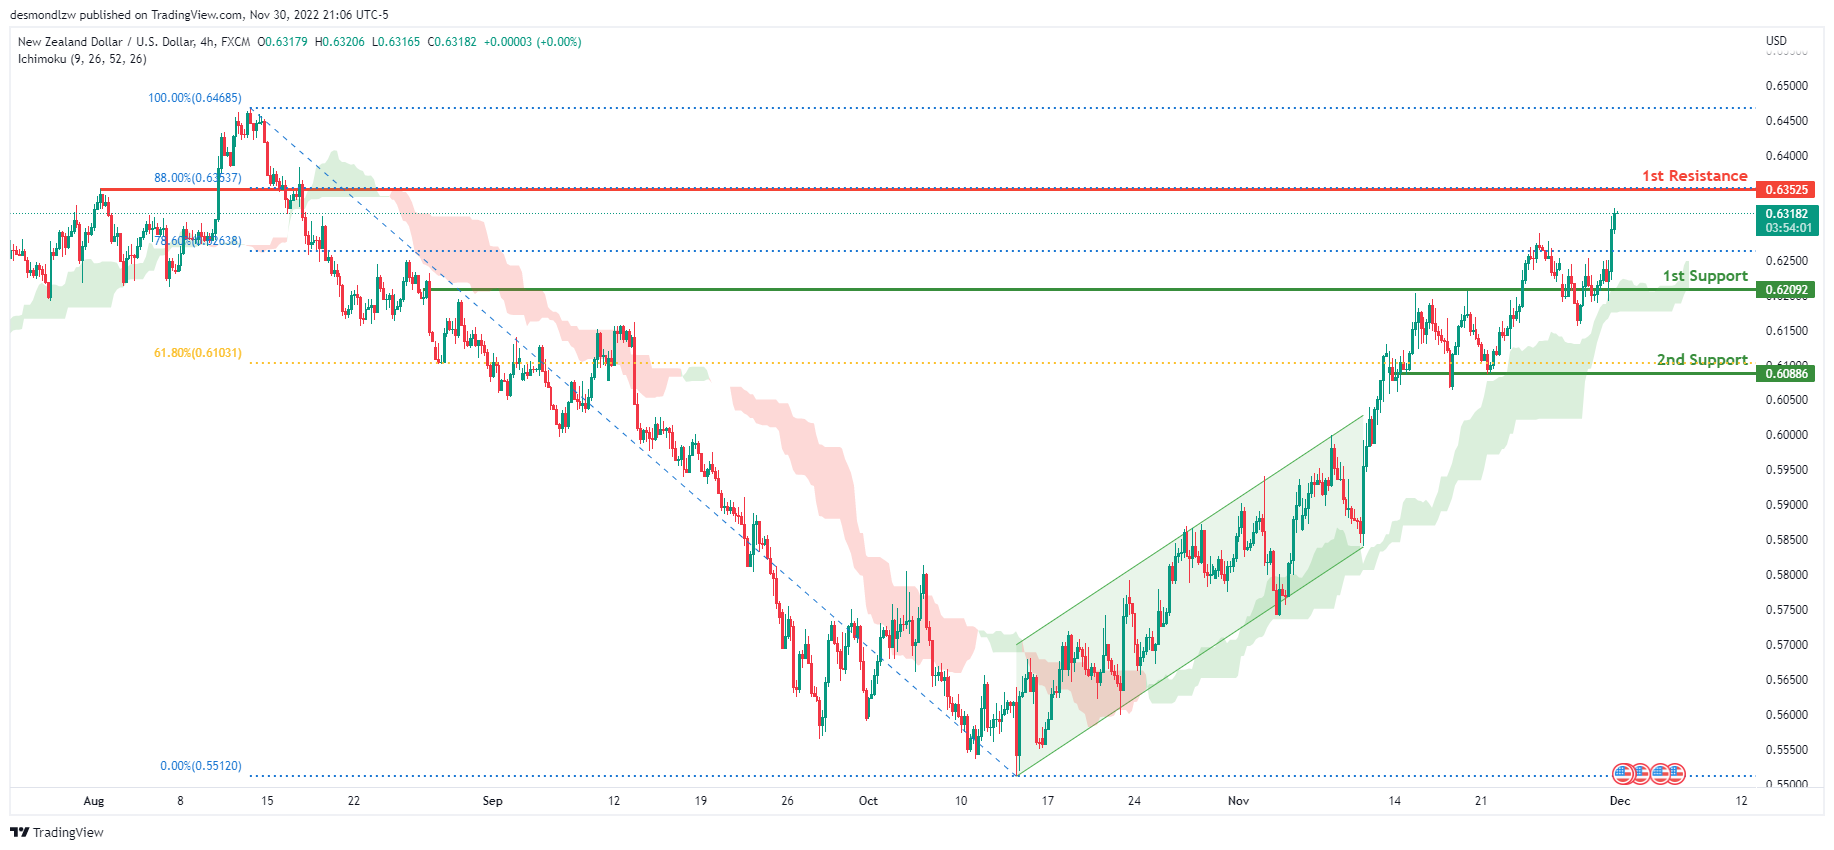
On the H4 chart, we have a bullish bias with the price moving above the Ichimoku cloud and has broken out of the ascending channel. If this bullish momentum continues, expect the price to head towards the 1st resistance line at 0.63525 where the 88% Fibonacci line is. Alternatively, the price may head back down and retest the 1st support at 0.62092, slightly below where the 78.6% Fibonacci line is
Areas of consideration:
- H4 time frame, 1st resistance at 0.63525
- H4 time frame, 1st support at 0.62092
USD/CAD:
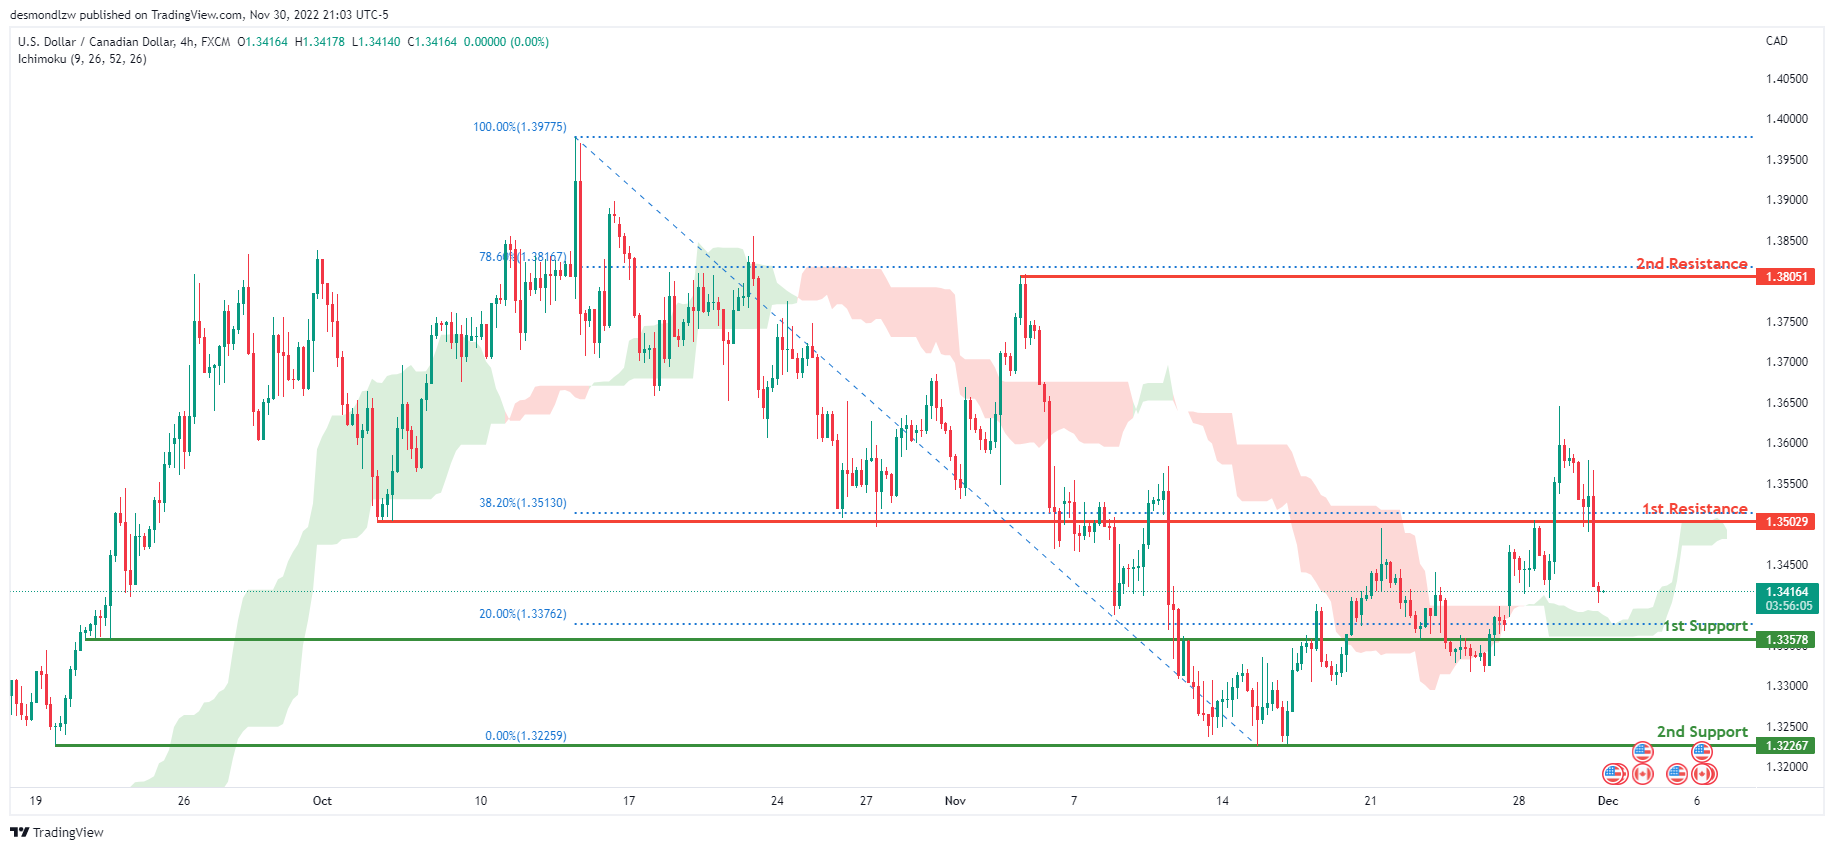
On the H4 chart, the overall bias for USDCAD is bullish. To add confluence to this, the price is above the Ichimoku cloud which indicates a bullish market. If this bullish momentum continues, expect the price to continue heading towards the 1st resistance at 1.35029, where the 38.2% Fibonacci line is. In an alternative scenario, price could head back down to retest the 1st support at 1.33578, where the 20% Fibonacci line is.
Areas of consideration:
- H4 time frame, 1st resistance at 1.35029
- H4 time frame, 1st support at 1.33578
OIL:
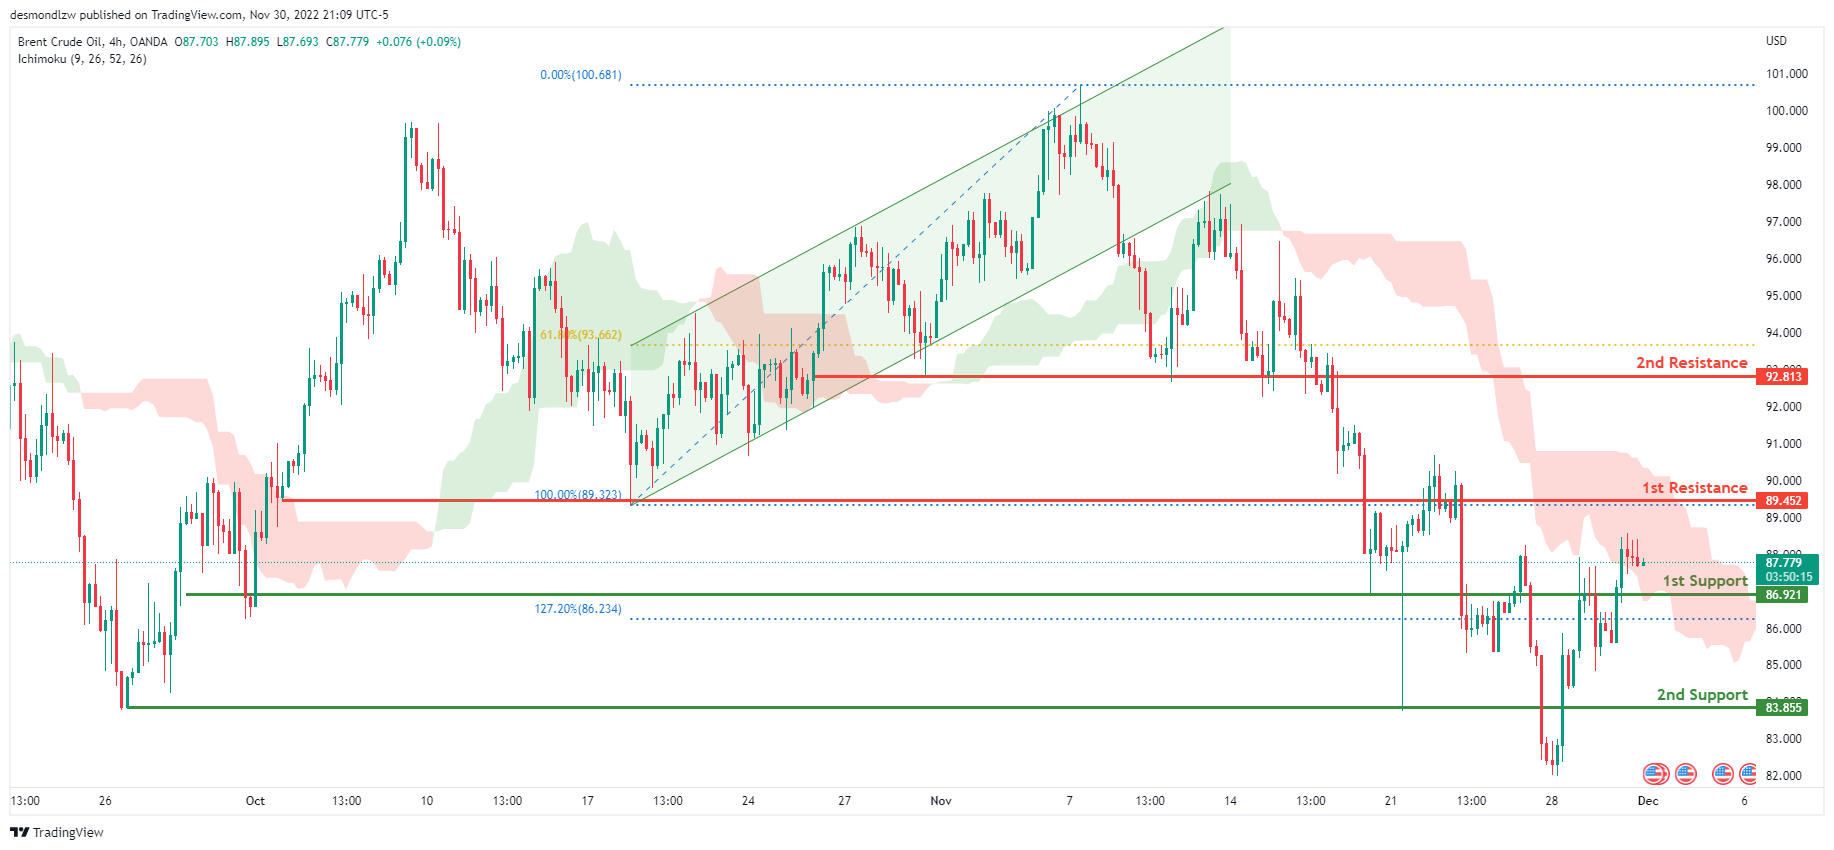
Looking at the H4 chart, my overall bias for BCOUSD is bearish due to the current price being below the Ichimoku cloud, indicating a bearish market. If this bearish momentum continues, expect price to possibly break the 1st support at 86.921, where the 127.2% Fibonacci extension line is located. In an alternate scenario, price could possibly head up towards the 1st resistance line at 89.452, where the previous swing low is.
Areas of consideration:
- H4 time frame, 1st resistance at 89.452
- H4 time frame, 1st support at 86.921
Dow Jones Industrial Average:
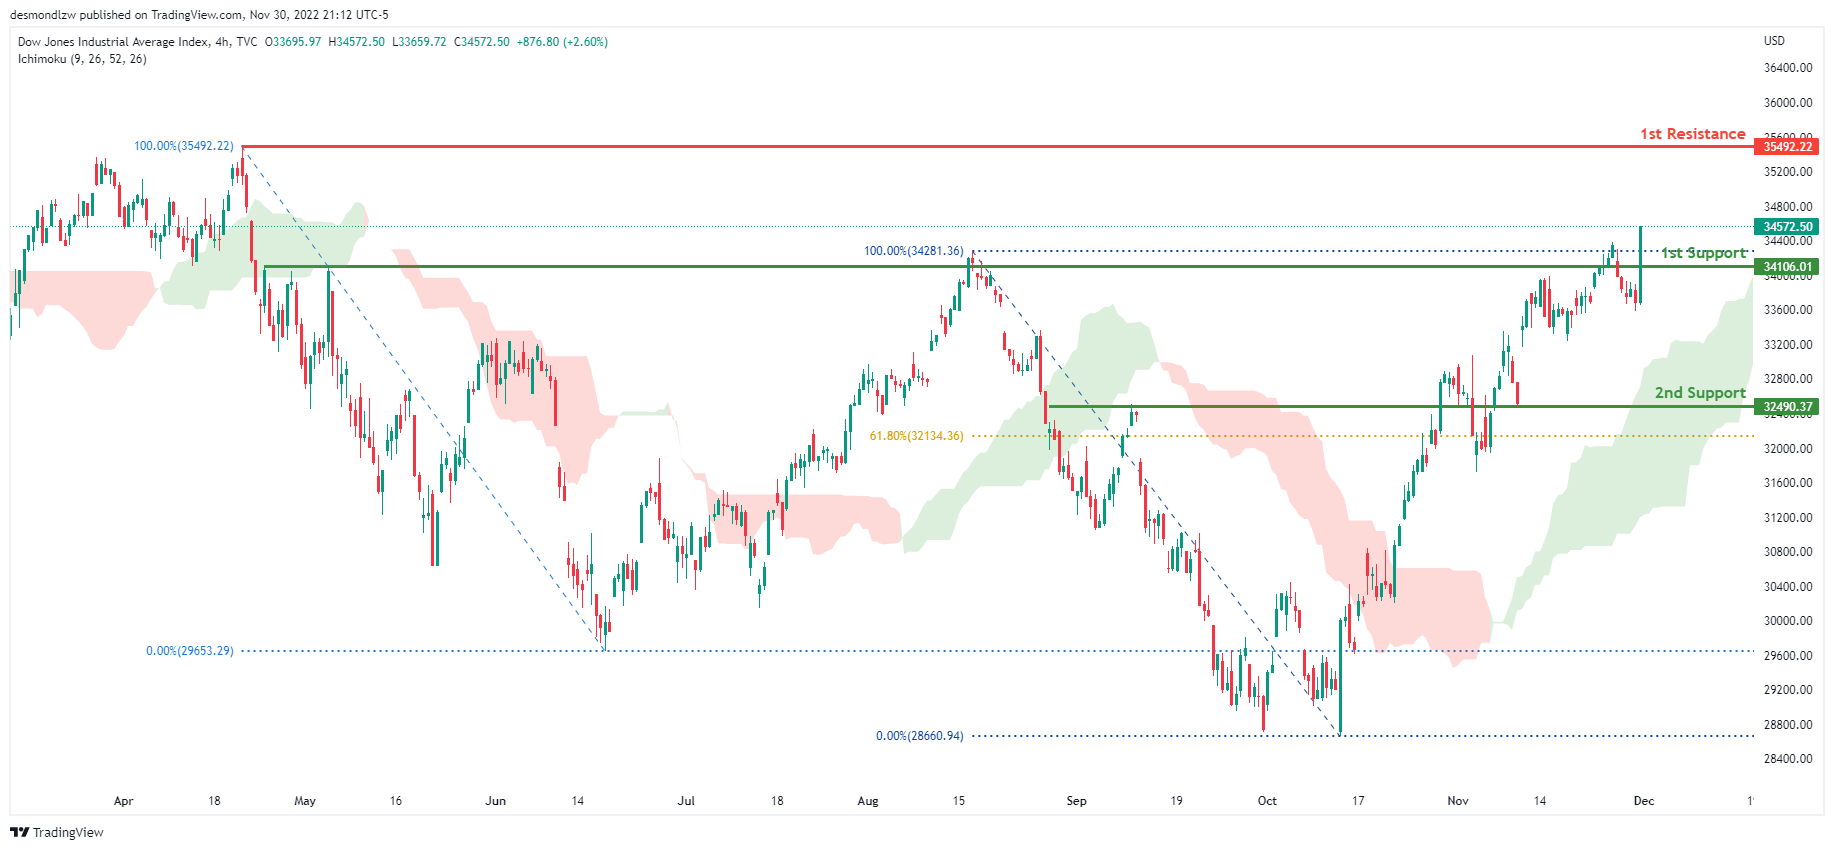
On the H4 chart, the overall bias for DJI is bullish. To add confluence to this, the price is above the Ichimoku cloud which indicates a bullish market. If this bullish momentum continues, expect the price to continue heading towards the 1st resistance line at 35492.22, where the previous swing high is. In an alternative scenario, price could head back down breaking the 1st support line at 34106.01, where the previous swing high is before heading towards the 2nd support at 32490.37, where the 61.8% Fibonacci line is.
Areas of consideration:
- H4 time frame, 1st support at 34106.01
- H4 time frame, 2nd support at 32490.37
- H4 time frame, 1st Resistance at 35492.22
DAX:
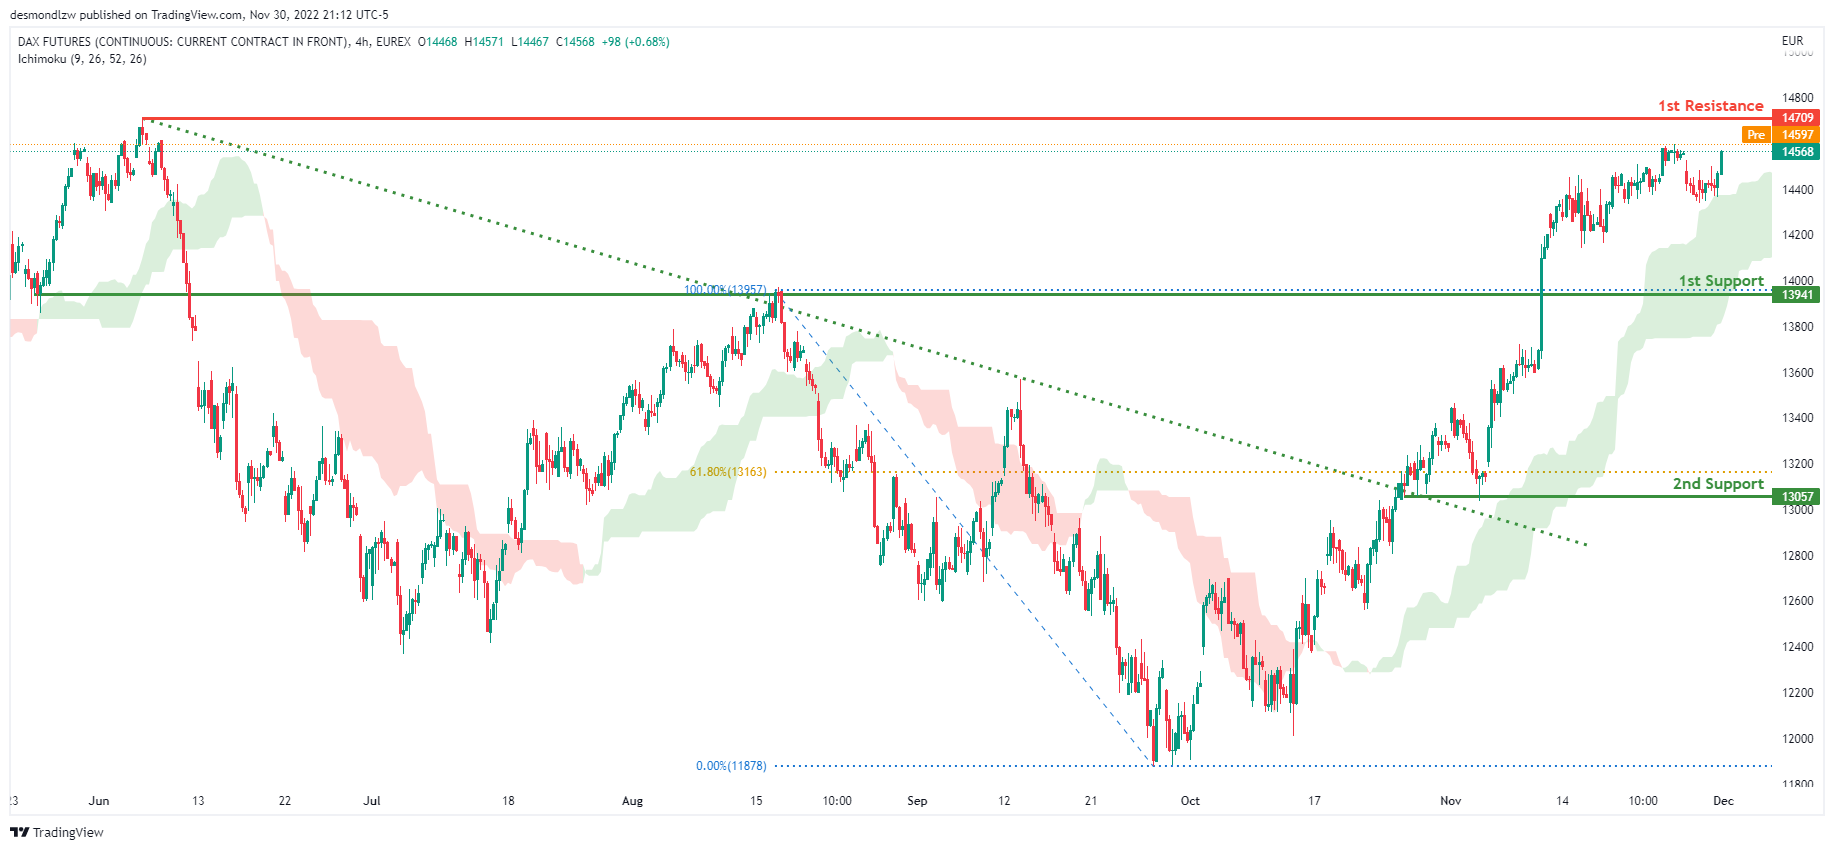
The H4 chart shows a bullish bias, with price breaking through the descending trendline and rising above the Ichimoku cloud. Price is expected to maintain its bullish momentum and rise to the first resistance level at 14709, where the previous swing high is located. Alternatively, the price could fall to the first support level at 13941, where the previous swing high was.
Areas of consideration:
- H4 time frame, 1st resistance is at 14709
- H4 time frame, 1st support is at 13941
ETHUSD:
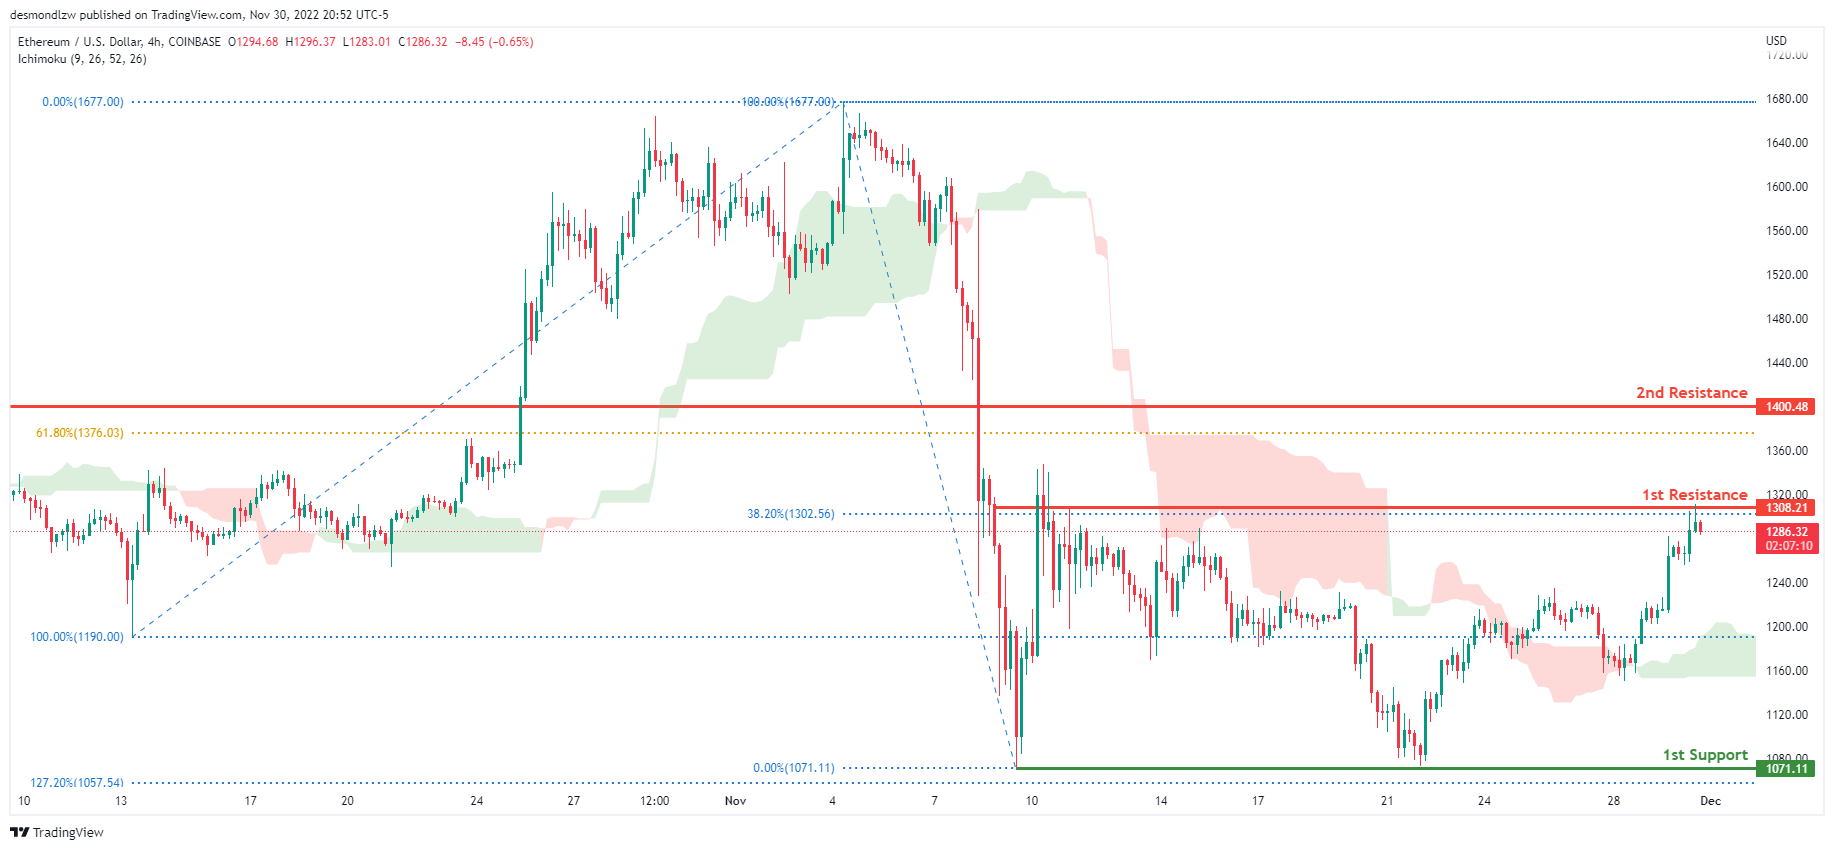
On the H4 chart, the overall bias for ETHUSD is bearish. However, the price is now above the Ichimoku cloud which might indicate a shift to a bullish market. Expecting price to possibly break the 1st resistance at 1308.21, where the 38.2% Fibonacci line is before heading towards the 2nd resistance line at 1400.48, where the 61.8% Fibonacci line is. In an alternative scenario, price could possibly head back down towards the 1st support at 1071.11, where the previous swing low is.
Areas of consideration:
- H4 time frame, 1st resistance of 1308.21
- H4 time frame, 1st support at 1071.11
BTCUSD:
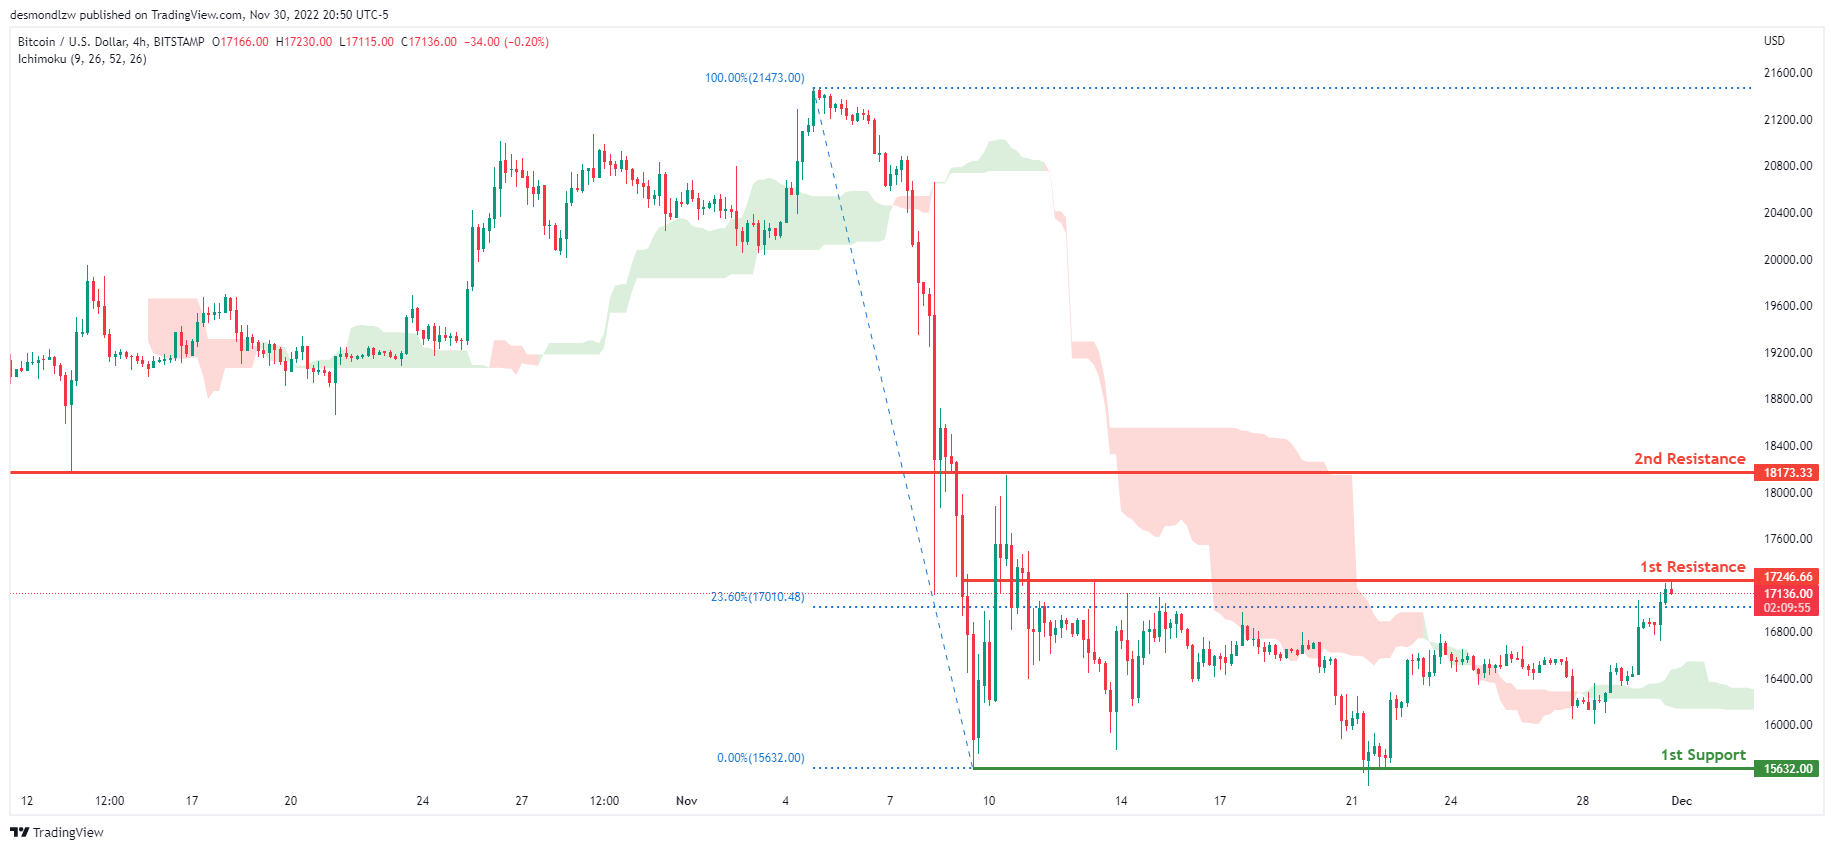
On the H4 chart, the overall bias for BTCUSD is bearish. However, the price is now above the Ichimoku cloud which might indicate a shift to a bullish market. Expecting price to possibly break the 1st resistance at 17246.66, where the 23.6% Fibonacci line is before heading towards the 2nd resistance line at 18173.33, where the previous swing low is. In an alternative scenario, price could possibly head back down towards the 1st support at 15632.00, where the previous swing low is.
Areas of consideration:
- H4 time frame, 1st resistance 17246.66
- H4 time frame, 1st support at 15632.00
S&P 500:
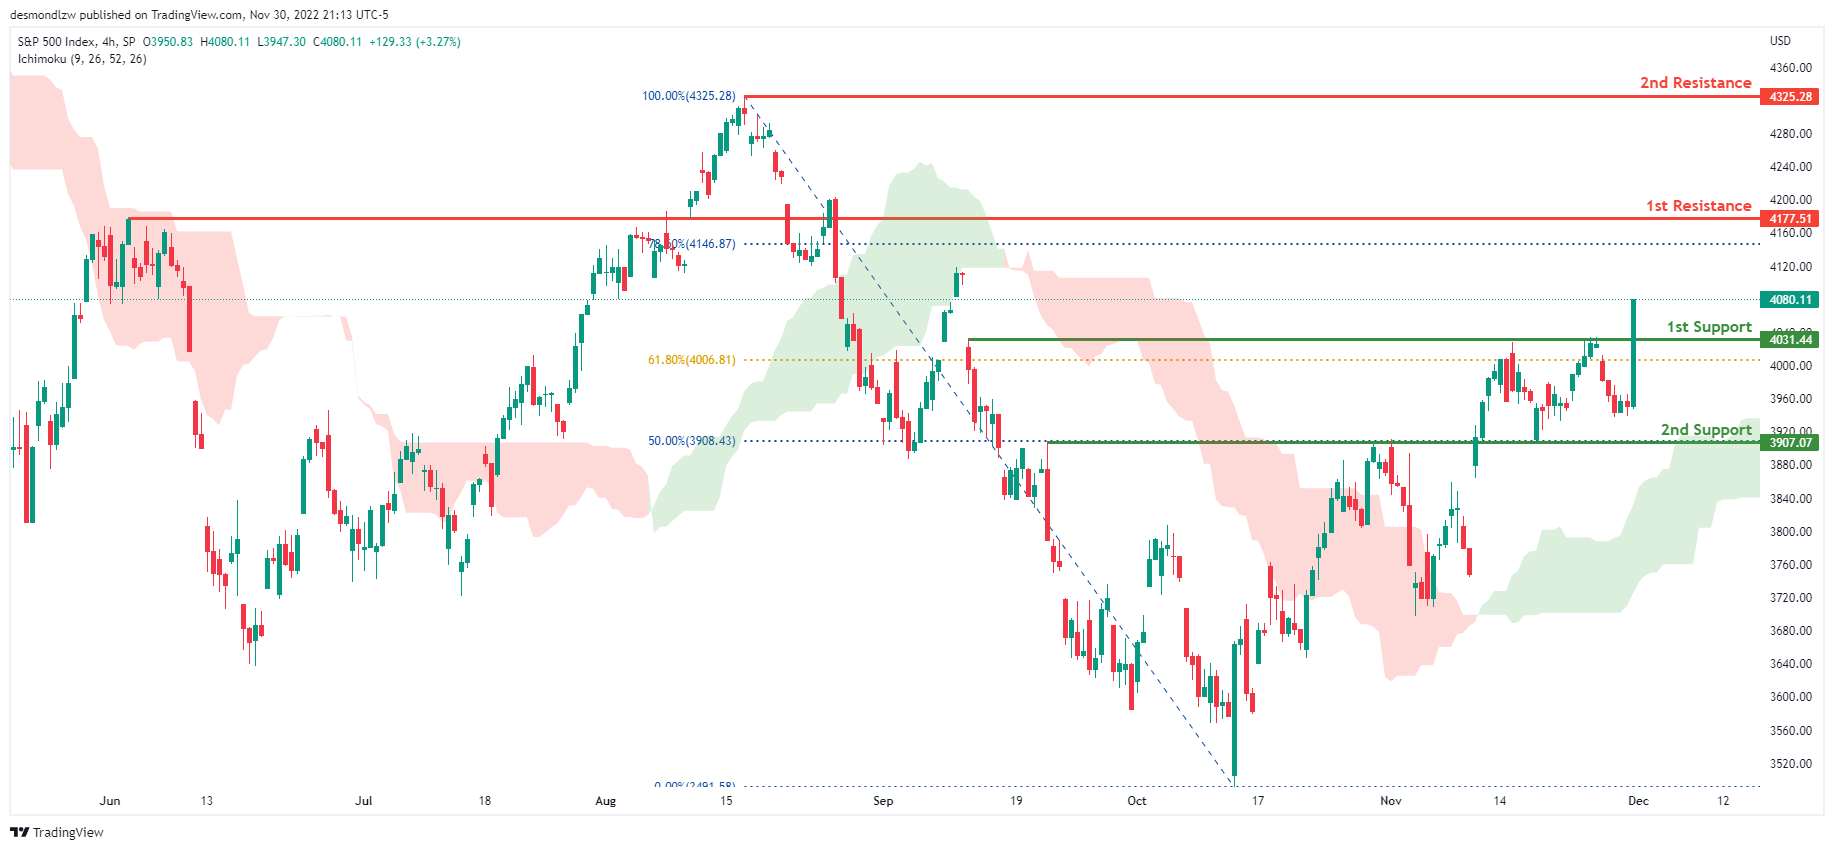
The overall bias for the S&500 on the H4 chart is bullish, with prices above the Ichimoku cloud. If the bullish momentum continues, expect price to head towards the 1st resistance line is at 4177.51, which is the 78.6% Fibonacci line is. In an alternate scenario, price could return to the 1st support line at 4031.44, where the 61.8% Fibonacci line is located.
Areas of consideration:
- H4 time frame, 1st support at 4031.44
- H4 time frame, 1st resistance at 4177.51
Crude Oil Price Regains Strength, US GDP Revised Higher To 2.9%
Key Highlights
- Crude oil price started a fresh increase above the $78 resistance.
- It broke a major bearish trend line with resistance near $78.75 on the 4-hours chart.
- Gold price started a consolidation phase above the $1,725 support.
- The US ISM Manufacturing Index could drop from 50.2 to 49.8 in Nov 2022.
Crude Oil Price Technical Analysis
Crude oil price started a fresh increase from the $74.00 support zone against the US Dollar. The price gained pace and traded above the $78.00 resistance zone.
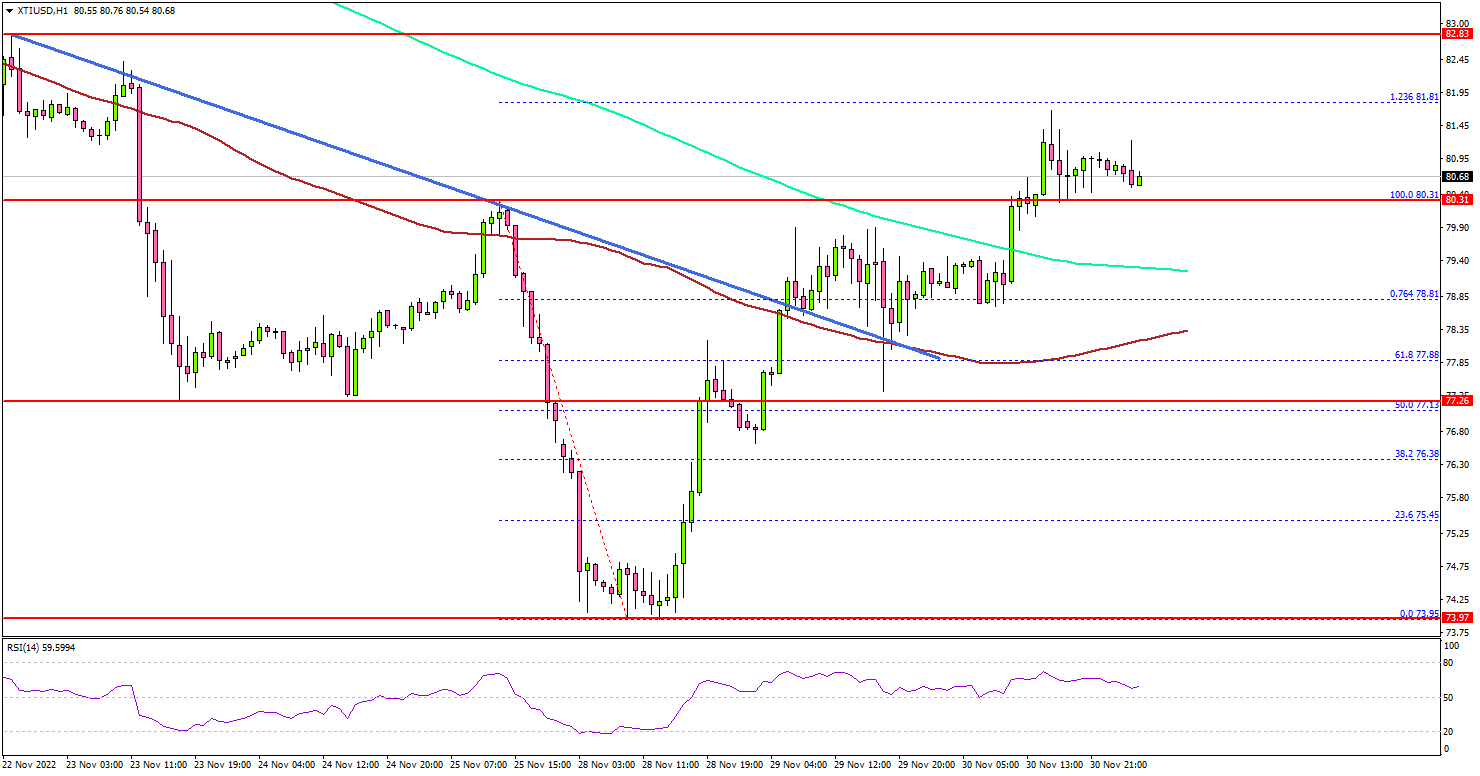
Looking at the 4-hours chart of XTI/USD, there was a break above a major bearish trend line with resistance near $78.75. It opened the doors for a move above the $80.00 resistance, the 100 simple moving average (red, 4-hours), and the 200 simple moving average (green, 4-hours).
The price even cleared the $80.30 swing high and tested the 1.236 Fib extension level of the downward move from the $80.31 swing high to $73.95 low.
On the upside, the price might face sellers near the $82.45 zone. The next major resistance is near $83.00, above which the price could test $85.00 resistance.
A clear move above the $85.00 resistance could open the doors for another steady increase in the coming sessions. An immediate support is now forming near the $80.00 zone.
The next major support is near $79.40 zone. Any more losses might call for a test of the $78.50 support zone or the 100 simple moving average (red, 4-hours).
Looking at gold price, there was a steady increase above the $1,720 and $1,725 resistance. It is now consolidating gains and eyeing more upsides.
Economic Releases to Watch Today
- Germany’s Manufacturing PMI for Nov 2022 - Forecast 46.7, versus 46.7 previous.
- Euro Zone Manufacturing PMI for Nov 2022 – Forecast 47.3, versus 47.3 previous.
- UK Manufacturing PMI for Nov 2022 – Forecast 46.2, versus 46.2 previous.
- US Manufacturing PMI for Nov 2022 – Forecast 47.6, versus 47.6 previous.
- US ISM Manufacturing Index for Nov 2022 – Forecast 49.8, versus 50.2 previous.
- US Initial Jobless Claims - Forecast 235K, versus 240K previous.
CHFJPY Wave Analysis
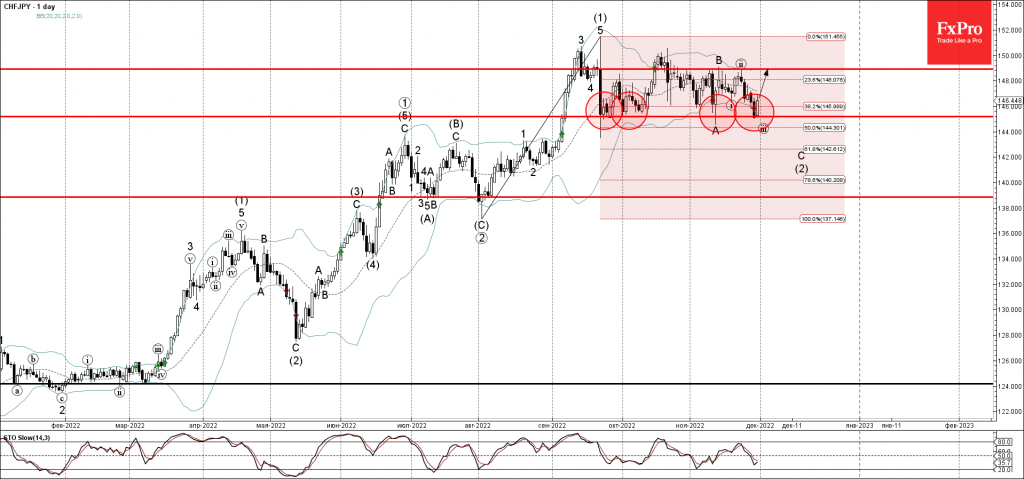
- CHFJPY reversed from support level 145.20
- Likely to rise to resistance level 148.90
CHFJPY today reversed up from the key support level 145.20 (which has been reversing the price from the end of September).
The support level 145.20 was further strengthened by the lower daily Bollinger Band and by the 38.2% Fibonacci correction of the upward impulse from August.
Given the clear daily uptrend, CHFJPY can be expected to rise further toward the next resistance level 148.90 (top of the earlier waves B and (ii)).
WTI Wave Analysis
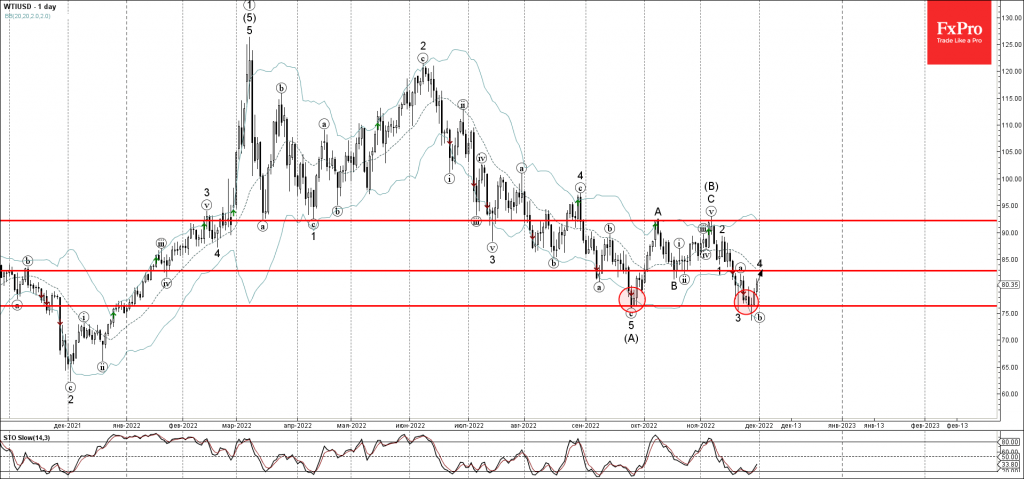
- WTI reversed from support level 76.30
- Likely to rise to resistance level 82.90
WTI crude oil earlier reversed up sharply from the major support level 76.30 (which stopped the previous wave (A) at the end of September).
The upward reversal from the support level 76.30 created the daily Japanese candlesticks reversal pattern Morning Star – with the central candle being the Long-legged Doji.
WTI crude oil can be expected to rise further toward the next resistance level 82.90 (target for the completion of the active correction 4).
ADP Warns of a Turning Point in the Labour Market
According to a new ADP report, the US private sector created 127K new jobs in November – the lowest since January 2021 and significantly below expectations (196K) and past data (239K). The accompanying commentary says that the labour market and pay have already begun to be affected by the Fed’s policy tightening, and fewer people are quitting. These are probably signs that people see fewer lucrative job openings.
Although the ADP reports earlier this year methodically turned out to be sharply weaker than the official data and were later revised upwards, this time, they complement the picture that the weekly jobless claims paint. There has been an increase in initial and repeated jobless claims for many weeks, as is often the case before economic cycles turn around.
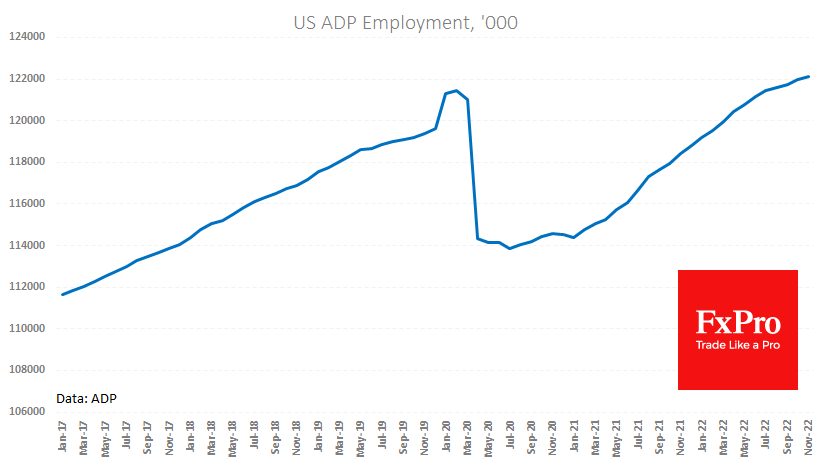
By sector, manufacturing has fallen by a staggering 100K, while the number of employees in professional services has dropped by 77K. Strong increases have been recorded in leisure/hospitality (224K) and trade (62K).
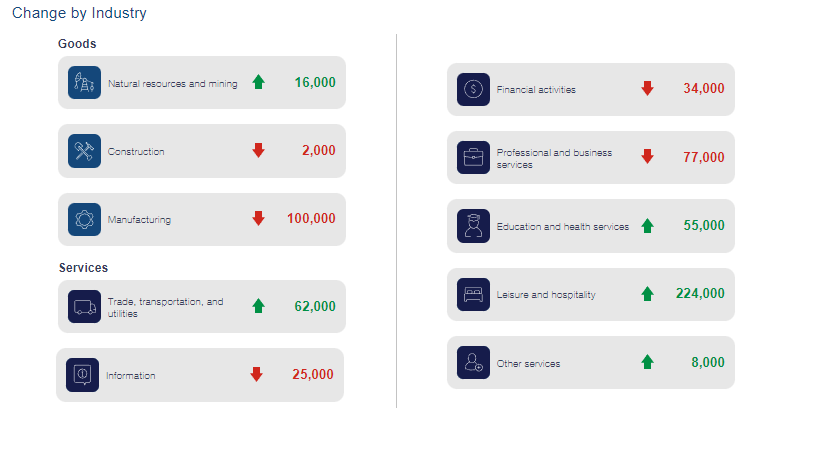
Today’s labour market data from the ADP should be regarded as a warning signal before the official data release on Friday. According to the market logic of recent weeks, weakness in the data should cause the dollar to weaken, suggesting that the Fed will hike less aggressively and stop at a lower level. However, given the FOMC’s determination to fight inflation expectations, even such data may be needed.
It would probably make sense for investors and traders to take note of the figures but refrain from taking any active steps, at least until the Fed’s position, which may be announced later today by Powell or the Beige Book, has been clarified. But also, there could be a lack of strong market moves up to Friday’s NFP.
Sunset Market Commentary
Markets
European inflation eased a little more than expected from 10.6% to 10% in November vs 10.4% expected. The downside surprise wasn’t really one after several national readings flagging the possibility of this to happen. Energy and services costs helped ease the number, even as food prices rose more quickly. Markets seemed to focus more on the core reading instead as ECB governors, including de Guindos on Tuesday, recently shifted the focus from headline to core inflation. This gauge stabilized at 5% y/y, suggesting still-strong and unabating underlying price pressures. It turned out to be the dominant element in the market reaction. European/German yields jumped 5 bps intraday after the release even as today’s figures cemented the case for a 50 bps (instead of a third 75 bps) rate hike by the ECB. Net daily changes currently range between 0.3 bps (30y) to 4.5 bps (5y) for German bonds. Swaps outperform Bunds by about 2 bps across the curve. The ECB reported that it will pause APP and PEPP reinvestments between December 21 and January 1. While that probably entails only a limited amount (explaining the muted market reaction), it still grabbed some headlines with the central bank poised to outline a quantitative tightening blueprint in December. Other economic data contained the US ADP job report serving as a preview on the official payrolls report on Friday. November job growth amounted to 127k, a deceleration from the 239k in October. While also less than the 200k forecasted, US yields extended an earlier advance, bringing daily gains between 2.1 bps (30y) to 5.7 bps (2y). This may have come on the account of the US’ second quarterly GDP and PCE reading which were published at the same time. Q3 GDP growth was revised upwards from 2.6% q/q annualized to 2.9% on the back of stronger than previously assumed personal consumption. Core PCE was lifted from 4.5% to 4.6% q/q.
The FX market is dominated by three currencies today. The dollar and the Japanese yen make up two out of the three. Both are trading on the backfoot and are the weakest for the day in the G10 landscape. The trade-weighted DXY eases from 106.82 to 106.43 currently. EUR/USD erases yesterday and Monday’s losses to change hands close but below 1.04. USD/JPY is a balance of weakness narrowly tilting in favor of the USD. The pair rises to 139.28. The Norwegian krone outperforms major peers after the Norges Bank said it will lower purchases of FX to 1900 million NOK in December (about half of what was expected and bought in November). It was an unexpected decrease and the NB didn’t explain why. However, the drop in energy prices – meaning lower inflows which are in turn used to fund the budget deficit – is seen as a key reason. EUR/NOK fell from 10.33 to 10.25 after the NB announcement.
News Headlines
“In short, no funds will flow until the essential milestones are properly implemented”. EC Vice-President Dombrovskis was clear in his press conference concerning EU funds towards Hungary. EC Justice Commissioner Reynders added that there’s no partial payment for partial fulfillment. The EU did recommend to conditionally approve Hungary’s Covid-recovery plan so that it won’t lose access to €5.8bn from this specific source after year-end. Funds will only flow on condition of implementing reforms concerning graft and the erosion of the rule of law. Separately, the EU will freeze €7.5bn of funds from the multi-annual EU budget until it enacts a set of rules aimed at rooting out graft in the government. The forint weakened again today with EUR/HUF moving towards 410.
The Swiss KOF leading indicator (November) unexpectedly slipped for a fifth month running to its lowest level since July 2020: from 90.9 to 89.5. The outlook for the Swiss economy therefore remains subdued in the coming months. The new downleg was primarily driven “other services”. “Accommodation and food service activities” and “private consumption” are also weakening. “Foreign demand” records a slight positive development. The picture in the goods producing sector (manufacturing and construction) is mixed. Production capacities, inventories and the competitive situation are the main contributors to the overall negative development. By contrast, indicators assessing the situation for intermediate products, obstacles to production and the order backlog are sending out positive signals. On an industry level, worst data came from metals, followed by wood and paper products and machinery and vehicle manufacturing.