Sample Category Title
Euro Inflation Notes – A ‘Sticky’ Problem
On the face of it, the November flash HICP figures brought a welcome decline in headline inflation from 10.6% to 10.0%. However, we think the evidence for a similar peak in underlying inflation pressures is less clear-cut and 'stickily' high core inflation could remain a concern for ECB for some time yet.
Firms continue to pass-on higher input costs to consumers and in spite of an approaching recession, we expect this process of cost-push inflation to extend into 2023, keeping price pressures elevated for longer. Despite the moderation in natural gas and electricity prices, delayed pass-through to household bills will mean energy price inflation will abate only gradually, while the downside risk from price caps seems limited. Core inflation will prove sticky in our view, due to second round effects from higher energy, material, but also labour costs.
We forecast euro area HICP inflation to average 7.2% in 2023 and 2.9% in 2024. Core inflation will return to the ECB's target only in H2 24. In light of ongoing cost-push inflation, we think markets are underestimating the 'stickiness' in euro inflation, with the green transition and higher than expected wage growth still presenting upside risks.
BoE Pill expects headline inflation to tail off in 2nd half of next year quite rapidly
BoE Chief Economist Huw Pill said at a conference, "we are expecting to see headline inflation tail off in the second half of next year, in fact quite rapidly, on account of those base effects." But, "there's a lot of uncertainty around the outlook for gas price developments," he added.
"Very low levels of unemployment and the association with the mid-1970s is not entirely reassuring from an inflection point of view," Pill said. "People in the 50 to 65 age group, relative to pre-COVID levels, are having a higher level of inactivity not being in a job and not looking for work."
EURCAD Builds Uptrend; Overbought Signals Strengthen
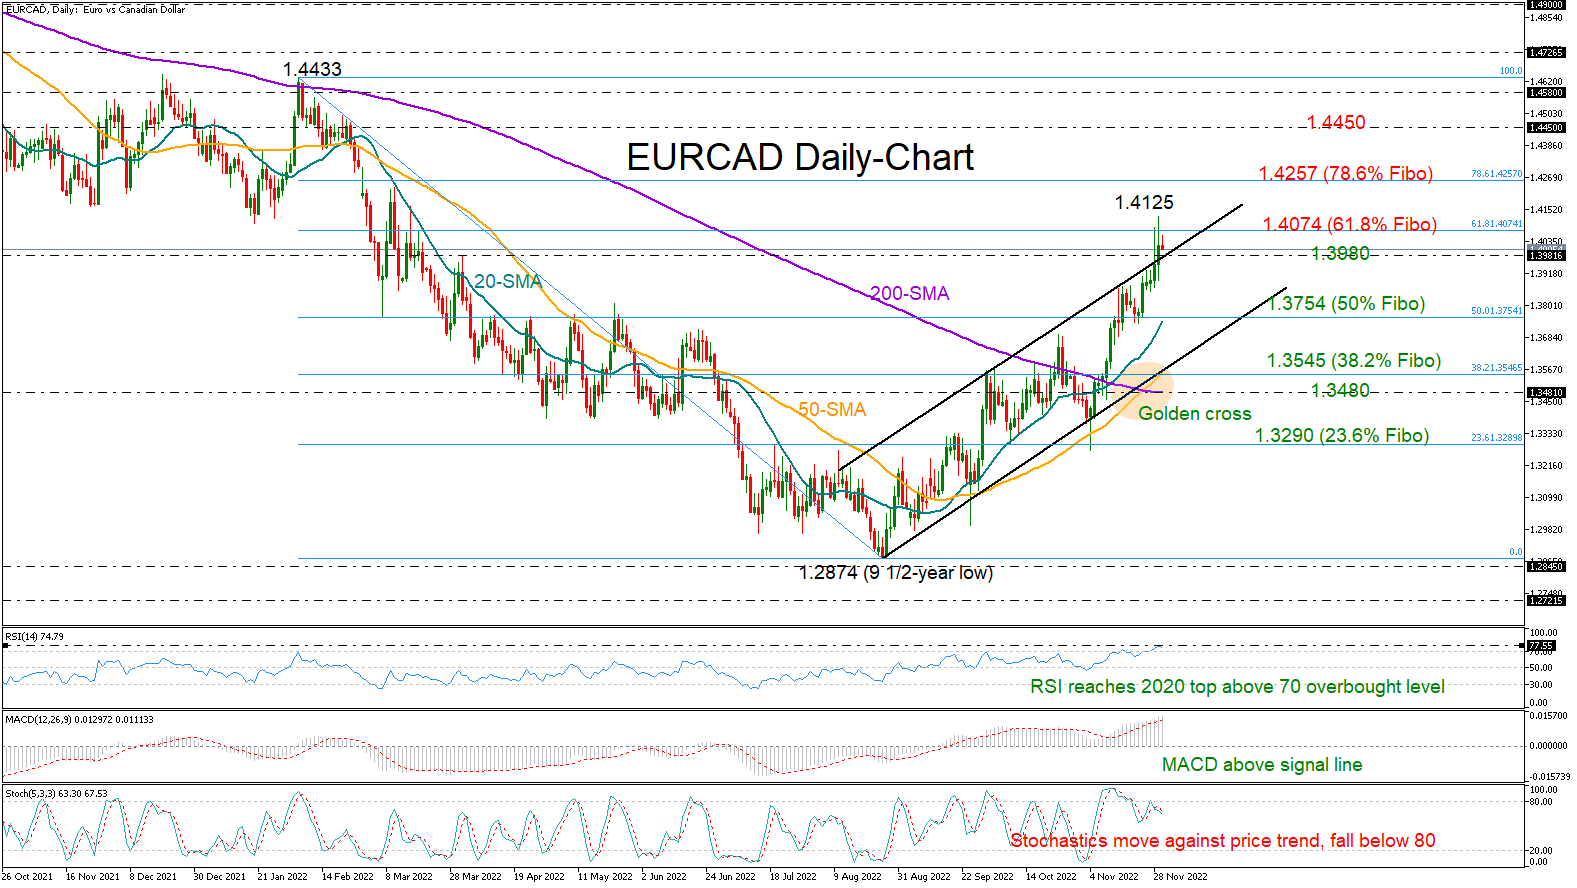
EURCAD has rallied by almost 10% since the plunge to a nine-and-a-half year low of 1.2874 in August, retracing more than half of its 2022 downtrend.
On Tuesday the price accelerated above a bullish channel to mark a new higher high at 1.4125, but it soon lost momentum to close below the 61.8% Fibonacci retracement of the 2022 downtrend.
With the stochastics showing bearish divergence and the RSI having reached its 2020 top in the overbought territory, a downside correction looks increasingly likely. That said, the golden cross between the 50- and 200-day simple moving averages (SMAs), which is the first posted since 2020, suggests that a potential downside correction might be part of the ongoing uptrend.
A sustainable move above 1.4074 could reduce negative risks, prompting an advance towards the 78.6% Fibonacci of 1.4257. Running higher, the bulls will need to overcome the 1.4450 bar to secure an extension up to the 2022 high of 1.4433.
Alternatively, a move back into the channel (1.3980) may dampen market sentiment, bringing the 20-day simple moving average (SMA) and the 50% Fibonacci of 1.3754 next into view. Even lower, the bears will push for a break below the channel at 1.3545. This is where the 50-day SMA and the 38.2% Fibonacci are placed too. Hence, failure to pivot here, and more importantly around the 200-day SMA at 1.3480, could see the price diving straight to the 23.6% Fibonacci of 1.3290.
In brief, EURCAD is trading bullish, but some caution is required as the room for improvement seems to be narrowing according to technical signals.
EURUSD Edges Higher as CPI Falls
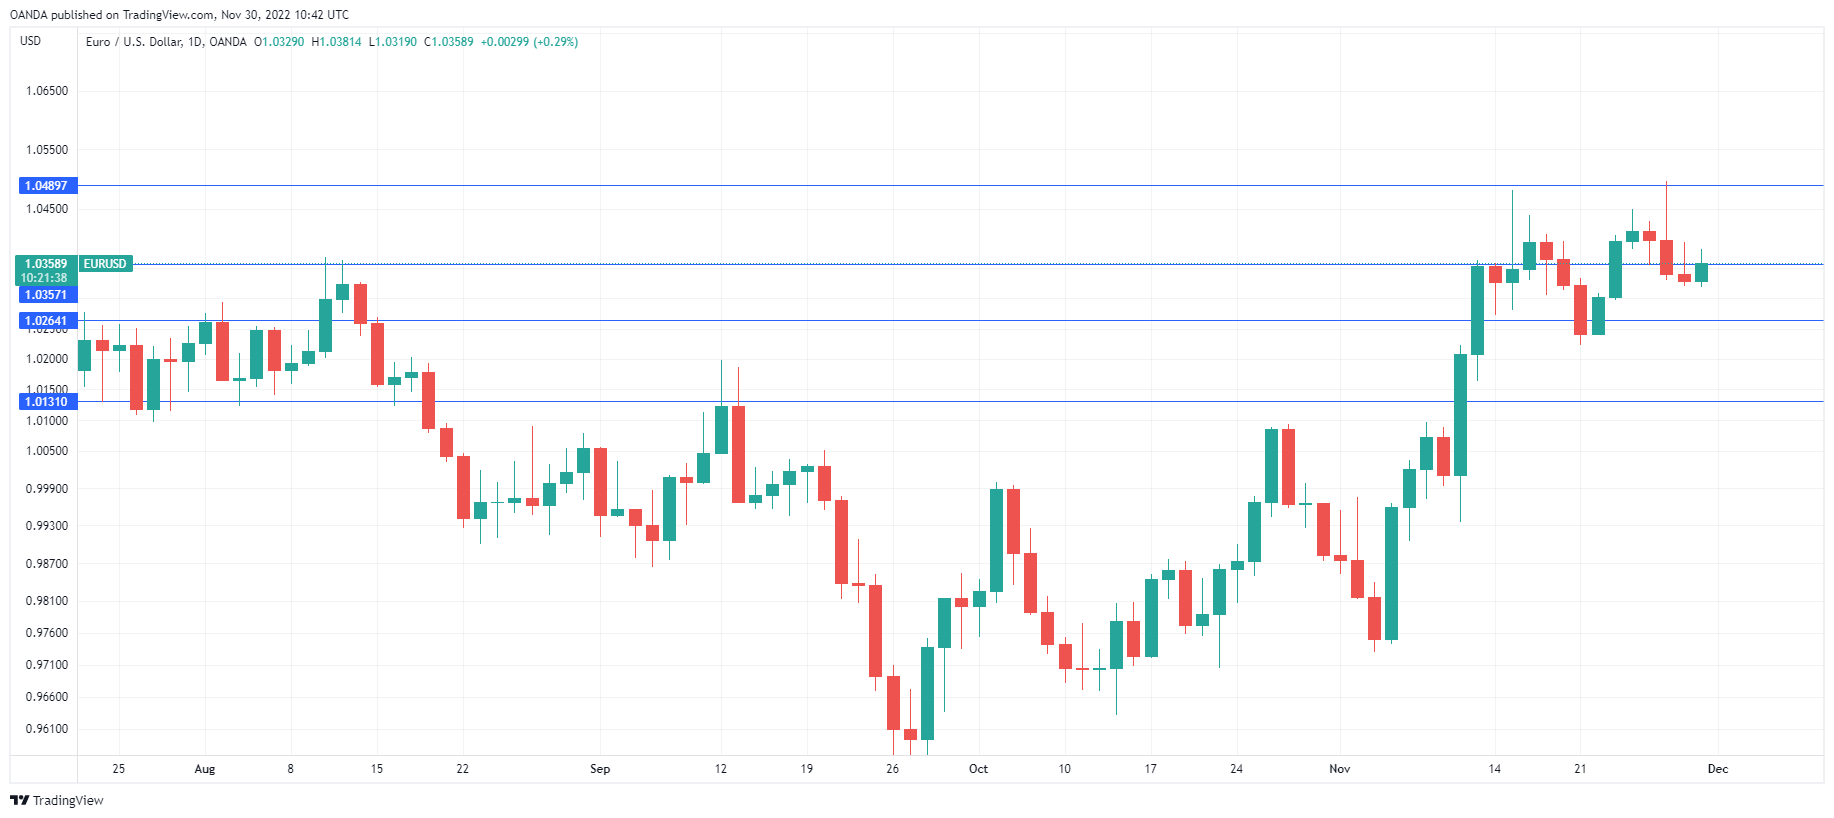
It continues to be a quiet week for the euro. In the European session, EUR/USD is trading at 1.0363.
Eurozone inflation falls to 10.0%
The ECB’s number one priority has been bringing down inflation, which has hit double-digits. ECB policy makers are no doubt pleased that November CPI fell sharply to 10.0%, down from 10.6% a month earlier. This beat the consensus of 10.4%, and the euro has responded with slight gains.
The drop in eurozone inflation was the first since June 2021, and investors will be hoping that this indicates that inflation is finally peaking. On Tuesday, German CPI showed a similar trend, falling to 10.0%, down from 10.4% (10.3% est). Still, eurozone Core CPI remained unchanged at 5.0%, matching the forecast. One inflation report is not sufficient to indicate a trend, and with inflation still in double digits, nobody is declaring victory in the battle against inflation. Still, the drop in German and eurozone inflation increases the likelihood of a 50 basis-point increase at the December 12th meeting, following two straight hikes of 75 basis points.
With market direction very much connected to US interest rate movement, a speech from Fed Chair Jerome Powell later today could be a market-mover. Powell is expected to discuss inflation and the labour market, and his remarks could echo the hawkish stance that Fed members have been signalling to the markets over the past several weeks. The market pricing for the December meeting is 65% for a 50-bp move and 35% for a 75-bp hike, which means that the markets aren’t all on the Fed easing rates. Even if the Fed does slow to 50 bp in December, it will still be a record year of tightening, at 425 basis points.
EUR/USD Technical
- EUR/USD is testing resistance at 1.0359. Above, there is resistance at 1.0490
- There is support at 1.0264 and 1.0131
AUD/USD Holds Support after CPI Data – Elliott Wave Points Higher
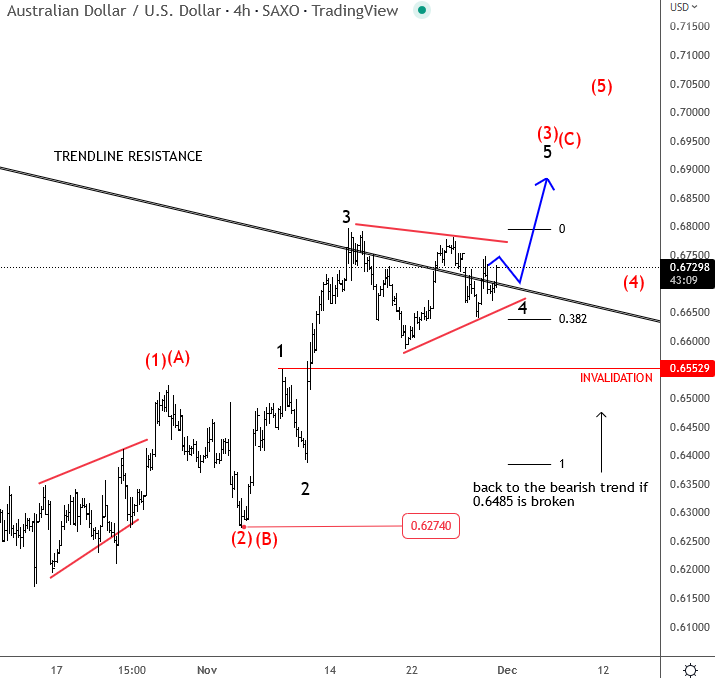
Market is slow ahead of Powell speech today, when we will get more decisions about their policy rates. For now, the risk-on is still on the table after China announced that they will allow close contacts of Covid cases to quarantine at home. They also said that they will strengthen vaccinations which sounds positive. AUD CPI data came lower y/y, at 6.9% from 7.6% expected. Inflation is coming down, which means that RBA can be less hawkish but AUDUSD pair was still able to hold the support within a triangle. We see a-b-c-d-e subwaves in wave 4 so be aware of a break higher into wave 5. Rise above 0.68 can call 0.69. A drop below 0.6640 can cause a deeper pullback to 0.6550.
Aussie Higher after CPI Dips
The Australian dollar has extended its gains on Wednesday. AUD/USD is trading at 0.6723 in Europe, up 0.54%.
Australian inflation falls below 7%
Australia inflation surprised on the downside with a 6.9% gain (YoY) in October. This was down sharply from the 7.3% clip in September and beat the consensus of 7.4%. The burning question on everyone’s lips, is, of course, “has inflation finally peaked?” Before the champagne bottles come out, it’s worth noting that a new method was used to calculate October CPI – under the old method, CPI would have been 7.1%, a less dramatic decline. Core CPI ticked lower to 5.3%, down from 5.4%. Australia recently added monthly inflation reports to supplement the quarterly releases, and the monthly reports are more volatile and may not mark a changing trend. Investors and policy makers will have to wait for the next quarterly CPI release in January to get a better handle on which direction inflation is headed.
There was positive news from the construction sector, as Construction Work Done rebounded in Q3 with a strong gain of 2.2%, above the consensus of 1.5%. This follows a -3.8% read in Q2 and was the first gain since Q3 2021.
The markets will be paying close attention to Jerome Powell, who is expected to touch upon inflation and the labour market in a speech later today. The Fed has orchestrated an effective Fedspeak blitz, with Fed members presenting a hawkish outlook for rate policy, even though the Fed has signalled it will ease up on rates in December and hike by “only” 50 basis points. This year will set a record for Fed tightening, with 425 basis points if the December increase is 50 bp. With the battle against inflation far from over, the last thing the Fed wants to temper any market exuberance, as a higher stock market could drive more inflation.
AUD/USD Technical
- AUD/USD continues to test resistance at 0.6707. The next resistance line is 0.6829
- There is support at 0.6633 and 0.6511
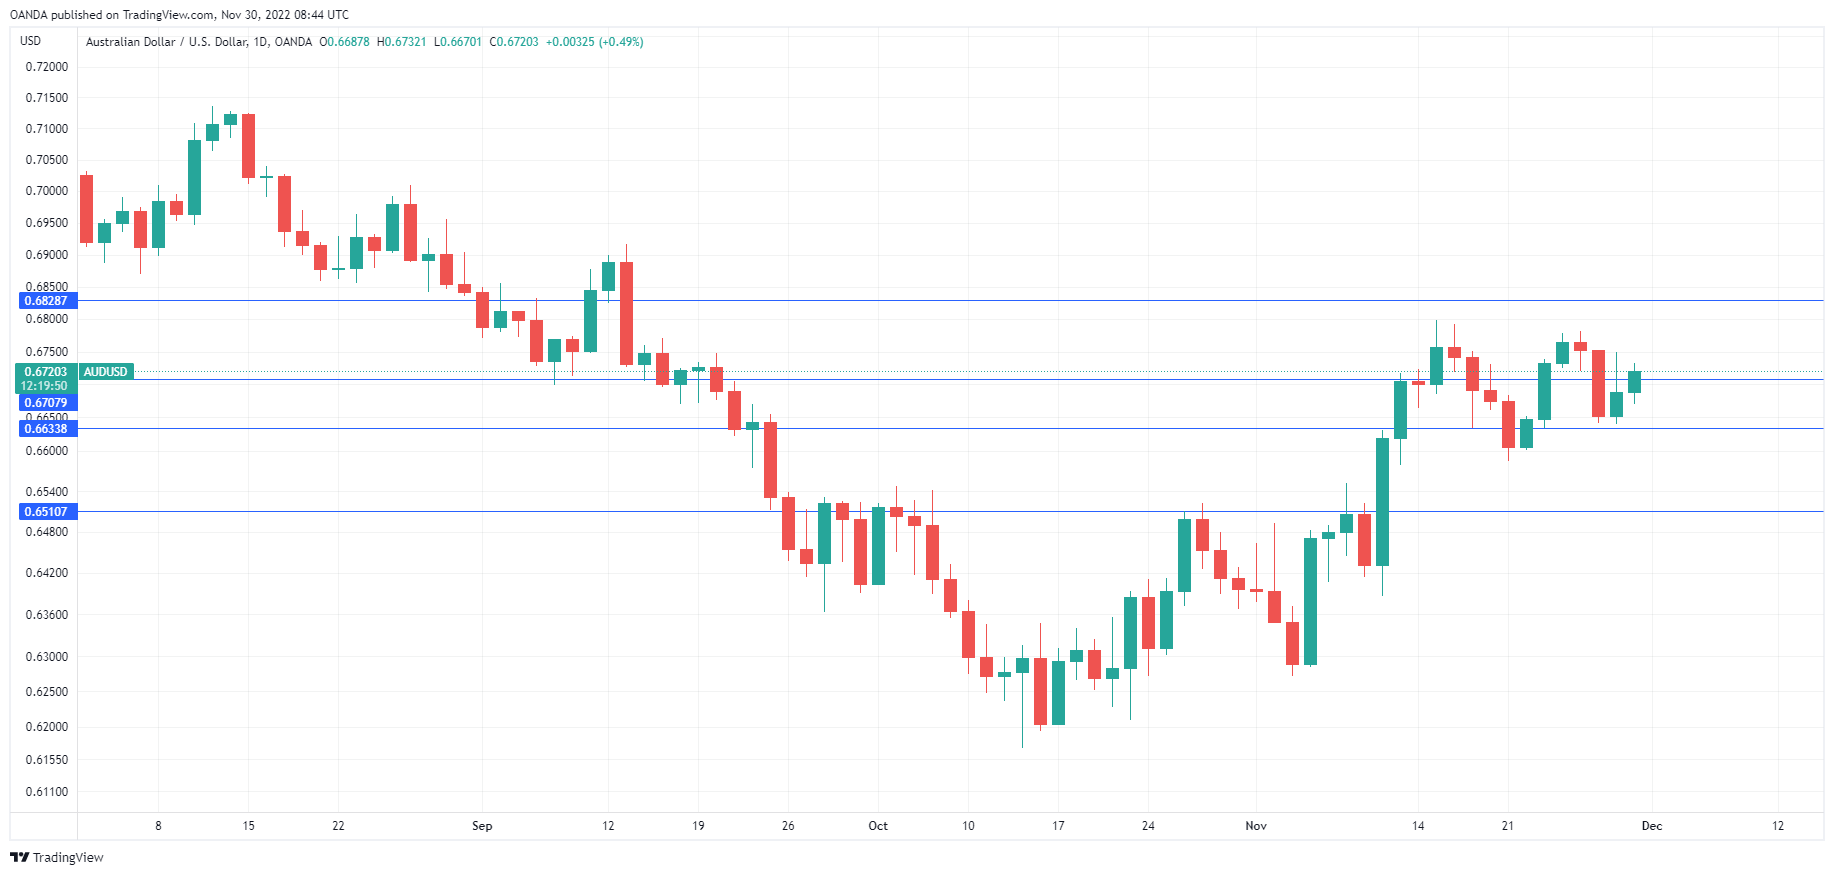
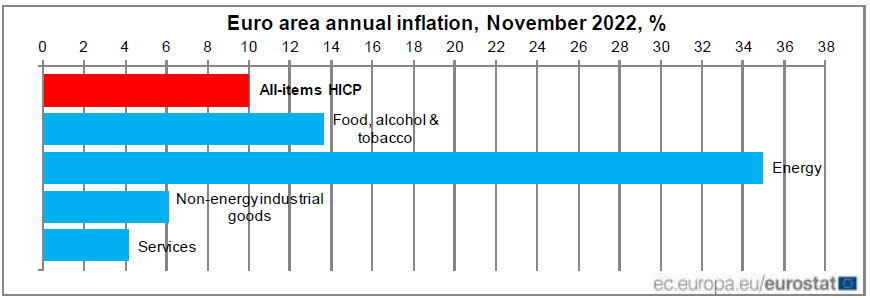
Eurozone CPI slowed to 10% yoy in Nov
Eurozone CPI slowed from 10.6% yoy to 10.0% yoy in November, below expectation of 10.4% yoy. CPI ex-energy rose from 6.9% yoy to 7.0% yoy. CPI ex-energy, food, alcohol and tobacco was unchanged at 5.0% yoy.
Looking at the main components, energy is expected to have the highest annual rate in November (34.9%, compared with 41.5% in October), followed by food, alcohol & tobacco (13.6%, compared with 13.1% in October), non-energy industrial goods (6.1%, stable compared with October) and services (4.2%, compared with 4.3% in October).
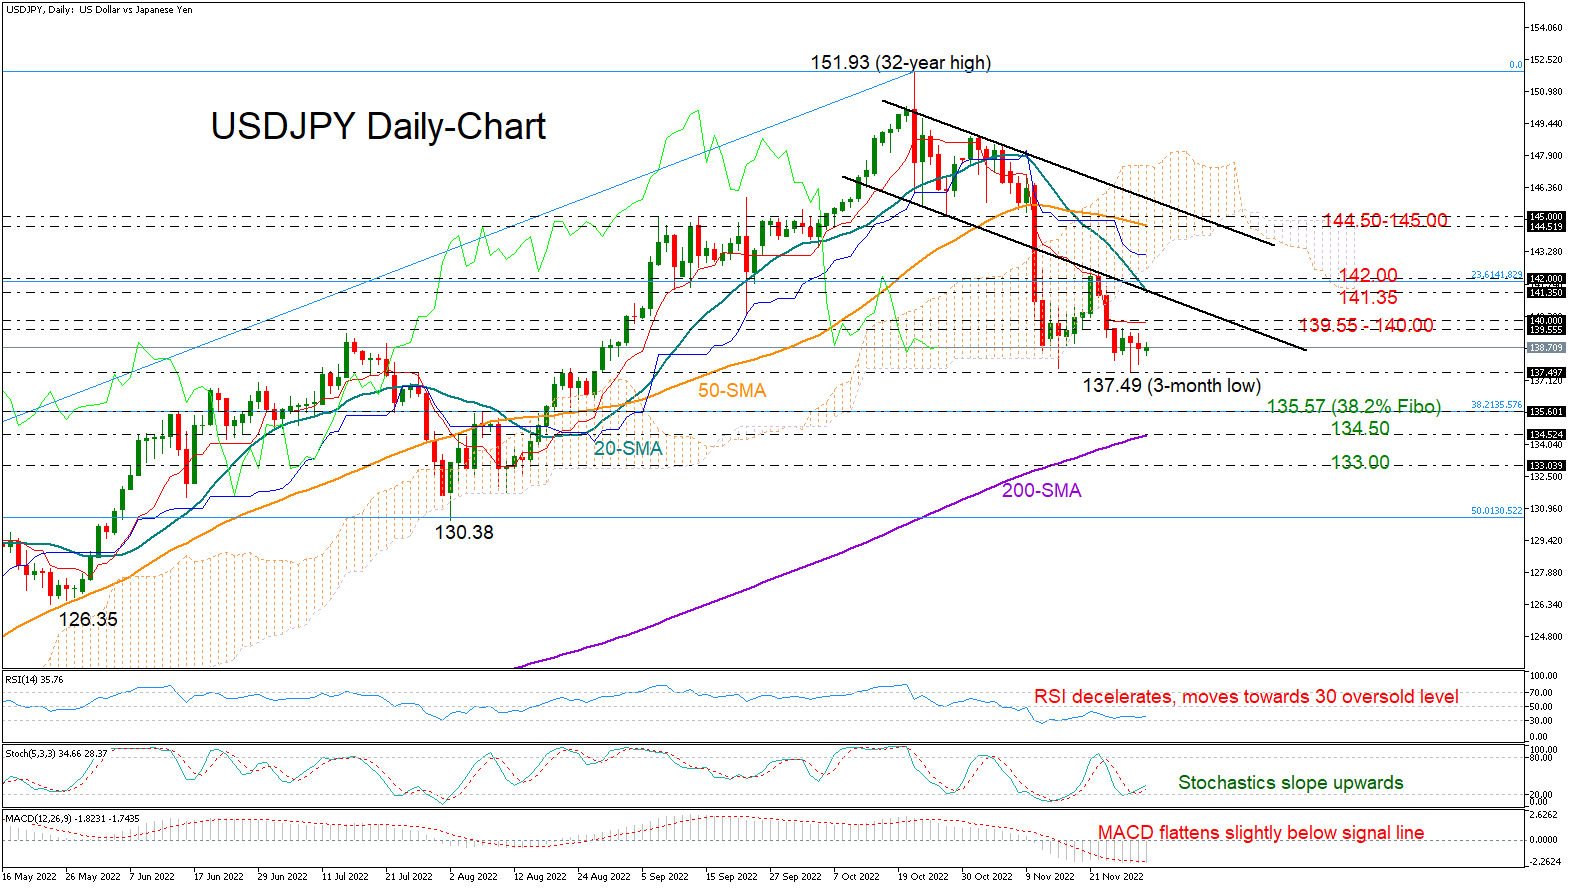
USDJPY Lacks Bullish Motives Near November’s Low
USDJPY shifted to the sidelines following last week’s aggressive downfall from the 142.00 area, consolidating its losses between 139.55 and 137.49.
Even though the pair is searching for a foothold near November’s low of 137.49, the technical signals have yet to identify strong buying motives. Particularly, the RSI has been struggling to gain ground following the exit from the oversold territory, while the MACD has been flattening slightly below its red signal line and within the negative area.
If selling pressures resurface below November’s trough, all eyes will turn to the 38.2% Fibonacci retracement of the 109.10-151.93 uptrend at 135.57. However, the 200-day simple moving average (SMA), which hasn't been tested since February 2021, could be a more important barrier at 134.50. A decisive close below it could confirm additional losses towards the 133.00 round level.
On the upside, a break above 140.00 is required to boost the price towards the 20-day SMA at 141.35. The channel’s lower boundary is in the same area, while the 23.6% Fibonacci of 141.89 is also within breathing distance. Should the pair re-enter the 142.00 zone, the recovery may speed up to the 50-day SMA at 144.57.
All in all, the ongoing sideways move in USDJPY remains exposed to a breakdown. A step below 137.49 could trigger the next bearish phase in the market.
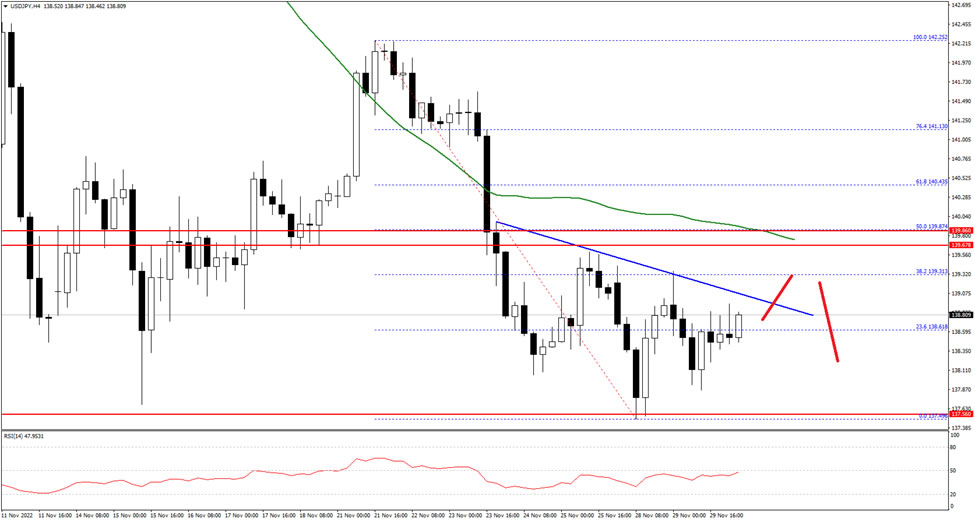
USD/JPY Pair is Currently Correcting Losses from the 137.49 Low
The US Dollar started a fresh decline from the 142.25 resistance zone against the Japanese Yen. The USD/JPY pair traded below the 141.20 level to move into a short-term bearish zone.
The pair traded as low as 137.49 and is currently correcting losses below the 50 hourly simple moving average. An immediate resistance on the upside is near the 139.00 level and a connecting bearish trend line on the hourly chart.
The next major resistance is near 139.80 on FXOpen. A clear break above the 139.80 resistance could push the price towards 141.20. The next major resistance is near the 142.00 level.
On the downside, an initial support is near the 138.00 zone. The next major support sits near the 137.50 level, below which there is a risk of more downsides towards the 136.80 level.
Swiss KOF dropped to 89.5, economic outlook remains subdued
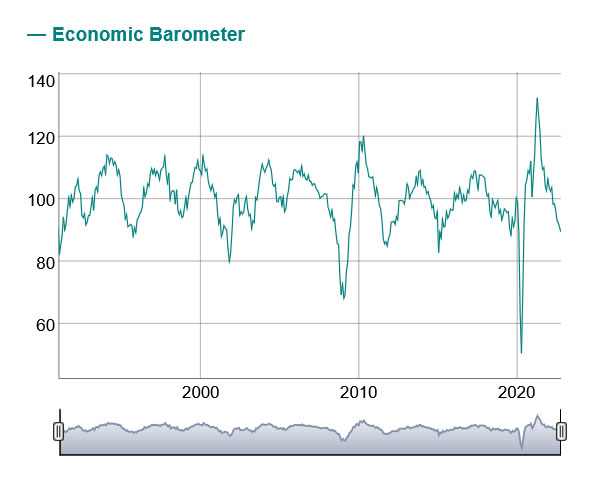
Swiss KOF Economic Barometer dropped from 90.9 to 89.5 in November, matched expectations. KOF said, "This is the fifth time in a row that the barometer has fallen. The outlook for the Swiss economy therefore remains subdued in the coming months."
KOF added: "The negative development of the barometer is primarily driven by indicator bundles for the sector other services. Indicators for the accommodation and food service activities sector and private consumption are also weakening. In contrast, indicator bundles covering foreign demand record a slight positive development."