Sample Category Title
Markets Cautious, Awaiting Eurozone CPI and Development in China
Overall, the forex markets are very cautious for now, awaiting the key events of the week, including Eurozone CPI flash today and US non-farm payrolls on Friday. There is no breakthrough in the unrest in China, with reports of escalation in protests in manufacturing center of Guangzhou. Yen and Dollar are now the stronger ones fro the week, followed by Euro. Canadian Dollar is the worst performer, following the selloff overnight. Sterling and Aussie are the next weakest.
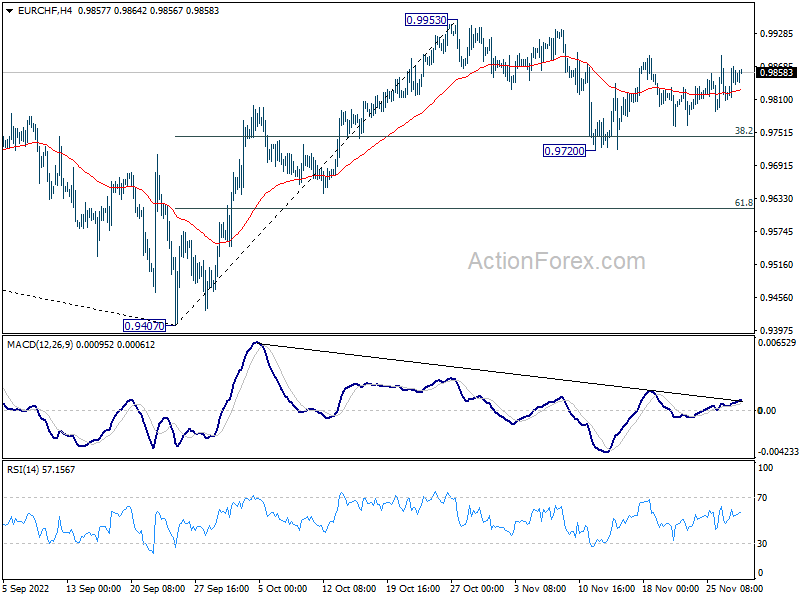
Technically, EUR/CHF is worth a watch today with Eurozone CPI featured. The price actions from 0.9720 are corrective looking so far, suggesting that it's merely the second leg of the corrective pattern from 0.9953 short term top. That is, in case of further rise, upside would likely be capped by 0.9953 to bring the third leg. In case of deeper decline, some support might be seen around 0.9720 to contain downside. That is, range trading should continue for a while, unless, something substantial happens.
In Asia, at the time of writing, Nikkei is down -0.37%. Hong Kong HSI is up 0.84%. China Shanghai SSE is up 0.18%. Singapore Strait Times is up 0.03%. Japan 10-year JGB yield is up 0.003 at 0.257. Overnight, DOW rose 0.01%. S&P 500 dropped -0.16%. NASDAQ dropped -0.59%. 10-year yield rose 0.045 to 3.748.
China PMI manufacturing dropped to 48.0, non-manufacturing down to 46.7
China NBS PMI Manufacturing dropped from 49.2 to 48.0 in November, below expectation of 49.2. PMI Non-Manufacturing dropped from 48.7 to 46.7, below expectation of 48.0. Both readings were the lowest in seven months.
"In November, impacted by multiple factors including the wide and frequent spread of domestic outbreaks, and the international environment becoming more complex and severe, China's purchasing managers' index fell," NBS senior statistician Zhao Qinghe said in a statement.
Zhao said domestic outbreaks in November caused "production activity to slow down and product orders to fall", noting "increased fluctuation in market expectations".
Japan industrial production dropped -2.6% mom in Oct, but bounce back expected
Japan industrial production dropped -2.6% mom in October, worse than expectation of -1.8% mom.
The seasonally adjusted production index for the manufacturing and mining sectors stood at 95.9 against 100 for the base year of 2015. The shipment index stood at 94.1, down -1.1%, and the inventory index at 103.0, down -0.8%.
The Ministry of Trade, Economy and Industry expects production to rise 3.3% in November and then 2.4% in December.
METI cut its assessment of industrial output for the first time in five months, saying "production is gradually picking up, but some weaknesses are observed."
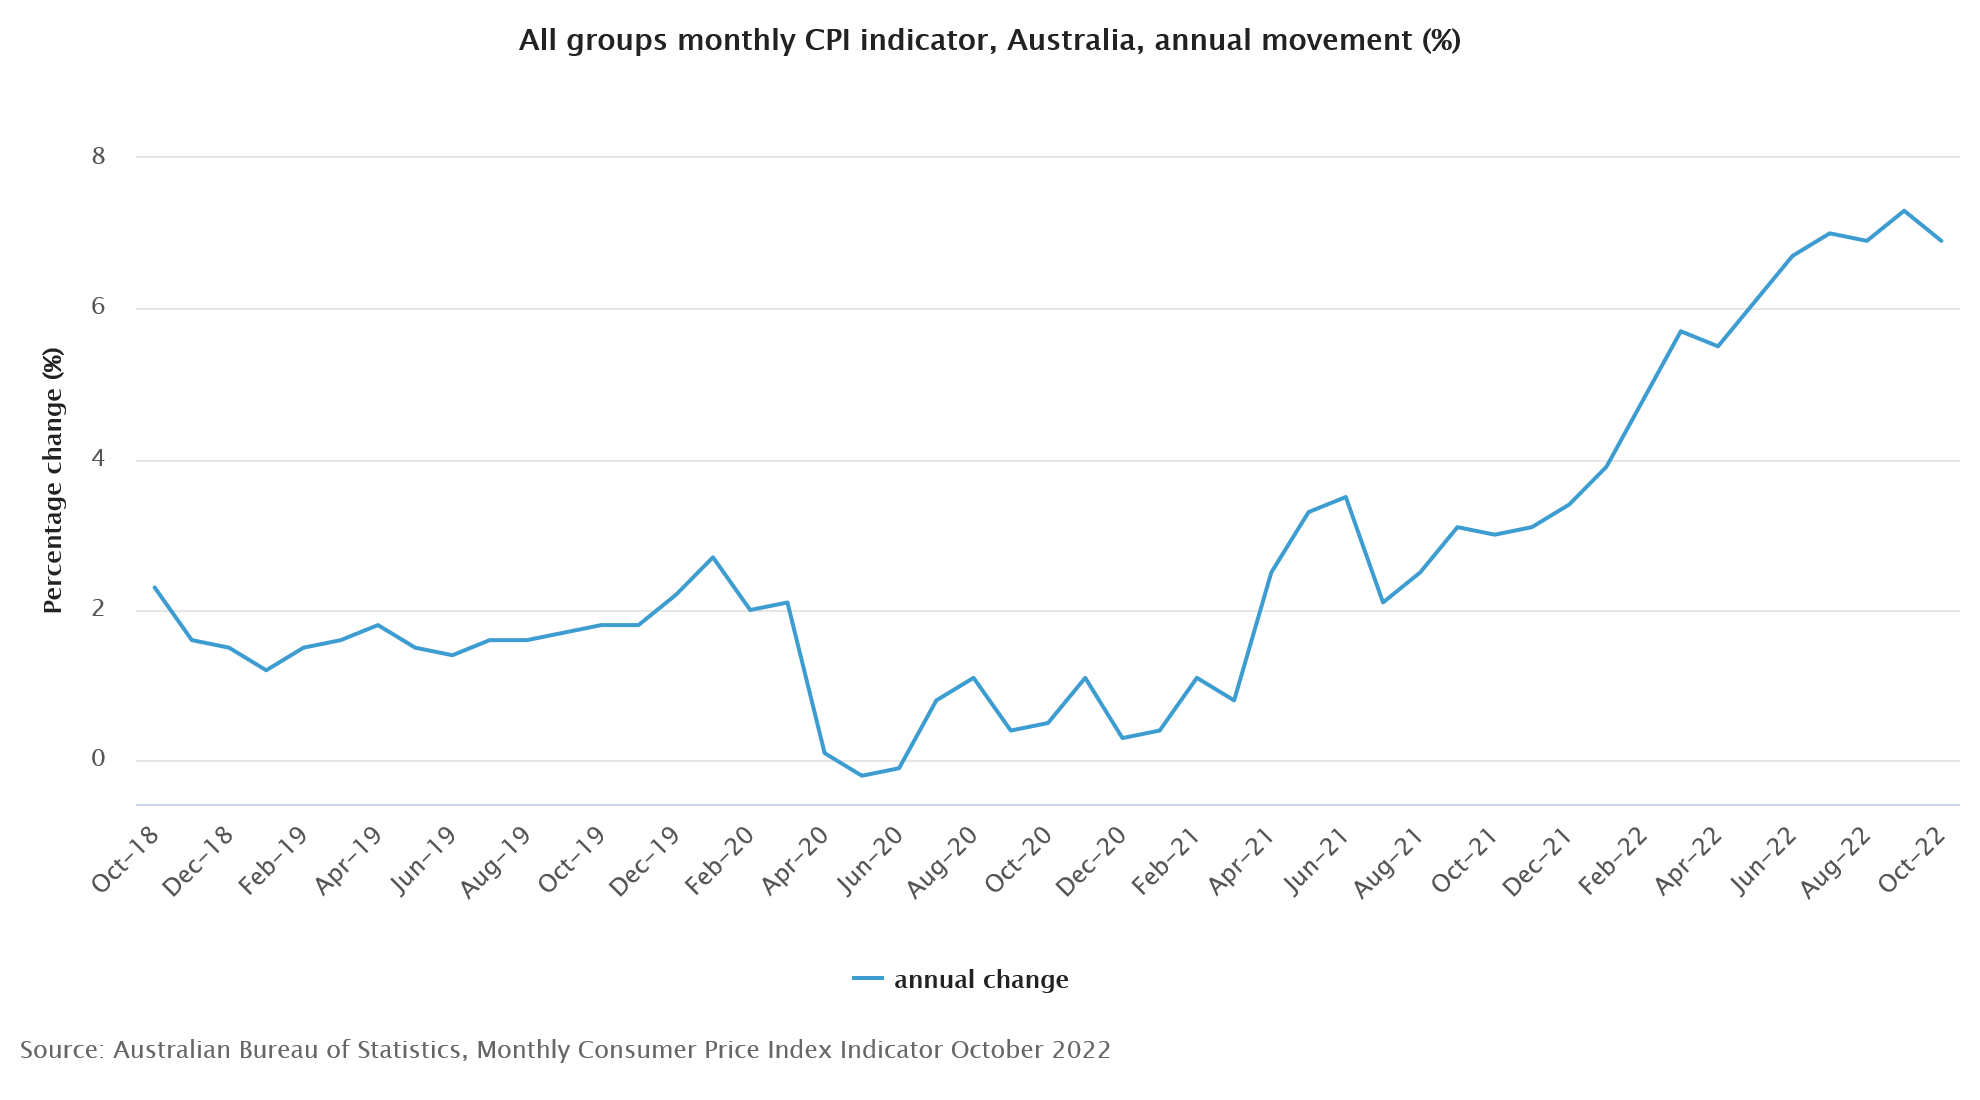
Australia monthly CPI slowed to 6.9% yoy in Oct, food inflation eased
Australia monthly CPI slowed from 7.3% yoy to 6.9% yoy in October. The most significant contributors to the annual rise were new dwellings (+20.4%), automotive fuel (+11.8%) and fruit and vegetables (+9.4%).
"High levels of building construction activity and ongoing shortages of labour and materials contributed to the rise in new dwellings" Michelle Marquardt, ABS Head of Prices Statistics said.
Automotive fuel prices accelerated from 10.1% to 11.8% as the government's temporary cut to the fuel excise ended on September 29. Annually, prices for fruit and vegetables rose by 9.4%, down from 17.4% in September.
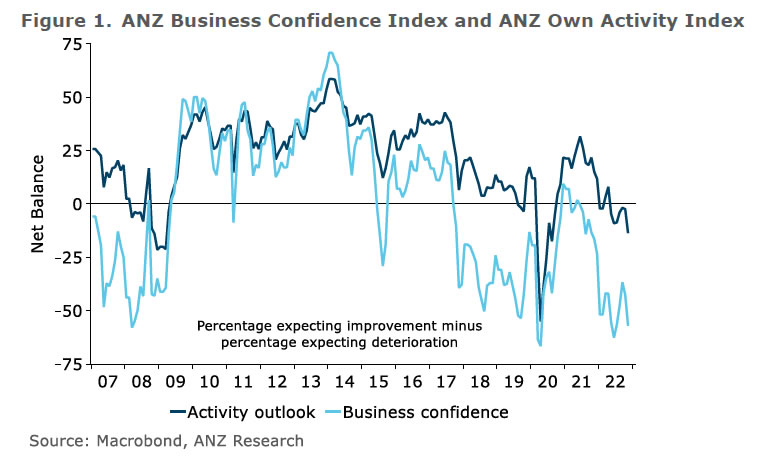
NZ ANZ business confidence dropped to -57.1, strain showing for businesses
New Zealand ANZ Business Confidence dropped from -42.7 to -57.1 in November. Looking at some details, own activity outlook dropped from -2.5 to -13.7, just 8 pts shy of 2009 lows. Export intentions dropped from -4.3 to -5.4. Investment intentions dropped from 1.1 to -8.1. Employment intentions dropped from 5.0 to -4.0. Pricing intentions dropped from 64.5 to 58.5. Cost expectations ticked up from 88.6 to 88.7. Inflation expectations rose from 6.13 to 6.39.
ANZ said, "The strain is showing for kiwi businesses. Cost increases remain relentless and margins are squeezed, firms are chronically understaffed, and they're waiting for the hammer to fall as the impact of relentless monetary policy tightening eventually kicks in. There are a lot of dark clouds on the horizon, and this month's survey reflects that."
Looking ahead
France GDP and consumer spending, Swiss KOF, Germany unemployment and Eurozone CPI flash will be released in European session.
Later in the day, US will release ADP employment, GDP revision, goods trade balance, Chicago PMI and pending home sales.
EUR/USD Daily Outlook
Daily Pivots: (S1) 1.0302; (P) 1.0348; (R1) 1.0376; More...
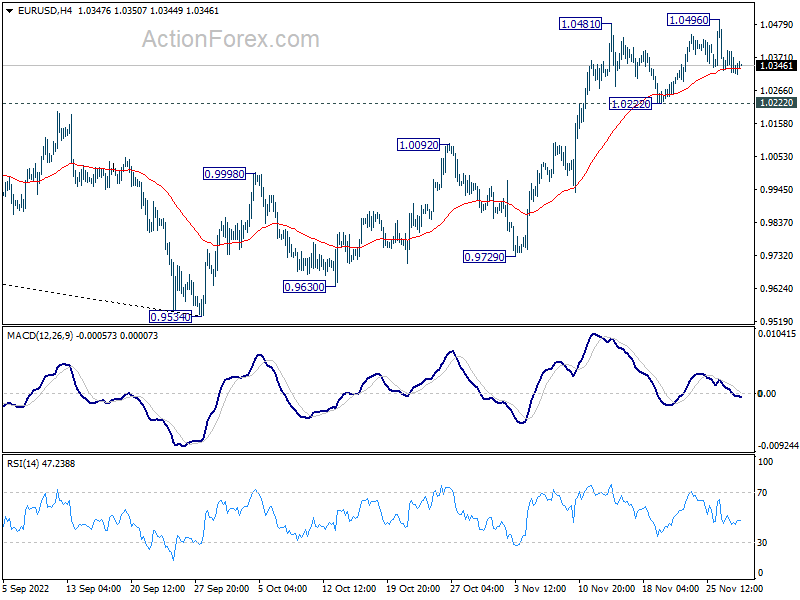
EUR/USD is still bounded in range trading and intraday bias remains neutral first. Further rally is expected as long as 1.0222 support holds. Break of 1.0496 will resume the rise from 0.9534 to 1.0609 fibonacci level. However, firm break of 1.0222 will turn bias back to the downside for 1.0092 resistance turned support.
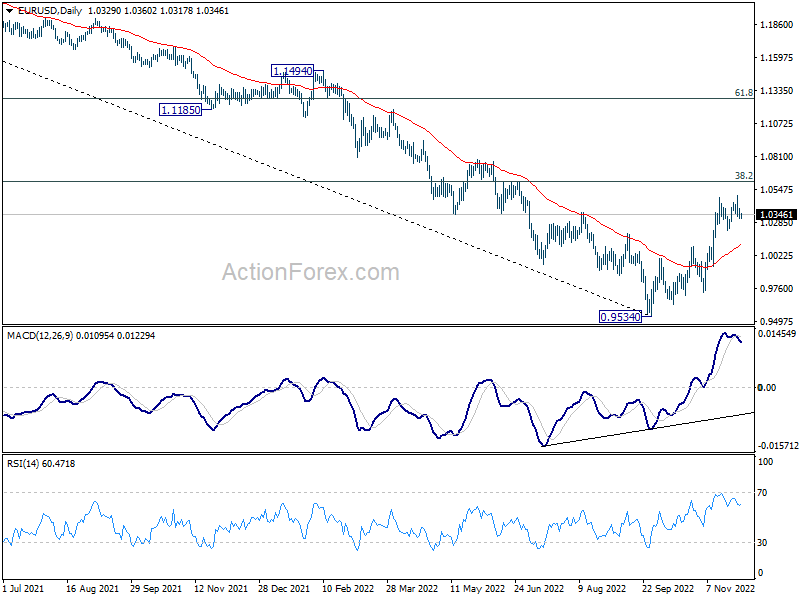
In the bigger picture, a medium term bottom was in place at 0.9534, on bullish convergence condition in daily MACD. Even as a corrective rise, rally from 0.9534 should target 38.2% retracement of 1.2348 (2021 high) to 0.9534 at 1.0609. Sustained trading above 55 week EMA (now at 1.0566) will raise the chance of trend reversal and target 61.8% retracement at 1.1273. This will now remain the favored case as long as 1.0092 resistance turned support holds.
Economic Indicators Update
| GMT | Ccy | Events | Actual | Forecast | Previous | Revised |
|---|---|---|---|---|---|---|
| 21:45 | NZD | Building Permits M/M Oct | -10.70% | 3.80% | 3.60% | |
| 23:50 | JPY | Industrial Production M/M Oct P | -2.60% | -1.80% | -1.70% | |
| 00:00 | NZD | ANZ Business Confidence Nov | -57.1 | -42.7 | ||
| 00:01 | GBP | BRC Shop Price Index Y/Y Oct | 7.40% | 6.60% | ||
| 00:30 | AUD | Private Sector Credit M/M Oct | 0.60% | 0.60% | 0.70% | |
| 00:30 | AUD | Building Permits M/M Oct | -6.00% | -2.00% | -5.80% | -8.10% |
| 00:30 | AUD | Construction Work Done Q3 | 2.20% | 2.00% | -3.80% | -2.00% |
| 01:00 | CNY | Manufacturing PMI Nov | 48 | 49.2 | 49.2 | |
| 01:00 | CNY | Non-Manufacturing PMI Nov | 46.7 | 48 | 48.7 | |
| 05:00 | JPY | Housing Starts Y/Y Oct | -1.80% | -0.50% | 1.00% | |
| 07:45 | EUR | France Consumer Spending M/M Oct | 0.70% | 1.20% | ||
| 07:45 | EUR | France GDP Q/Q Q3 | 0.20% | 0.20% | ||
| 08:00 | CHF | KOF Leading Indicator Nov | 89.5 | 90.9 | ||
| 08:55 | EUR | Germany Unemployment Change Nov | 10K | 8K | ||
| 08:55 | EUR | Germany Unemployment Rate Nov | 5.50% | 5.50% | ||
| 09:00 | CHF | Credit Suisse Economic Expectations Nov | -53.1 | |||
| 10:00 | EUR | Eurozone CPI Y/Y Nov P | 10.40% | 10.60% | ||
| 10:00 | EUR | Eurozone CPI Core Y/Y Nov P | 4.90% | 5.00% | ||
| 13:15 | USD | ADP Employment Change Nov | 195K | 239K | ||
| 13:30 | USD | GDP Annualized Q3 P | 2.60% | 2.60% | ||
| 13:30 | USD | GDP Price Index Q3 P | 4.10% | 4.10% | ||
| 13:30 | USD | Wholesale Inventories Oct P | 0.50% | 0.60% | ||
| 13:30 | USD | Goods Trade Balance (USD) Oct P | -90.2B | -92.2B | ||
| 14:45 | USD | Chicago PMI Nov | 45.4 | 45.2 | ||
| 15:00 | USD | Pending Home Sales M/M Oct | -5.80% | -10.20% | ||
| 15:30 | USD | Crude Oil Inventories | -3.2M | -3.7M |
Technical Outlook and Review
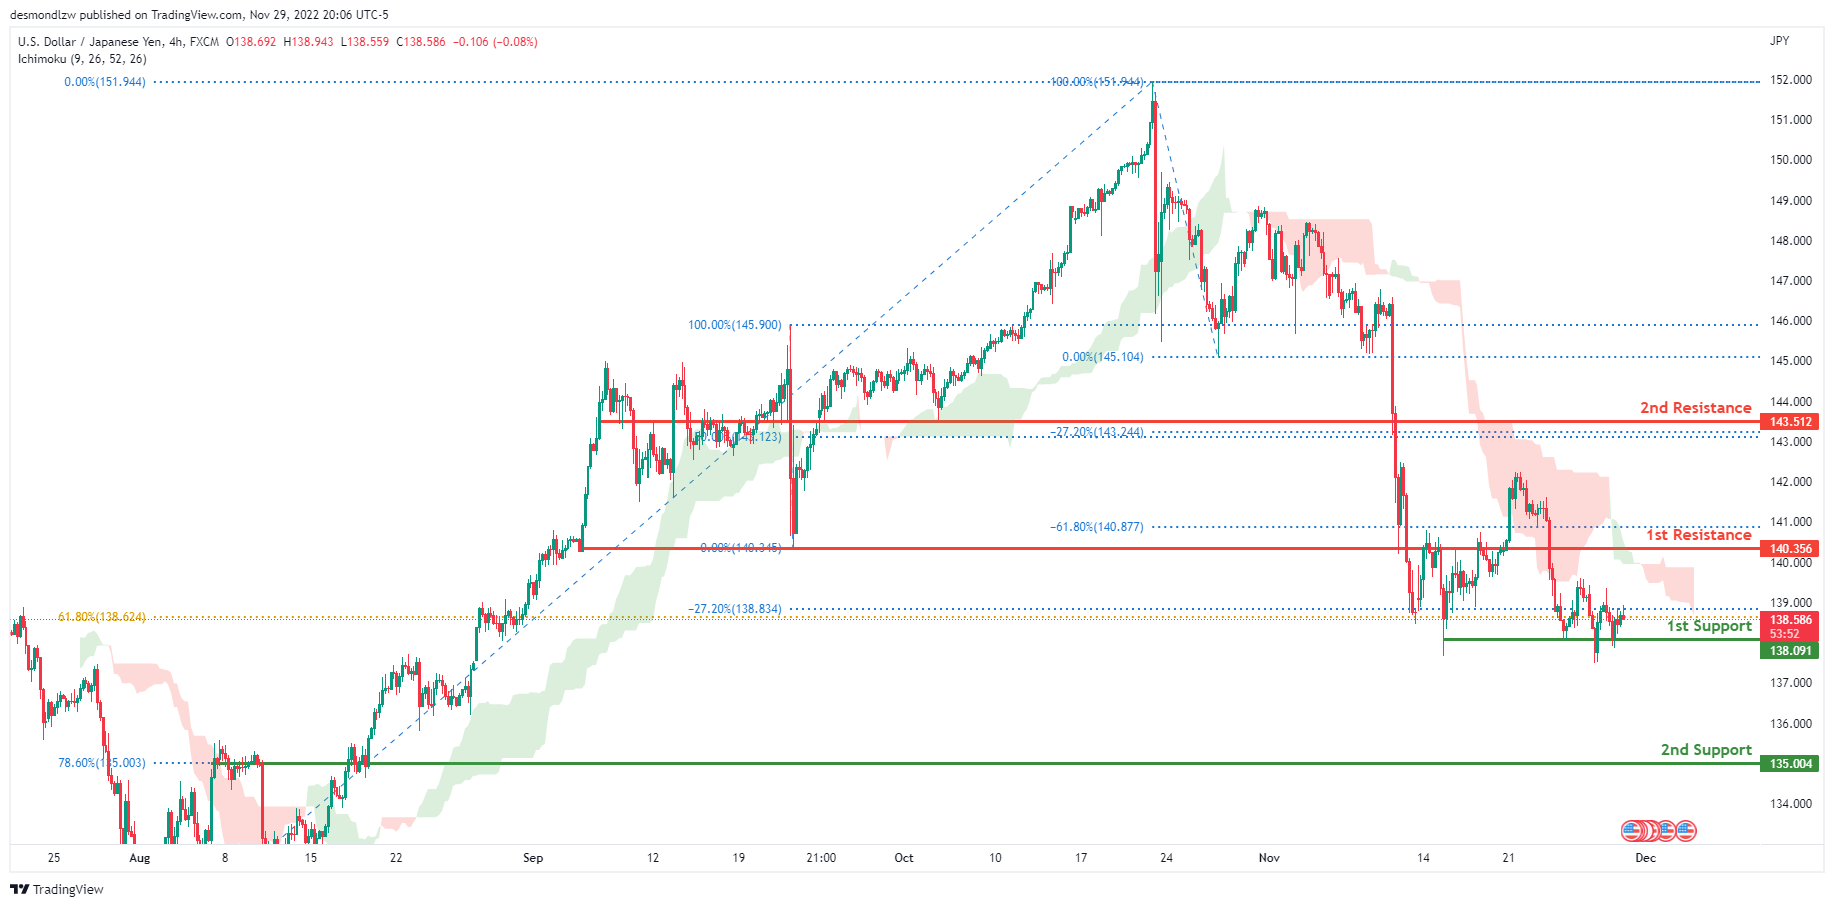
USD/JPY:
The current general bias for USDJPY on the H4 chart is bearish. To add confluence to this, the price is under the Ichimoku cloud which indicates a bearish market. If the bearish momentum continues, expect USDJPY to head towards the 1st support line at 138.091, where the –27.2% Fibonacci expansion line is located. In an alternative scenario, price could go up to retest the 1st resistance line at 140.356, where the -61.8% Fibonacci expansion line and previous low are located.
Areas of consideration:
- H4 time frame, 1st resistance at 140.356
- H4 time frame, 1st support at 138.091
DXY:
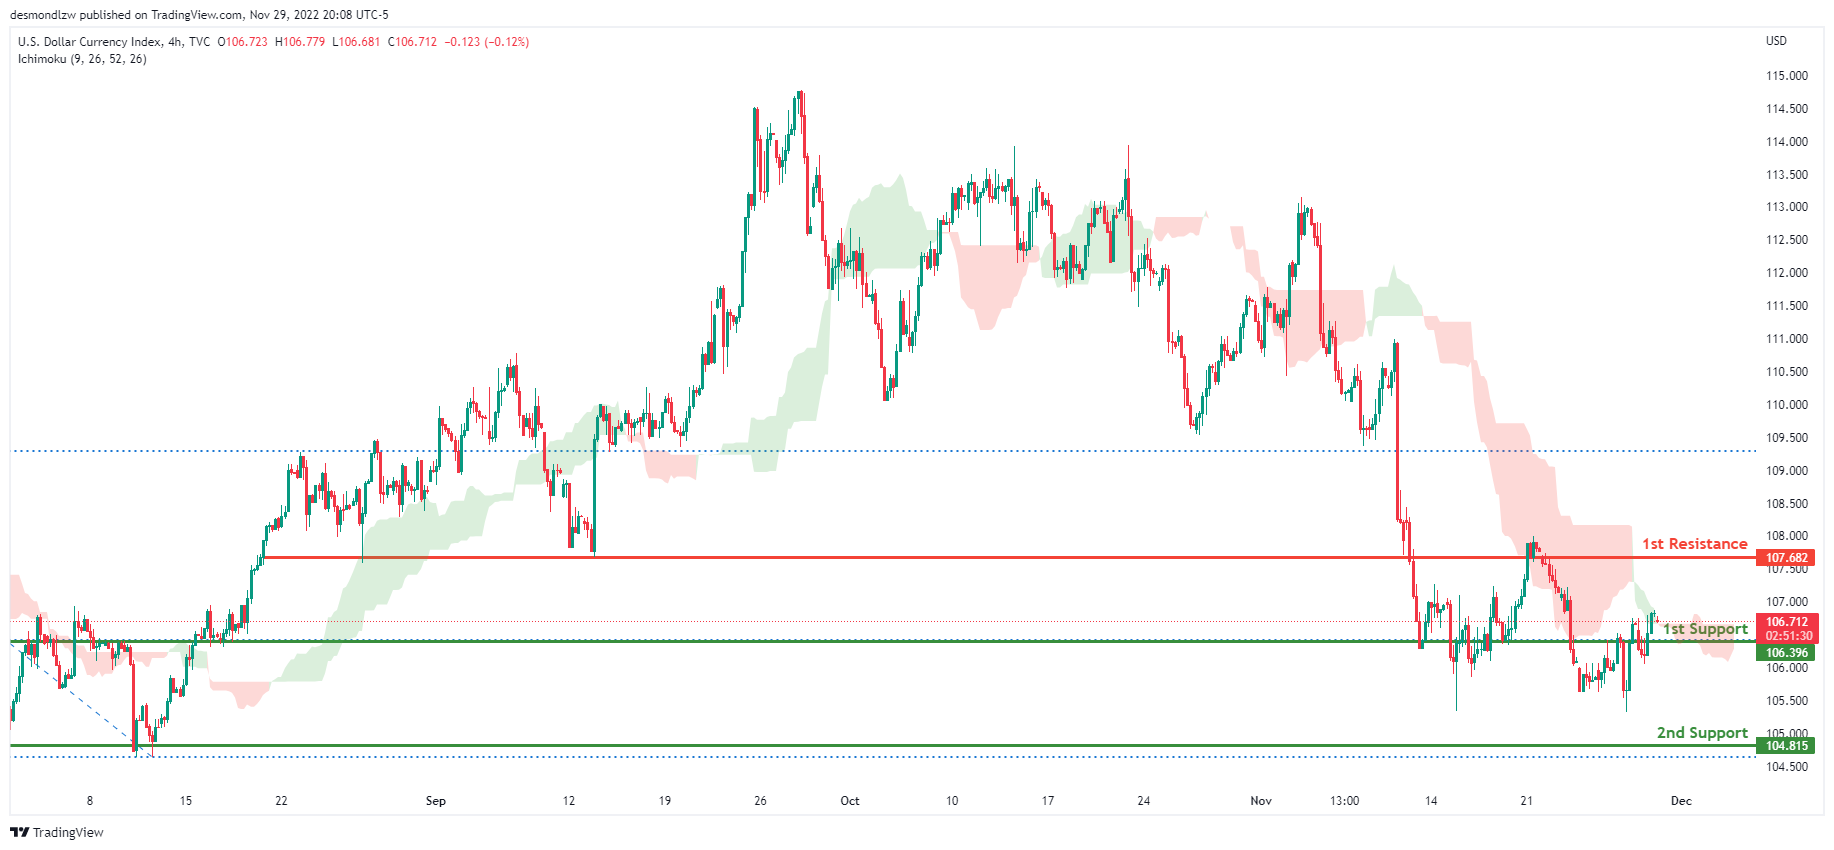
On the H4 chart, the overall bias for DXY is bearish. To add confluence to this, the price is crossing below the Ichimoku cloud which indicates a bearish market. If this bearish momentum continues, expect the price to break the 1st support line at 106.396 where the 38.2% Fibonacci line is located, before heading towards the 2nd support at 104.815, where the previous swing low is. In an alternative scenario, price could head back up and retest the 1st resistance line resistance at 107.682, where the previous swing low lies.
Areas of consideration:
- H4 time frame, 1st resistance at 107.682
- H4 time frame, 1st support at 106.396
- H4 time frame, 2nd support at 104.815
EUR/USD:
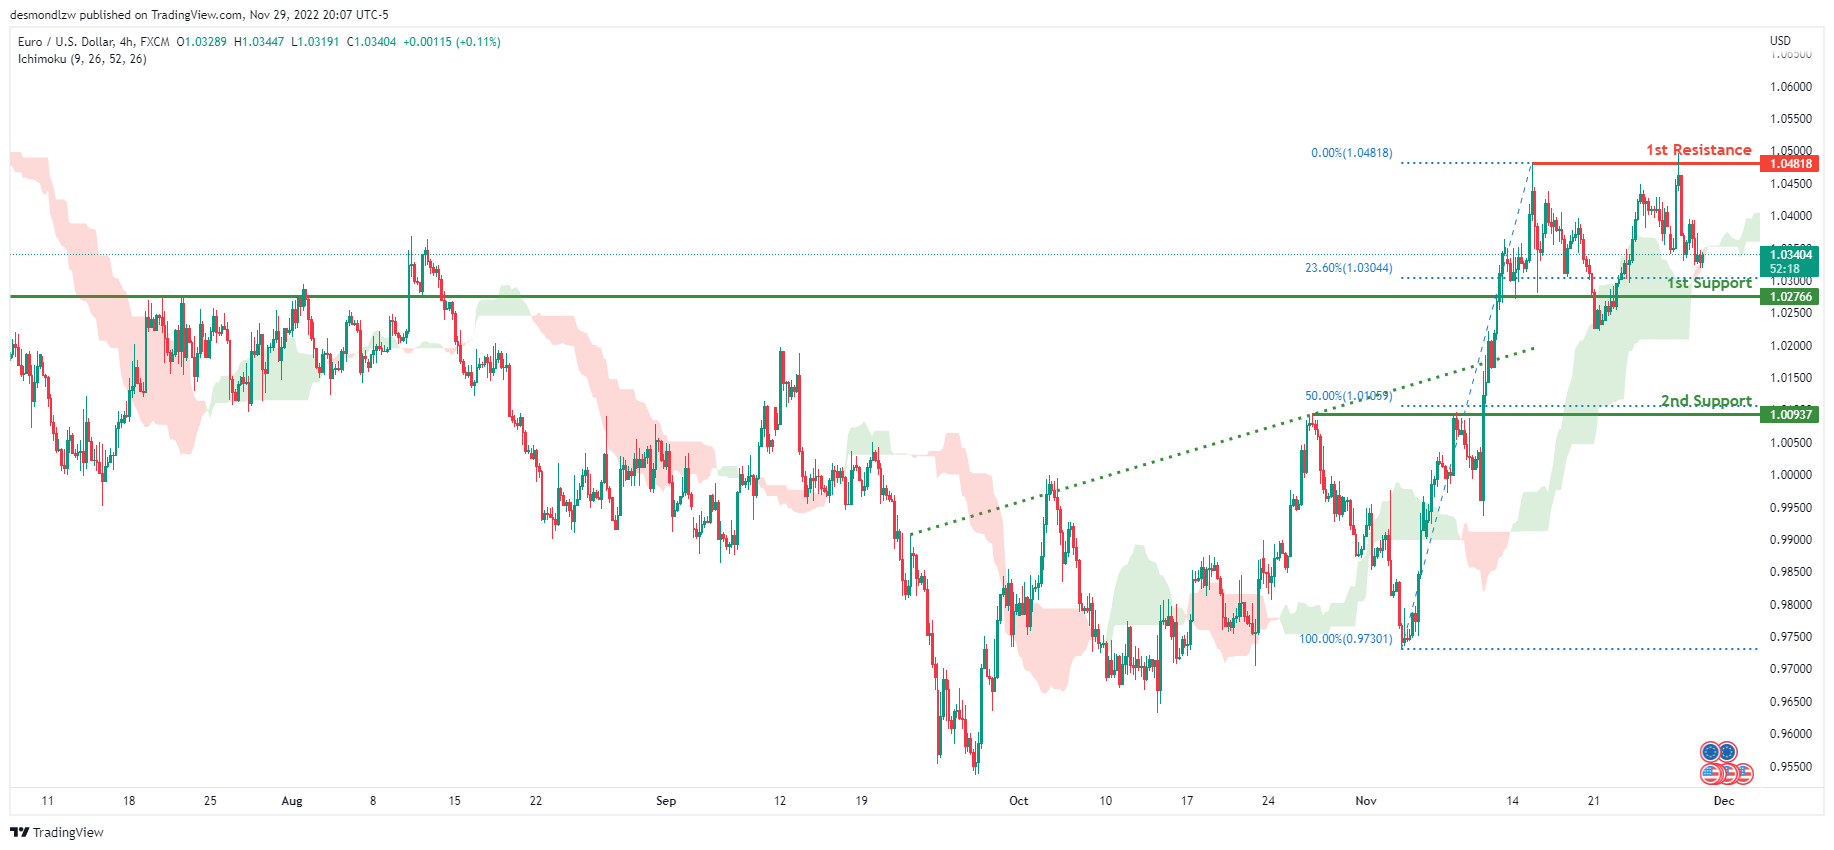
Looking at the H4 chart, my overall bias for EURUSD is bullish due to the current price being above the Ichimoku cloud, indicating a bullish market. To add confluence to this bias, price has also broken above the ascending trend line. If this bullish momentum continues, expect the price to possibly head towards the 1st resistance at 1.04818, where the previous swing high is located. In an alternate scenario, price could possibly head back down towards the 1st support level at 1.02766, where the 23.6% Fibonacci line is located, before heading towards the 2nd support at 1.00937, where the 50% Fibonacci line is.
Areas of consideration :
- H4 1st resistance at 1.04818
- H4 1st support at 1.02766
- H4 2nd support at 1.00937
GBP/USD:
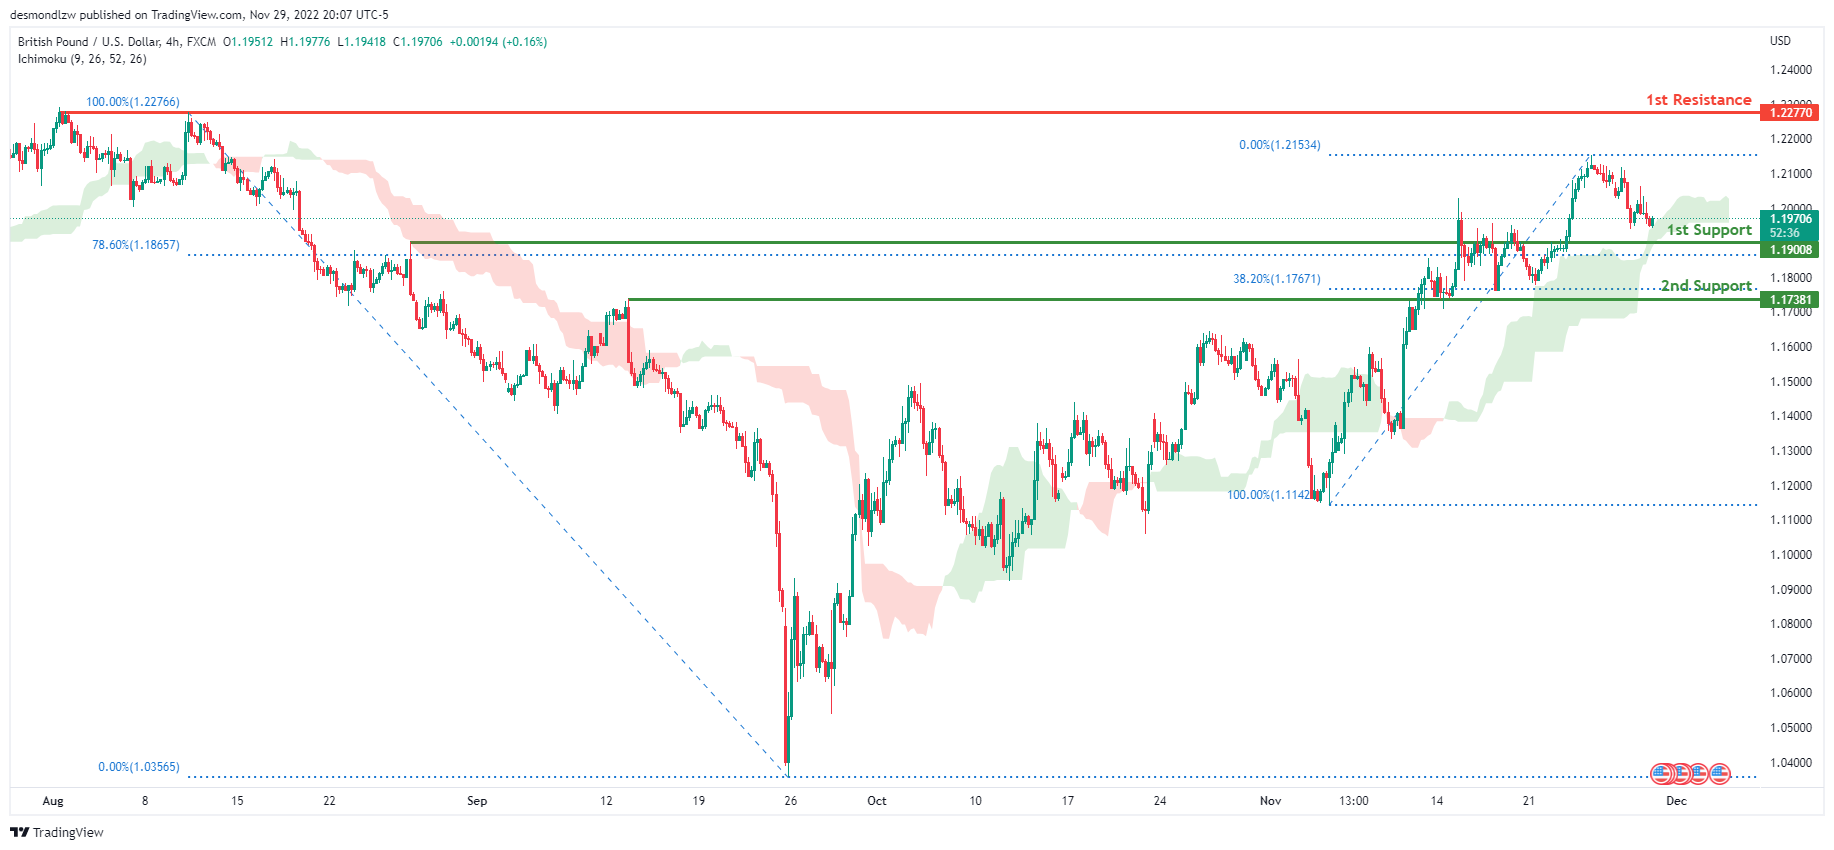
Looking at the H4 chart, my overall bias for GBPUSD is bullish due to the current price being above the Ichimoku cloud, indicating a bullish market. Expecting price to possibly head towards the 1st resistance line at 1.22770, where the previous swing high is. In an alternative scenario, price could possibly head back down to retest the 1st support line at 1.19008, where the 78.6% Fibonacci line is.
Areas of consideration:
- H4 1st resistance at 1.22770
- H4 1st support at 1.19008
USD/CHF:
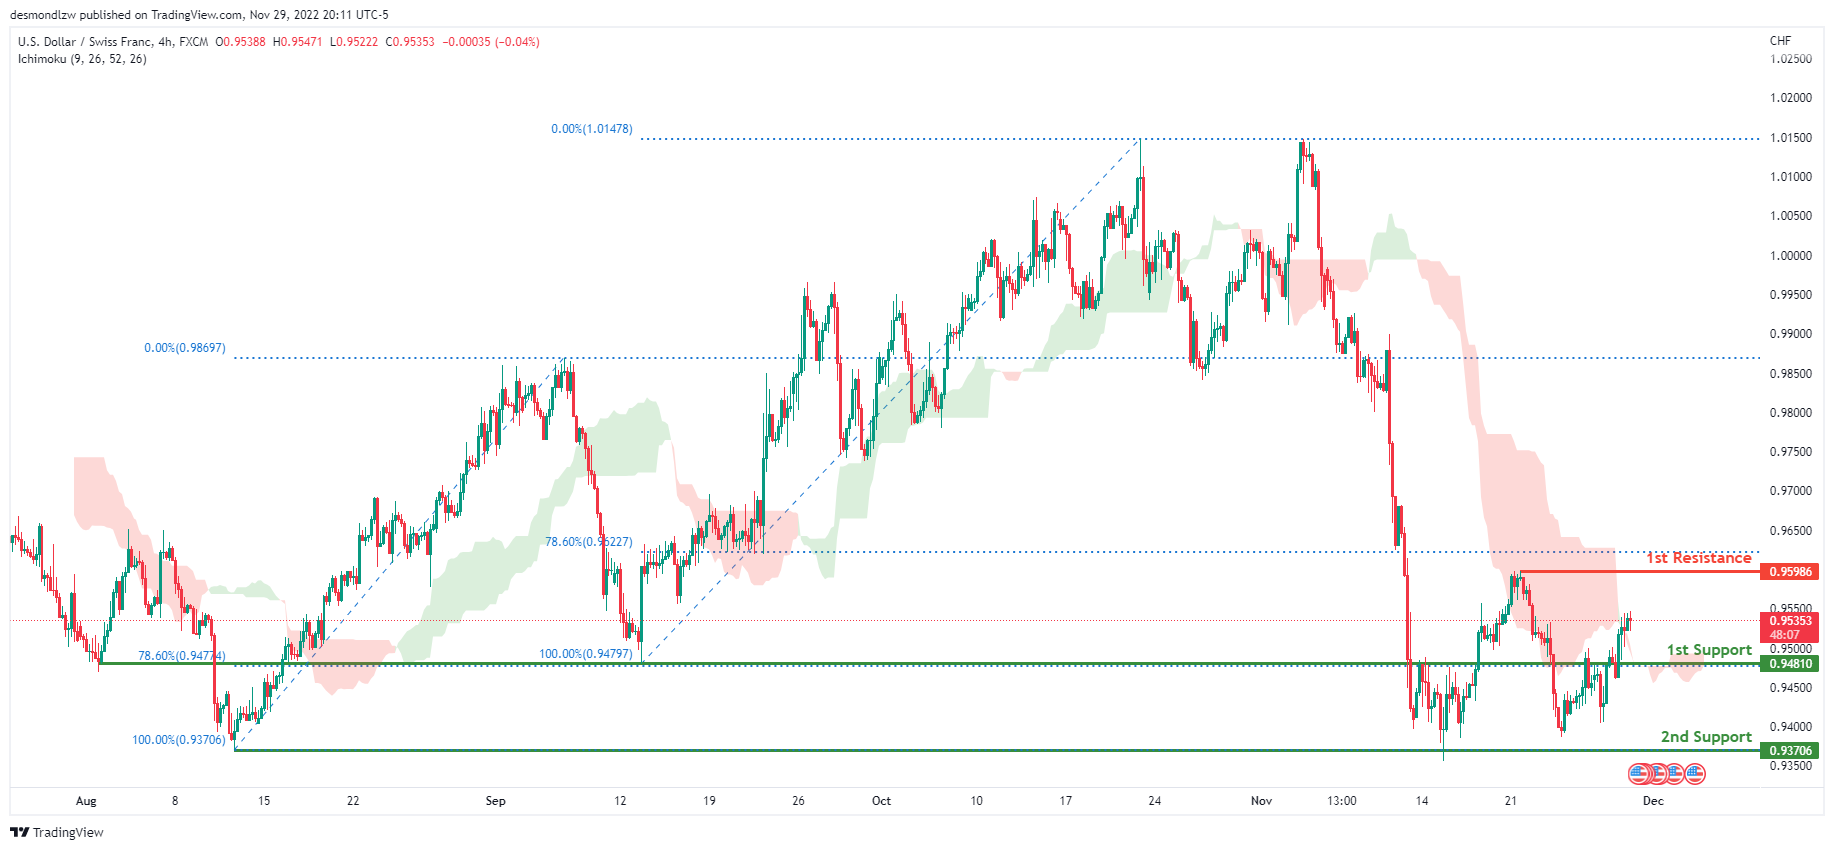
The overall bias for USDCHF on the H4 chart is bearish. In addition, the price is crossing below the Ichimoku cloud, indicating a bearish market. If the current bearish trend continues, expect price to continue heading towards the 1st support line at 0.94810 where the 78.6% Fibonacci line is. IN an alternative scenario, price could possibly head back up towards the 1st resistance line at 0.95986, where the previous swing high is.
Areas of consideration
- H4 1st support at 0.94810
- H4 1st resistance at 0.95986
XAU/USD (GOLD):
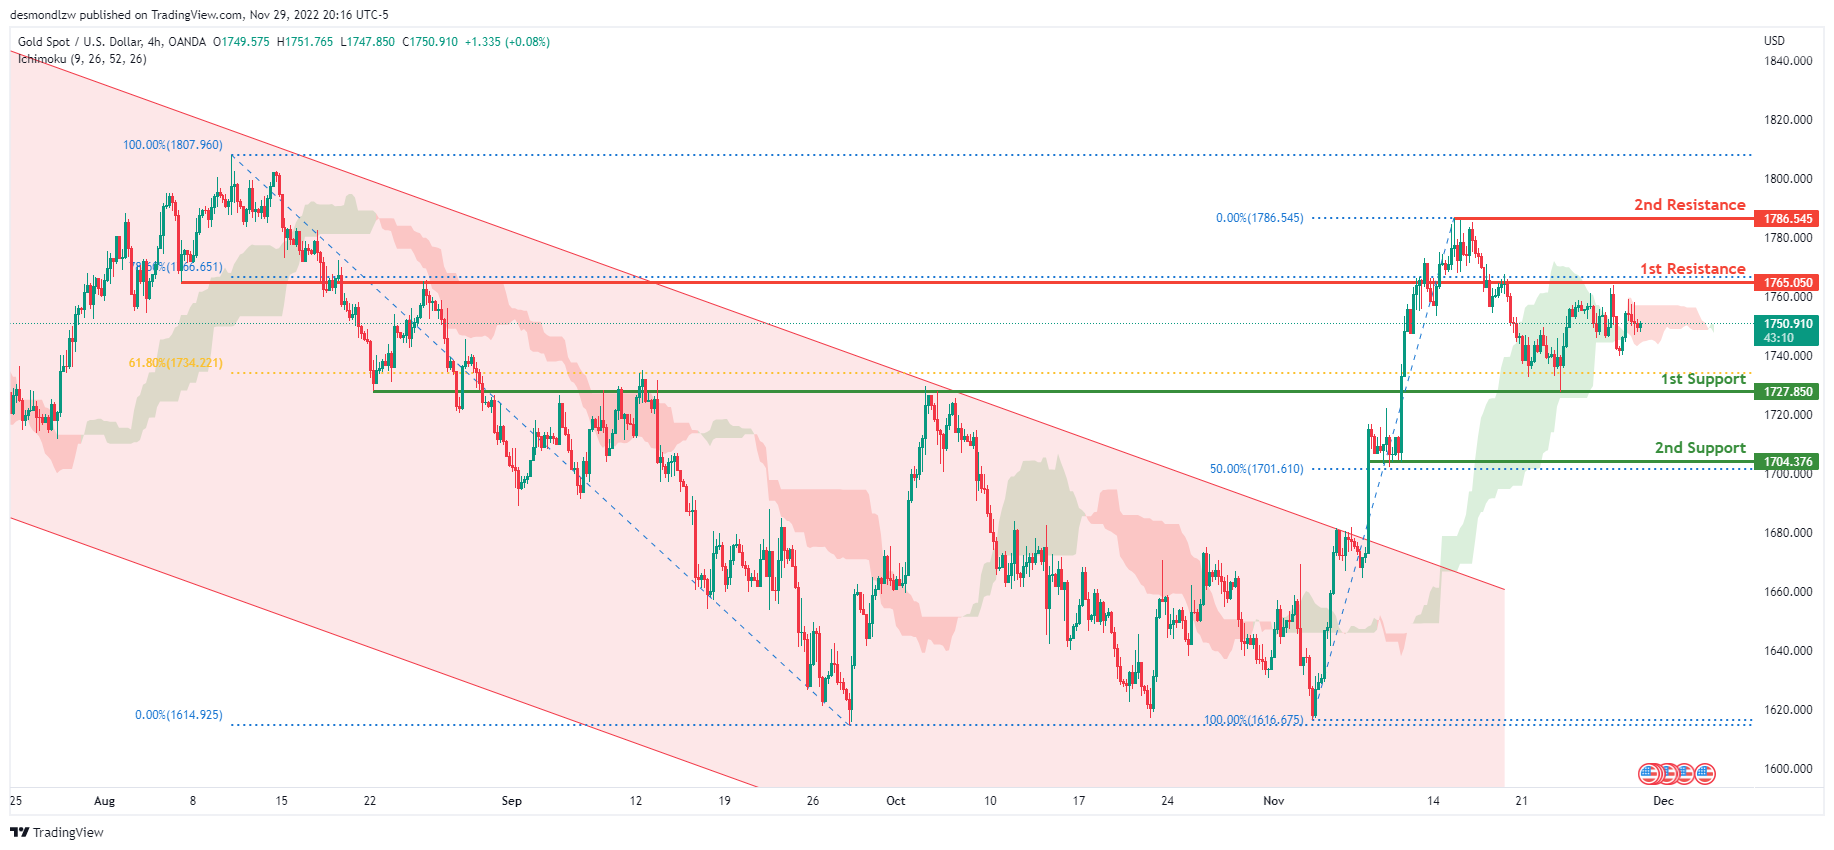
Looking at the H4 chart, my overall bias for XAUUSD is bullish due to the current price crossing above the Ichimoku cloud, indicating a bullish market. If this bullish momentum continues, expect the price to possibly head back up towards the 1st resistance at 1765.050, where the 78.6% Fibonacci line is located. In an alternate scenario, price could possibly head back down towards the 1st support level at 1727.850, where the 38.2% and 61.8% Fibonacci lines are located.
Areas of consideration:
- H4 time frame, 1st resistance at 1765.483
- H4 time frame, 1st support at 1727.850
AUD/USD:
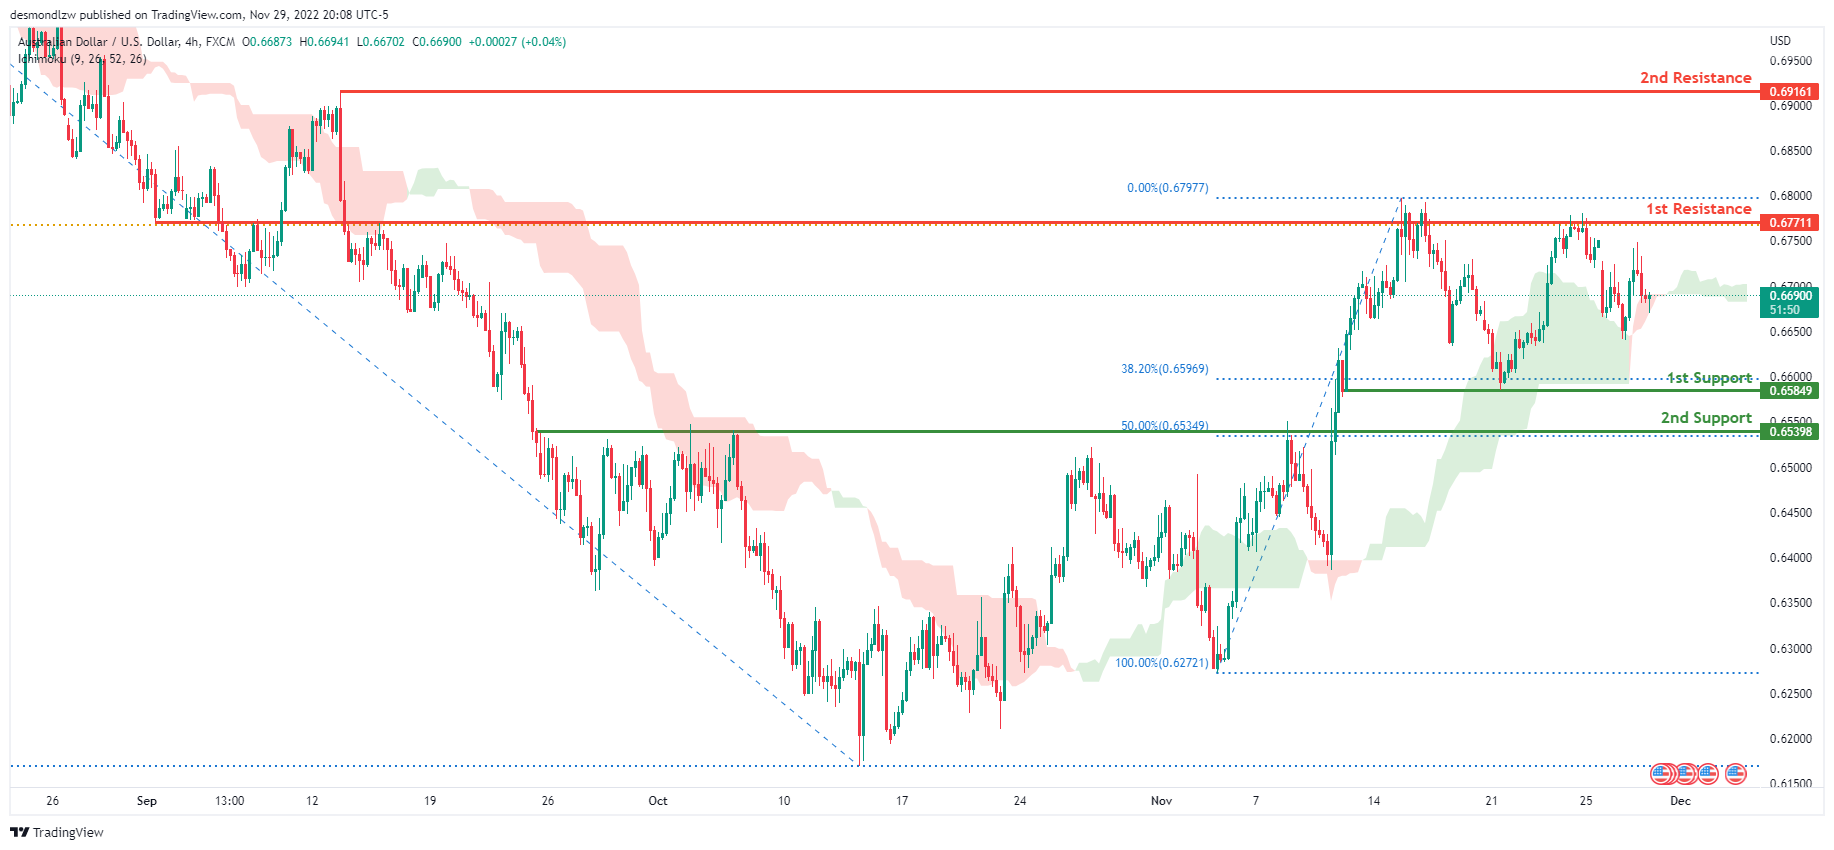
Looking at the H4 chart, my overall bias for ADUSD is bullish due to the current price being above the Ichimoku cloud, indicating a bullish market. Expecting price to continue heading towards the 1st resistance at 0.67711 where the 61.8% Fibonacci line is. If this 1st resistance line is broken, expect the price to head towards the 2nd resistance at 0.69161, where the previous swing high is. In an alternative scenario, price could possibly head back down to retest the 1st support line at 0.65849 where the 38.2% Fibonacci line is.
Areas of consideration
- H4, 1st resistance at 0.67711
- H4, 2nd resistance at 0.69161
- H4, 1st support at 0.65849
NZD/USD:
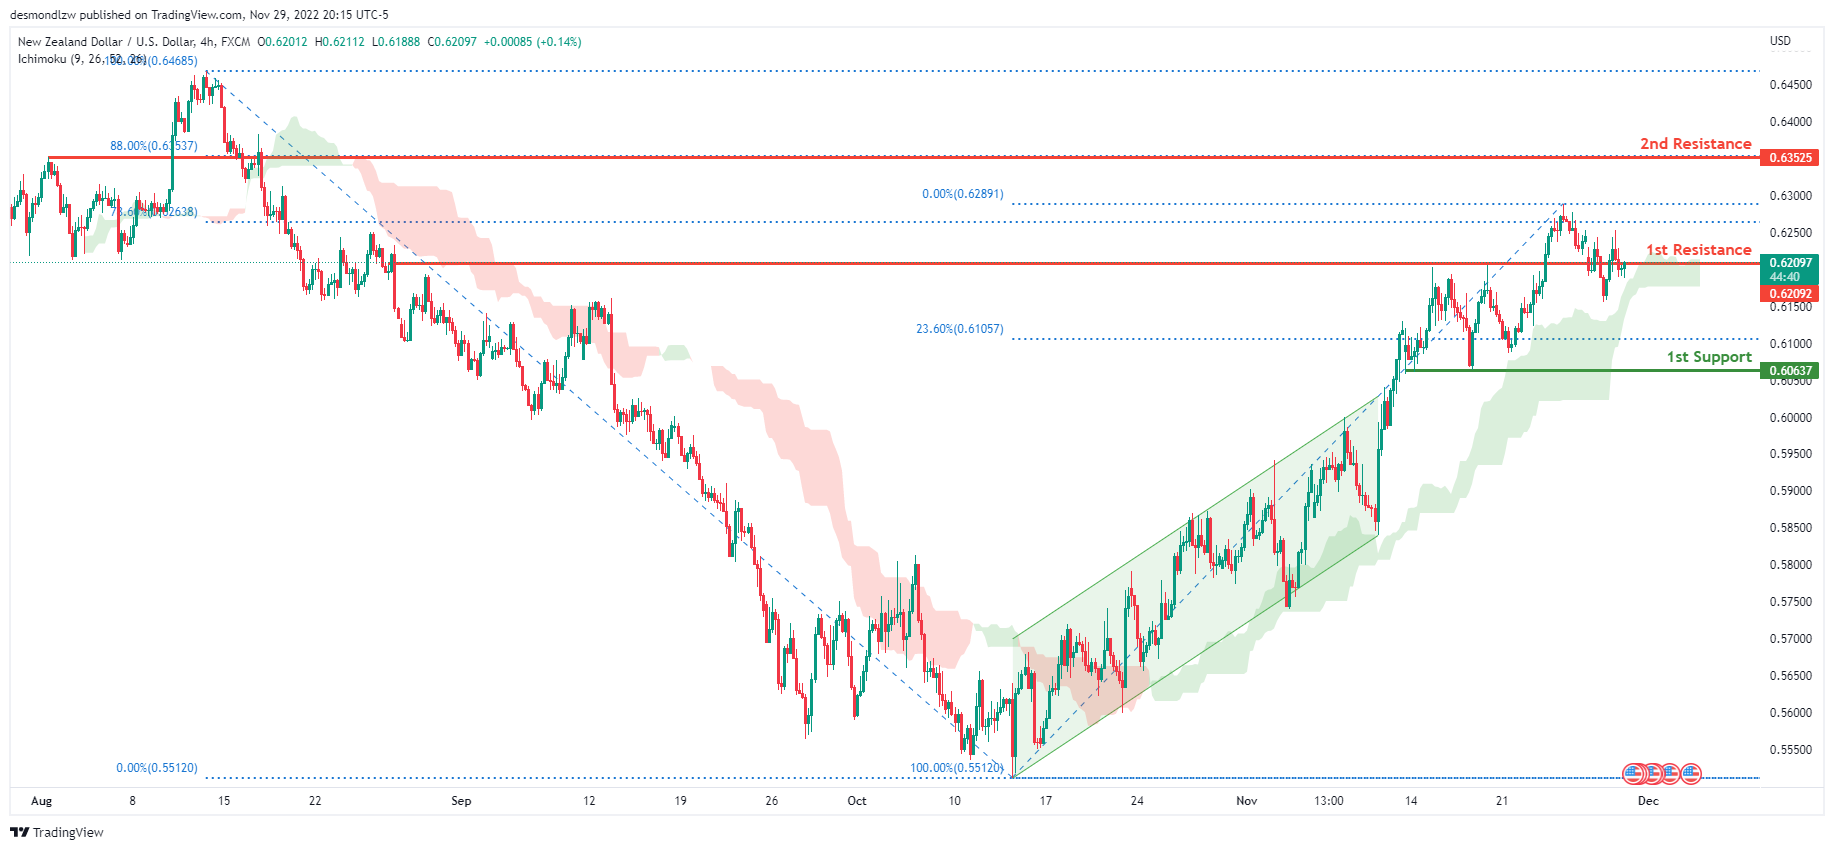
On the H4 chart, we have a bullish bias with the price moving above the Ichimoku cloud and has broken out of the ascending channel. If this bullish momentum continues, expect the price to break the 1st resistance line at 0.62092, slightly below where the 78.6% Fibonacci line is before heading towards the 2nd resistance at 0.63525 where the 88% Fibonacci line is. Alternatively, the price may head back down and retest the 1st support at 0.60637, where the previous swing low is.
Areas of consideration:
- H4 time frame, 1st resistance at 0.62092
- H4 time frame, 2nd resistance at 0.63525
- H4 time frame, 1st support at 0.60637
USD/CAD:
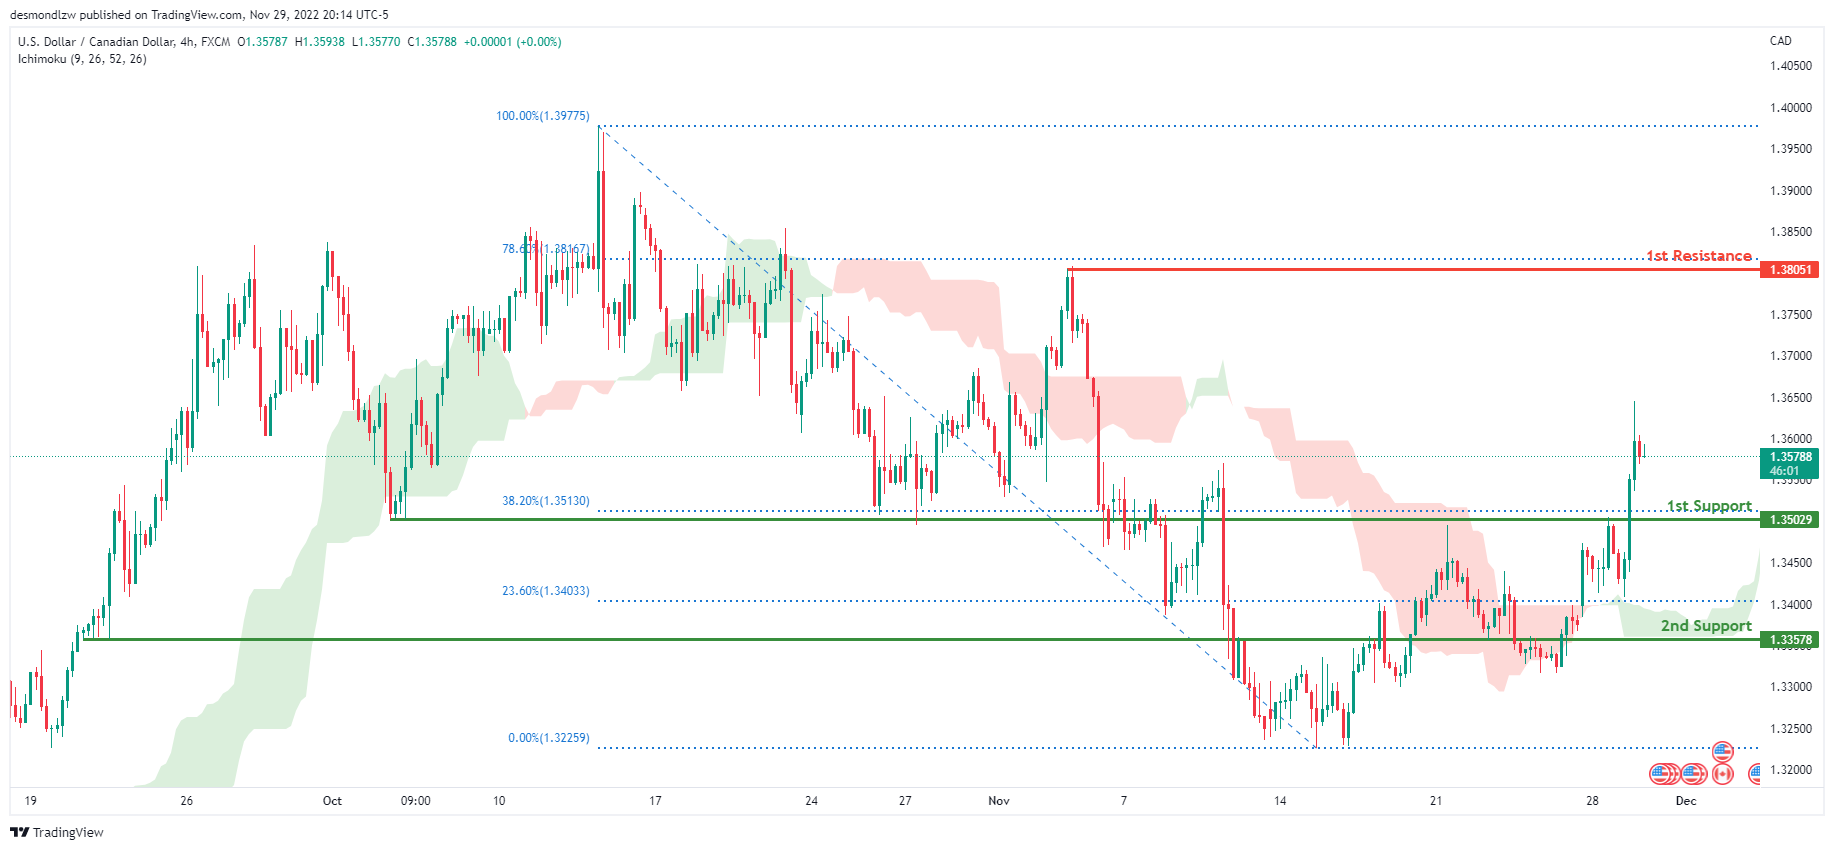
On the H4 chart, the overall bias for USDCAD is bullish. To add confluence to this, the price is above the Ichimoku cloud which indicates a bullish market. If this bullish momentum continues, expect the price to continue heading towards the 1st resistance at 1.38051, where the 78.6% Fibonacci line is. In an alternative scenario, price could head back down to retest the 1st support at 1.35029, where the 38.2% Fibonacci line is.
Areas of consideration:
- H4 time frame, 1st resistance at 1.38051
- H4 time frame, 1st support at 1.35029
OIL:
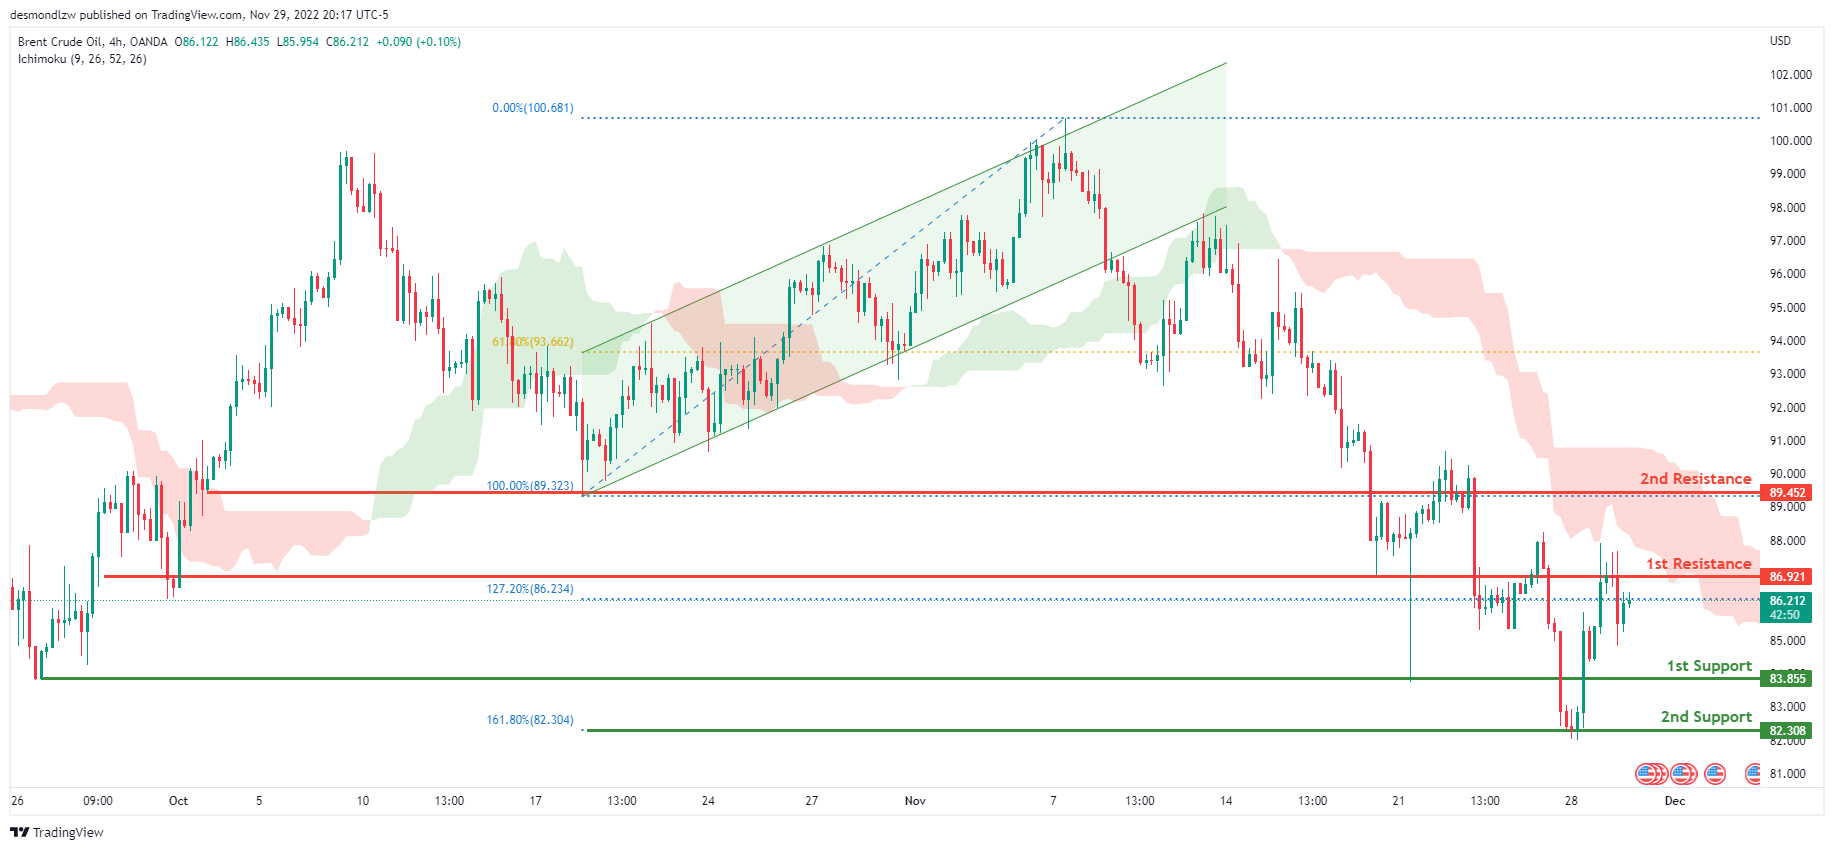
Looking at the H4 chart, my overall bias for BCOUSD is bearish due to the current price being below the Ichimoku cloud, indicating a bearish market. If this bearish momentum continues, expect price to possibly break the 1st support at 83.855, where the previous swing low is located, before heading towards the 2nd support at 82.308, where the 161.8% Fibonacci extension line is. In an alternate scenario, price could possibly head back up to retest the 1st resistance level at 86.921, where the 127.2% Fibonacci extension line is located. If this 1st resistance line is broken, expect the price to head towards the 2nd resistance line at 89.452, where the previous swing low is.
Areas of consideration:
- H4 time frame, 1st resistance at 86.921
- H4 time frame, 2nd resistance at 89.452
- H4 time frame, 1st support at 83.855
- H4 time frame, 2nd support at 82.308
Dow Jones Industrial Average:
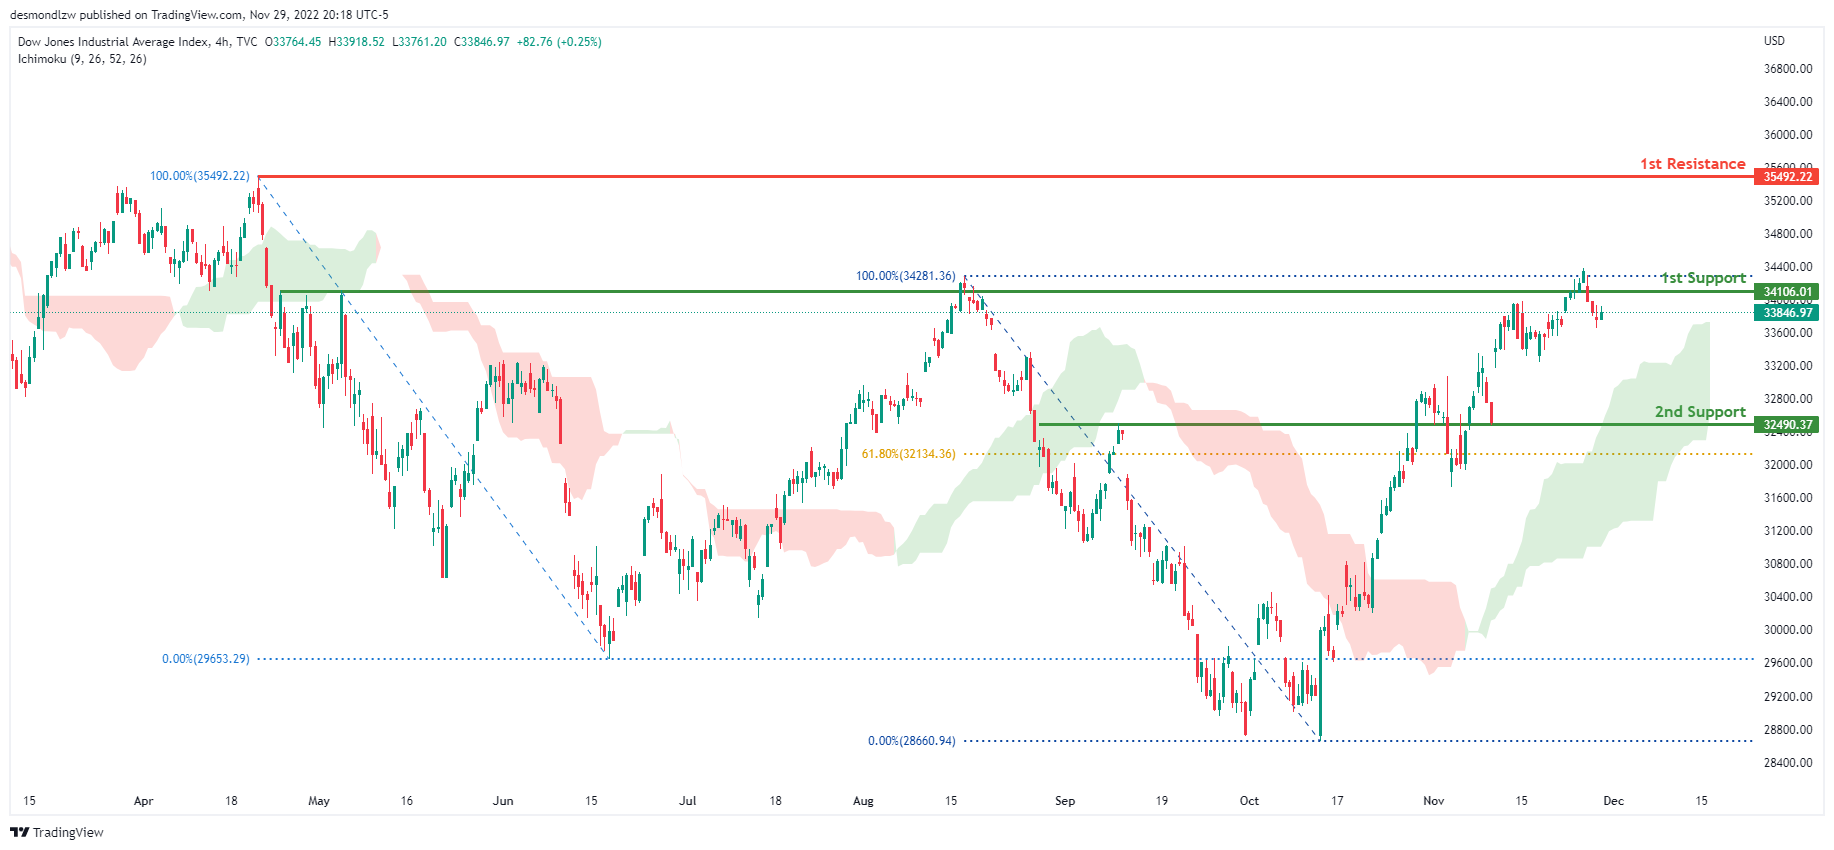
On the H4 chart, the overall bias for DJI is bullish. To add confluence to this, the price is above the Ichimoku cloud which indicates a bullish market. If this bullish momentum continues, expect the price to continue heading towards the 1st resistance line at 35492.22, where the previous swing high is. In an alternative scenario, price could head back down breaking the 1st support line at 34106.01, where the previous swing high is before heading towards the 2nd support at 32490.37, where the 61.8% Fibonacci line is.
Areas of consideration:
- H4 time frame, 1st support at 34106.01
- H4 time frame, 2nd support at 32490.37
- H4 time frame, 1st Resistance at 35492.22
DAX:
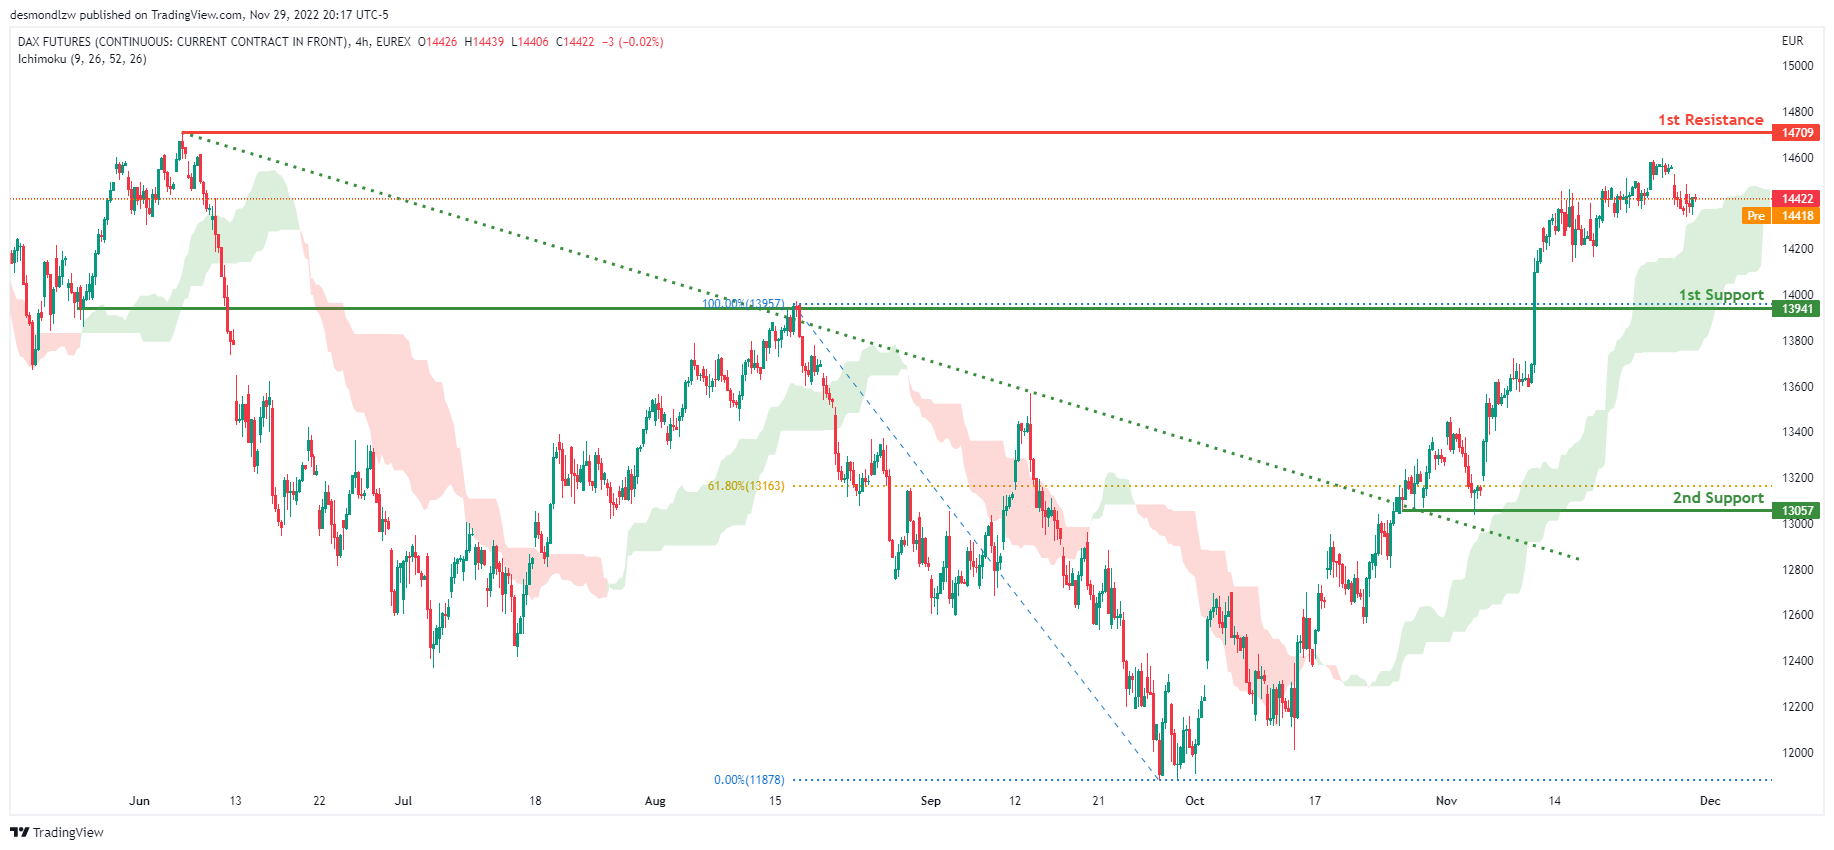
The H4 chart shows a bullish bias, with price breaking through the descending trendline and rising above the Ichimoku cloud. Price is expected to maintain its bullish momentum and rise to the first resistance level at 14709, where the previous swing high is located. Alternatively, the price could fall to the first support level at 13941, where the previous swing high was.
Areas of consideration:
- H4 time frame, 1st resistance is at 14709
- H4 time frame, 1st support is at 13941
ETHUSD:
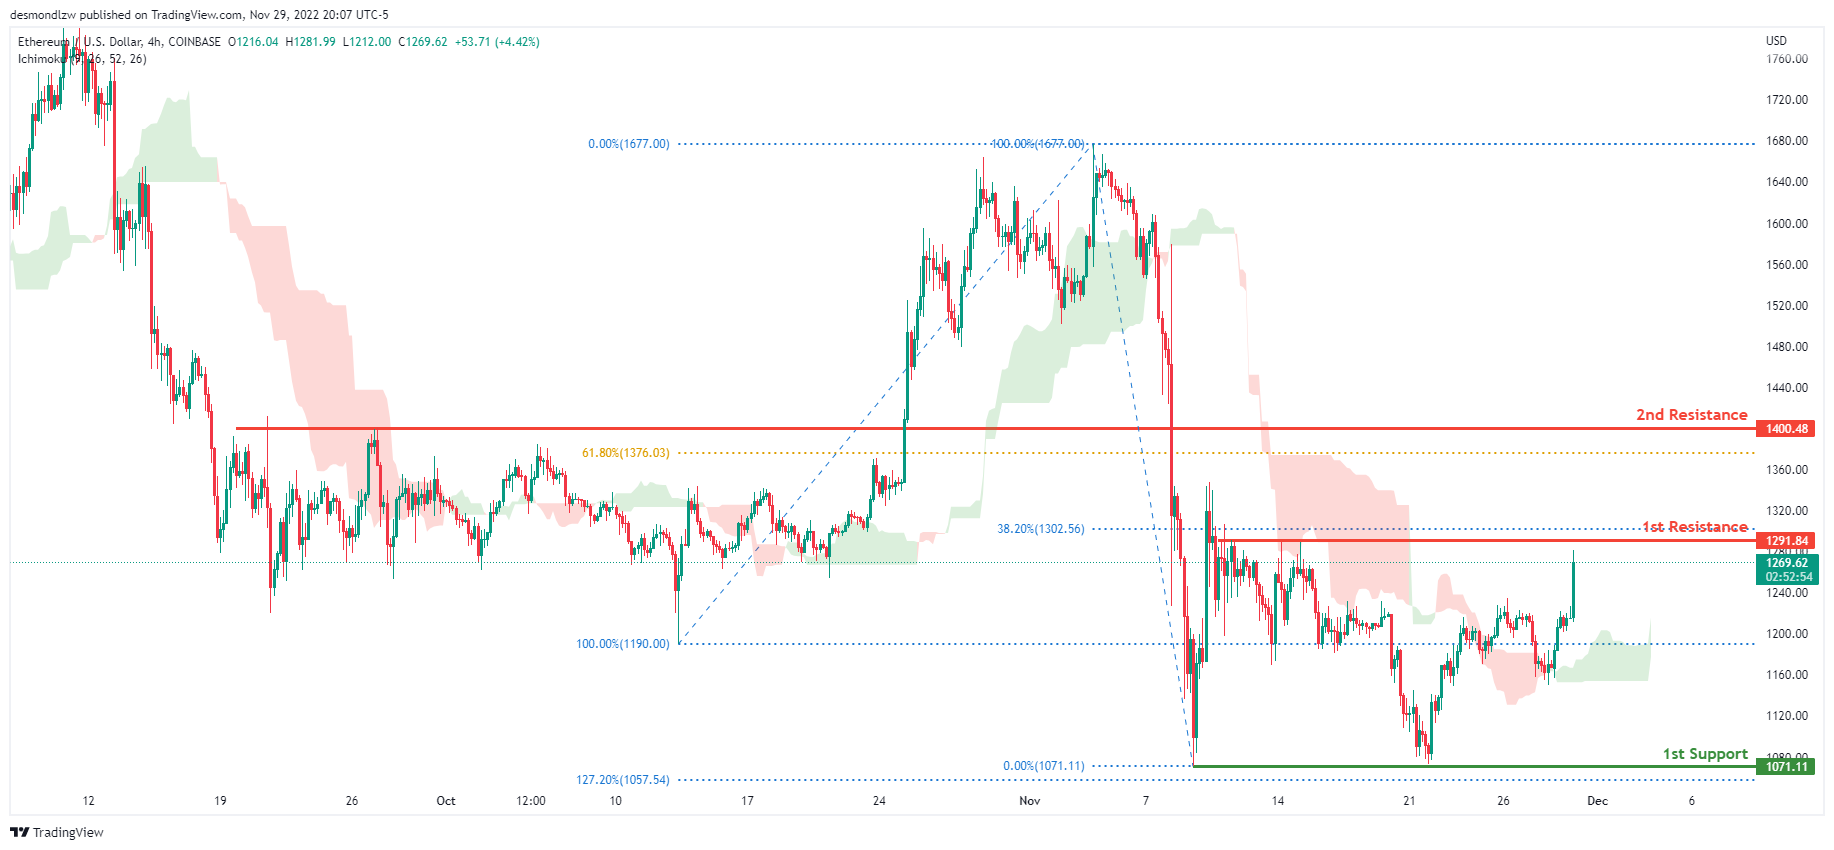
Looking at the H4 chart, my overall bias for ETHUSD is bearish due to the current price being below the Ichimoku cloud, indicating a bearish market .If this bearish momentum continues, expect price to possibly head towards the 1st support at 1071.11, where the -previous swing low is located. In an alternate scenario, price could possibly head back up towards the 1st resistance level at 1291.84, where the 38.2% Fibonacci line is located.
Areas of consideration:
- H4 time frame, 1st resistance of 1291.84
- H4 time frame, 1st support at 1071.11
BTCUSD:
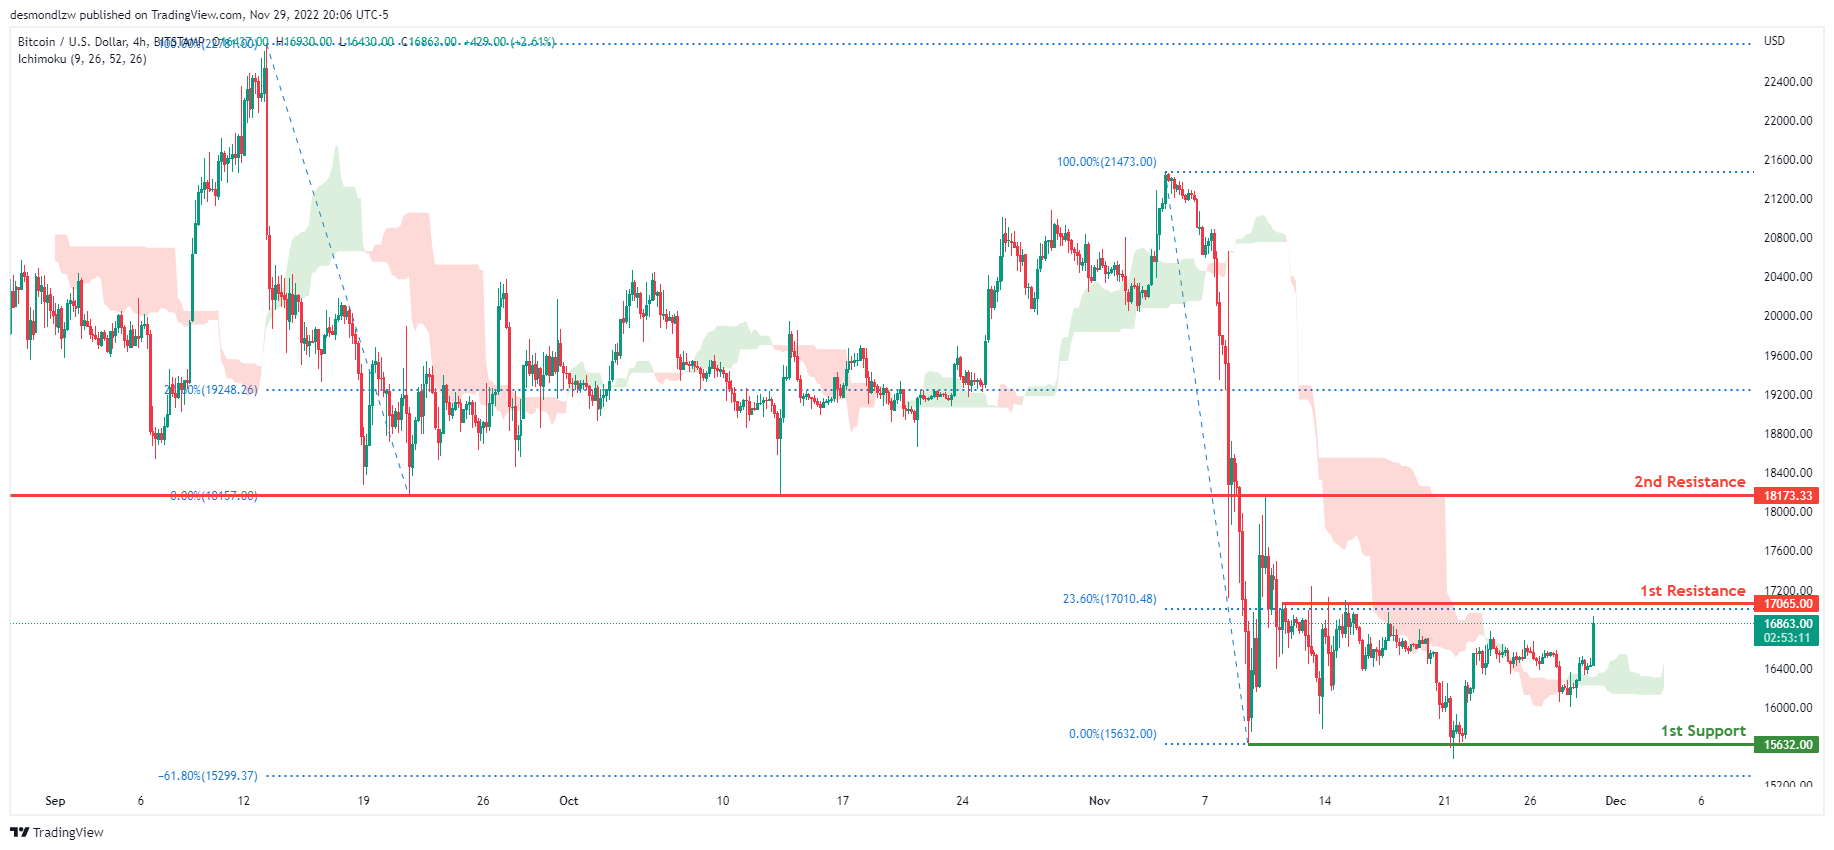
On the H4 chart, the overall bias for BTCUSD is bearish. To add confluence to this, the price is below the Ichimoku cloud which indicates a bearish market. If this bearish momentum continues, expect the price to head towards the 1st support line at 15632.00, where the previous swing low is located. In an alternative scenario, price could head back up to retest the 1st resistance line at 17065.00, where the 23.6% Fibonacci line is located.
Areas of consideration:
- H4 time frame, 1st resistance 17065.00
- H4 time frame, 1st support at 15632.00
S&P 500:
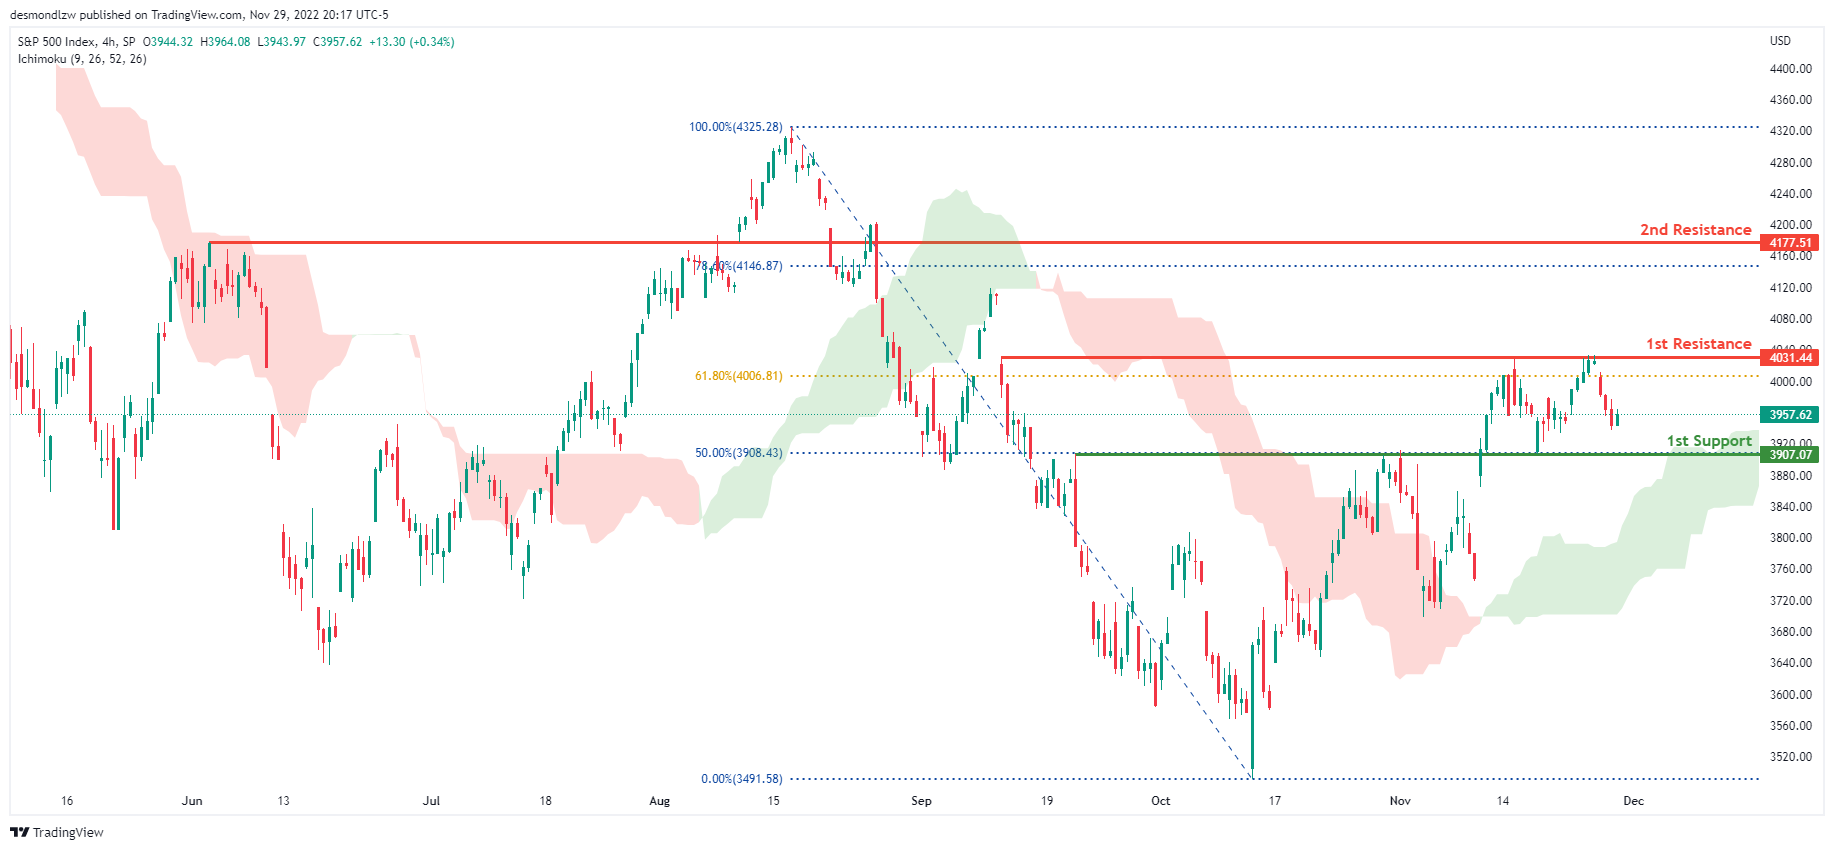
The overall bias for the S&500 on the H4 chart is bullish, with prices above the Ichimoku cloud. If the bullish momentum continues, the price will rise to the first resistance line at 4031.44, where the 61.8% Fibonacci line is located. If the first resistance line is broken, the second resistance line is at 4119.28, which is the previous swing high and the 78.6% Fibonacci line. In an alternate scenario, price could return to the first support line at 3907.07, where the 50% Fibonacci line is located.
Areas of consideration:
- H4 time frame, 1st support at 3907.07
- H4 time frame, 1st resistance at 4031.44
- H4 time frame, 2nd resistance at 4119.28
China PMI manufacturing dropped to 48.0, non-manufacturing down to 46.7
China NBS PMI Manufacturing dropped from 49.2 to 48.0 in November, below expectation of 49.2. PMI Non-Manufacturing dropped from 48.7 to 46.7, below expectation of 48.0. Both readings were the lowest in seven months.
"In November, impacted by multiple factors including the wide and frequent spread of domestic outbreaks, and the international environment becoming more complex and severe, China's purchasing managers' index fell," NBS senior statistician Zhao Qinghe said in a statement.
Zhao said domestic outbreaks in November caused "production activity to slow down and product orders to fall", noting "increased fluctuation in market expectations".
Australia monthly CPI slowed to 6.9% yoy in Oct, food inflation eased
Australia monthly CPI slowed from 7.3% yoy to 6.9% yoy in October. The most significant contributors to the annual rise were new dwellings (+20.4%), automotive fuel (+11.8%) and fruit and vegetables (+9.4%).
"High levels of building construction activity and ongoing shortages of labour and materials contributed to the rise in new dwellings" Michelle Marquardt, ABS Head of Prices Statistics said.
Automotive fuel prices accelerated from 10.1% to 11.8% as the government's temporary cut to the fuel excise ended on September 29. Annually, prices for fruit and vegetables rose by 9.4%, down from 17.4% in September.
NZ ANZ business confidence dropped to -57.1, strain showing for businesses
New Zealand ANZ Business Confidence dropped from -42.7 to -57.1 in November. Looking at some details, own activity outlook dropped from -2.5 to -13.7, just 8 pts shy of 2009 lows. Export intentions dropped from -4.3 to -5.4. Investment intentions dropped from 1.1 to -8.1. Employment intentions dropped from 5.0 to -4.0. Pricing intentions dropped from 64.5 to 58.5. Cost expectations ticked up from 88.6 to 88.7. Inflation expectations rose from 6.13 to 6.39.
ANZ said, "The strain is showing for kiwi businesses. Cost increases remain relentless and margins are squeezed, firms are chronically understaffed, and they're waiting for the hammer to fall as the impact of relentless monetary policy tightening eventually kicks in. There are a lot of dark clouds on the horizon, and this month's survey reflects that."
Japan industrial production dropped -2.6% mom in Oct, but bounce back expected
Japan industrial production dropped -2.6% mom in October, worse than expectation of -1.8% mom.
The seasonally adjusted production index for the manufacturing and mining sectors stood at 95.9 against 100 for the base year of 2015. The shipment index stood at 94.1, down -1.1%, and the inventory index at 103.0, down -0.8%.
The Ministry of Trade, Economy and Industry expects production to rise 3.3% in November and then 2.4% in December.
METI cut its assessment of industrial output for the first time in five months, saying "production is gradually picking up, but some weaknesses are observed."
USD/CAD Restarts Increase, US GDP and ADP Report Next
Key Highlights
- USD/CAD started a fresh increase from the 1.3200 support zone.
- It broke a major bearish trend line with resistance near 1.3375 on the 4-hours chart.
- EUR/USD and GBP/USD corrected gains ahead of the US GDP report release.
- The US GDP could grow 2.6% in Q3 2022 (Preliminary).
USD/CAD Technical Analysis
The US Dollar found support near the 1.3220 level against the Canadian Dollar. USD/CAD remained well bid and started a fresh increase above the 1.3300 resistance.
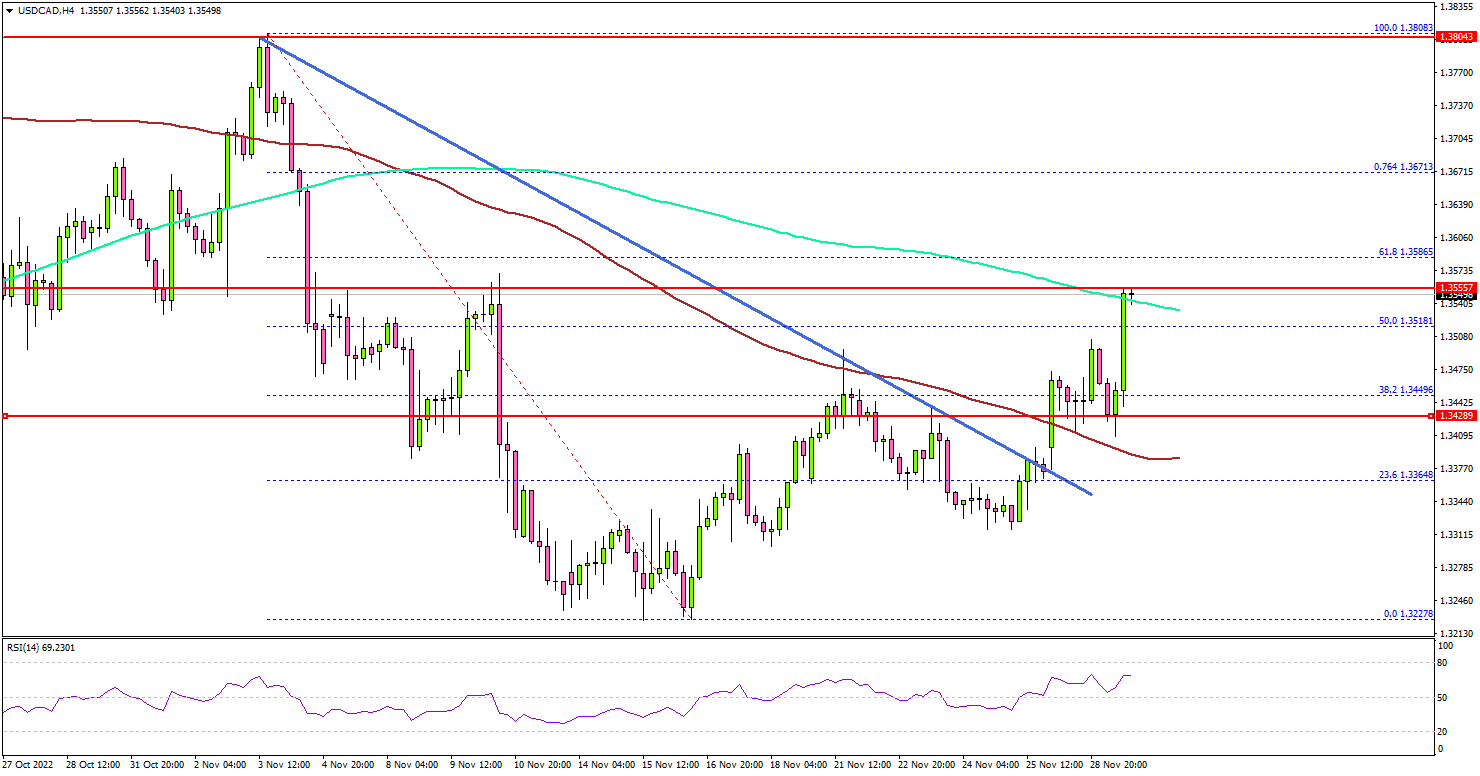
Looking at the 4-hours chart, the pair was able to clear the 1.3350 resistance zone and the 100 simple moving average (red, 4-hours). There was also a break above a major bearish trend line with resistance near 1.3375.
The pair surpassed the 50% Fib retracement level of the downward move from the 1.3808 swing high to 1.3227 low. Finally, there was a minor move above the 1.3520 level and the 200 simple moving average (green, 4-hours).
On the upside, the pair is facing resistance near the 1.3585 level. It is near the 61.8% Fib retracement level of the downward move from the 1.3808 swing high to 1.3227 low.
The next major resistance may perhaps be near 1.3670. Any more gains could set the pace for a move towards the 1.3800 resistance zone.
An initial support is near the 1.3480 level. The next major support is near the 1.3400 zone and the 100 simple moving average (red, 4-hours). Any more losses might send the pair towards the 1.3250 support zone.
Looking at EUR/USD, the pair struggled to gain pace above the 1.0480 resistance and started a short-term downside correction.
Economic Releases
- Euro Zone CPI for Nov 2022 (YoY, Preliminary) - Forecast +10.4%, versus +10.6% previous.
- Euro Zone CPI for Nov 2022 (MoM, Preliminary) - Forecast +1.5%, versus +1.5% previous.
- US ADP Employment Change April 2022 - Forecast 200K, versus 239K previous.
- US Gross Domestic Product for Q3 2022 (Preliminary) – Forecast 2.6% versus previous 2.6%.
Elliott Wave View: Larger Degree Rally in GBPAUD
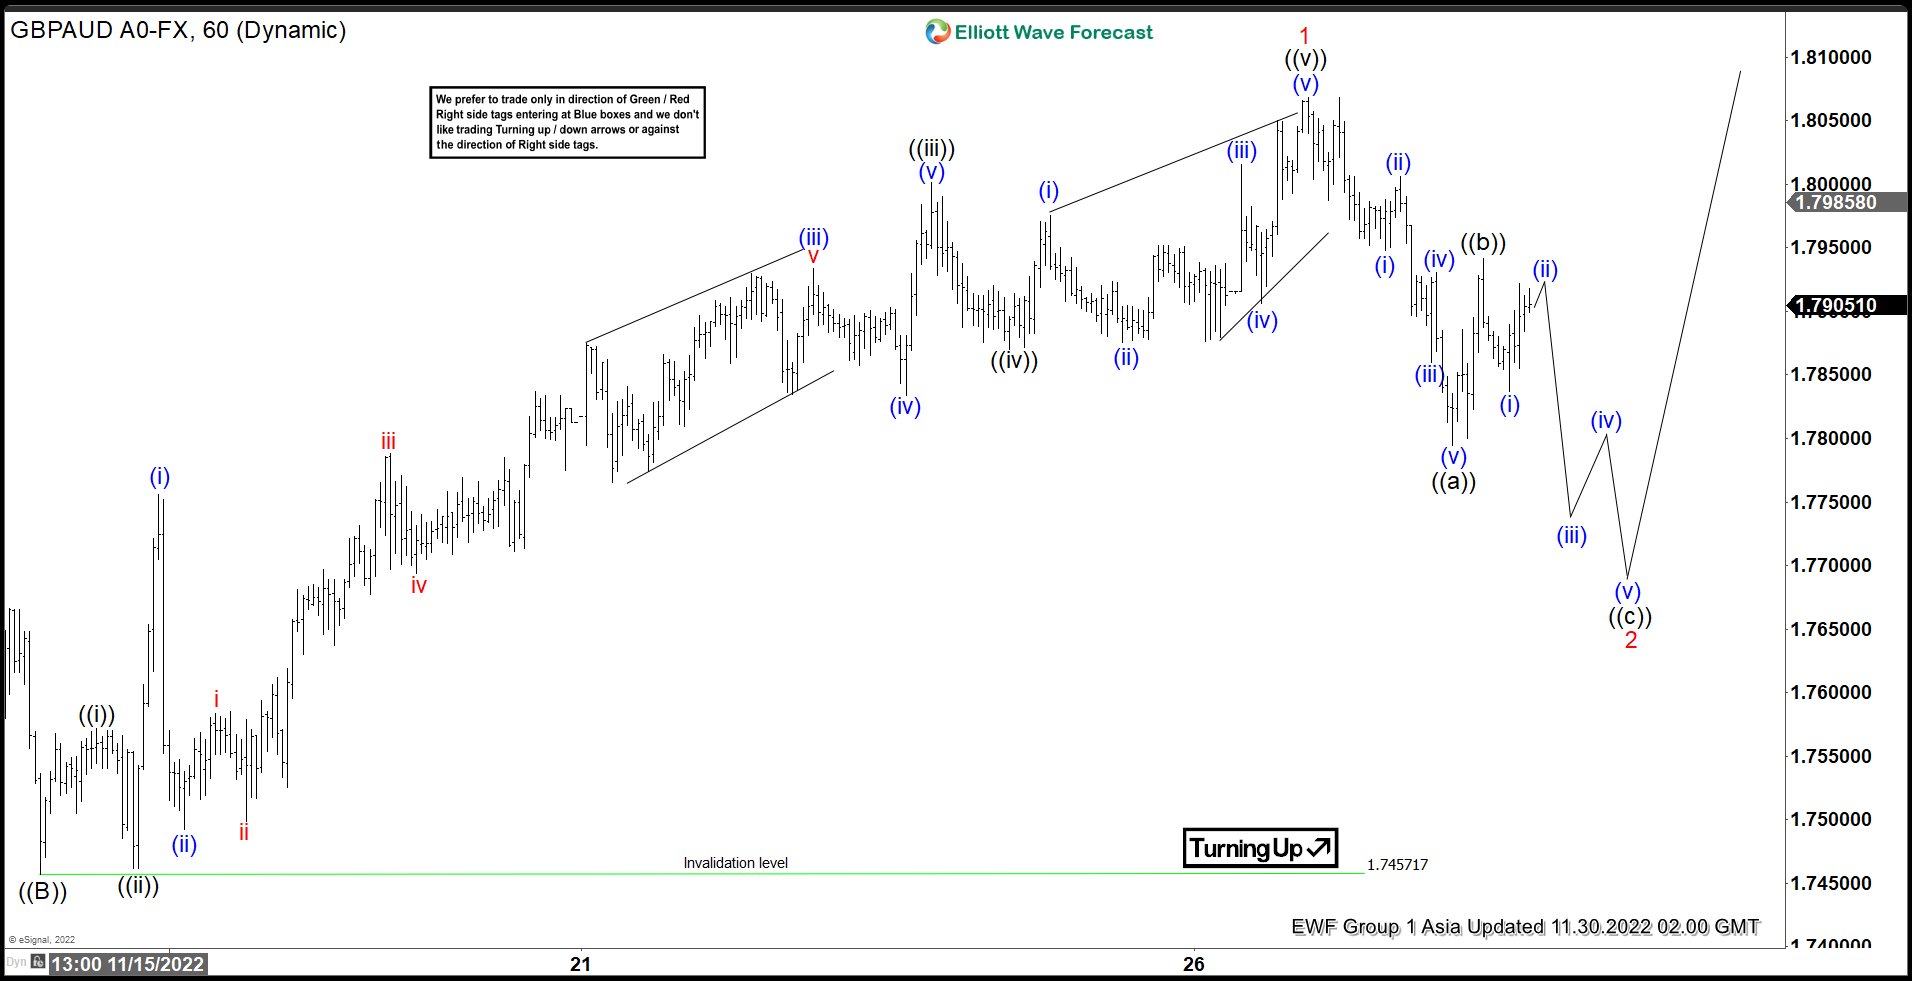
Short term Elliott Wave View in GBPAUD suggests the rally from 9.26.2022 low is unfolding as a zigzag Elliott Wave structure. Up from 9.26.2022 low, wave ((A)) ended at 1.8199 and pullback in wave ((B)) ended at 1.7456. Pair resumes higher again in wave ((C)) which subdivides into 5 waves impulse Elliott Wave structure in lesser degree.
Up from wave ((B)) low on 11.14.2022, wave ((i)) ended at 1.7571 and pullback in wave ((ii)) ended at 1.746. Pair then resumes higher again in wave ((iii)) towards 1.8, and dips in wave ((iv)) ended at 1.787. Final leg higher wave ((v)) ended at 1.8068 which completed wave 1 in higher degree. Pullback in wave 2 is unfolding as a zigzag Elliott Wave structure to correct cycle from 11.14.2022 low before the rally resumes. Down from wave 1, wave ((a)) ended at 1.7794 and rally in wave ((b)) ended at 1.7941. Expect wave ((c)) lower to complete at 1.749 – 1.766 area which is the 100% – 161.8% Fibonacci extension of wave ((a)). As far as pivot at 1.745 low stays intact, expect dips to find support in 3, 7, 11 swing for further upside.
GBPAUD 60 Minutes Elliott Wave Chart
Trade Idea: Technical Breakdown of Top Cryptos
BTCUSD
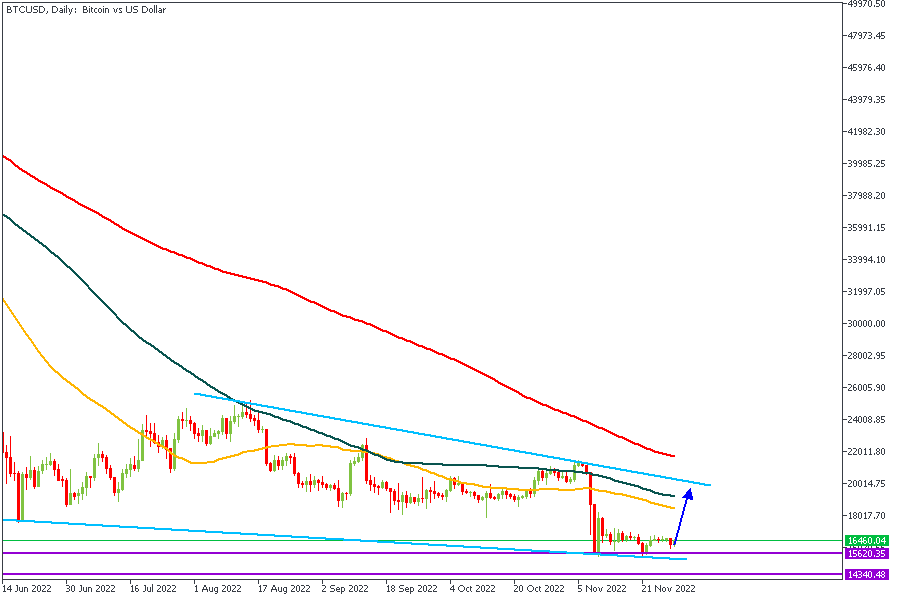
Let's start off with a look at the Daily timeframe on Bitcoin. We currently see price reacting to the rally-base-rally demand zone between the 15,600 - 14,300 price area. Price also seems to have found support off the trendline support as marked in the image above. Interestingly, this means the overall bias on BTCUSD is Bullish. However, we will take a closer look at the lower timeframes to determine whether or not price has begun yielding in that direction.
H4 Timeframe
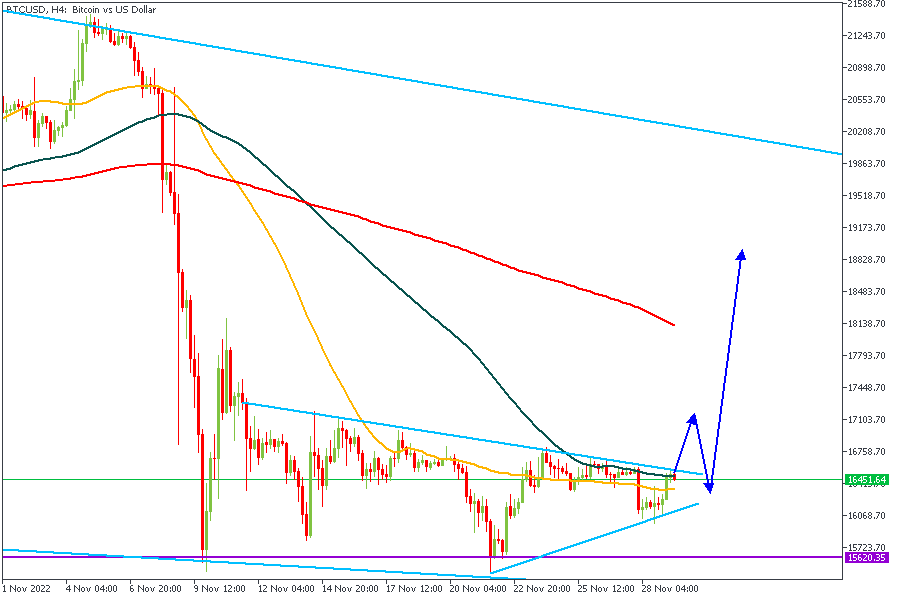
The 4-Hour timeframe poses an interesting scenario - a wedge inside the daily timeframe's channel. As a result, we will be expecting a breakout and retest to confirm the bullish bias with a price target between $18,500 and $20,000.
ETHUSD
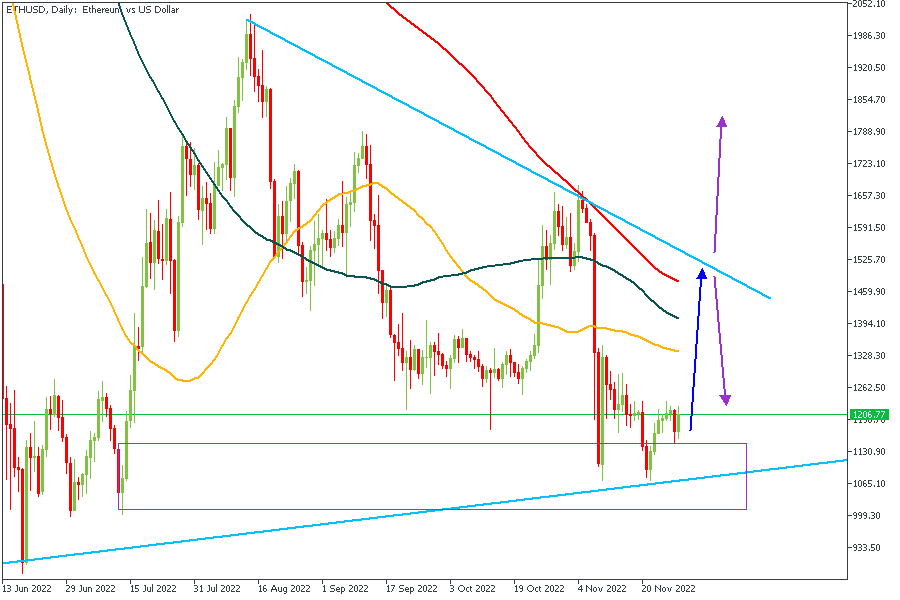
The trendline support on the Daily timeframe as seen above spans all the way from February 2020 and has just recently been tested for a third time. There is also a wide drop-base-rally demand zone within the area (the purple zone). The blue arrow represents primary bias whilst the purple arrows are secondary targets. Let's dive a bit deeper into the lower timeframe.
The 4-Hour Timeframe
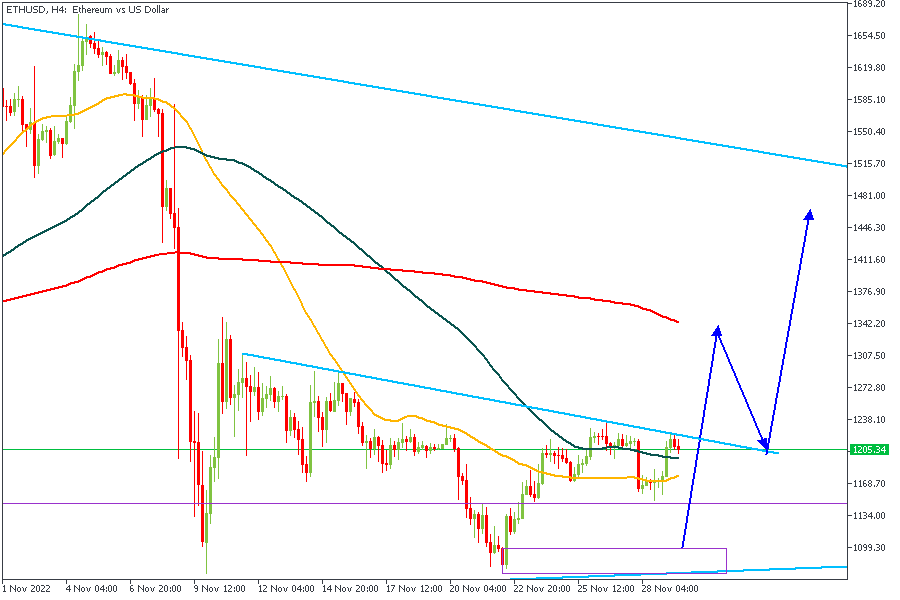
The 4-Hour timeframe shows price reacting to a resistance trendline. This means that despite the overall trend being bullish, price may tend to slip lower into the marked demand zone before actually executing the bullish move.
CONCLUSION
The views above are solely based on Technical Analysis techniques using my personal Smart Money approach. Hence, it is important to understand that the trading of CFDs comes at a risk; if not properly managed, you may lose all of your trading capital. To avoid costly mistakes while you look to trade these opportunities, be sure to do your own due diligence and manage your risk appropriately.
NZDCAD Wave Analysis
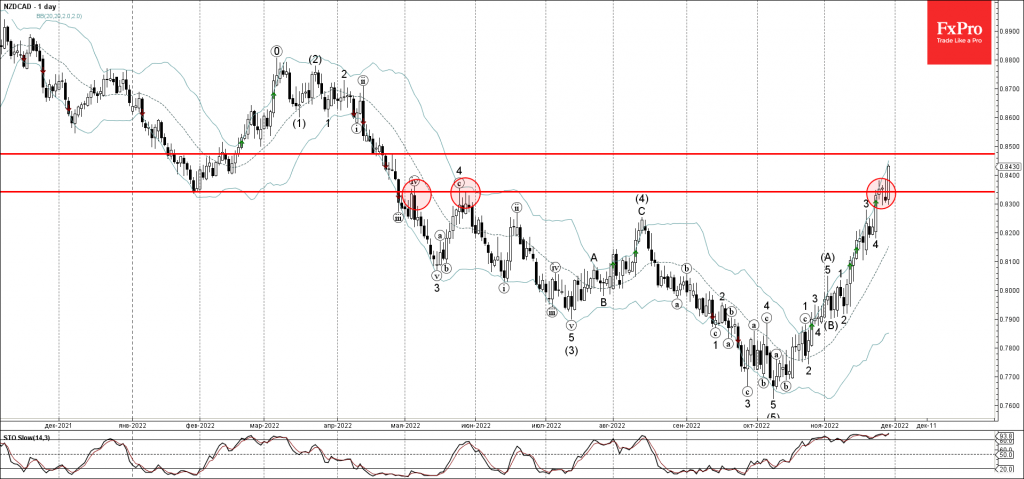
- NZDCAD broke key resistance level 0.8340
- Likely to rise to resistance level 0.8475
NZDCAD today broke up sharply above the key resistance level 0.8340 (which has been reversing the price from the start of May).
The breakout of the resistance level 0.8340 accelerated the short-term impulse wave 5 of the sharp intermediate impulse sequence (C) from the start of November.
Given the clear daily downtrend and strongly bearish CAD sentiment, NZDCAD can be expected to rise further toward the next resistance level 0.8475.