Sample Category Title
The 0.7100 Hurdle: Key Factors Driving AUD/USD’s Range-Bound Trade as CPI Looms
AUD/USD experienced a tug-of-war session on Tuesday as market participants navigated a complex landscape of hawkish domestic policy expectations and rising global trade uncertainty.
The AUD/USD pair hovered around the 0.7040 – 0.7070 region, struggling to find a clear directional break after failing to sustain its recent push toward the 0.7100 handle. This seems to be the trend at present and has persisted since February 12.
The Aussie did manage to recover some of Monday's losses despite a resilient US Dollar which received a boost from some hawkish Fedspeak.
Let us take a look at some of the factors affecting AUD/USD at present.
What is affecting AUD/USD at the moment
In my previous article I looked at the possibility of a pullback for AUD/USD. Now while the pair has edged its way lower, it has been a real grind. The downside has well and truly been capped at this stage.
Part of the reason could be a hawkish RBA. Following the Reserve Bank of Australia’s (RBA) recent hike to 3.85%, policymakers have signaled that the battle against inflation is far from over. The RBA’s technical assumption of approximately 60 basis points of additional hikes this year has fundamentally shifted the AUD’s outlook from bearish to cautiously constructive.
Now this is even more pertinent given that Australian CPI data will be released shortly.
Expectations heading into the Australian CPI release are for a sticky print. Markets are expecting a 3.7% YoY, the narrative of persistent price pressures continues to provide a "yield floor" for the Aussie.
Beyond inflation data, a stable outlook for the Chinese economy is also underpinning the Aussie.The People’s Bank of China (PBoC) kept its Loan Prime Rates (LPR) unchanged, reinforcing a "stability over stimulus" approach. This provided a neutral anchor for the AUD, preventing a steeper sell-off but failing to provide the "rocket fuel" needed for a breakout.
The CPI data coupled with tariff risk will likely be the catalyst for the next move in AUD/USD. Markets are closely watching the upcoming State of the Union (SOTU) speech and further tariff rhetoric.
Any escalation in trade tensions typically drives "risk-off" sentiment, which favors the US Dollar over the Aussie.
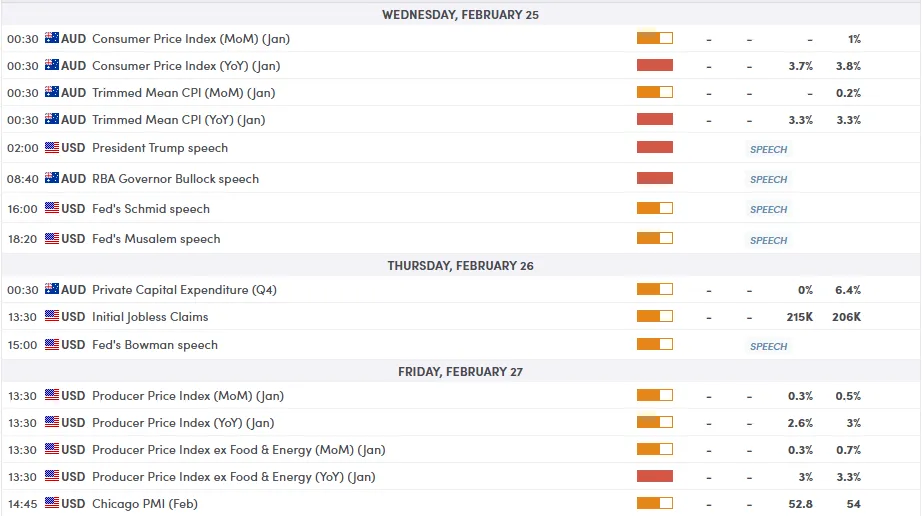
For all market-moving economic releases and events, see the MarketPulse Economic Calendar. (click to enlarge)
Technical Analysis - AUD/USD
From a technical point of view, AUD/USD has been range-bound for the past two weeks.
Traders will be hoping that the CPI print could shake the Aussie dollar back to life and make a move beyond the 0.7100 handle.
The 0.7100 has become a hurdle in a way over the past two weeks.
The pair first needs to find acceptance above this level if bulls are finally ready to take control
A break to the downside really needs to first clear the 100-day MA before recent lows at 0.70300 comes into focus.
AUD/USD Daily Chart, February 24, 2026
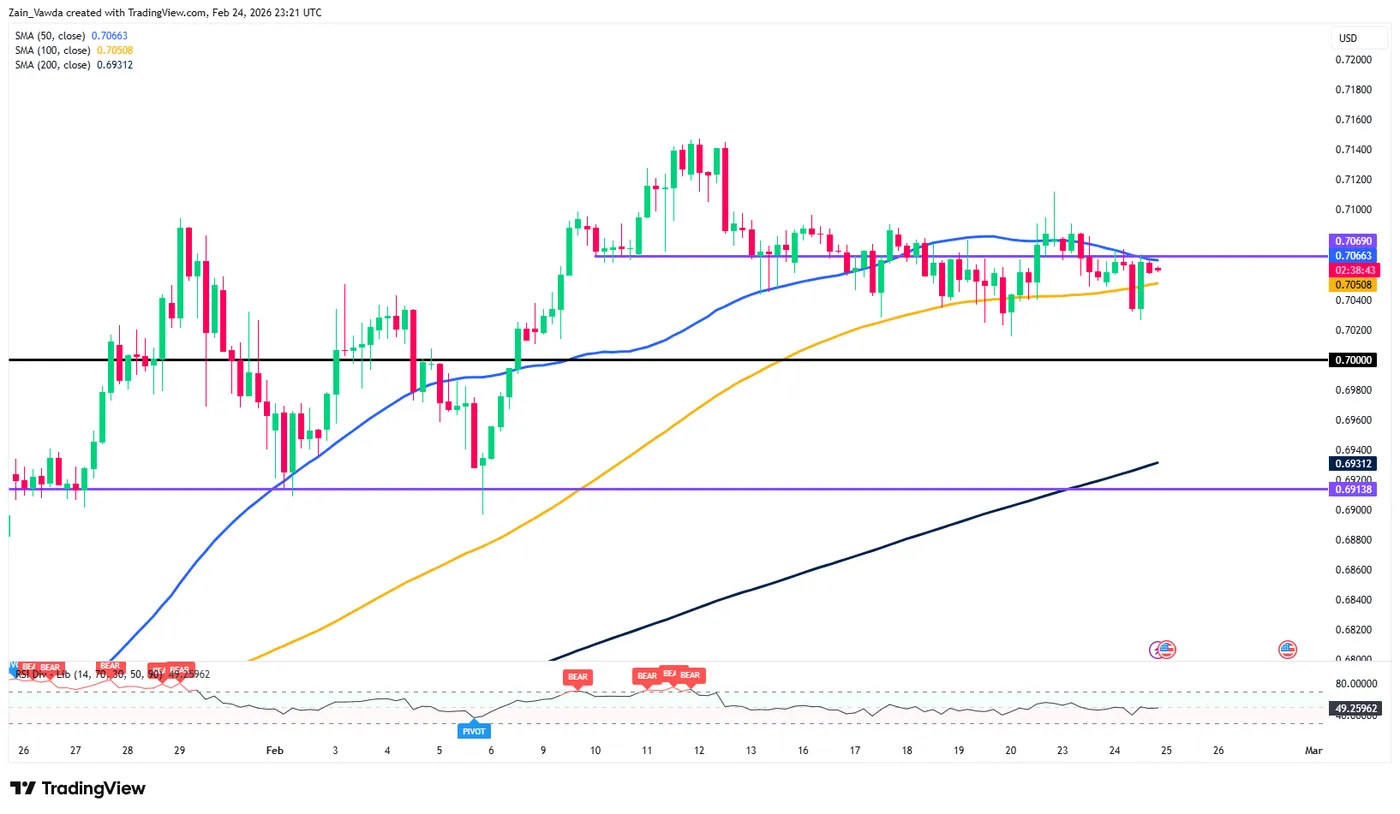
Source:TradingView.com
USD/CAD Flirts With Key Confluence Level. Can Bulls Keep Up Gains Beyond 1.3728 Handle?
- USD/CAD is testing a critical confluence level at 1.3728, a key resistance area.
- The pair's rise is primarily driven by a resurgent US Dollar and stronger-than-expected US economic data.
- Key catalysts to watch are the upcoming Canadian Q4 GDP and US PPI data on Friday, as well as Oil price movements.
The loonie has continued to lose ground against the greenback today reaching a daily high around the 1.3725 handle.
One of the key drivers of late has been a resurgent greenback which has overshadowed the rise in Oil prices. Similar to what we saw last year with the implementation of the liberation day tariffs where the US dollar weakened as a result, the US Supreme Court decision has given the US dollar a boost.
Stronger-than-expected US data, including a rise in Consumer Confidence (91.2 vs. 87.1 forecast) and an uptick in the ADP Employment Change four-week average, also bolstered the greenback.
Technical Analysis - USD/CAD
Back to the technicals though and USD/CAD has made its way back to a key confluence level at 1.3728.
This makes the upcoming sessions key as it could see USD/CAD extend its rally higher or we could be starting a new leg to the downside.
The 1.3728 handle has been a key area of support in 2025 before serving as a key resistance area since the start of 2026.
A break of this level does face further areas of resistance above with the 100 and 200-day MAs resting at 1.3859 and 1.3810 respectively.
If the greenback runs out of steam and we do get a pullback, immediate support rests at 1.3650 before the 1.3500 handle comes into focus.
USD/CAD Daily Chart, February 24, 2025
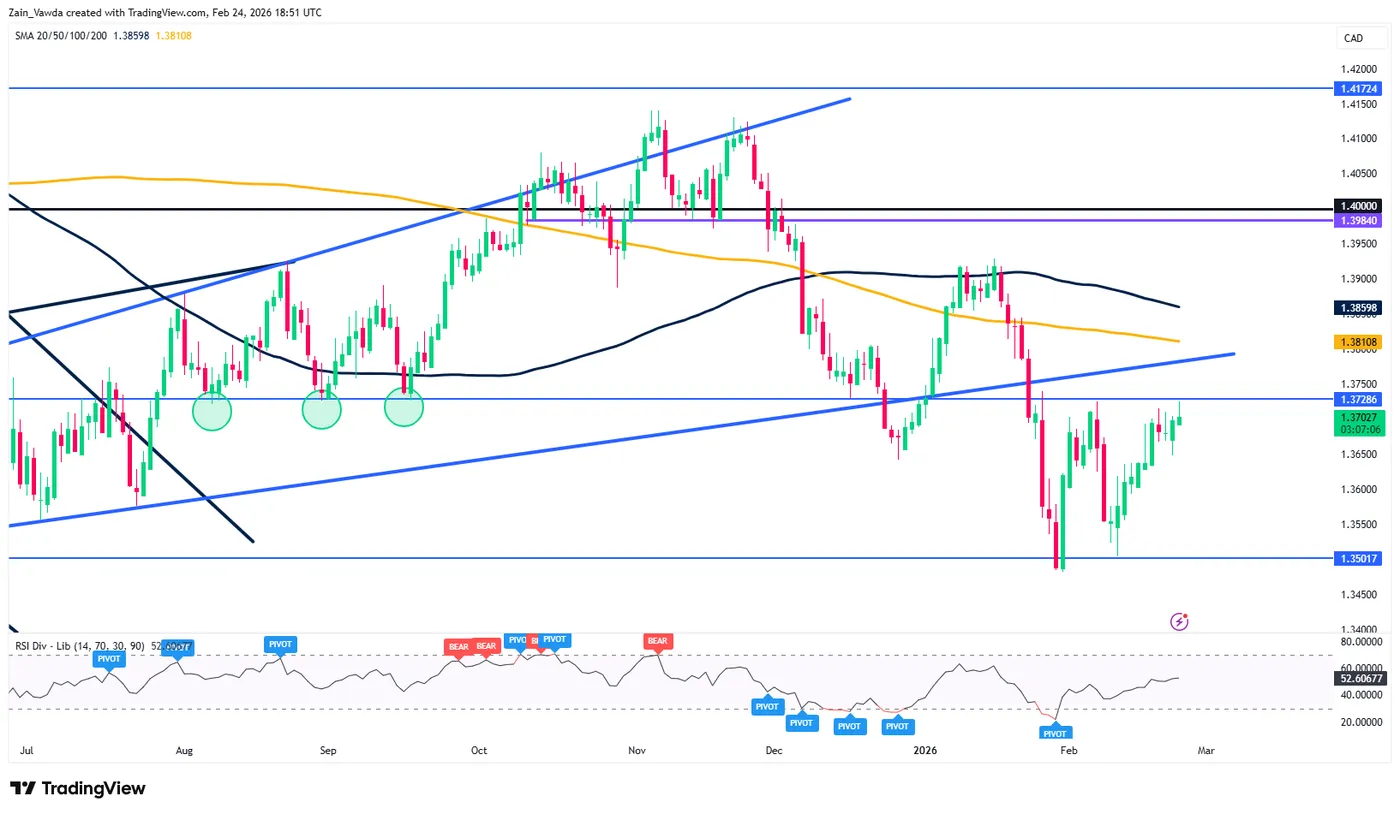
Source: TradingView.com (click to enlarge)
What catalysts could facilitate the move
The market was in a "wait-and-see" mode regarding domestic Canadian data. Investors were looking ahead to the Q4 annualized GDP report due that Friday, which was expected to provide the next major catalyst for the Canadian Dollar's direction.
From the US we will get PPI data on Friday which could also stoke volatility.
Beyond the data, Oil prices may still have a role to play. If the US-Iran situation heads toward conflict, Oil prices may surge. This in turn could lend the Canadian dollar some support and scupper any attempted move higher.
For all market-moving economic releases and events, see the MarketPulse Economic Calendar.
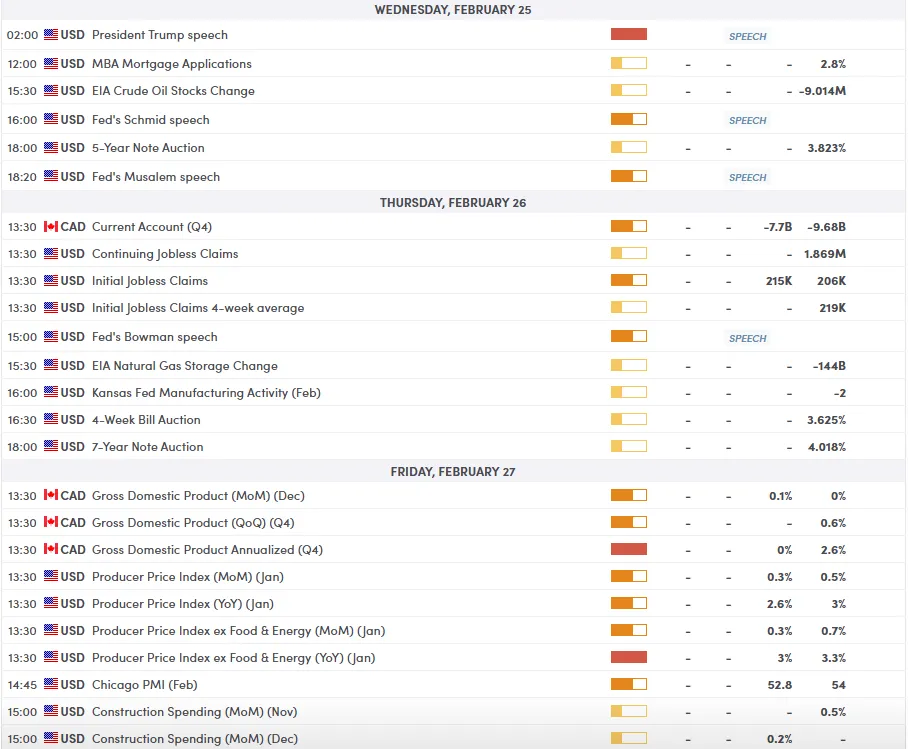
Eco Data 2/25/26
| GMT | Ccy | Events | Act | Cons | Prev | Rev |
|---|---|---|---|---|---|---|
| 23:50 | JPY | Corporate Service Price Index Y/Y Jan | 2.60% | 2.60% | 2.60% | |
| 00:30 | AUD | CPI M/M Jan | 0.40% | 1.00% | ||
| 00:30 | AUD | CPI Y/Y Jan | 3.80% | 3.70% | 3.80% | |
| 00:30 | AUD | Trimmed Mean CPI M/M Jan | 0.30% | 0.20% | ||
| 00:30 | AUD | Trimmed Mean CPI Y/Y Jan | 3.40% | 3.30% | 3.30% | |
| 07:00 | EUR | Germany GfK Consumer Climate Mar | -24.7 | -23.1 | -24.1 | -24.2 |
| 07:00 | EUR | Germany GDP Q/Q Q4 F | 0.30% | 0.30% | 0.30% | |
| 09:00 | CHF | UBS Economic Expectations Feb | 9.8 | -4.7 | ||
| 10:00 | EUR | Eurozone CPI Y/Y Jan F | 1.70% | 1.70% | 1.70% | |
| 10:00 | EUR | Eurozone Core CPI Y/Y Jan F | 2.20% | 2.20% | 2.20% | |
| 15:30 | USD | Crude Oil Inventories (Feb 20) | 16.0M | 1.8M | -9.0M |
| 23:50 | JPY |
| Corporate Service Price Index Y/Y Jan | |
| Actual | 2.60% |
| Consensus | 2.60% |
| Previous | 2.60% |
| 00:30 | AUD |
| CPI M/M Jan | |
| Actual | 0.40% |
| Consensus | |
| Previous | 1.00% |
| 00:30 | AUD |
| CPI Y/Y Jan | |
| Actual | 3.80% |
| Consensus | 3.70% |
| Previous | 3.80% |
| 00:30 | AUD |
| Trimmed Mean CPI M/M Jan | |
| Actual | 0.30% |
| Consensus | |
| Previous | 0.20% |
| 00:30 | AUD |
| Trimmed Mean CPI Y/Y Jan | |
| Actual | 3.40% |
| Consensus | 3.30% |
| Previous | 3.30% |
| 07:00 | EUR |
| Germany GfK Consumer Climate Mar | |
| Actual | -24.7 |
| Consensus | -23.1 |
| Previous | -24.1 |
| Revised | -24.2 |
| 07:00 | EUR |
| Germany GDP Q/Q Q4 F | |
| Actual | 0.30% |
| Consensus | 0.30% |
| Previous | 0.30% |
| 09:00 | CHF |
| UBS Economic Expectations Feb | |
| Actual | 9.8 |
| Consensus | |
| Previous | -4.7 |
| 10:00 | EUR |
| Eurozone CPI Y/Y Jan F | |
| Actual | 1.70% |
| Consensus | 1.70% |
| Previous | 1.70% |
| 10:00 | EUR |
| Eurozone Core CPI Y/Y Jan F | |
| Actual | 2.20% |
| Consensus | 2.20% |
| Previous | 2.20% |
| 15:30 | USD |
| Crude Oil Inventories (Feb 20) | |
| Actual | 16.0M |
| Consensus | 1.8M |
| Previous | -9.0M |
Sunset Market Commentary
Markets
The latest AI disruption scare caused losses of 1.05% (S&P) to 1.65% (Dow) for major US indices yesterday evening. European risk sentiment was weak at the onset of trading but key bourses managed to flip those losses to small gains currently amid an empty eco calendar. For Chicago Fed Goolsbee (non-voter this year) it’s not obvious that Fed policy is restrictive. He sees room for more rate cuts, but that requires progress on inflation. The current 3% is not good enough. The labour market and growth don’t seem to be especially fragile. It’s the current majority thinking within the FOMC. As long as the stabilization on the labour market holds, rate cuts are only the outcome in case of goods disinflation. Even Fed board member Waller yesterday suggested that he might flip back from voting in favour of a rate cut to rate stability if the February jobs report is strong. Dallas Fed Logan over the weekend suggested that 30k monthly job gains are currently probably sufficient to keep the job market stable. Looking further, Fed Waller remains on high alert though with firms starting to shed labour after over-hiring post-Covd and with CEO’s telling him that significant job cuts are coming from AI. The US yield curve at the moment shows a very modest bear steepening with the US 2-yr and 10-yr holding above support levels at respectively 3.4% and 4%. EUR/USD is going nowhere at 1.1775. US equity benchmarks open unchanged, but AI disruption headlines hit the screens again as AI giant Anthropic launched new updates to Claude Cowork and released new plugins for workflows related to investment banking and HR. Focus for US investors shifts to this evening’s State of the Union address by President Trump (9pm ET or 3am CET). Three large software firms release earnings this week (Workday, Salesforce and Intuit) in what might also gather more attention than usual given the AI disruption scare.
The biggest moves in FX space came from Asia today. The Chinese yuan extends its strengthening run with USD/CNY trading below 6.90 for the first time since April 2023 amid the trade truce between the two nations. US President Trump is still planning to travel to China from March 31 to April 2 for a meeting with Chinese President Xi Jinping to talk on tariffs, truce, Taiwan and returning to a stable relationship. The Japanese yen suffers ground with USD/JPY one big figure higher after local media reported that PM Takaichi voiced apprehension over more rate hikes in a meeting with BoJ governor Ueda last week. EUR/GBP holds below 0.8750 resistance as BoE governor Bailey left the March rate debate open: "The question for me is have I seen enough further evidence to feel that I'm confident to take that (rate cut) step. It is a genuinely open question at the moment."
News & Views
Business and consumer combined Czech confidence rose from 100.2 to 101.1 to remain among the highest since the last couple of years. A slight decline in consumer views was offset by rising corporate confidence (from 98.6 to 99.8), particularly in the industrial and construction sector. Trade remained unchanged while services fell a couple of points. The consumer gauge fell 0.6 points to a still-solid 107.6. The share of households expecting their financial situation to improve over the next twelve months declined and was only partially offset by a smaller share anticipating the economy to deteriorate and a fewer believing they are financially worse off than in the previous 12 months. The number of respondents who do not plan to make any major purchases in the next twelve months remained almost unchanged. The Czech crown trades little changed on the day. EUR/CZK holds steady around 24.23 and is trapped in a months-long tight sideways trading range.
The Hungarian central bank (MNB) cut the policy rate by 25 bps to 6.25%. It resumed policy normalization after having held the rate steady for almost 1.5 years. The trigger to do so were January inflation figures that brought headline CPI to 2.1% and core inflation to 2.7%. The MNB noted that the January repricing in market services, a flash point for the MNB, was at is lowest level observed in recent years. Combined with the price margin restrictions recently being extended until the end of May, the general improvement in the external cost environment and the pass-through of a stronger forint, the MNB anticipates inflation to remain below the 3% target in coming months. It repeated expectations for a sustained return to 3% by 2027H2 and added that risks to the outlook are balanced. The central bank keeps a slight hawkish edge in the statement by saying that price stability can be achieved through tight monetary conditions. It will as such continue to ensure positive real interest rates. The forint reacted stoic with EUR/HUF hovering around 379.25.
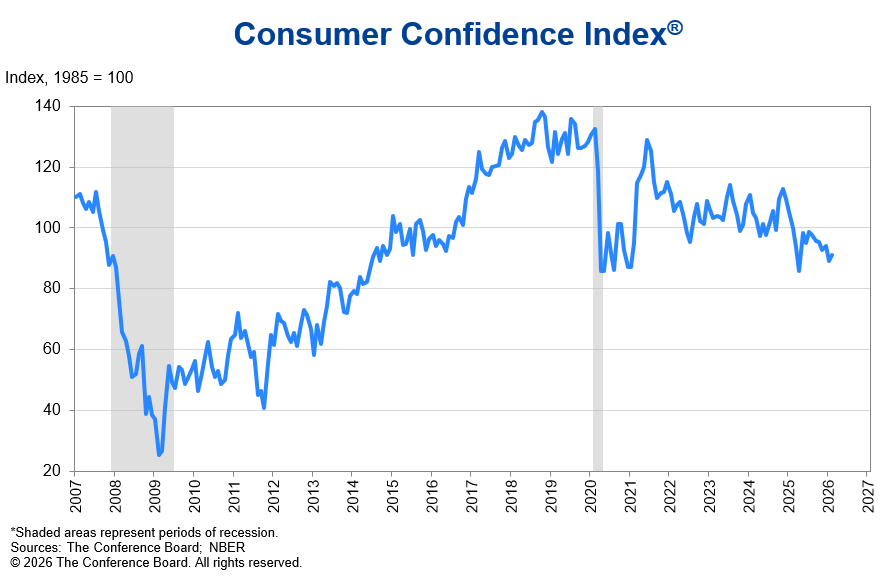
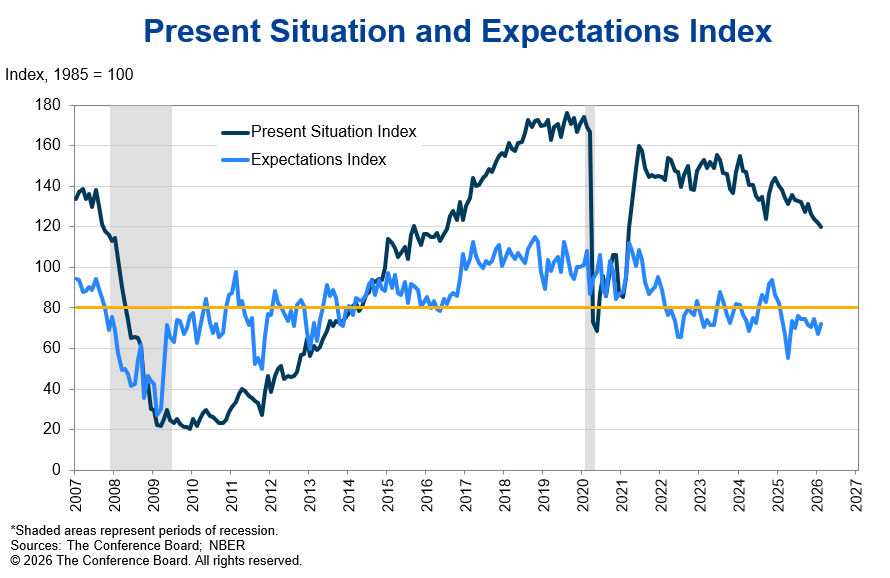
US consumer confidence rises to 91.2, inflation and trade still weigh
US consumer confidence improved modestly in February, with the The Conference Board index rising from 89.0 to 91.2, beating expectations of 88.2. The rebound follows January’s decline and suggests some stabilization in household sentiment, though overall levels remain well below the November 2024 peak of 112.8.
The details were mixed. The Present Situation Index slipped -1.8 points to 120.0, indicating slightly softer assessments of current conditions. However, the Expectations Index jumped 4.8 points to 72.0, pointing to easing pessimism about the economic outlook over the next six months.
Chief Economist Dana M. Peterson said four of five components improved, but cautioned that consumer commentary continues to skew negative. Concerns about prices and inflation remain dominant, with references to trade and politics increasing. While labor market mentions eased somewhat, broader unease suggests confidence is stabilizing rather than turning decisively positive.
Bailey: March cut on the table as disinflation progresses
At a UK Treasury Committee hearing, Andrew Bailey said a March rate cut remains a “genuinely open question”. Bailey noted inflation is now expected to return to around the 2% target “sooner than we were expecting”, with April’s data—due in May—potentially showing inflation near target.
He added that the latest inflation reading came in broadly as expected, but the composition showed notable shifts. Goods prices have softened more than anticipated, likely reflecting trade effects from China, while food prices also eased more than forecast. Services inflation, however, has proven stickier.
MPC member Megan Greene, who has consistently voted to hold rates, cautioned that she remains concerned about the transition embedded in the central forecast. She described it as a “nifty handoff” where inflation hits target just as wage growth and expectations moderate, offsetting fiscal effects—a sequence she worries may not unfold smoothly.
Greene said she would need further evidence that wage growth is continuing to ease and that business and household inflation expectations are moderating before supporting a cut.
US100, Gold, USD/JPY
- US100 holds losses after AI-scare trade selloff.
- Gold softens but remains near three‑week high amid tariff chaos, geopolitics.
- USDJPY eyes triangle breakout as Takaichi’s rate‑hike stance pressures yen ahead of inflation data.
AI woes hit Wall Street – US100
US stock futures steadied on Tuesday after a wobbly start to the week, as a fresh bout of AI‑disruption‑driven selling rattled investors. Sentiment was further pressured by renewed uncertainty surrounding US President Donald Trump’s tariff policy. Concerns about the displacement effects of artificial intelligence across software and broader industries intensified following a bearish Citirni Research report outlining potential AI‑related risks beyond the tech sector.
Although traders appear to be sidestepping some of the tech‑led declines as the so‑called “AI scare” trade moderates, markets remain unsettled by confusion over tariff developments. This follows Friday’s fallout after the US Supreme Court struck down President Trump’s original sweeping duties.
The US100 is attempting to consolidate following a 1.13% drop in the previous session, which pushed the index below the medium‑term ascending trendline drawn from the August lows. It currently sits just under the 38.2% Fibonacci retracement of the October 30 – November 21 pullback from the record high at 24,757. Strong support is expected at the 23.6% Fibonacci level near 24,400, while any bullish correction could see the index retesting the short‑term simple moving averages (SMAs) at 25,075 and 25,300 respectively.
Renewed tariff turmoil, US – Iran tensions – Gold
Gold is easing from a three‑week high near 5,250 as a firmer US dollar and profit‑taking weigh on prices following a rally driven by uncertainty over US tariffs and Middle East tensions. Investors are awaiting clarity on President Donald Trump’s tariff plans after the Supreme Court on Friday invalidated his previous global tariff regime. In response, the administration has implemented temporary 15% duties intended to address what it calls a balance‑of‑payments crisis – an assessment many economists dispute.
Market focus also remains on the US-Iran standoff ahead of a third round of talks, with the White House appearing to edge closer to potential military action over Iran’s nuclear program, including deploying additional warships to the region. Later today, President Trump is set to deliver the State of the Union address, adding another potential catalyst for volatility.
Gold is edging lower, snapping a four‑day winning streak, and is now testing strong support at 5,141 – the 61.8% Fibonacci retracement of the January 29-February 2 pullback from the record high – with the 20‑day SMA near the key 5,000 level as additional support. Despite short‑term softness, the broader outlook remains skewed to the upside, with the MACD and the RSI signals remaining in positive territory despite turning cautious. A rebound could target 5,342, with new highs above 5,420 still possible.
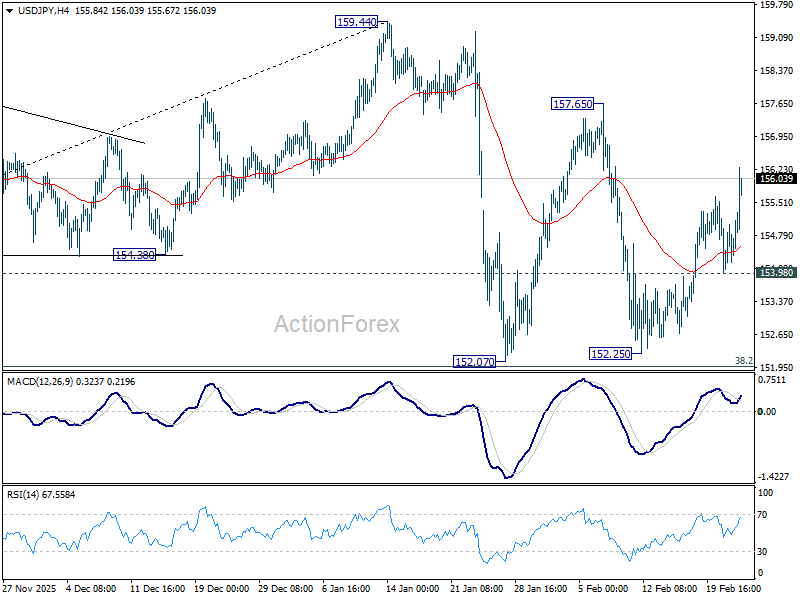
Takaichi rate‑hike view weighs on yen ahead of CPI – USD/JPY
The yen extended its softness against a stronger dollar as tariff concerns resurfaced and reports indicated Japanese Prime Minister Sanae Takaichi expressed reservations about further BoJ rate hikes during a meeting with Governor Kazuo Ueda. The yen’s post‑election rebound from February 8 has now faded, reviving the “Takaichi trade” amid worries that fiscal expansion could weaken the currency further.
Ongoing yen weakness also sharpens focus on inflation ahead of Friday’s Tokyo CPI. Fiscal measures announced so far are unlikely to keep inflation anchored at the BoJ’s 2% target, while recent data suggest earlier cost‑push pressures are easing. Persistent currency softness could bring forward expectations for the next BoJ rate increase—from December to as soon as April.
USDJPY is nearing an upside breakout from a symmetrical triangle, testing two‑week highs around 156.30. Momentum remains limited, with the RSI hovering near neutral at 50 and the MACD still below zero. A daily close above the 50‑day SMA, aligning with the triangle’s upper boundary, would open a path toward 157.60. Conversely, a drop below the 20‑day SMA could expose the psychological 154.00 level.
Fed’s Goolsbee pushes back on front-loaded rate cuts
Chicago Fed President Austan Goolsbee said the Fed should avoid moving too quickly on rate cuts, even as inflation has moderated from its highs. He warned that policymakers learned hard lessons from previously labeling inflation as “transitory” and must not underestimate persistence again.
While acknowledging progress, Goolsbee argued that cutting rates prematurely could jeopardize gains in price stability. He said it would be imprudent to front-load easing before there is firm confirmation that inflation is on a sustained path back to the 2% objective.
"Before we cut rates more to stimulate the economy, let’s be sure inflation is heading back to 2%," emphasized.
He also rejected complacency around 3% inflation rate, stating it is “not good enough” and falls short of the Fed’s commitment. "Stalling out at 3% is not a safe place to be for a myriad of reasons we know all too well,” he added.
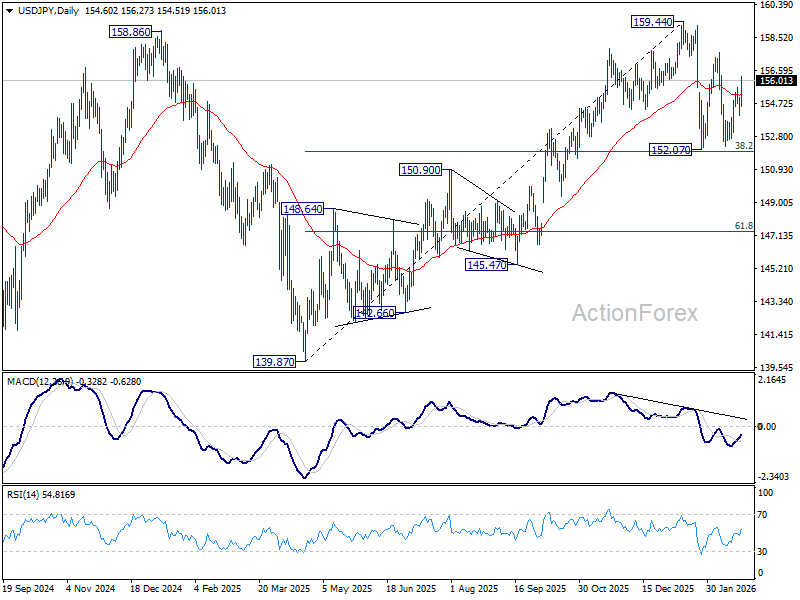
USD/JPY Mid-Day Outlook
Daily Pivots: (S1) 154.10; (P) 154.57; (R1) 155.14; More...
Intraday bias in USD/JPY stays on the upside for 157.65 resistance first. Firm break there will target a retest on 159.44 high. On the downside, below 153.98 minor support will turn intraday bias neutral again first. Overall, with 38.2% retracement of 139.87 to 159.44 at 151.96 intact, price actions from 159.44 are seen as a corrective pattern. Also, rise from 139.87 is expected to resume through 159.44 at a later stage.
In the bigger picture, outlook is unchanged that corrective pattern from 161.94 (2024 high) should have completed with three waves at 139.87. Larger up trend from 102.58 (2021 low) could be ready to resume through 161.94. This will remain the favored case as long as 55 W EMA (now at 151.93) holds. However, sustained break of 55 W EMA will argue that the pattern from 161.94 is extending with another falling leg.
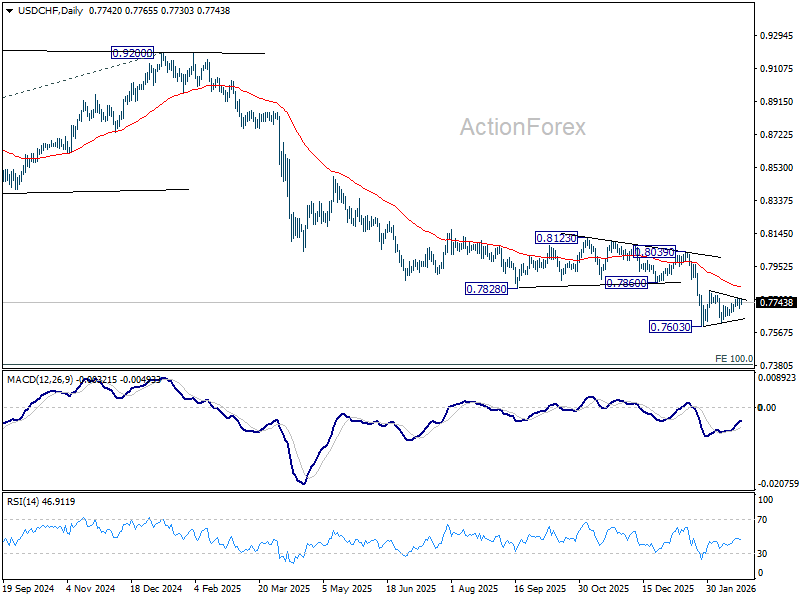
USD/CHF Mid-Day Outlook
Daily Pivots: (S1) 0.7717; (P) 0.7742; (R1) 0.7775; More….
Range trading continues in USD/CHF and intraday bias stays neutral. Consolidation pattern from 0.7603 is still in progress. In case of stronger rise, upside upside should be limited by 55 D EMA (now at 0.7832) to complete the pattern. On the downside, below 0.7627 will bring retest of 0.7603. Firm break there will resume larger down trend, and target 0.7382 projection level next. However, sustained break of 55 D EMA will indicate that a larger scale corrective bounce in underway and target 0.8039 resistance next.
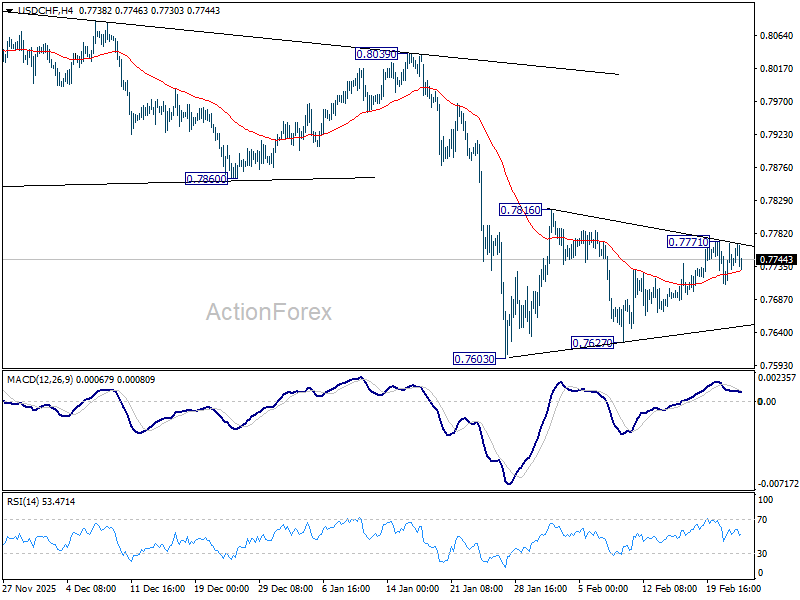
In the bigger picture, down trend from 1.0342 (2017 high) is still in progress. Next target is 100% projection of 1.0146 (2022 high) to 0.8332 from 0.9200 at 0.7382. In any case, outlook will stay bearish as long as 0.8123 resistance holds.