Sample Category Title
GBP/USD Extends Gains for Fourth Consecutive Day as Investors Watch BoE Rate Outlook
GBP/USD continues to rise on Wednesday, reaching 1.3516.
Following recent comments from Bank of England Governor Andrew Bailey, investors are seeking additional clarification on his decision to keep the rate unchanged at the last meeting. The Monetary Policy Committee left the rate unchanged, with a narrow margin.
The market expects two rate cuts in 2026, taking the rate down to 3.25%. However, the timing of the easing remains uncertain. If Bailey signals the possibility of a cut as early as March, the market could begin pricing in more than 50bps of easing this year.
An additional source of pressure stems from US President Donald Trump’s trade policy. The baseline tariff of 10% has already entered into force. However, it remains unclear when an increase to 15% might be introduced.
The focus is also on the by-election in the Gorton and Denton constituency in Manchester, which is seen as an important test for Prime Minister Keir Starmer and the Labour Party. Political uncertainty is adding to sterling volatility.
Technical Analysis
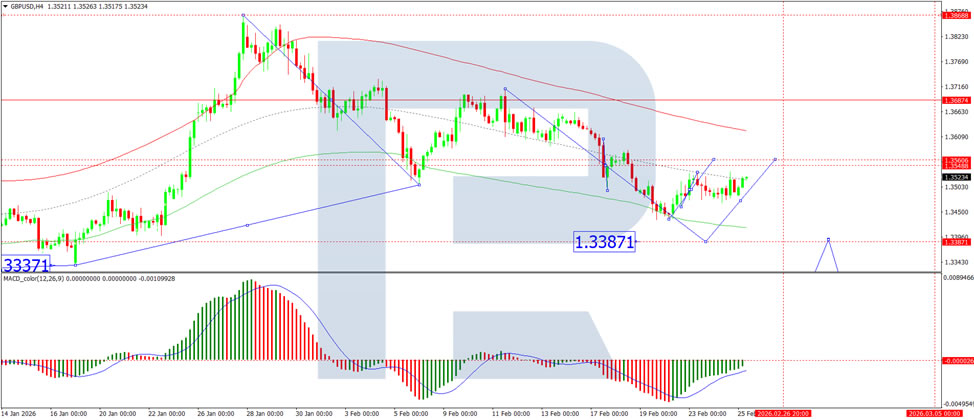
On the H4 GBP/USD chart, the market is forming a broad consolidation range around the 1.3500 level. Today, an expansion towards 1.3560 is possible. Subsequently, a correction towards 1.3494 may follow. After completing this correction, a new consolidation range is likely to form. If it breaks to the upside, the next target would be 1.3622. If it breaks to the downside, the next target may be 1.3383. Technically, this scenario is confirmed by the MACD indicator. Its signal line is below the zero level and pointing upward.
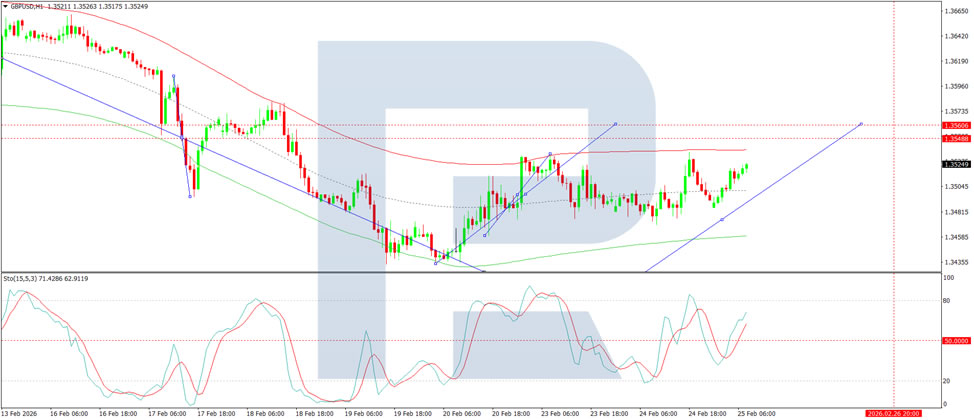
On the H1 GBP/USD chart, the market formed a compact consolidation range around 1.3500 and, following an upside breakout, is developing a wave structure towards 1.3560. Subsequently, a downward move towards 1.3500 cannot be ruled out. Technically, this scenario is confirmed by the Stochastic oscillator. Its signal line is above the 50 level and pointing upward.
Conclusion
In summary, GBP/USD extends its recovery for a fourth consecutive session as markets await clearer signals from BoE Governor Bailey on the timing of potential rate cuts. While the baseline scenario anticipates two reductions this year, any dovish surprise could trigger further repricing. Technically, the pair is building momentum within a broad consolidation range, with near-term resistance at 1.3560 and support at 1.3494. A sustained break above 1.3560 would open the door to 1.3622, while a failure could result in a retest of lower-range levels. Political uncertainty from the upcoming by-election and ongoing US trade policy risks add further volatility. The near-term bias remains cautiously bullish, but direction will depend on Bailey’s tone and market interpretation.
Dollar Index (DXY) May Close February Higher
The second half of February has seen the dollar index strengthen, driven by a combination of bullish factors:
- → A hawkish Fed stance. Minutes from the latest FOMC meeting revealed differing views on rate cuts. With inflation remaining resilient, some members even left the door open to further tightening.
- → Rising tensions between the US and Iran, along with uncertainty surrounding trade tariffs, have boosted demand for the dollar as a safe-haven asset.
- → Recent data pointing to solid industrial output and labour market resilience have reinforced confidence in the strength of the US economy.
As a result, an upward trend line (shown in blue) has formed on the DXY chart, increasing the likelihood that the index will finish February in positive territory after three consecutive months of decline.
Technical Analysis of the DXY Chart
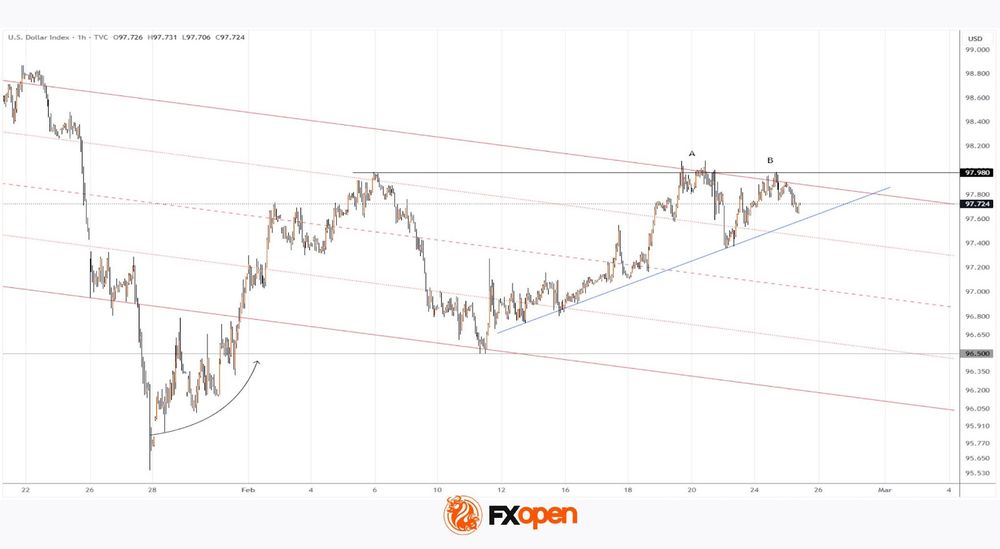
On 16 February, when analysing the dollar index (DXY), we:
- → Updated the descending channel (marked in red), originating in November 2025.
- → Highlighted strong demand, reflected in the confident upward trajectory (shown by the arrow) following the brief break below the multi-month low of 96.50 in late January.
Lower highs at points A and B suggest that the upper boundary of the channel continues to act as resistance, while the hesitant price action after breaking the 5 February high indicates waning bullish momentum. This raises the possibility that the blue uptrend line could soon come under pressure from renewed bearish attempts.
On the other hand, there are clear signs of active demand near the key 96.50 level. Therefore, in the longer term, bulls may regain strength and attempt to overturn the broader downtrend.
Trade global index CFDs with zero commission and tight spreads (additional fees may apply). Open your FXOpen account now or learn more about trading index CFDs with FXOpen.
This article represents the opinion of the Companies operating under the FXOpen brand only. It is not to be construed as an offer, solicitation, or recommendation with respect to products and services provided by the Companies operating under the FXOpen brand, nor is it to be considered financial advice.
EUR/USD Builds Bullish Momentum as USD/CHF Pullback Accelerates
EUR/USD started a fresh increase above 1.1780. USD/CHF declined from 0.7770 and is now struggling to stay above 0.7925.
Important Takeaways for EUR/USD and USD/CHF Analysis Today
- The Euro started a decent upward move from 1.1750 against the US Dollar.
- There is a key bearish trend line forming with resistance at 1.1800 on the hourly chart of EUR/USD at FXOpen.
- USD/CHF declined below the 0.7725 and 0.7710 support levels.
- There is a major contracting triangle forming with resistance near 0.7765 on the hourly chart at FXOpen.
EUR/USD Technical Analysis
On the hourly chart of EUR/USD at FXOpen, the pair started a fresh increase from 1.1745. The Euro cleared 1.1765 to decrease bearish pressure and move into a bullish zone against the US Dollar.
The bulls pushed the pair above the 50-hour simple moving average and 1.1780. It opened the doors for a move toward the 50% Fib retracement level of the downward move from the 1.1834 swing high to the 1.1766 low.
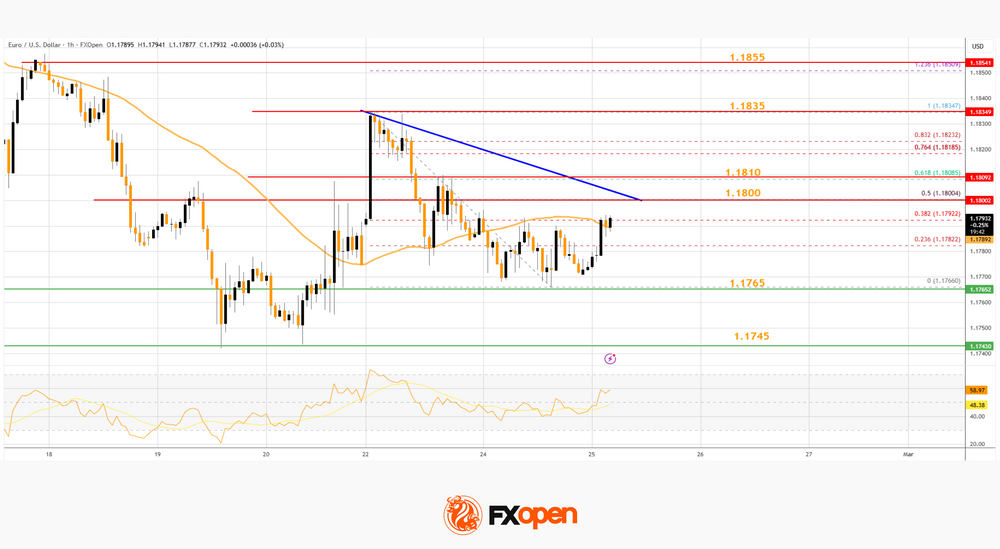
The first key hurdle on the EUR/USD chart is near a bearish trend line at 1.1800. The next barrier for a fresh increase sits near the 61.8% Fib retracement at 1.1810. An upside break above 1.1810 might send the pair toward 1.1835.
The next major area of interest for the bears might be 1.1855. Any more gains might open the doors for a move toward 1.1880. Immediate support on the downside is near the 50-hour simple moving average and 1.1785.
A close below 1.1785 could spark more bearish moves and send the pair toward 1.1765. The next major hurdle for the bears might be 1.1745. Any more losses might send the pair into a bearish zone toward 1.1720.
USD/CHF Technical Analysis
On the hourly chart of USD/CHF at FXOpen, the pair started a fresh decline after it failed to stay above 0.7765. The US Dollar dropped below 0.7755 to move into a negative zone against the Swiss Franc.
There was a move below the 50% Fib retracement level of the upward move from the 0.7710 swing low to the 0.7768 high. The bears pushed the pair below the 50-hour simple moving average and 0.7945.
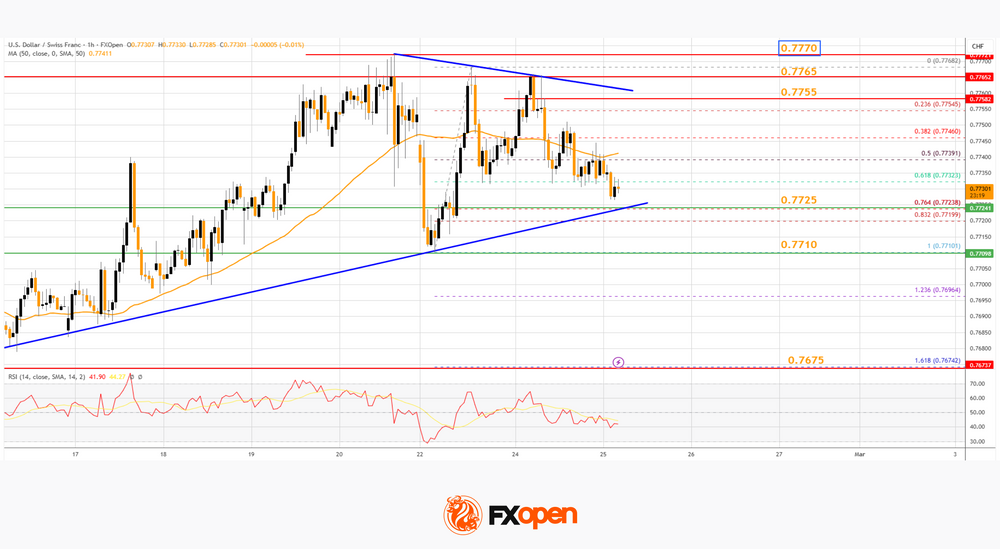
On the downside, immediate support on the USD/CHF chart is 0.7725 and the 76.4% Fib retracement. The first major area of interest could be 0.7710. Any more losses may possibly open the path for a move toward the 0.7675 level in the coming sessions.
On the upside, the pair is facing resistance near the 50-hour simple moving average at 0.7940. A clear move above 0.7740 could send the pair to 0.7755 and a major contracting triangle.
The next major barrier for the bulls might be 0.7765, above which the pair could test the 0.7770 level. If there is a clear break above 0.7770, the pair could start another increase. In the stated case, it could even surpass 0.7820.
Trade over 50 forex markets 24 hours a day with FXOpen. Take advantage of low commissions, deep liquidity, and spreads from 0.0 pips (additional fees may apply). Open your FXOpen account now or learn more about trading forex with FXOpen.
This article represents the opinion of the Companies operating under the FXOpen brand only. It is not to be construed as an offer, solicitation, or recommendation with respect to products and services provided by the Companies operating under the FXOpen brand, nor is it to be considered financial advice.
GBP/JPY Daily Outlook
Daily Pivots: (S1) 208.89; (P) 209.87; (R1) 211.28; More...
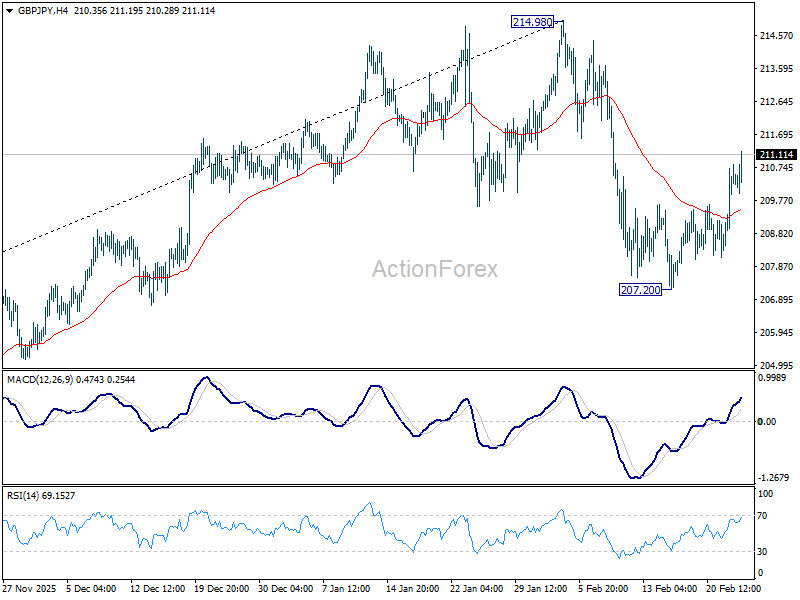
Intraday bias in GBP/JPY remains on the upside for the moment. Pull back from 214.98 has completed as a near term correction at 207.20. Further rise would be seen to retest 214.98 first. Firm break there will resume larger up trend. For now, risk will stay on the upside as long as 207.20 holds, in case of retreat.
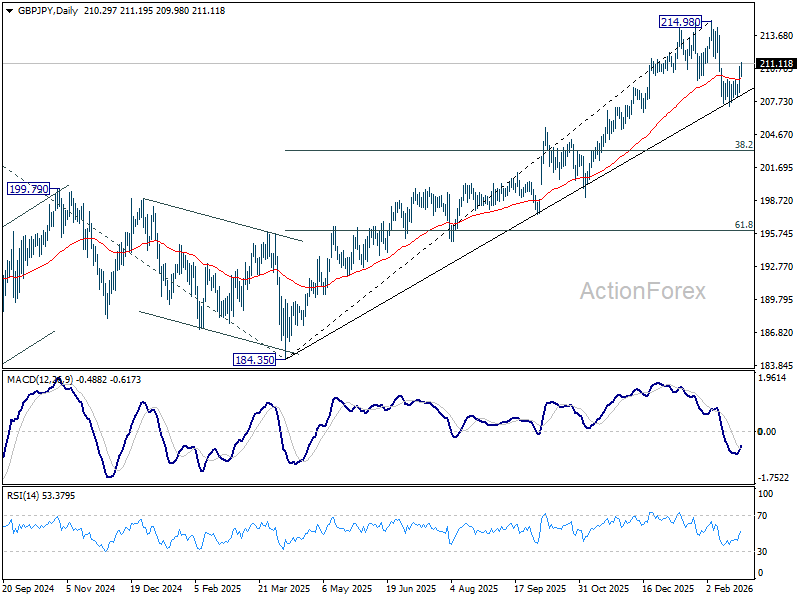
In the bigger picture, current development argues that price actions from 214.98 might be a near term consolidation pattern only. That is, larger up trend from 123.94 (2020 low) is still in progress. Firm break of 214.98 will target 61.8% projection of 148.93 (2022 low) to 208.09 (2024 high) from 184.35 at 220.90. On the downside, though, break of 207.20 will revive that case that it's already in a larger scale correction.
EUR/JPY Daily Outlook
Daily Pivots: (S1) 182.42; (P) 183.30; (R1) 184.44; More...
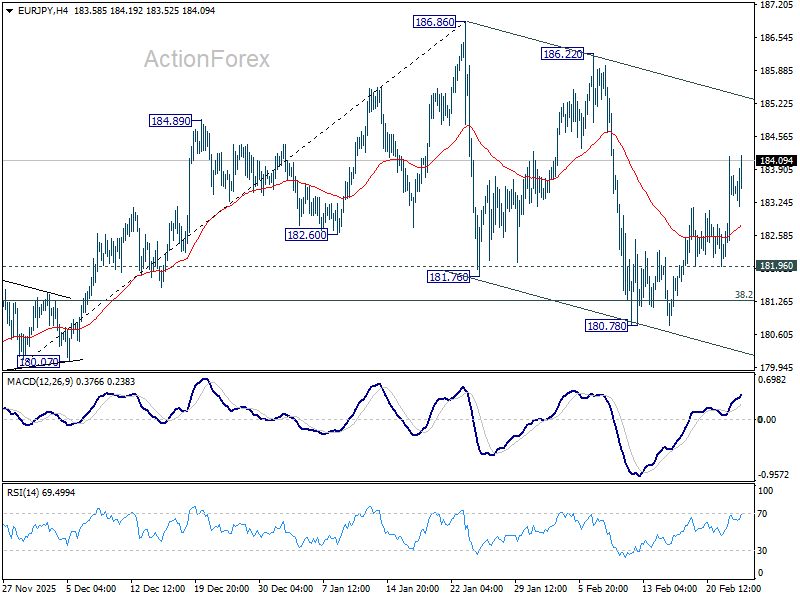
Intraday bias in EUR/JPY stays mildly on the upside for the moment. Near term corrective fall from 187.86 could have completed at 180.78. Further rise should be seen back to retest 186.22/86 resistance zone. On the downside, though, below 181.96 will bring another decline to 38.2% retracement of 172.24 to 186.86 at 181.27.
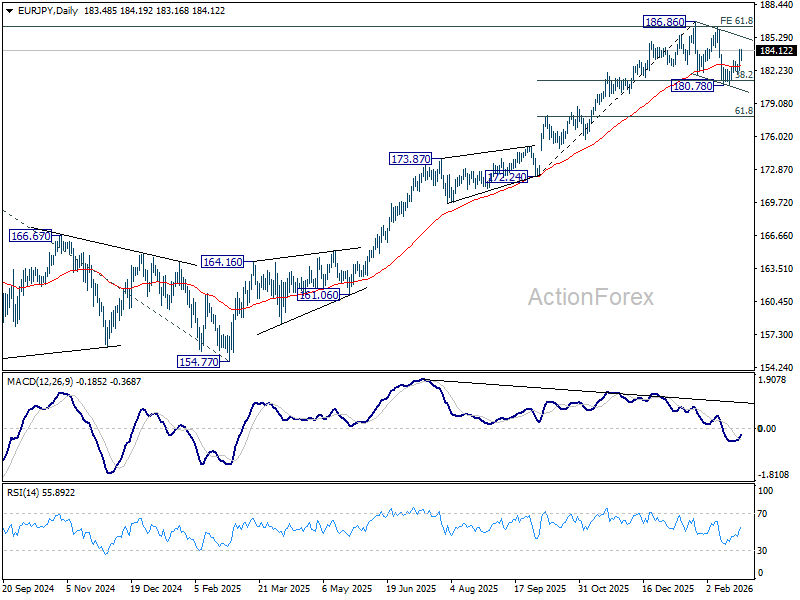
In the bigger picture, current development suggests that price actions from 186.86 are merely a near term corrective pattern. In other words, the long term up trend is still in progress. Firm break of 186.86 will pave the way to 78.6% projection of 124.37 (2022 low) to 175.41 (2025 high) from 154.77 at 194.88 next. This will now remain the favored case as long as 180.78 support holds.
EUR/AUD Daily Outlook
Daily Pivots: (S1) 1.6641; (P) 1.6696; (R1) 1.6736; More...
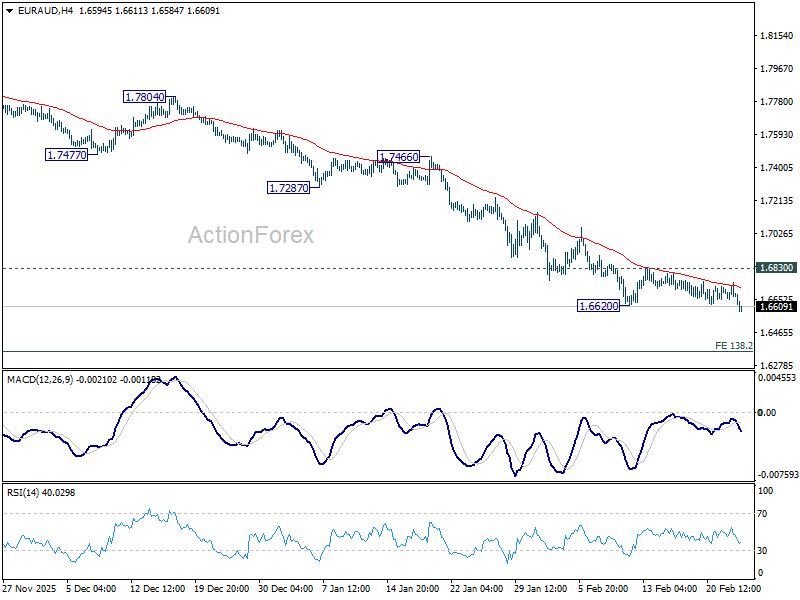
Intraday bias in EUR/AUD is back on the downside with break of 1.6620 support. Fall from 1.8554 is resuming and should target 138.2% projection of 1.8554 to 1.7245 from 1.8160 at 1.6351 next. Near term outlook will remain bearish as long as 1.6830 resistance holds, in case of recovery.
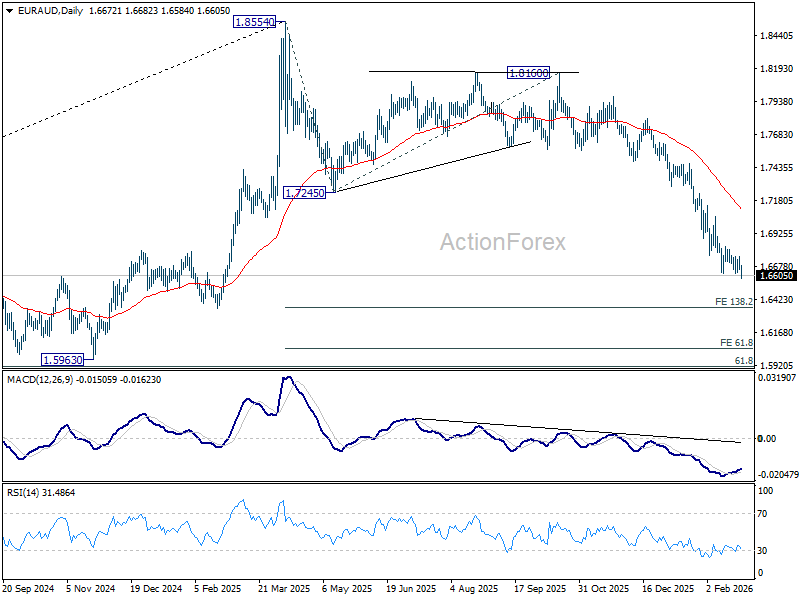
In the bigger picture, fall from 1.8554 medium term top is seen as reversing the whole up trend from 1.4281 (2022 low). Deeper decline should be seen to 61.8% retracement of 1.4281 to 1.8554 at 1.5913, which is slightly below 1.5963 structural support. For now, risk will stay on the downside as long as 1.7245 support turned resistance holds, even in case of strong rebound.
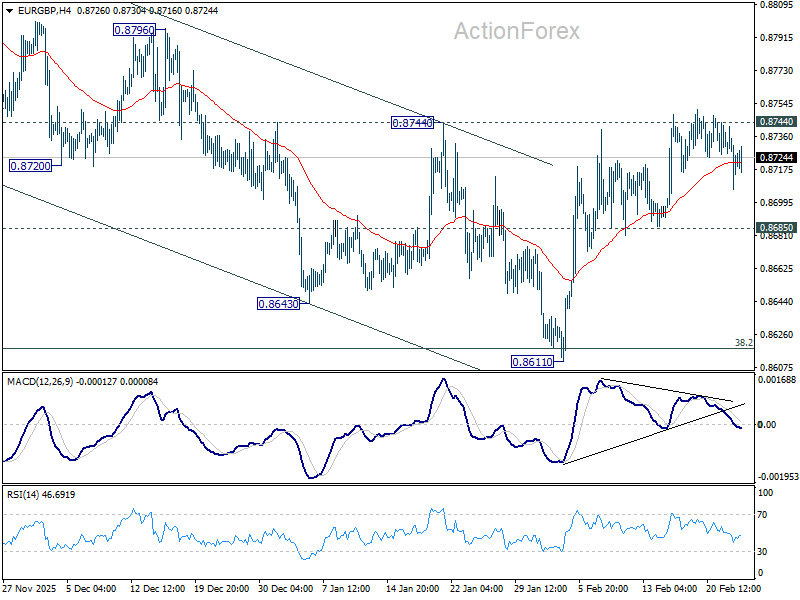
EUR/GBP Daily Outlook
Daily Pivots: (S1) 0.8710; (P) 0.8727; (R1) 0.8745; More…
Intraday bias in EUR/GBP remains neutral for the moment. On the upside, decisive break of 0.8744 resistance. should confirm that fall from 0.8863 has completed as a correction at 0.8661. Further rise should then be seen back to retest 0.8663 high. On the downside, break of 0.8685 support will turn bias back to the downside for 0.8611. Sustained break of 38.2% retracement of 0.8221 to 0.8663 at 0.8618 will carry larger bearish implications and turn outlook bearish.
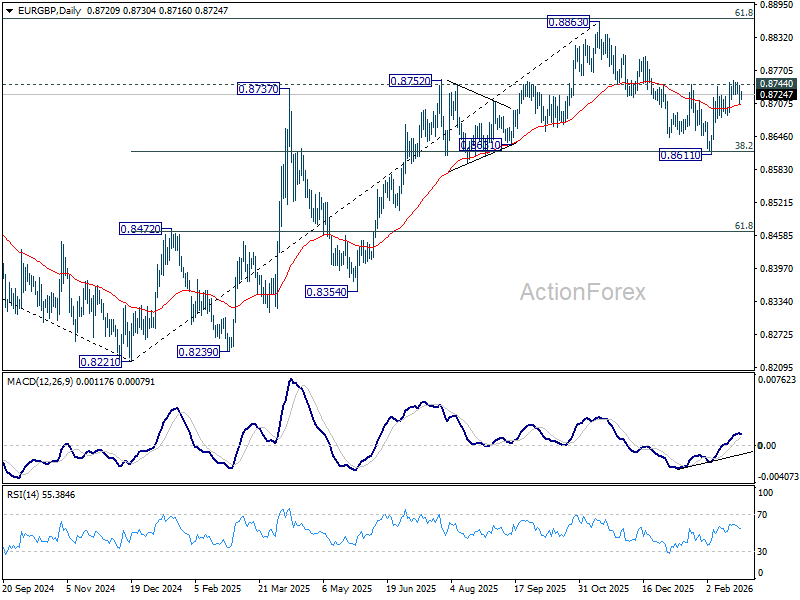
In the bigger picture, rise from 0.8221 medium term bottom (2024 low) is seen as a corrective move. Upside should be limited by 61.8% retracement of 0.9267 to 0.8221 at 0.8867. Sustained trading below 55 W EMA (now at 0.8636) should confirm that this corrective bounce has completed. In this case, deeper fall would be seen back to 0.8201/21 key support zone. However, decisive break of 0.8867 will suggest that EUR/GBP is already reversing whole decline from 0.9267 (2022 high). That should pave the way back to 0.9267.
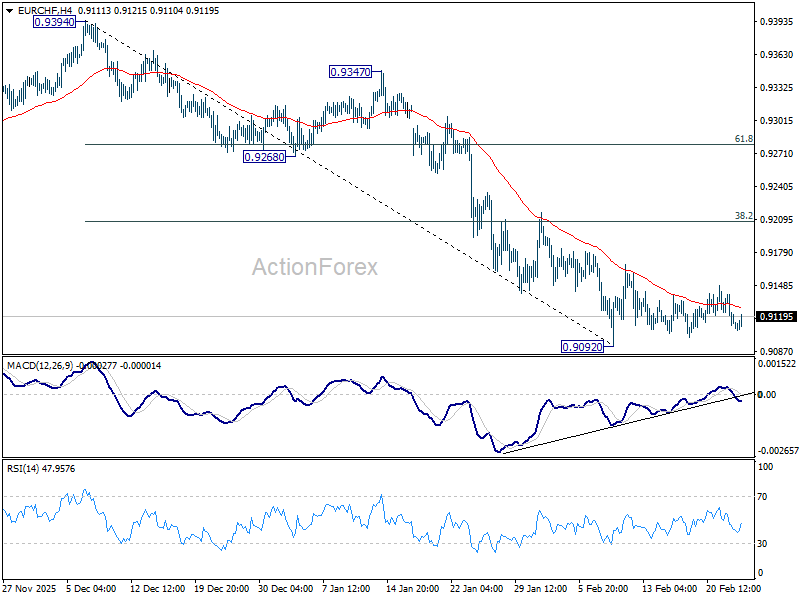
EUR/CHF Daily Outlook
Daily Pivots: (S1) 0.9100; (P) 0.9123; (R1) 0.9135; More....
EUR/CHF is still bounded in consolidations above 0.9092 and intraday bias remains neutral. Stronger rebound might be seen but upside should be limited by 38.2% retracement of 0.9394 to 0.9092 at 0.9207. On the downside, firm break of 0.9092 will resume larger down trend.
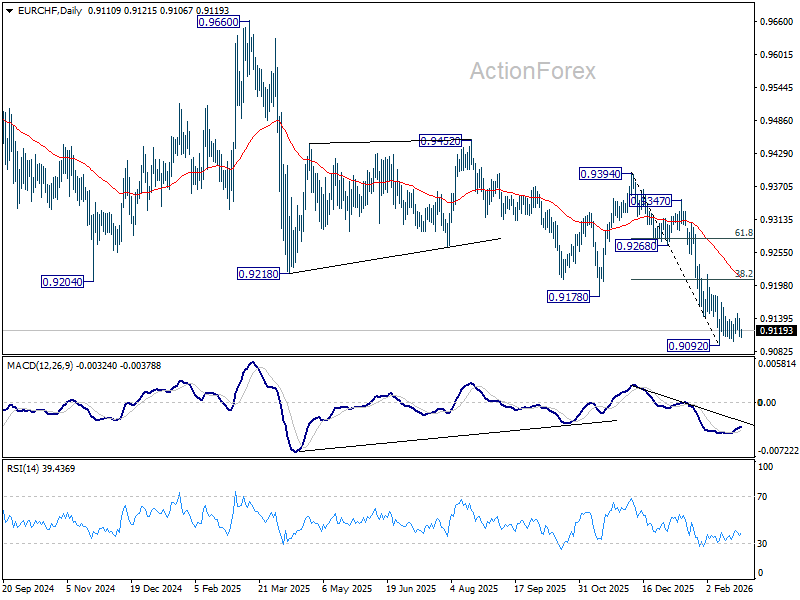
In the bigger picture, down trend from 0.9928 (2024 high) is still in progress with falling 55 W EMA (now at 0.9326) intact. Next target is 61.8% projection of 1.1149 to 0.9407 from 0.9928 at 0.8851. Outlook will stay bearish as long as 0.9394 resistance holds, in case of rebound.
Trump Basically Defends His Policy, But Doesn’t Flag Much New Initiatives
Markets
AI and tariff related uncertainty moved a bit to the back ground yesterday as drivers for daily trading/sentiment. (US) equities recovered (Nasdaq +1.04%) as investors pondered how to position in the wake of the recent debate on the potential disruptive effects of AI on (separate) economic sectors. For now its far less easy to draw any firm conclusions of the AI-debate for central bank policy and rates’ markets. Fed governor Lisa Cook yesterday elaborated on the topic, but her main message is that it might take plenty of time for the Fed to have a clear view on how AI will affect its policy and what it means for the neutral rate. A bit remarkable, Lisa Cook indicated that it might not be appropriate/evident for the Fed to counter an AI-driven rise in unemployment with a stimulative demand-side policy. Whatever, for now, most Fed members (Goolsbee, Collins, Barkin,…) are holding to the line that more confirmation on goods disinflation is needed for the Fed to cut rates further. US yields held relatively tight ranges, changing between +2.3 bps (2-y) and -2 bps (30-y). US consumer confidence (Conference Board) was better than expected both on the assessment for current conditions and expectations, but had hardly any impact on trading. German yields changed less than 1 bp across the curve. The dollar gained marginally, but also mostly held tight ranges (DXY close 97,84; EUR/USD close 1.17). The yen underperformed on headlines that PM Takaichi in a meeting with the BOJ governor Ueda showed concerns on a more restrictive BOJ policy. In a hearing before the UK Parliament’s Treasury Select Committee, BoE governor Bailey confirmed that he expects inflation to drop to 2% in Spring, but didn’t formally engage on March rate cut yet (“It’s a genuinely open question”), amongst others as services inflation didn’t decline as much as hoped. The BoE governor also elaborated on higher productivity causing some dishoarding of labour in the economy. BoE economist Phil still warned on upside underlying inflation risks. Even so, UK gilts’ performance didn’t profoundly deviated from Bunds. UK Money markets still see about 75% chance of a March 25 bps rate cut. Sterling gained marginally on the day (EUR/GBP close 0.873).
Overnight, in his State of the Union address, US president Trump basically defended his policy, including his cost of living approach, but didn’t flag much new policy initiatives. Asian (equity) markets mostly start the day in risk-on modus, joining yesterday’s rebound in the US. US yields gain a few bps. The dollar eases modestly. The yen again underperforms (see below). The yuan extends its uptrend (USD/CNY 6.868). The eco calendar in the US and EMU is again very thin. After the close of US markets Nvidia will publish results. Markets also will continue to keep an eye on the results of software companies as the debate on the impact of AI on other sectors develops.
News & Views
Australian inflation slowed from 1% M/M to +0.4% M/M in January, but this helped stabilizing the annual number at 3.8% Y/Y. Consensus was looking for a slight moderation to 3.7%. The largest contributor to annual inflation was housing (6.8% Y/Y from 5.5% in December). Electricity prices (+32.2% Y/Y from 21.5% Y/Y) remain influenced by government rebate programmes. Food inflation remains high at 3.9% Y/Y. A key measure of underlying inflation (for the Reserve Bank of Australia), the trimmed mean, accelerated from 0.2% M/M to 0.3% M/M and from 3.3% Y/Y to 3.4% Y/Y. Today’s inflation numbers bolster bets that the central bank could already follow up on its inaugural 25 bps rate hike (earlier this month) by the time of the May policy meeting (92%). The market implied probability of back-to-back action in March is slim (16%). AUD/USD profits this morning, moving back above 0.71 and targeting the YtD high at 0.7147.
Japanese PM Takaichi nominated two candidates to fill seats opening up on the Bank of Japan’s policy board. Both Toichiro Asada and Ayano Sato are considered to share the PM’s reflationist views. Yesterday the Japanese yen already lost ground after the PM in a meeting with BoJ governor Ueda voiced opposition against more rate hikes. The two nominees, if approved by both houses of Japanese parliament, are expected to tilt the balance on the BoJ board to the dovish side. The Japanese yield curve bear steepens this morning with the long end rising by up to 7.6 bps higher (driven by inflation expectations). USD/JPY initially spiked from 155.50 to 156, but the move petered out.
EUR/USD Daily Outlook
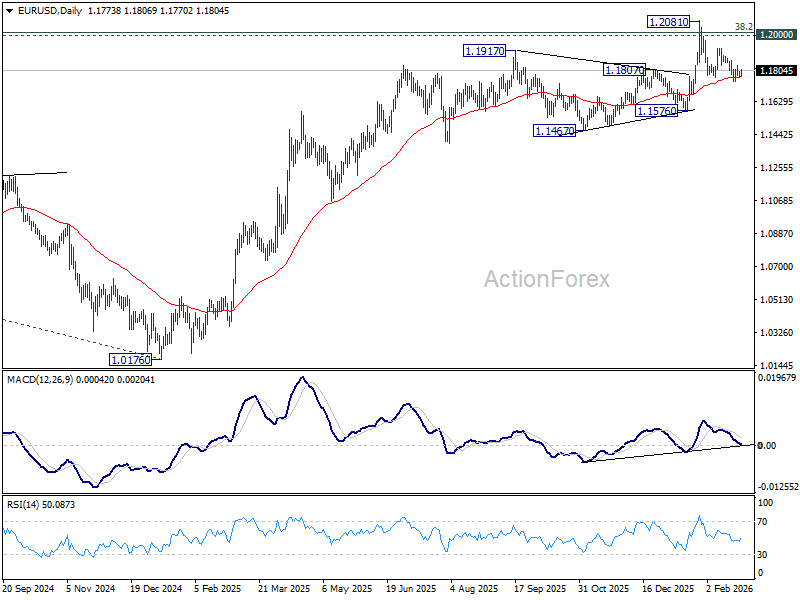
Daily Pivots: (S1) 1.1760; (P) 1.1779; (R1) 1.1791; More….
Intraday bias in EUR/USD remains neutral for the moment, as range trading continues. Near term risk will remain on the downside as long as 1.1928 resistance holds. Below 1.1740 temporary low will target 1.1576 support next. Firm break there should confirm rejection by 1.2 key psychological level and turn near term outlook bearish. However, break of 1.1928 argue that fall from 1.2081 has completed as a correction, and revive near term bullishness. Retest of 1.2081 should then be seen next.
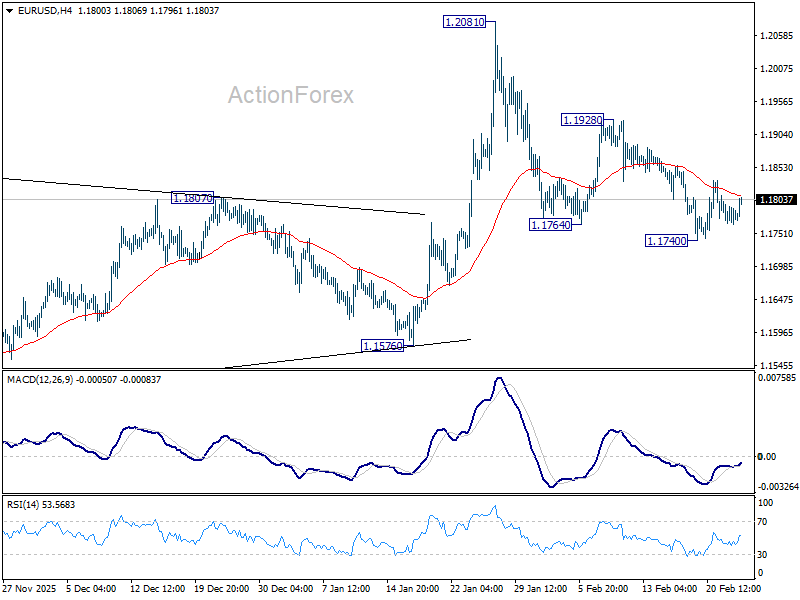
In the bigger picture, as long as 55 W EMA (now at 1.1494) holds, up trend from 0.9534 (2022 low) is still in favor to continue. Decisive break of 1.2 key psychological level will add to the case of long term bullish trend reversal. Next medium term target will be 138.2% projection of 0.9534 to 1.1274 from 1.0176 at 1.2581. However, sustained trading below 55 W EMA will argue that rise from 0.9534 has completed as a three wave corrective bounce, and keep long term outlook bearish.