Sample Category Title
BoE Bailey: Takes 18 to 24 months to bring inflation under control
BoE Governor Andrew Bailey said that inflation was "way above where we (want) it to be". He added, "inflation is bad for the least well-off generally and this inflation is particularly bad."
Bailey noted that further rate hikes were likely in the coming months. Meanwhile, efforts to bring inflation under control are likely to take between 18 months and two years.
GBPJPY Pauses Decline at 50-day SMA
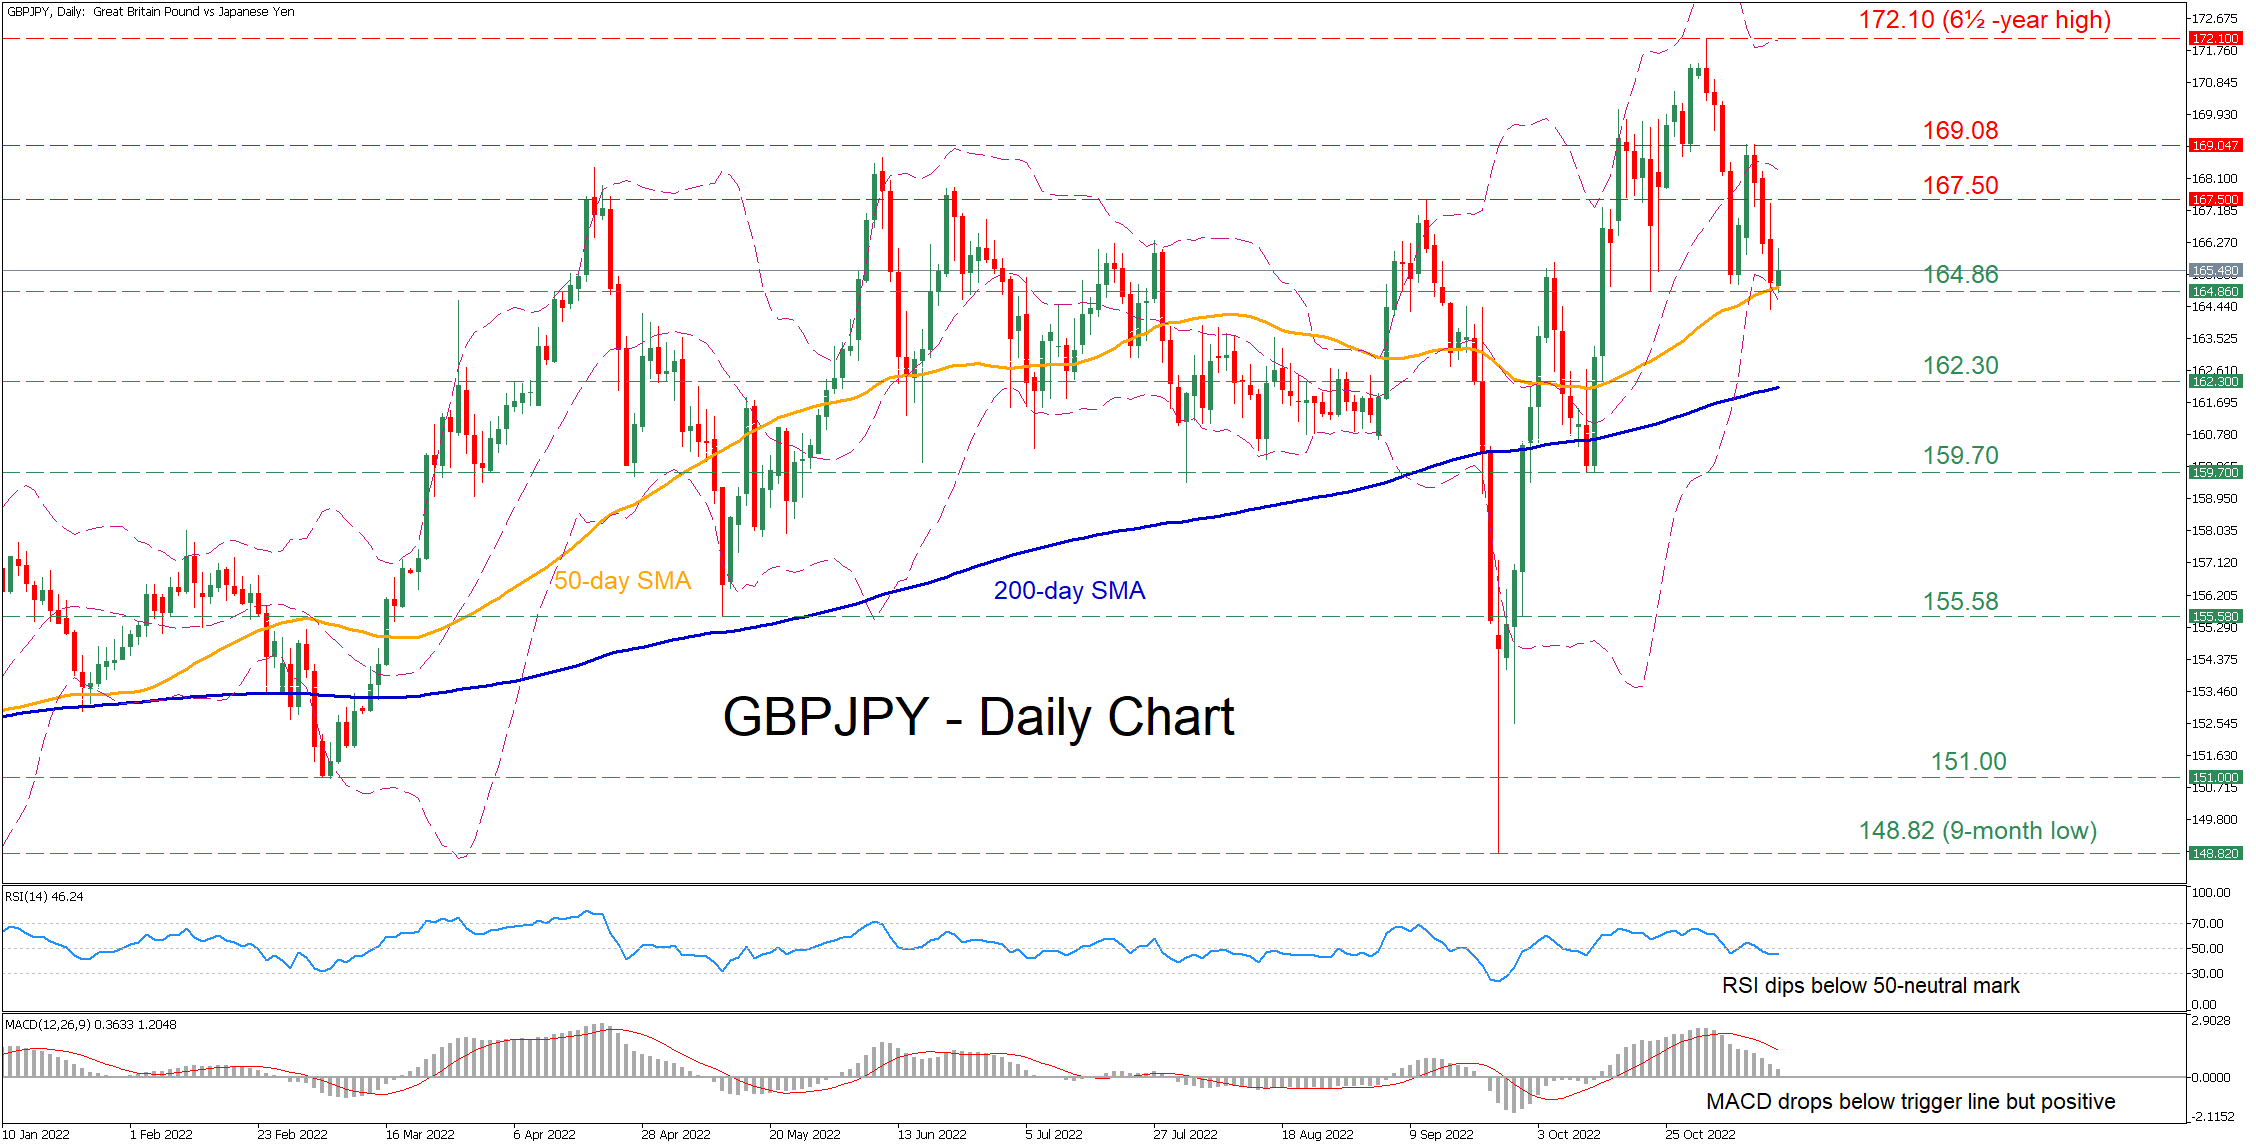
GBPJPY has experienced a steep uptrend since late September, with the price gaining almost 15% and posting a fresh 6½-year high of 172.10. Even though the pair has been losing ground in the short term, the 50-day simple moving average (SMA) has capped its downside.
The short-term oscillators are indicating that bearish forces are strengthening. Specifically, the RSI has dived beneath its 50-neutral mark, while the MACD histogram is softening below its red signal line but remains in the positive territory.
If selling pressures persist, immediate support could be met at 164.86, which overlaps with the 50-day SMA. Sliding beneath that floor, the bears could aim for 162.30 before the October low of 159.70 appears on the radar. Failing to halt there, the attention could shift to the May bottom of 155.58.
On the flipside, bullish actions could propel the price towards the October resistance of 167.50. Piercing through this region, further advances could come to a halt at the double-top region of 169.08. A break above the latter may then set the stage for the 6½-year high of 172.10.
Overall, GBPJPY managed to cease its decline for now, but its short-term picture is constantly deteriorating. Therefore, a break below the 50-day simple moving average could trigger a sustained downtrend.
GBPUSD: The Weekly Bullish Engulfing Adds to Positive Near-term Outlook
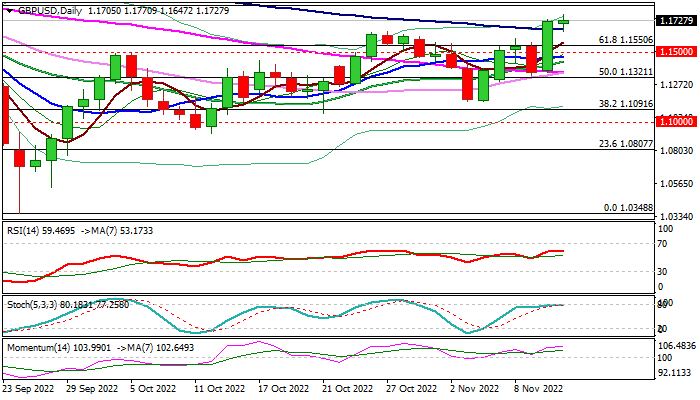
Cable keeps positive tone following Thursday’s 3.3% rally, which generated an additional bullish signal on close above descending 100DMA (1.1658).
Weaker dollar keeps pound inflated and bulls focus target at 1.1834 (Fibo 76.4% of 1.2293/1.0348), the last obstacle en-route to psychological 1.20 barrier.
Bullish daily techs are additionally supported by formation of bullish engulfing pattern on weekly chart, though a pause for consolidation on overbought conditions / partial profit-taking cannot be ruled out.
Broken 100DMA offers immediate support ahead of broken Fibo 61.8% (1.1550) and 1.1500 level which should keep the downside protected and offer better buying levels.
Res: 1.1770; 1.1834; 1.1900; 1.2000.
Sup: 1.1658; 1.1645; 1.1550; 1.1500.
Dollar Index: Dollar Remains Under Strong Pressure and Extends Weakness on Friday
The dollar index remains under strong pressure and extends weakness in European session on Friday, following 2.2% fall previous day, when the greenback was deflated by lower than expected US inflation rise in October that adds to hopes that strong price pressures have started to ease, and the US central bank may start softening its aggressive stance in tightening monetary policy to bring high inflation under control.
The dollar is also on track for the biggest weekly loss since the third week of March 2020 that adds to signals of reversal, which is developing on weekly chart.
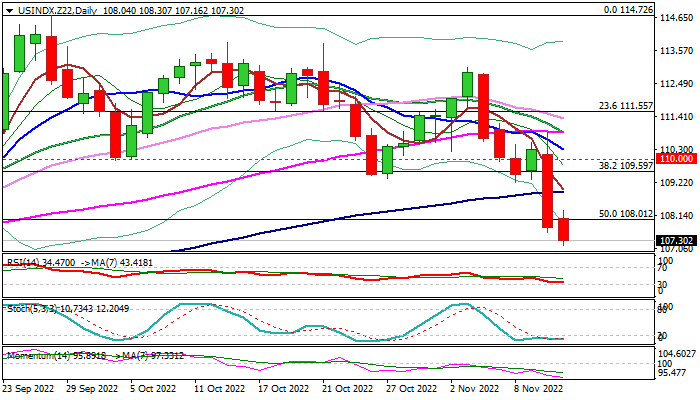
Daily studies turned to bearish setup as fresh bearish acceleration have so far retraced over 50% of 101.29/114.72 upleg) after Thursday’s sharp fall broke through pivotal support at 109.59 (Fibo 38.2% / base of thick daily cloud) and bearish momentum continues to strengthen.
Bears focus next target at 106.42 (Fibo 61.8% of 101.29/114.72), violation of which would risk extension towards rising 200DMA (104.68), as dollar’s sentiment has weakened significantly.
However, bears may take a breather on oversold conditions and week-end profit taking, with upticks to ideally stay capped under broken 100DMA (108.93) which guards pivotal barriers at 109.59/110.00 (broken Fibo 38.2% / psychological).
Res: 108.30; 108.93; 109.59; 110.00.
Sup: 107.16; 106.42; 105.42; 104.68.
Yen Extends Rally as Japan’s PPI Eases
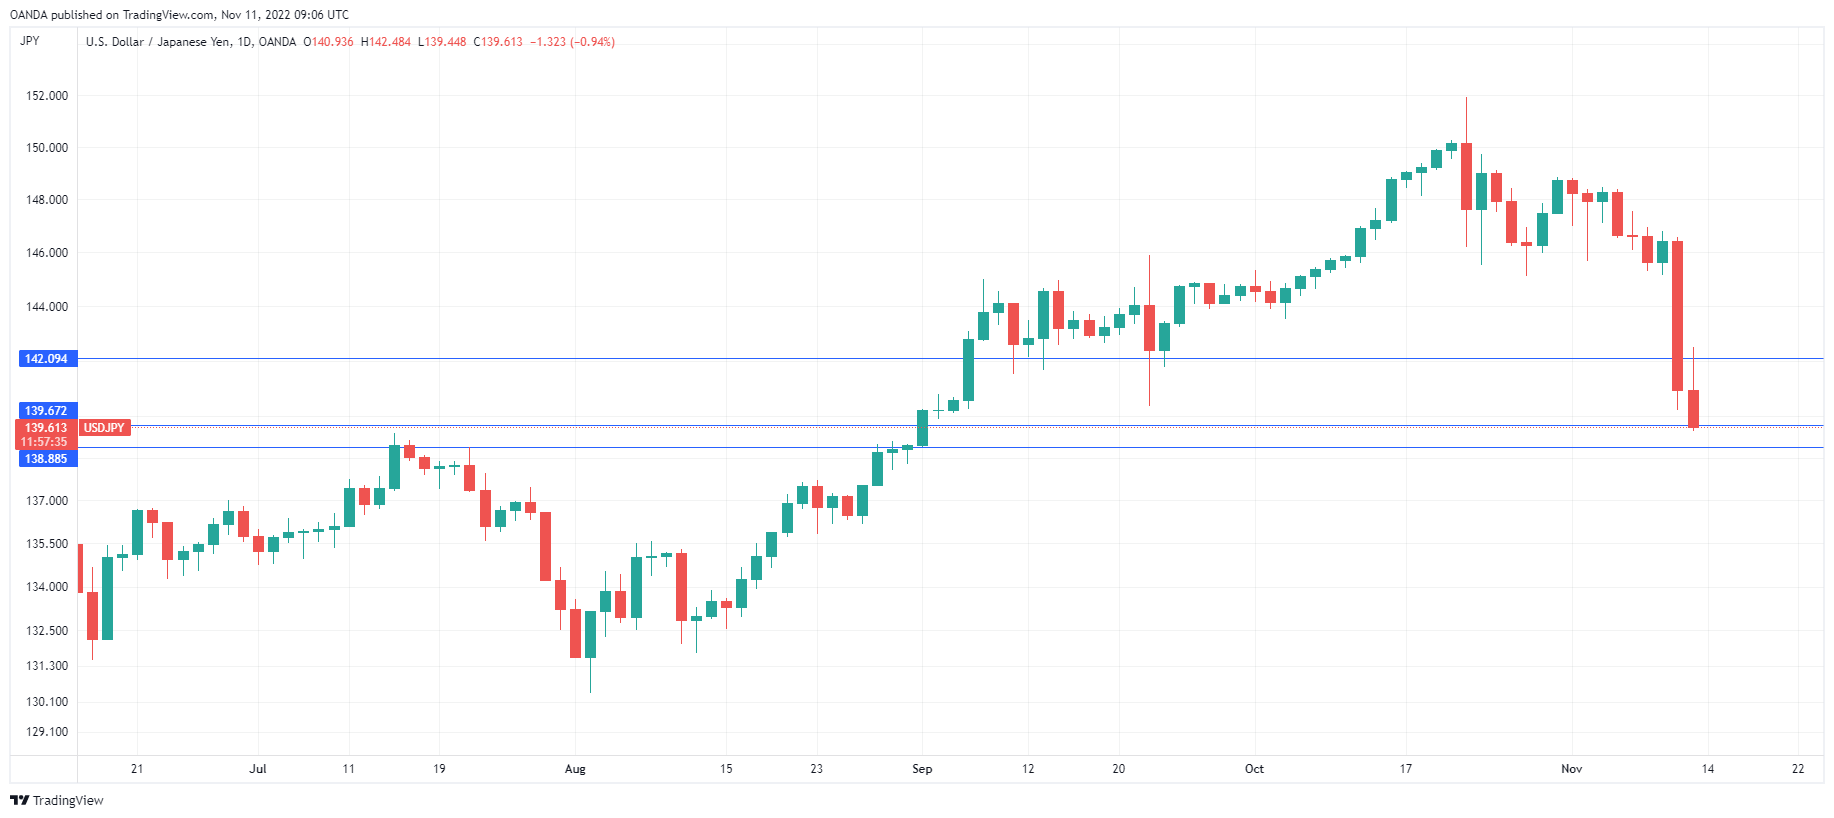
The Japanese yen is taking a breather after posting huge gains on Thursday. In the European session, USD/JPY is trading at 140.30, down 0.45%.
Japan’s PPI declines
The week wrapped up with a key inflation release. Japan’s Producer Price Index slowed to 9.1% in October, down from 10.2% in September. Still, this was above the consensus of 8.8%. Consumer inflation is running around 3%, much lower than in other developed countries but high for Japan. The Bank of Japan has taken note of the rise in inflation but has said that it will not change its ultra-loose policy until it is convinced that inflation is not transient.
The yen has fallen around 20% this year against the dollar but jumped on the bandwagon on Thursday after a soft US inflation report caused the dollar to plummet. Headline inflation dropped to 7.7%, down from 8.2% and core inflation dropped to 6.3%, down from 6.6%. Although inflation remains high, both indicators were lower than expected, which triggered a stampede as US stock markets soared and the US dollar was crushed.
The soft inflation report has raised expectations that the Fed will ease up on the pace of tightening and will raise rates by “only” 50 basis points rather than 75 bp at the December meeting. According to Fed Watch, the markets had priced in a 50 basis point hike in December at 55% (45% for a 75 bp move) prior to the inflation release. This changed dramatically after the inflation release – currently, a 50 bp hike is priced in at 85%, with just 15% for a 75 bp move.
Investors seem to be ignoring Fed Chair Powell’s comment last week that the benchmark rate would peak at a higher level than previously expected, which could mean a terminal rate of 5.0% or even higher. The enthusiasm investors are showing could dampen if the upcoming employment and inflation reports point are stronger than expected.
USD/JPY Technical
- USD/JPY has support at 139.66 and 138.88
- 142.11 is the next resistance line
British Pound Extends Rally
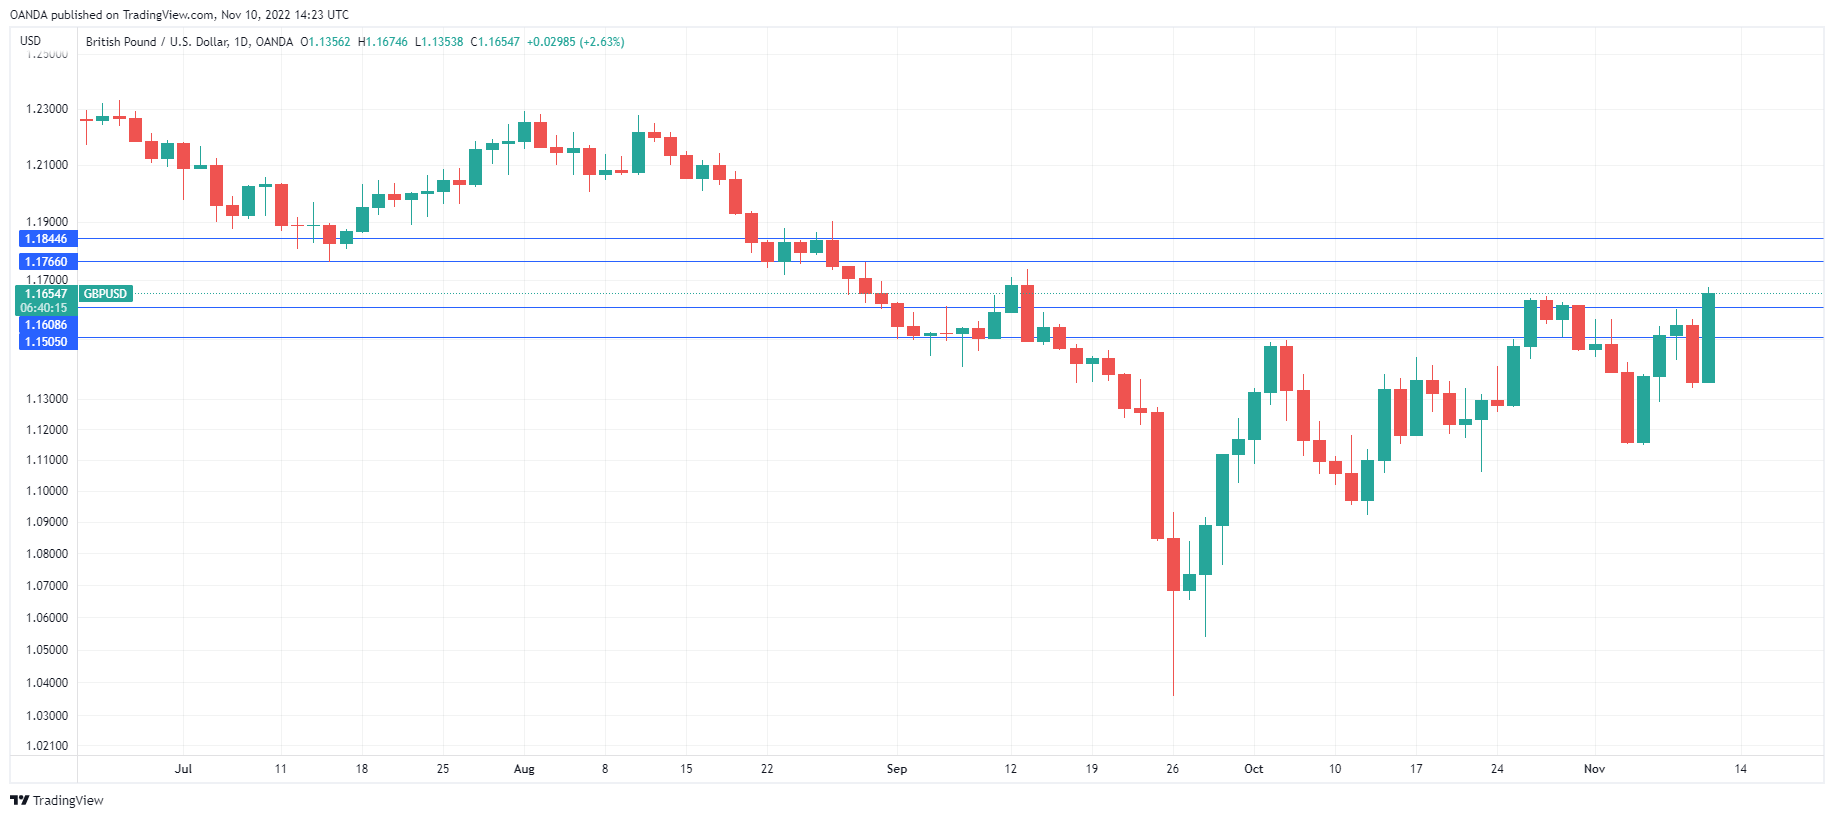
The British pound has extended its gains today, following a huge Thursday. In the European session, GBP/USD is trading at 1.1729, up 0.15%.
US dollar crashes after soft inflation report
The US dollar was in full retreat on Thursday, after the October inflation report indicated that inflation had fallen more than expected. Headline CPI dropped to 7.7%, down from 8.2% in September and below the consensus of 8.0%. Core inflation slowed to 6.3%, down from 6.6% and lower than the forecast of 6.5%. Although inflation still remains high, investors were impressed and went all in on equities. US stocks posted their biggest one-day gain in over two years, and the US dollar was crushed in the stampede. GDP/USD jumped a massive 3.1% and pushed above 1.17 for the first time since mid-September.
The soft inflation report has fueled bets that the Fed will ease up on the pace of tightening. According to Fed Watch, the markets had priced in a 50 basis point hike in December at 55% (45% for a 75 bp move) prior to the inflation release, but this has changed to an 85% likelihood of a 0.50% (15% for 75 bp increase). Investors appear to be ignoring Fed Chair Powell’s comment last week that the benchmark rate would peak at a higher level than previously expected, which could mean a terminal rate of 5.0% or even higher. The Fed has not switched to a dovish stance, but investors are betting that the drop in inflation will force the Fed to pivot.
In the UK, today’s data was soft but better than expected. GDP for Q3 came in at -0.2% QoQ, down from 0.2% in Q2 but above the consensus of -0.5%. Manufacturing Production for September improved to zero, up from -1.6% reading in August and above the consensus of -0.4%.
GBP/USD Technical
- GBP/USD is testing resistance at 1.1767. The next resistance line is 1.1844
- 1.1609 and 1.1467 and providing support
XAUUSD: Bulls Have a Great Potential to Bring the Price to 1802.65
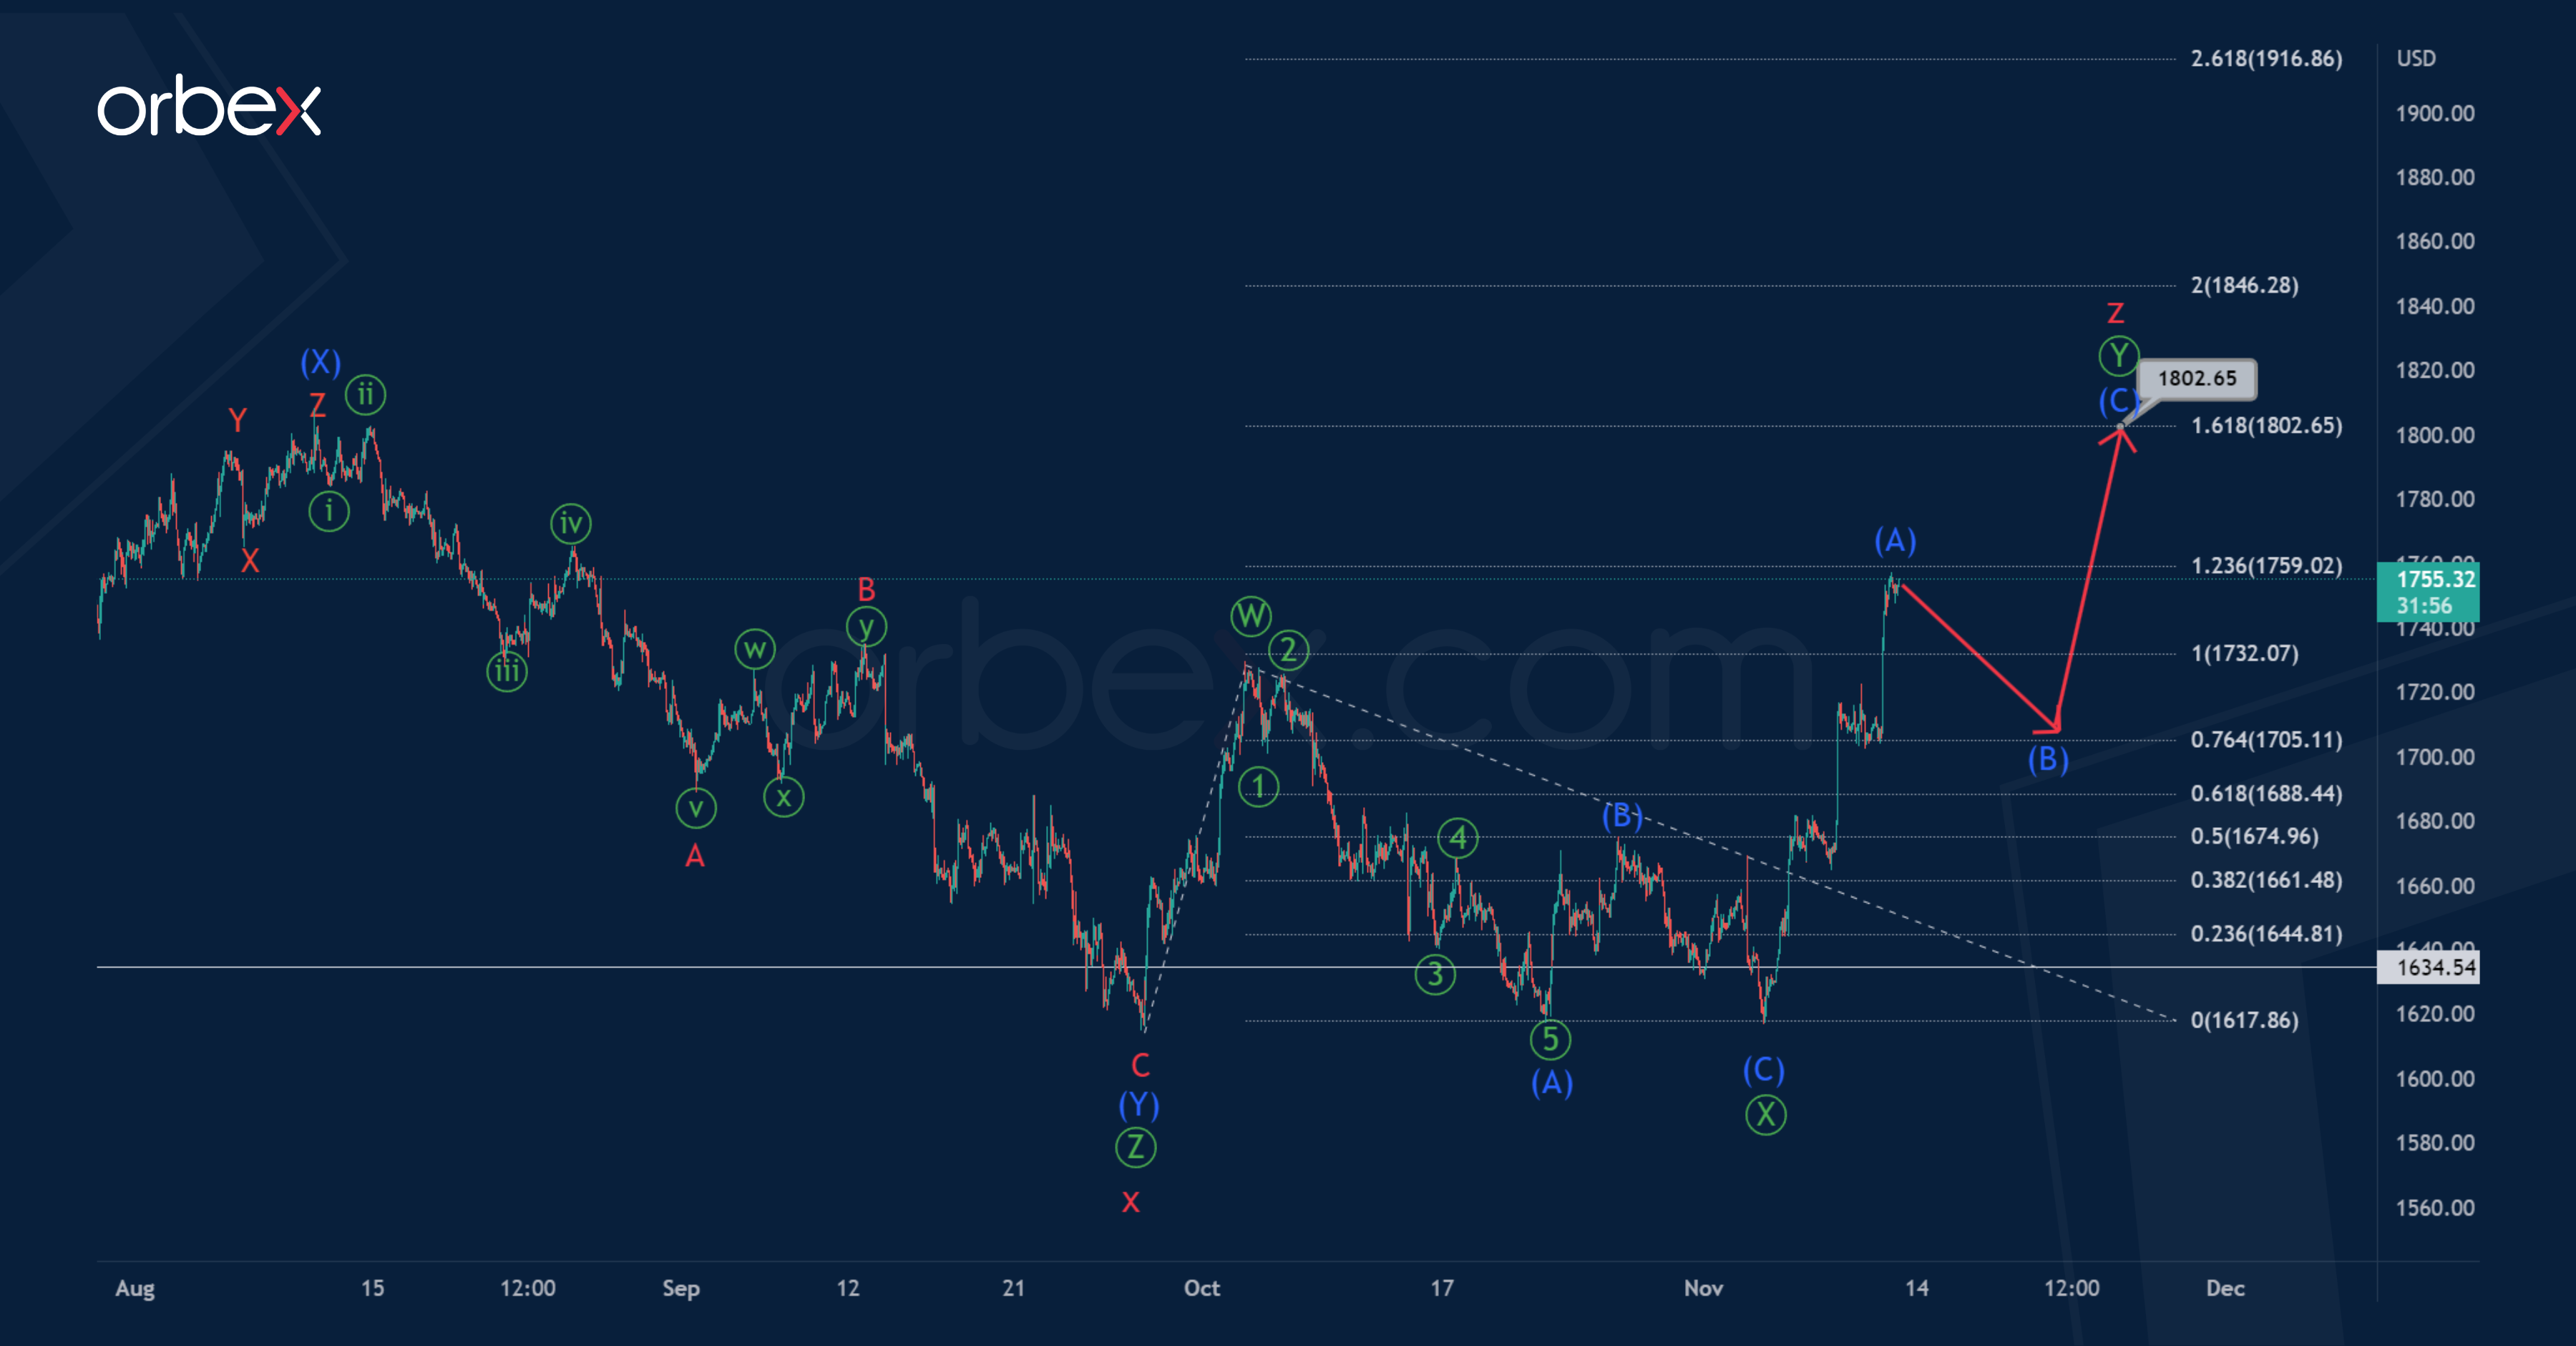
Most likely, as a few weeks ago, a large correction pattern is forming on XAUUSD, taking the form of a cycle triple zigzag.
The 1H timeframe shows the structure of the completed cycle intervening wave x, which looks like a bearish triple zigzag Ⓦ-Ⓧ-Ⓨ-Ⓧ-Ⓩ.
There is a possibility that the cycle wave z takes the form of a primary double zigzag Ⓦ-Ⓧ-Ⓨ, and now the price is in the second actionary wave Ⓨ.
It is assumed that the primary double zigzag may end near 1802.65. At that level, wave Ⓨ will be at 161.8% of wave Ⓦ.
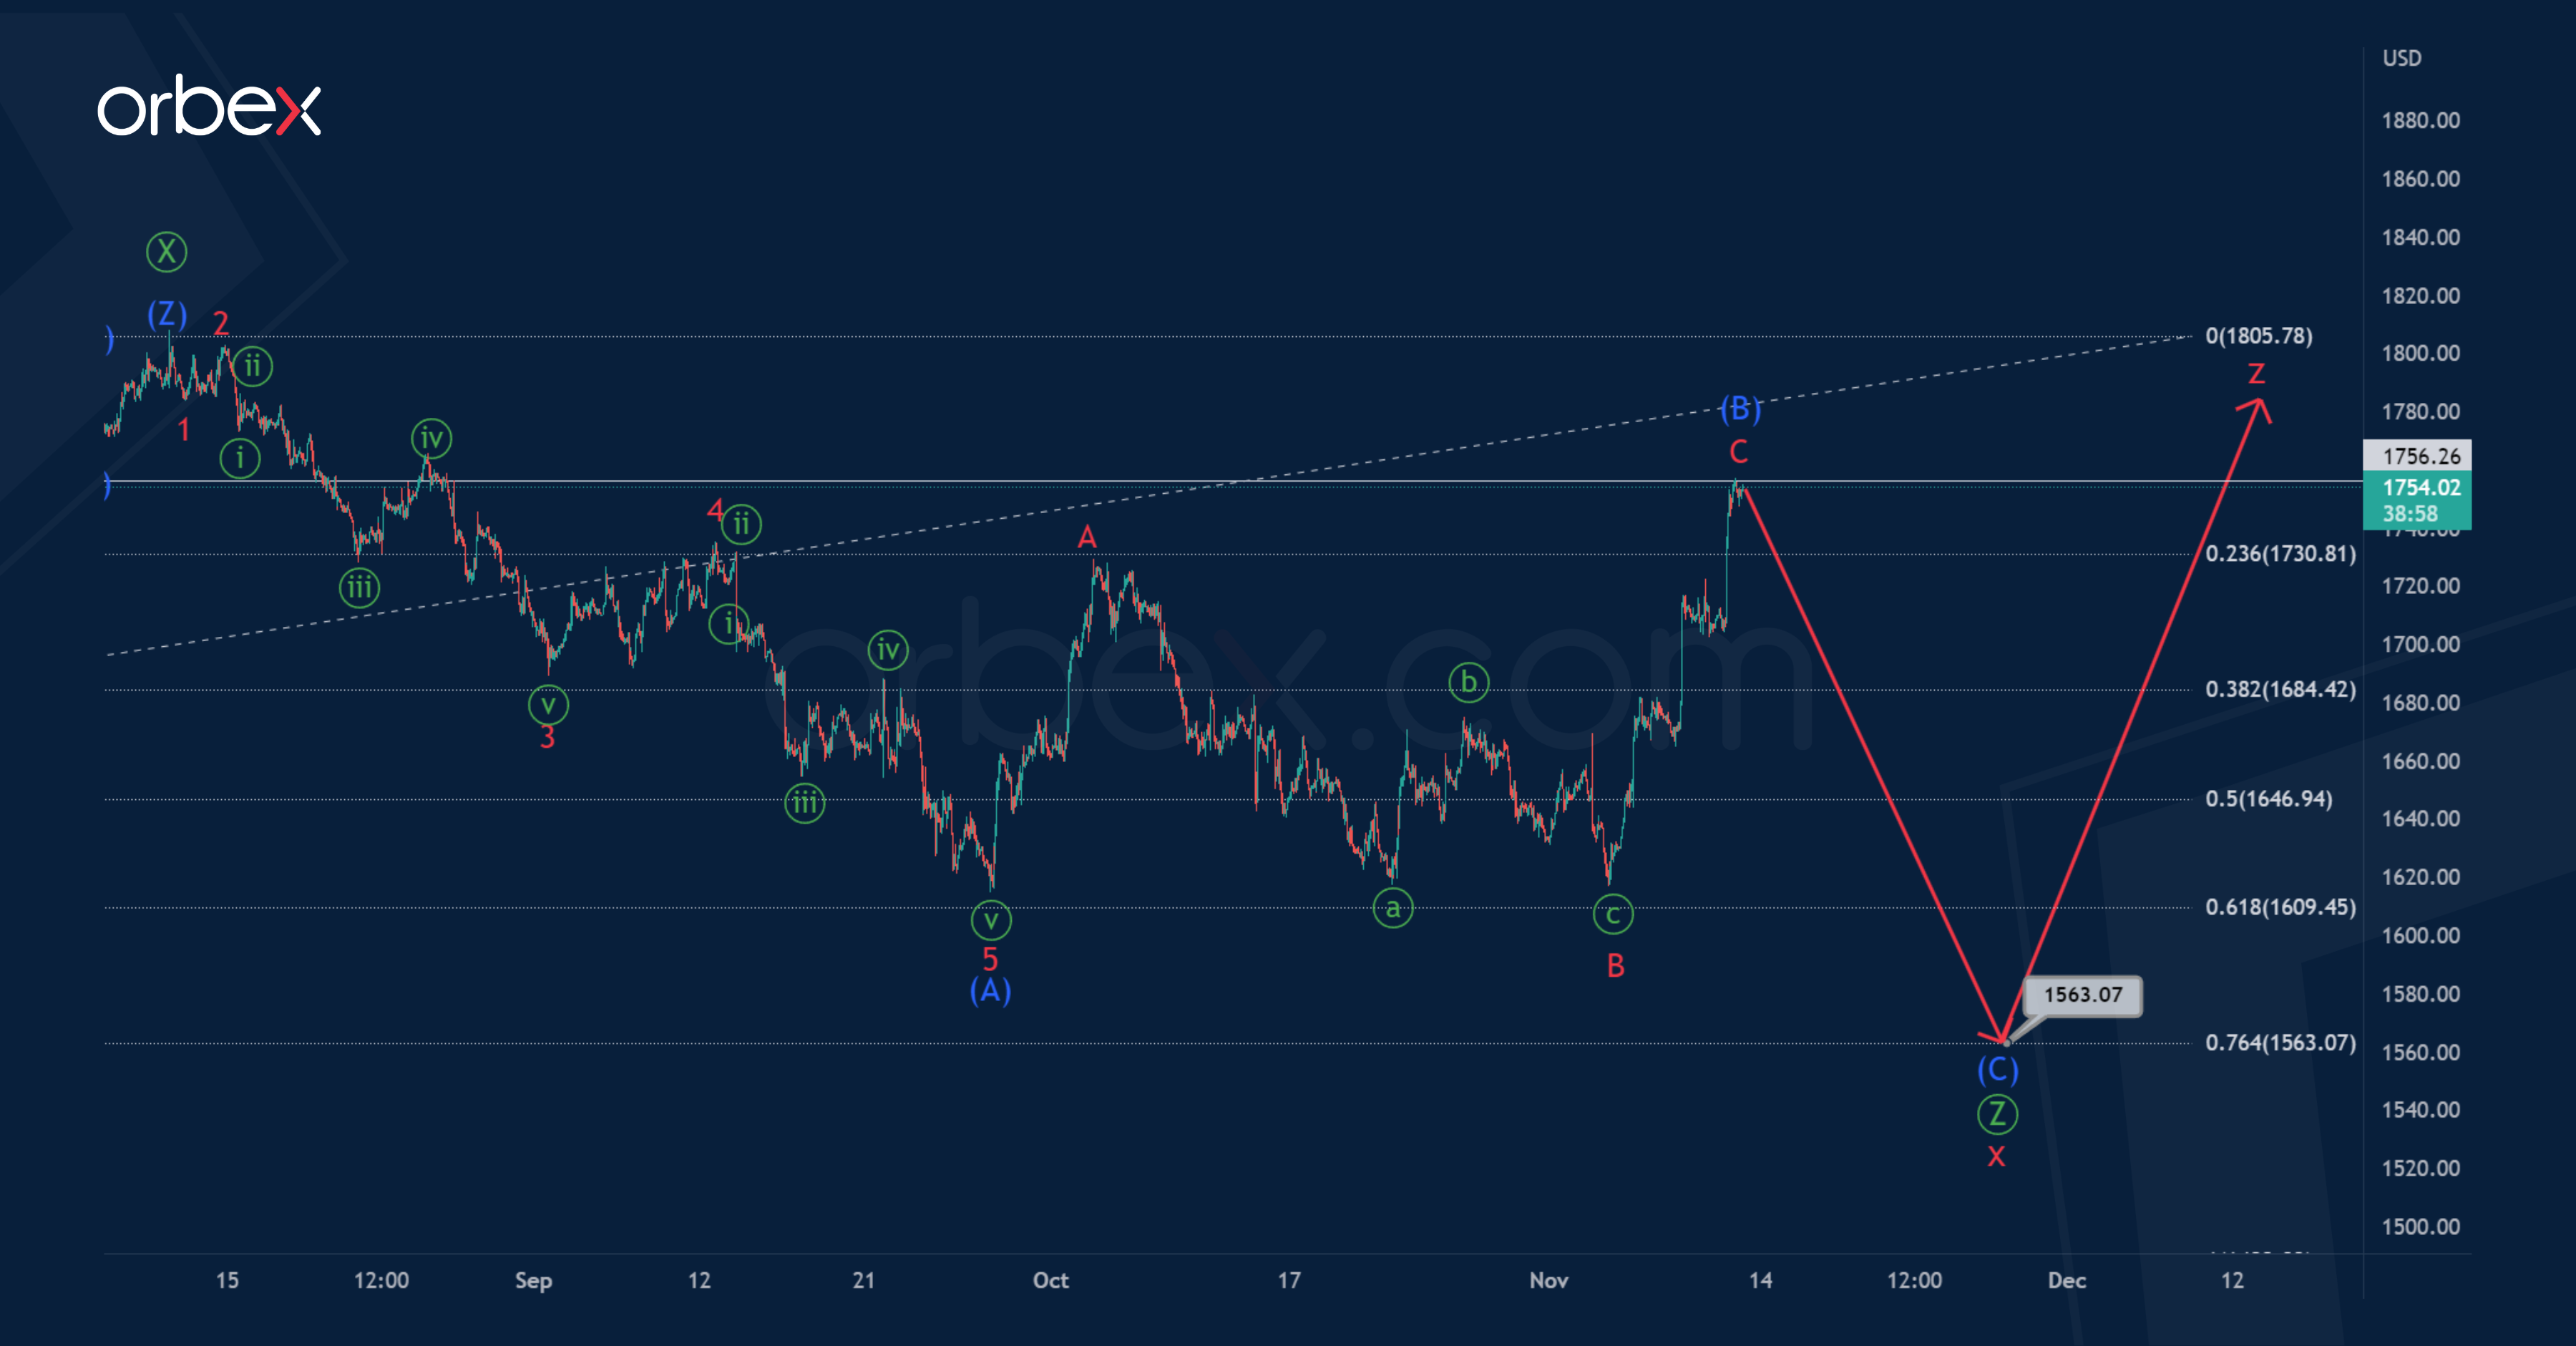
However, there is a possibility where the downward movement of the pair will continue in the cycle wave x. The final primary wave is under development.
Thus, a downward movement of XAUUSD is expected in the near future. The primary wave Ⓩ may take the form of an intermediate zigzag (A)-(B)-(C).
The final of the correction pattern zigzag (A)-(B)-(C) is possible near 1563.07. At that level, primary wave Ⓩ will be at 76.4% of primary wave Ⓨ.
Only after reaching the specified level, the development of the cycle wave z will begin.
USDCAD Confirms Bearish Trend Reversal
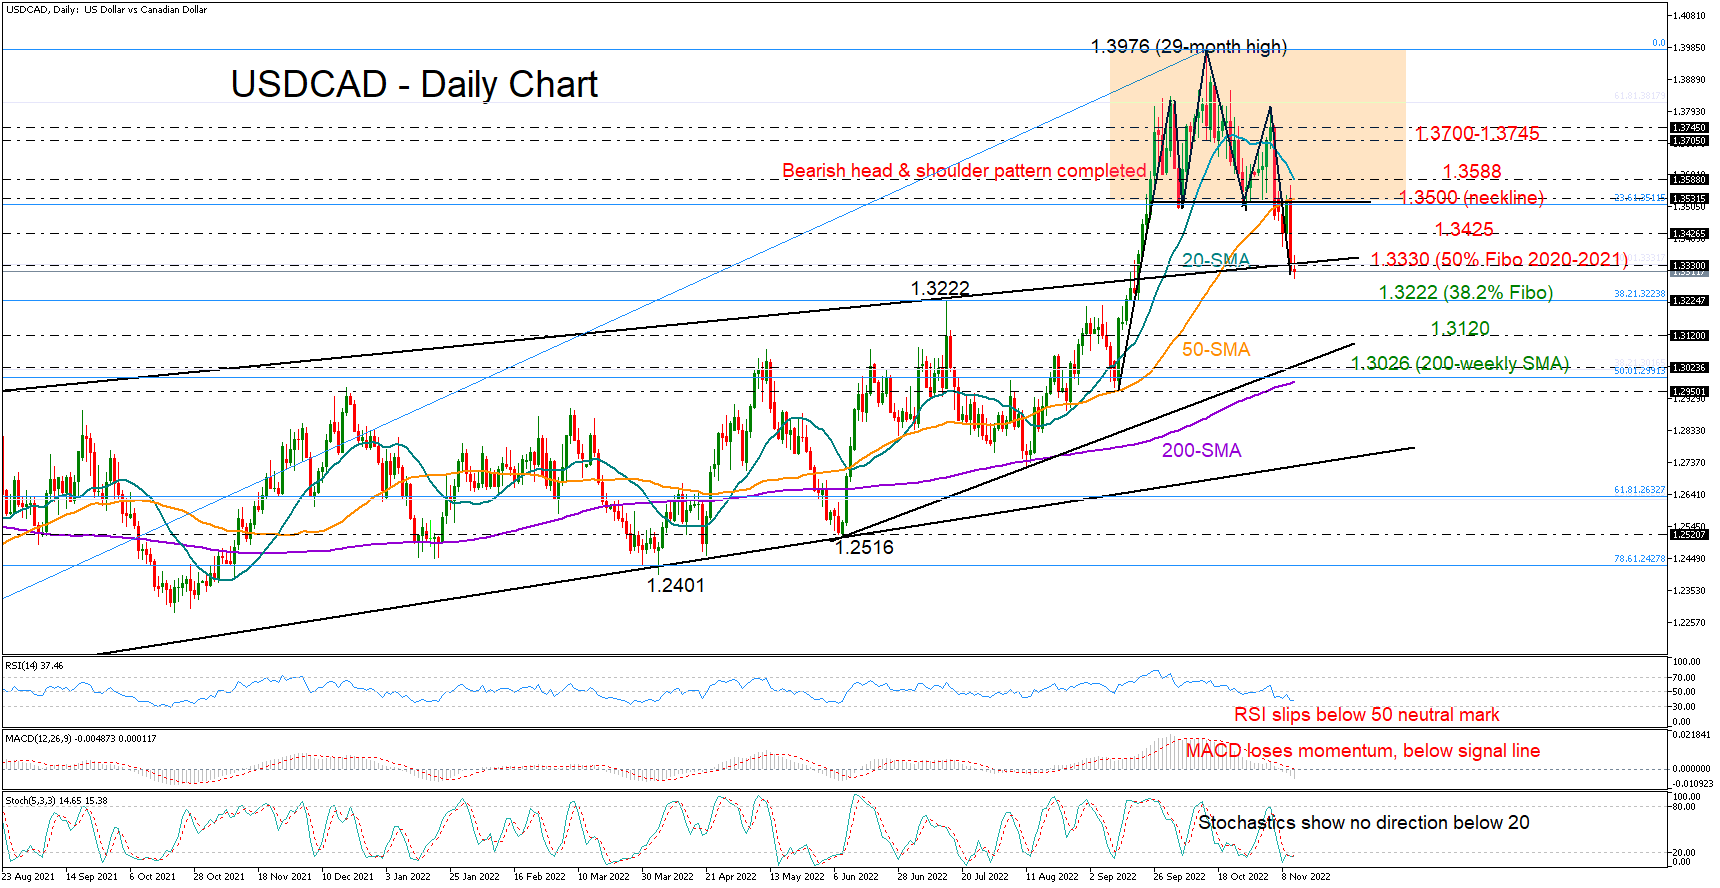
USDCAD completed a bearish head and shoulders structure following the rejection near the 50-day simple moving average (SMA) and the crash below the 1.3500 neckline on Thursday.
The price marked a new two-month low of 1.3291 on Friday, stretching its losses below the crucial long-term resistance line and the 50% Fibonacci retracement of the 2020-2021 steep downtrend at 1.3330.
Despite the freefall, the technical oscillators signal that the sell-off is not over yet. Particularly, with the MACD gaining extra negative momentum within the bearish area and the RSI pointing downwards below its 50 neutral mark, the odds are favouring the bears. Also, the latter has yet to reach its 30 oversold level, while the stochastics, although below 20, show no clear trajectory.
If the bearish scenario unveils, the next stop could be around the 1.3222 level, where July’s and September’s bullish actions peaked. The 38.2% Fibonacci retracement of the 1.2006–1.3976 uptrend is positioned in the same location. Crossing below that base, the price may seek shelter near the 1.3120 barrier before testing the key 1.3026–1.3000 region. The latter may attract extra attention as the tentative support trendline from June, the 50% Fibonacci, and the 200-weekly SMA all align here. Note that the 200-day SMA is also approaching that zone.
In case the dollar rebounds back above 1.3330, it may aggressively drive towards the 1.3500 neckline and the 50-day SMA, unless the 1.3425 support turns resistance. A decisive close above the 20-day SMA at 1.3588 may produce another bullish extension to 1.3700–1.3745.
All in all, USDCAD is in a bearish situation, flagging a downward trend reversal and more losses ahead. Another negative extension and, more importantly, a break below 1.3222 would downgrade the bullish medium-term outlook to neutral.
USDJPY: Consolidation after Strong Fall on Thursday Likely to Precede Further Weakness
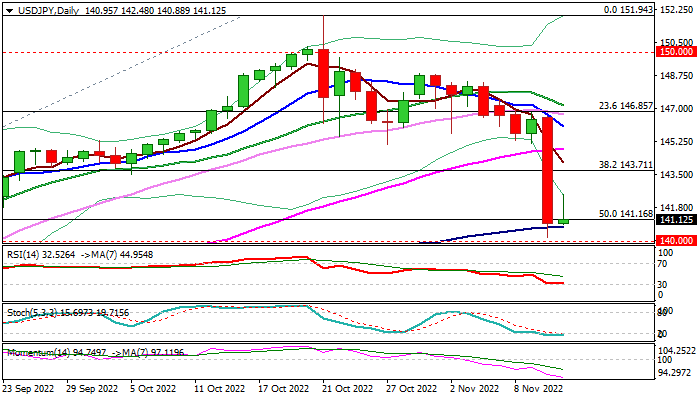
The USDJPY is consolidating in early Friday after suffering heavy losses on Thursday, when the pair was down 550 pips (3.8%) in the biggest one day drop since 1998.
The dollar was hit strongly by cooler than expected US Oct CPI data which suggest that inflation may have peaked, and the Fed could start easing its aggressive policy tightening.
Additional pressure on greenback could be expected from decision of Chinese health authorities to ease some of tough Covid restrictions, which would improve the risk sentiment.
Thursday’s strong bearish acceleration further weakened near-term structure on dip below 50% retracement of 130.39/151.94 upleg and penetration deep into thick daily cloud (spanned between 143.30 and 138.14).
Bears faced headwinds on approach to psychological 140 support and were contained by 100DMA (140.78), with a breather at this zone likely to precede fresh push lower and upticks on a partial profit-taking to provide better levels to re-enter bearish market.
Daily studies in negative configuration (rising bearish momentum / multiple bear-crosses of 5,10,20,30 DMA’s) support the action, as bears look for repeated close below 50% retracement (141.16) to confirm break and open way for attack at psychological 140 support, loss of which would unmask next key levels at 138.62/14 (Fibo 61.8% of 130.39/151.94 / daily cloud base).
Thursday’s massive bearish daily candle weighs heavily, along with large weekly candle (the pair is on track for a weekly drop of around 4%).
Daily cloud top (143.30) should ideally cap the action, with extended upticks to stay under broken daily Tenkan-sen (144.51) to keep bears intact.
Res: 142.48; 143.30; 144.51; 145.31.
Sup: 140.78; 140.00; 138.62; 138.14.
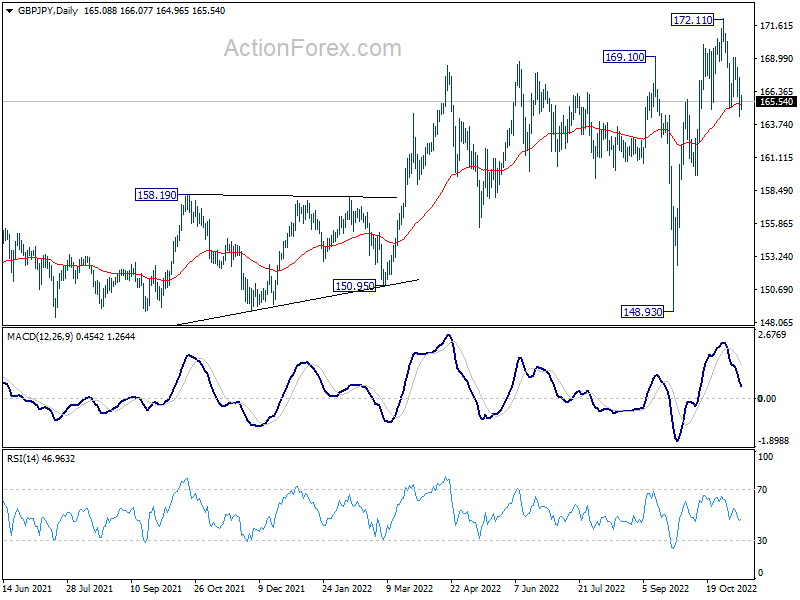
GBP/JPY Daily Outlook
Daily Pivots: (S1) 163.87; (P) 165.66; (R1) 166.94; More...
Intraday bias in GBP/JPY stays neutral first. Strong rebound from 55 day EMA (now at 165.37) will retain near term bullishness. Break of 169.06 minor resistance will bring retest of 172.11 high first. However, sustained break of 55 day EMA will raise the chance of larger scale correction, and target 159.71 support and below.
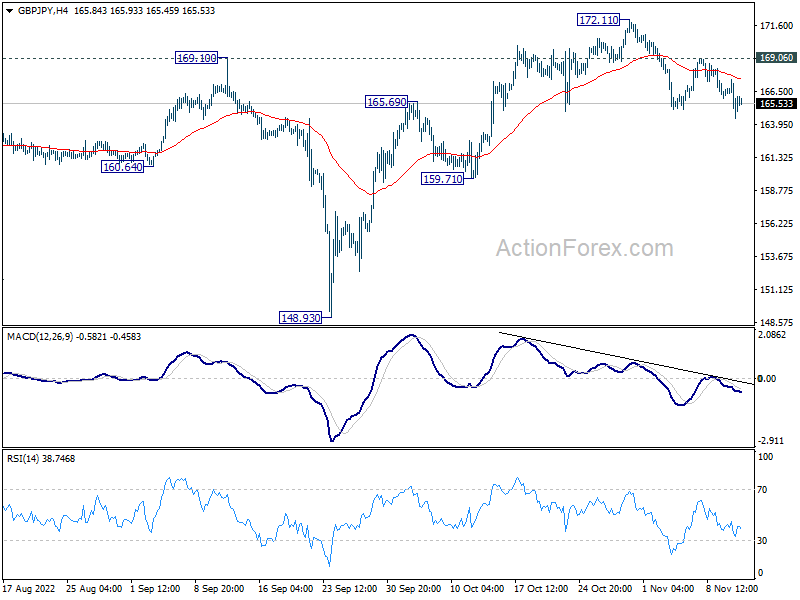
In the bigger picture, up trend from 123.94 (2020 low), as part of the trend from 122.75 (2016 low) is still in progress. Further rise would be seen to 161.8% projection of 122.75 to 156.59 (2018 high) from 123.94 at 178.69. This will now remain the favored case as long as 159.71 support holds.