

Sample Category Title
October Jobs Report Sends Mixed Signals
Market movers today
This week is quiet in terms of data. Hence, focus will be on central bank speeches and on the US mid-term elections on Tuesday.
Today, we get German industrial production data for September. Consensus expects a moderate recovery at 0.2% m/m compared to -0.8% in August. We also have a few ECB speakers on the wires, most notably President Lagarde.
Later in the week, the US vote in the mid-term election on Tuesday. Republicans are favoured to win control of both house and senate, although the Senate race remains a close call. We expect quite a muted market reaction even in case the vote results in a divided Congress.
On Thursday, we will get US CPI for October where we are looking for another high print at 0.7% m/m and 8.0% y/y.
On Friday, we get the Q3 GDP print for UK which we expect to signal that Britain is already in a recession.
The 60 second overview
US Jobs Report: While the headline October NFP beat expectations (261k; Consensus 200k) and September figures were revised higher, markets focused more on the weaker household survey, which signalled a 328k decline in employment. Risk markets rallied, and EUR/USD moved higher back above 0.99. Despite the uptick in unemployment rate (to 3.7%), wage growth accelerated further (0.4% m/m, from 0.3%) and labour force participation declined, suggesting overall labour market conditions remain tight. Fed's Barkin and Evans highlighted later in the evening that even if slowing growth warrants moderating the pace of rate hike in December, the terminal rate level will likely be higher than expected in the September projections. We agree and stick to our call of Fed Funds rate reaching 5.00-5.25% in February.
China: Chinese markets rallied sharply on Friday following some rumours that China might be considering easing the strict Covid-policies. However on Sunday, the National Health Commission stated that: "Previous practices have proved that our prevention and control plans and a series of strategic measures are completely correct", dampening hopes of a rapid change. Overnight, the October trade data highlighted how Chinese economy is being hit by both weak domestic activity and the global slowdown, as both imports and export declined against expectations.
Equities: The equity rally lost its steam last week, but recouped some of its losses on Friday. Fed played both the good and the bad cop last week, with Powell guiding hawkishly (sending equities lower) but Fed speeches striking dovish tones (thereby lifting equities). While equities have done okay in this tug of war (S&P 500 -3% for the week), growth stocks have suffered. Growth underperformed value by 4 percentage points last week globally, which marks the worst 5-day session for growth this year. Equities generally higher on Friday, with S&P 500 closing up 1.4% led by cyclicals including materials, banks and tech stocks rising.
FI: A string of comments on Friday from various Federal Reserve officials suggest that the policy rate is likely to be higher than 5% in 2023 on the back of the solid U.S. labour market report on Friday. This week there will be more Fed speeches as well as the US inflation data released on Thursday.
FX: EUR/USD rallied on Friday, from the 0.97's towards the 0.99's. This seemed to be driven by US payrolls that showed an increase in US unemployment rates and thus implicitly that Fed might be closer to its end goal(s). Equally, speculation that China is ending its zero-Covid policy fuelled CNH, EUR and others.
Credit: Credit spreads as measured by CDS indices were slightly tighter on Friday, with iTraxx Europe tighter by 3bp to 110bp, while Crossover tightened by 16bp to 535bp.
Nordic macro
Sweden: This morning we get the monthly budget numbers from the Swedish National Debt Office. The SNDO forecasts a budget surplus of SEK14bn, which can be decomposed into a negative primary balance (SEK-19bn) that is compensated by large deposit inflows (SEK34bn), primarily related to Svenska Kraftnät capacity fees from the electricity market. Given that the SNDO forecast is just a couple of weeks old we would not expect to see any significant deviation.
ECB Villeroy: Hiking pace more flexible, possibly slower beyond neutral rate
ECB Governing Council member Francois Villeroy de Galhau said in an interview, "as long as underlying inflation has not clearly peaked, we shouldn't stop on rates,"
"It's too early to tell where the end point in interest rates, or the so-called terminal rate, could be," Villeroy said. "That said we are not far from the neutral rate, beyond which our hiking pace could be more flexible and possibly slower."
"We can raise interest rates without provoking significant unemployment," Villeroy said. "To determine the level of growth next year, energy is more important than monetary policy. Our aim is not to provoke a recession but to tame inflation."
EUR/USD Daily Outlook
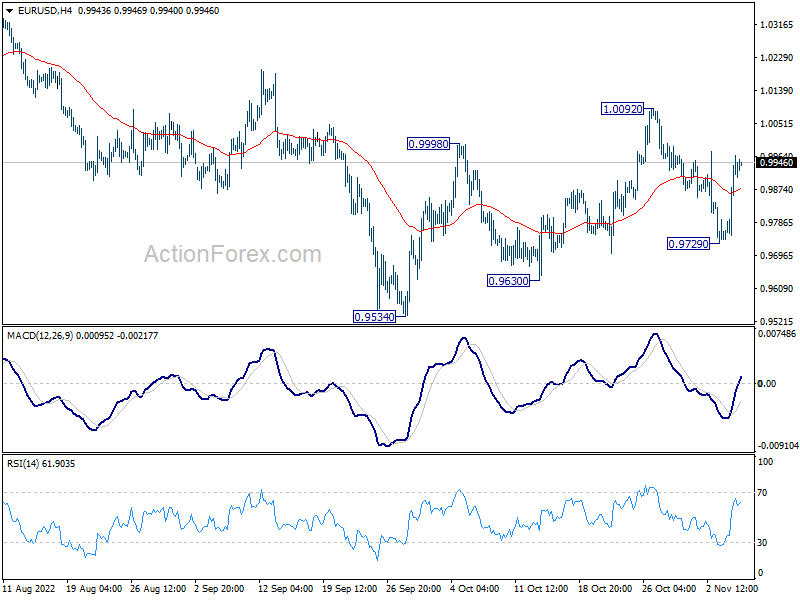
Daily Pivots: (S1) 0.9812; (P) 0.9890; (R1) 1.0036; More...
Intraday bias in EUR/USD remains neutral at this point. On the downside, break of 0.9729 will reaffirm the case the corrective rise from 0.9534 has completed at 1.0092. Deeper fall would then be seen to retest 0.9534 resistance next. However, break of 1.0092 will resume the rebound towards 1.0368 resistance instead.
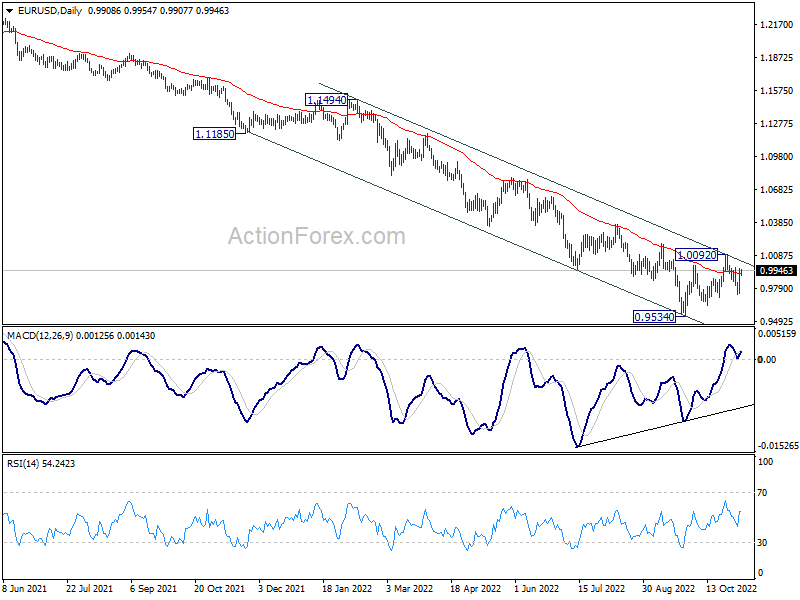
In the bigger picture, medium term outlook stays bearish with trading inside the falling channel. That is larger down trend from 1.2348 (2021 high) is still in progress. Firm break of 0.9534 low will confirm this bearish case. However, break of 1.0092 will add to the case of medium term bottoming, on bullish convergence condition in daily MACD, and bring further rally towards 55 week EMA (now at 1.0583).
USD/CHF Daily Outlook
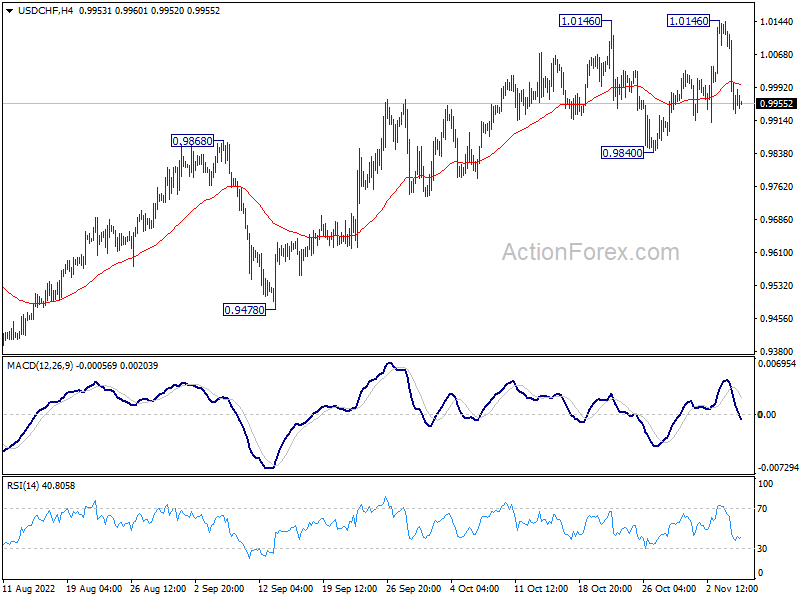
Daily Pivots: (S1) 0.9868; (P) 1.0006; (R1) 1.0081; More...
Intraday bias in USD/CHF remains neutral for the moment. Consolidation from 1.0146 could extend further, but further rally is expected as long as 0.9840 support holds. Break of 1.0146 will resume larger up trend to 1.0283 projection level. However, sustained break of 0.9840 will now complete a double top pattern, and turn bias back to the downside for 0.9478 support instead.
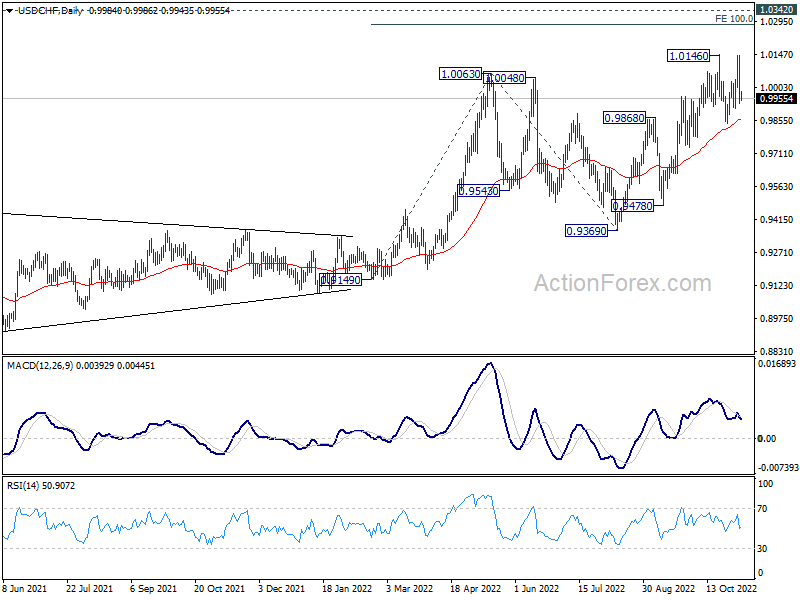
In the bigger picture, up trend from 0.8756 (2021 low) is still in progress. Next target is 100% projection of 0.9149 to 1.0063 from 0.9369 at 1.0283, and then 1.0342 (2016 high). For now, this will remain the favored case as long as 0.9779 support holds, even in case of deep pull back.
GBP/USD Daily Outlook
Daily Pivots: (S1) 1.1223; (P) 1.1302; (R1) 1.1455; More...
Intraday bias in GBP/USD remains neutral for the moment. On the downside, break of 1.1145 temporary low will reaffirm the case that corrective rise from 1.0351 has completed at 1.1644. Deeper fall would then be seen back to 1.0922 support and below. On the upside, break of 1.1644 resistance will resume the rise from 1.0351 instead.
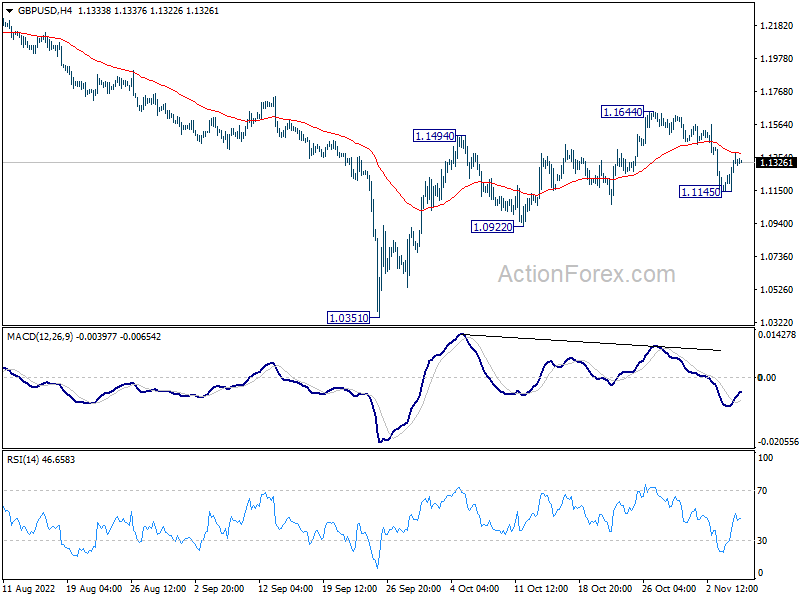
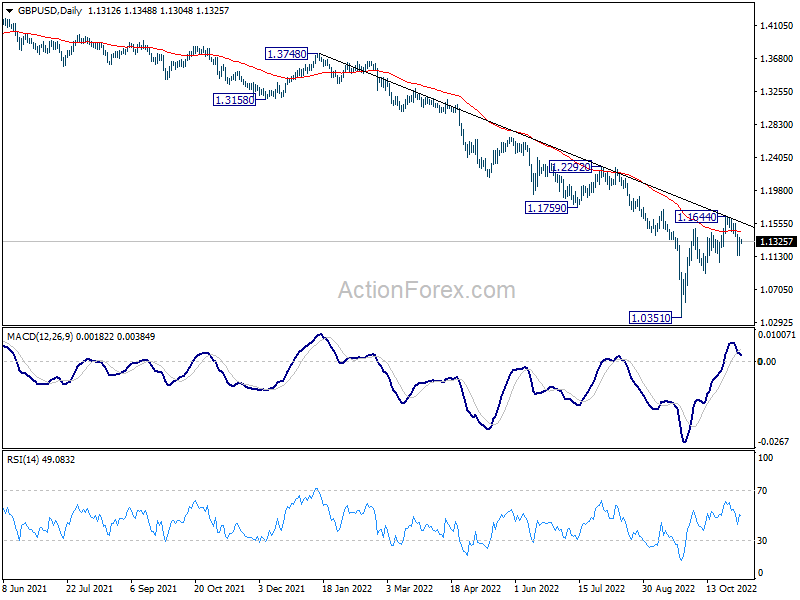
In the bigger picture, fall from 1.4248 (2018 high) is part of the long term down trend from 2.1161 (2007 high). Outlook will stay bearish as long as 1.1759 support turned resistance holds. Parity would be the next target on resumption. Nevertheless, firm break of 1.1759 will confirm medium term bottoming, and open up stronger rise back to 55 week EMA (now at 1.2357).
USD/JPY Daily Outlook
Daily Pivots: (S1) 146.02; (P) 147.21; (R1) 147.86; More...
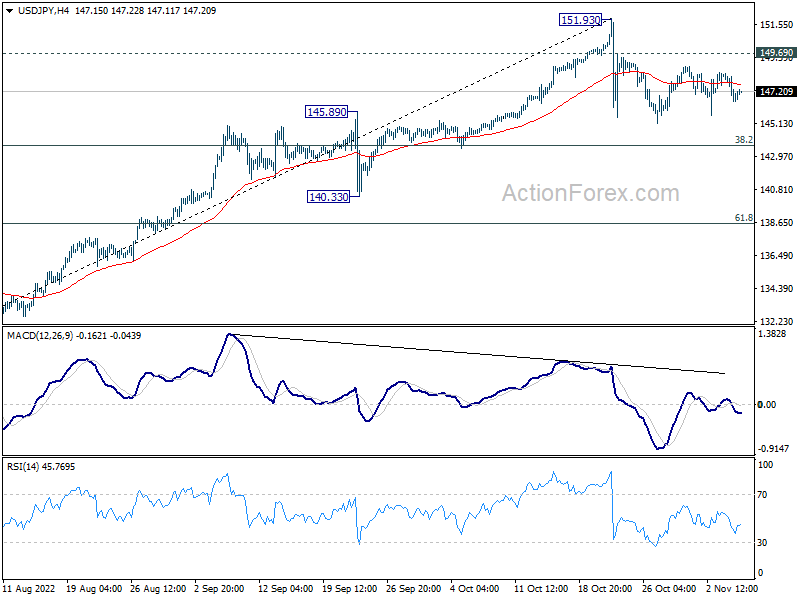
Intraday bias in USD/JPY stays neutral and outlook is unchanged. Consolidation from 151.93 should extend further. In case of deeper fall, downside should be contained by 38.2% retracement of 130.38 to 151.93 at 143.69 to bring rebound. On the upside, above 149.69 minor resistance will bring stronger rebound back towards 151.93 high. But upside should be limited there to continue the corrective pattern.
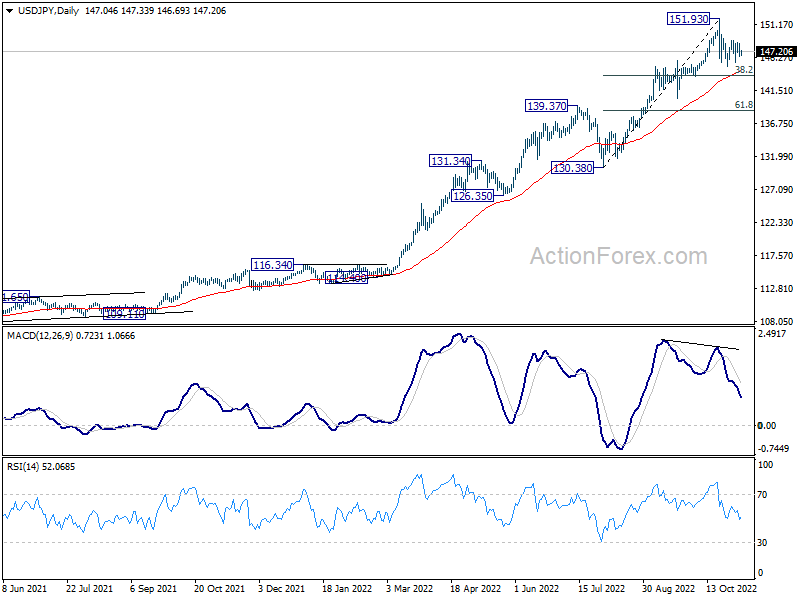
In the bigger picture, up trend from 101.18 is still in progress, as part of the whole up trend from 75.56 (2011 low). 147.68 (1998 high) was already met and there is no clearly sign of topping yet. In any case, break of 140.33 support is needed to be the first sign of medium term topping. Otherwise, further rise is in favor to next target at 160.16 (1990 high).
AUD/USD Daily Report
Daily Pivots: (S1) 0.6341; (P) 0.6412; (R1) 0.6539; More...
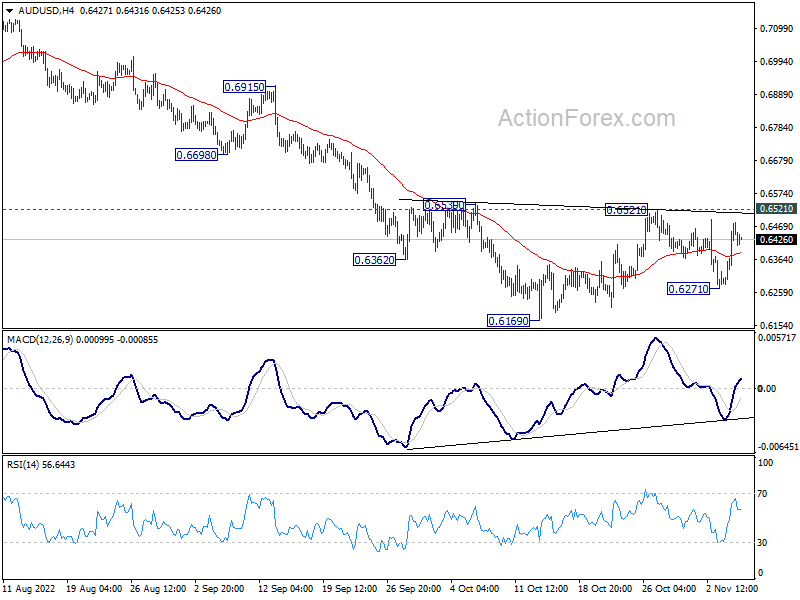
Intraday bias in AUD/USD remains neutral at this point. On the upside, decisive break of 0.6521 resistance will now complete a head and shoulder bottom pattern (ls: 0.6362; h: 0.6169; rs: 0.6271). That would also come with sustained trading above 55 day EMA (now at 0.6529). Further rally should then be seen to 0.6680/7315 resistance zone next. On the downside, however, break of 0.6271 will bring retest of 0.6169 low instead.
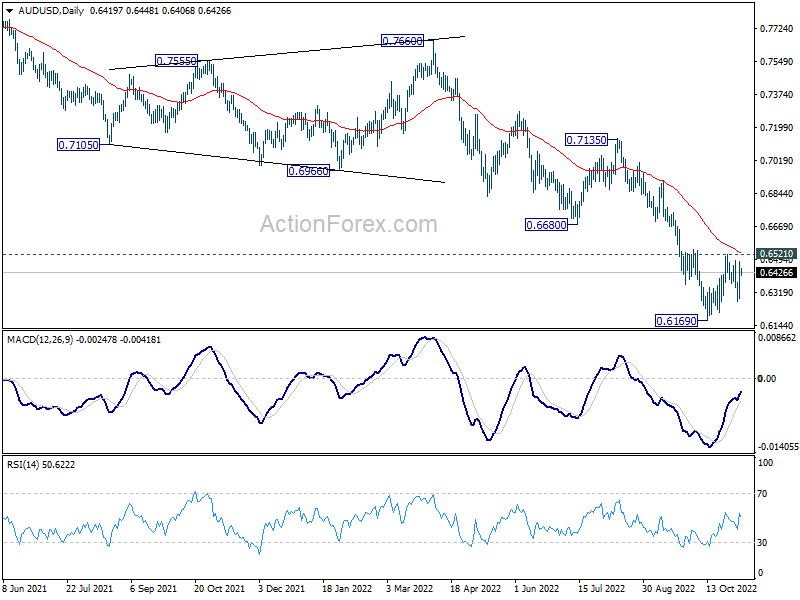
In the bigger picture, down trend from 0.8006 (2021 high) is expected to continue as long as 0.6680 support turned resistance holds. Medium term momentum remains strong and retest of 0.5506 (2020 low) cannot be ruled out. But firm break of 0.6680 will be the first sign of reversal, and bring stronger rebound back to 0.7135 resistance.
Technical Outlook and Review
USD/JPY:
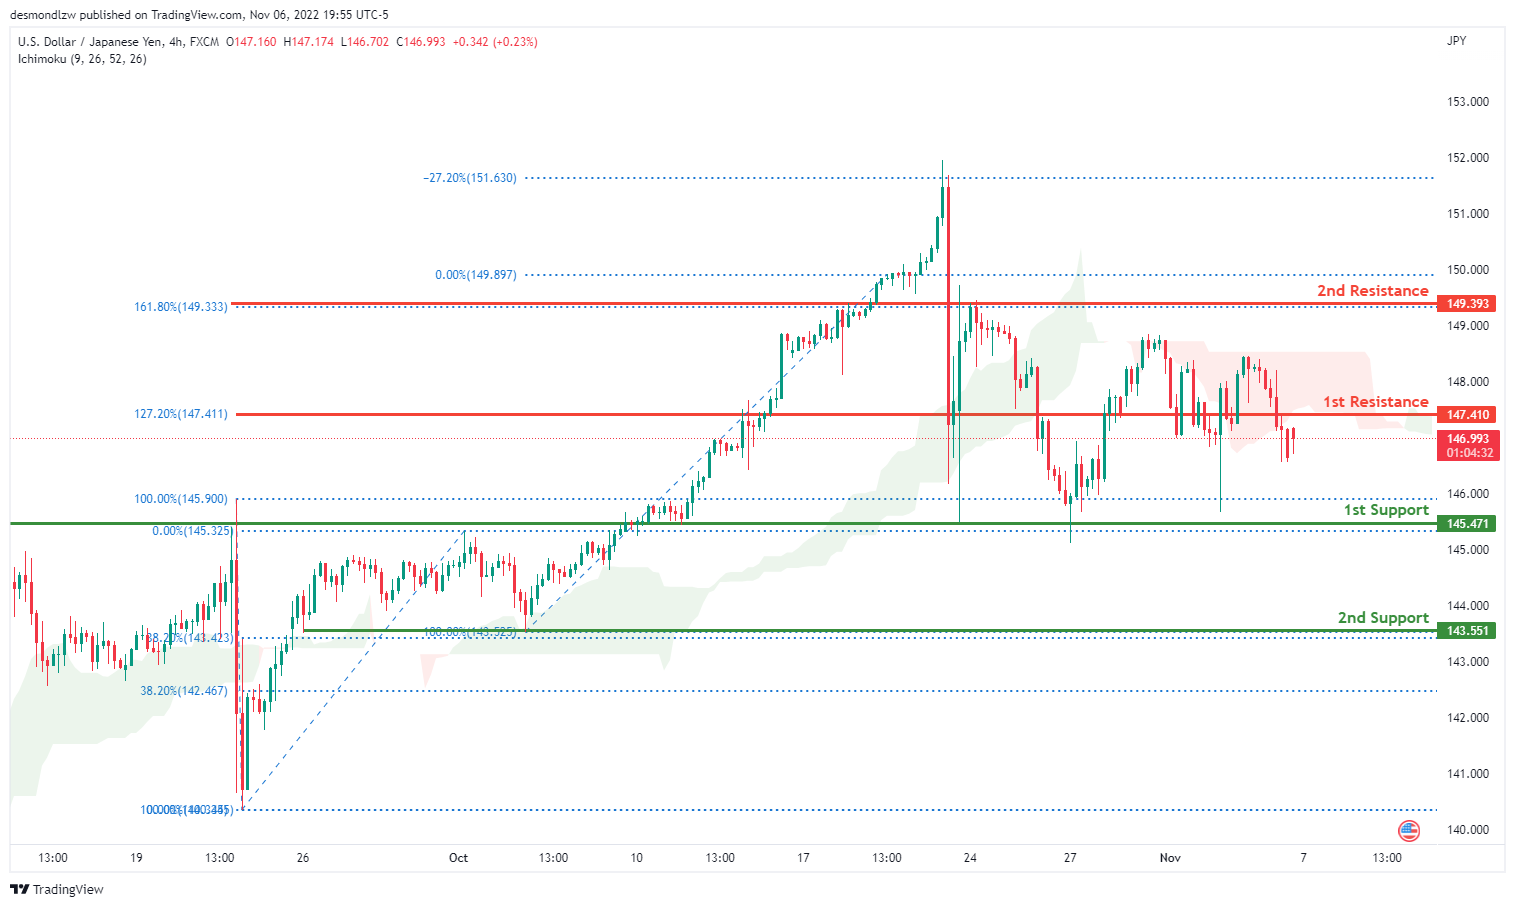
The current general bias for USDJPY on the H4 chart is bearish. To add confluence to this, the price is below the Ichimoku cloud which indicates a bearish market. Towards the end of last week, USDJPY experienced some bearish momentum due to the NFP data release with the price closing above the 1st resistance line at 147.410 where the 127.2% Fibonacci extension line is located. Price is currently trading at 147.005 at time of writing. If the bearish momentum continues, expect USDJPY to possibly head towards the 1st support line at 145.471, where the 100% and 0% Fibonacci lines are located. In an alternative scenario, price could break above the 1st resistance and head towards the 2nd resistance at 149.393 where the 161.8% and 0% Fibonacci lines are located.
Areas of consideration:
- H4 time frame, 1st resistance at 147.410
- H4 time frame, 1st resistance at 149.393
- H4 time frame, 1st support at 145.471
DXY:
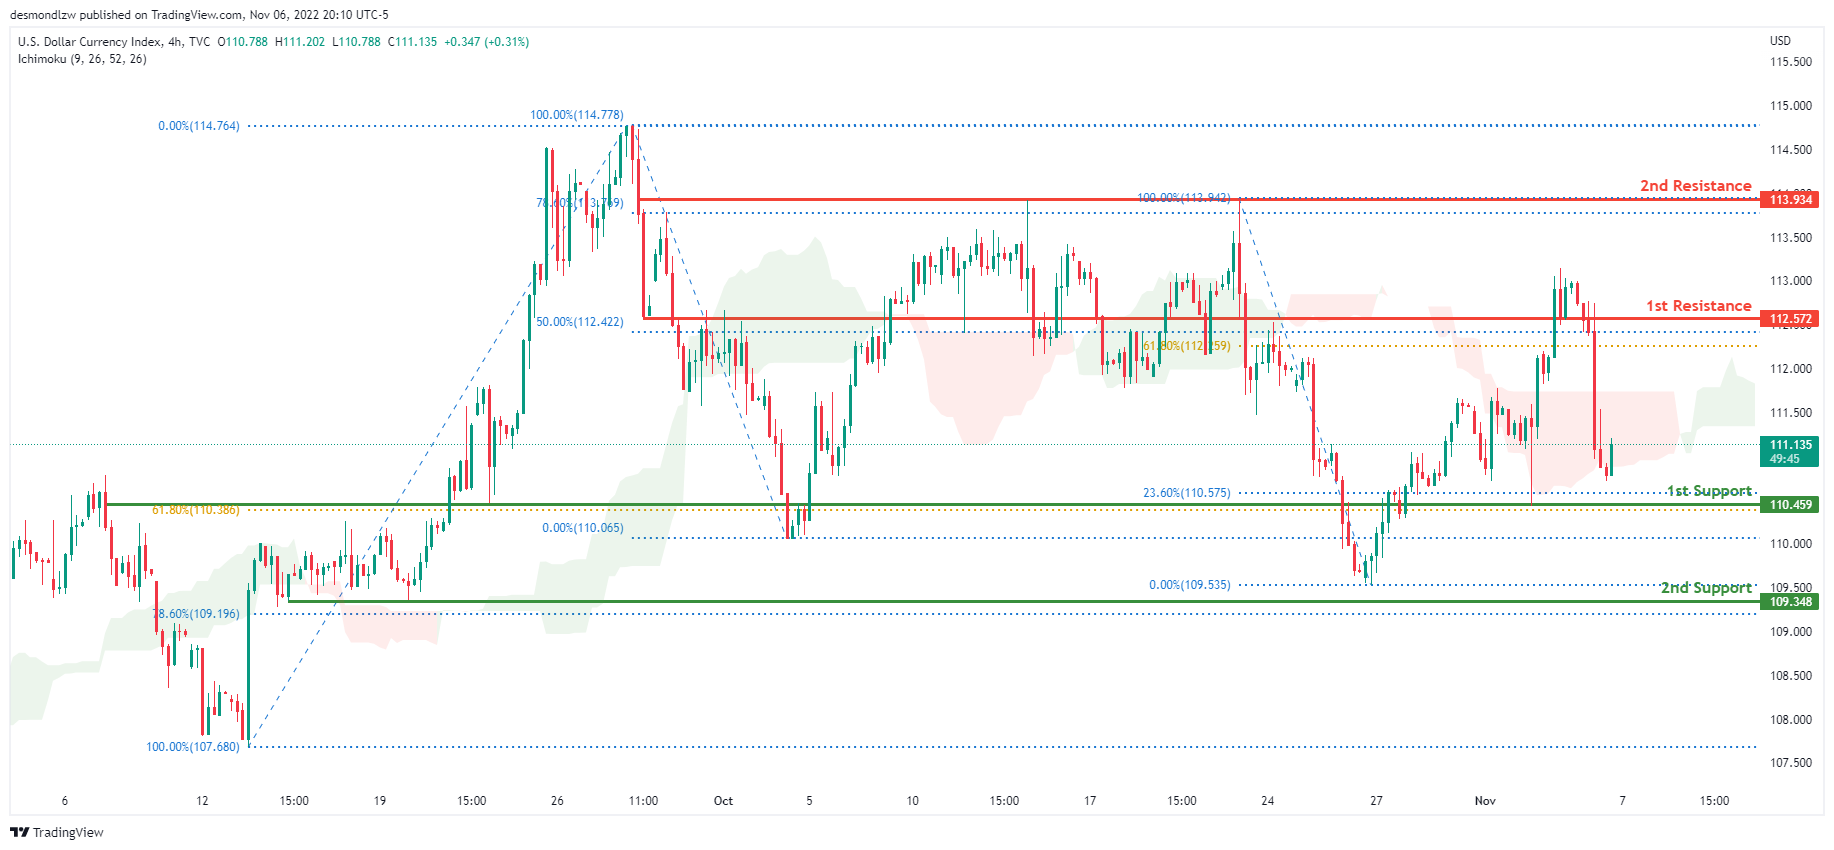
On the H4 chart, the overall bias for DXY is bearish. To add confluence to this, the price is crossing below the Ichimoku cloud which indicates a bearish market. Towards the end of last week, price had huge bearish momentum due to the release of the NFP data. The price is currently trading at 111.140 at the time of writing. If this bearish momentum continues, price could head towards the 1st support line at 110.459 where the 61.8% and 23.6% Fibonacci lines are located. In an alternative scenario, price could head back up towards the 1st resistance line at 112.572 where the 50% and 61.8% Fibonacci lines are located.
Areas of consideration:
- H4 time frame, 1st resistance at 112.572
- H4 time frame, 1st support at 110.459
EUR/USD:
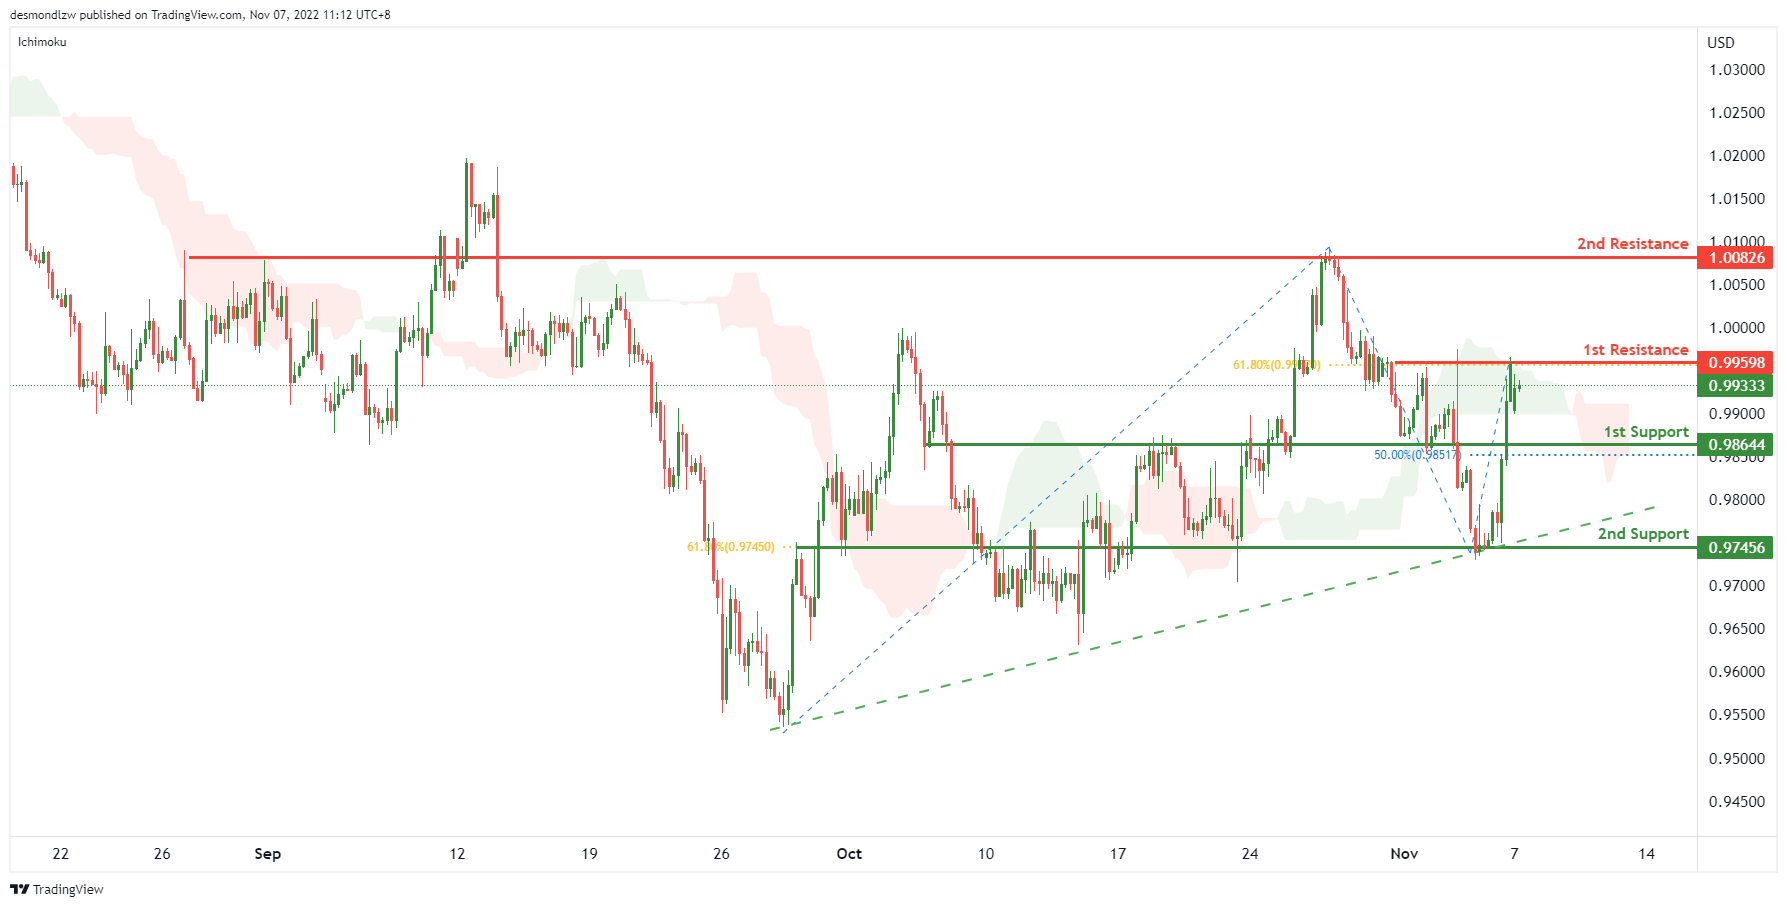
On the H4, with the price moving above the ascending trendline and above ichimoku cloud, we have a bullish bias that the price may break the 1st resistance at 0.99598, which is in line with the 61.8% fibonacci retracement and rise to the 2nd resistance at 1.00826, where the previous swing highs are. Alternatively, the price may drop to the 1st support at 0.98644, which is in line with the 50% fibonacci retracement and overlap support. If the 1st support is broken, the 2nd support is at 0.97456, which is in line with the swing low and 61.8% fibonacci
Areas of consideration :
- H4 1st support at 0.97456
- H4 2nd support is 0.96484,
GBP/USD:
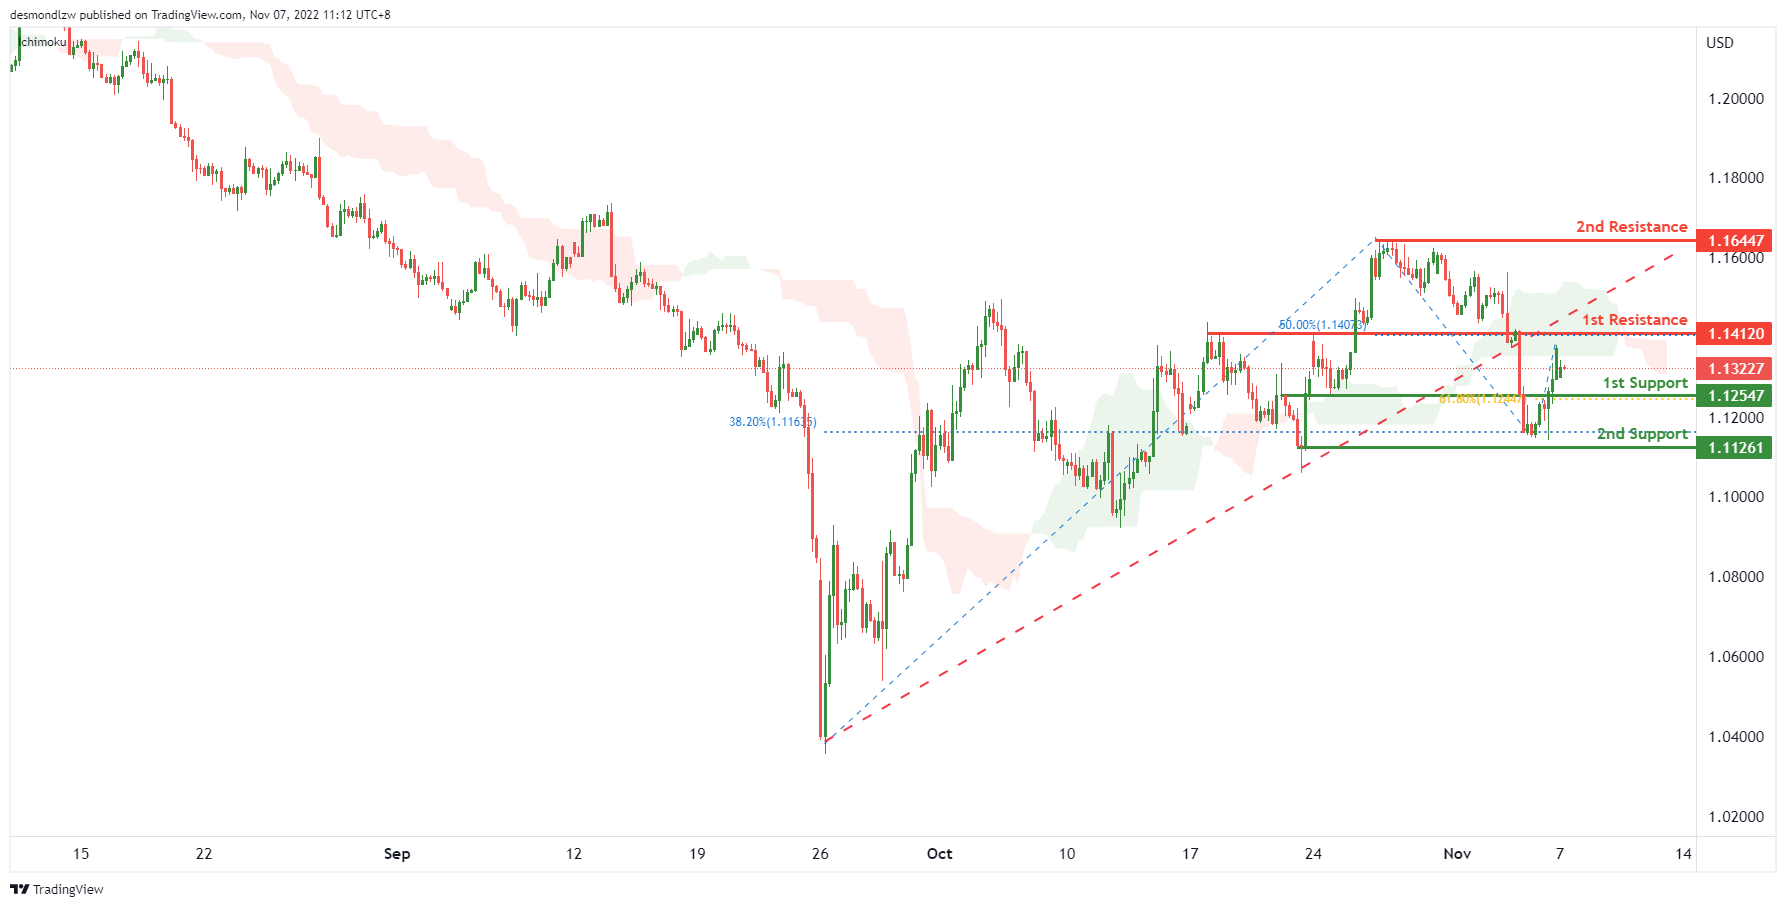
On the H4, price is below the ichimoku cloud and breaking the ascending trendline, we have a bearish bias that the price may rise to test the 1st resistance at 1.14120, which is in line with the 50% fibonacci retracement and overlap resistance and drop to the 1st support at 1.12547, which is in line with the 61.8% fibonacci retracement. If the 1st support is broken, the 2nd support is at 1.11261, where the swing low is. Alternatively, the price may break the 1st resistance and rise to the 2nd resistance at 1.16447, which is in line with the swing high.
Areas of consideration:
- H4 1st resistance at 1.14120
- H4 1st support at 1.12547
USD/CHF:
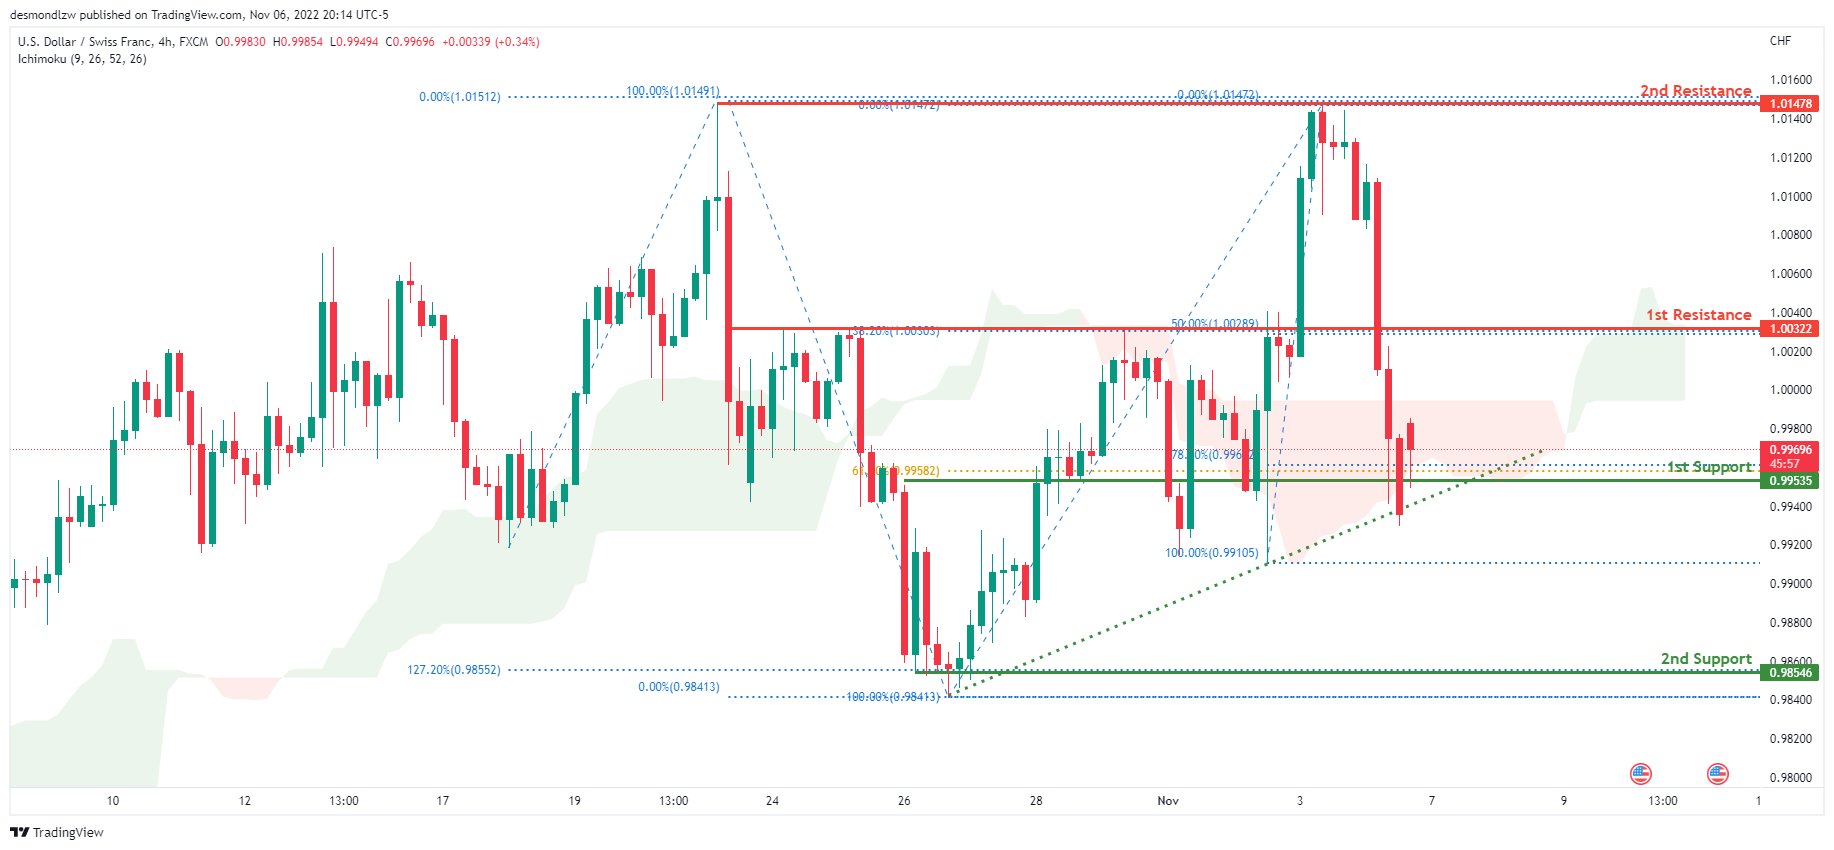
On the H4 chart, the overall bias for USDCHF is bearish. To add confluence to this, the price is below the Ichimoku cloud which indicates a bearish market. Towards the end of last week, price had huge bearish momentum downwards due to the release of the NFP data. The price is currently trading at 0.99716 at the time of writing. If this bearish momentum continues, expect price to break the 1st support line at 0.99535 where the 61.8% and 78.6% Fibonacci lines are located and head towards the 2nd support line at 0.98546, where the 127.2% Fibonacci extension line, 100% Fibonacci line and previous swing low are located. In an alternative scenario, price could head back up towards the 1st resistance line at 1.00322, where the 382% and 50% Fibonacci lines are located.
Areas of consideration
- H4 1st support at 0.99535
- H4 2nd support at 0.98546
- H4 1st resistance at 1.00322
XAU/USD (GOLD):
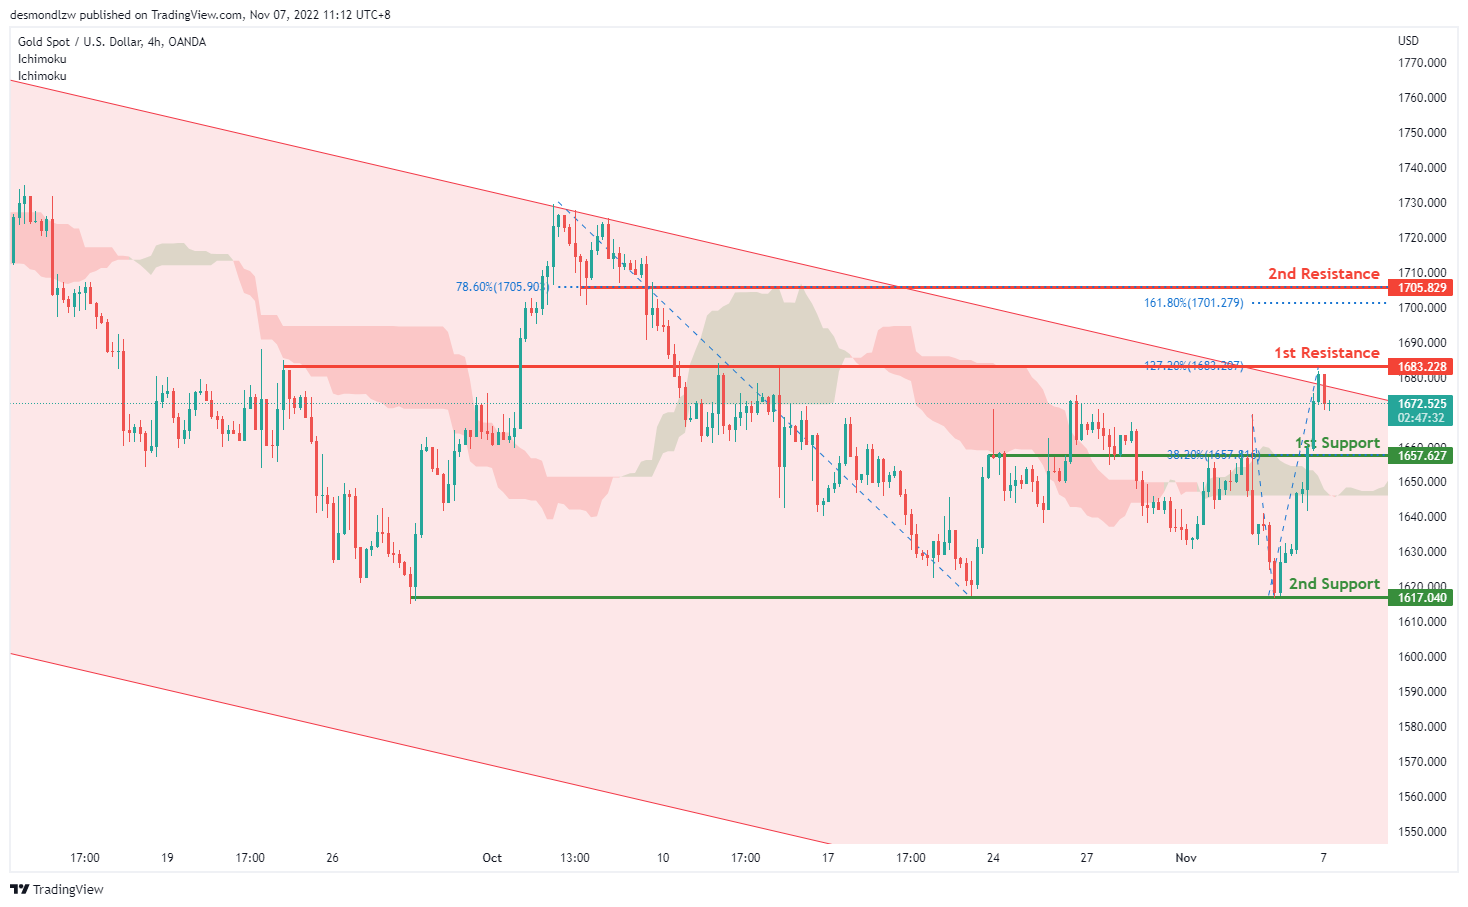
On H4, with the price breaking the descending channel and reversing from the 1st resistance, we can expect the price to drop to the 1st support at 1657.627, which is in line with the overlap support and 38.2% fibonacci retracement. If the 1st support is broken, we can expect the price drop to the 2nd support at 1617.040, where the previous swing lows are. Alternatively, the price may rise to retest the 1st resistance at 1683.228, which is in line with the previous swing high and 127.2% fibonacci extension. If the 1st resistance is broken, we can expect the bullish momentum to carry the price to the 2nd resistance at 1705.829, where the 78.6% fibonacci retracement and 161.8% fibonacci extension sit.
Areas of consideration:
- H4 time frame, 1st resistance at 1683.228
- H4 time frame, 1st support at 1657.627
AUD/USD:
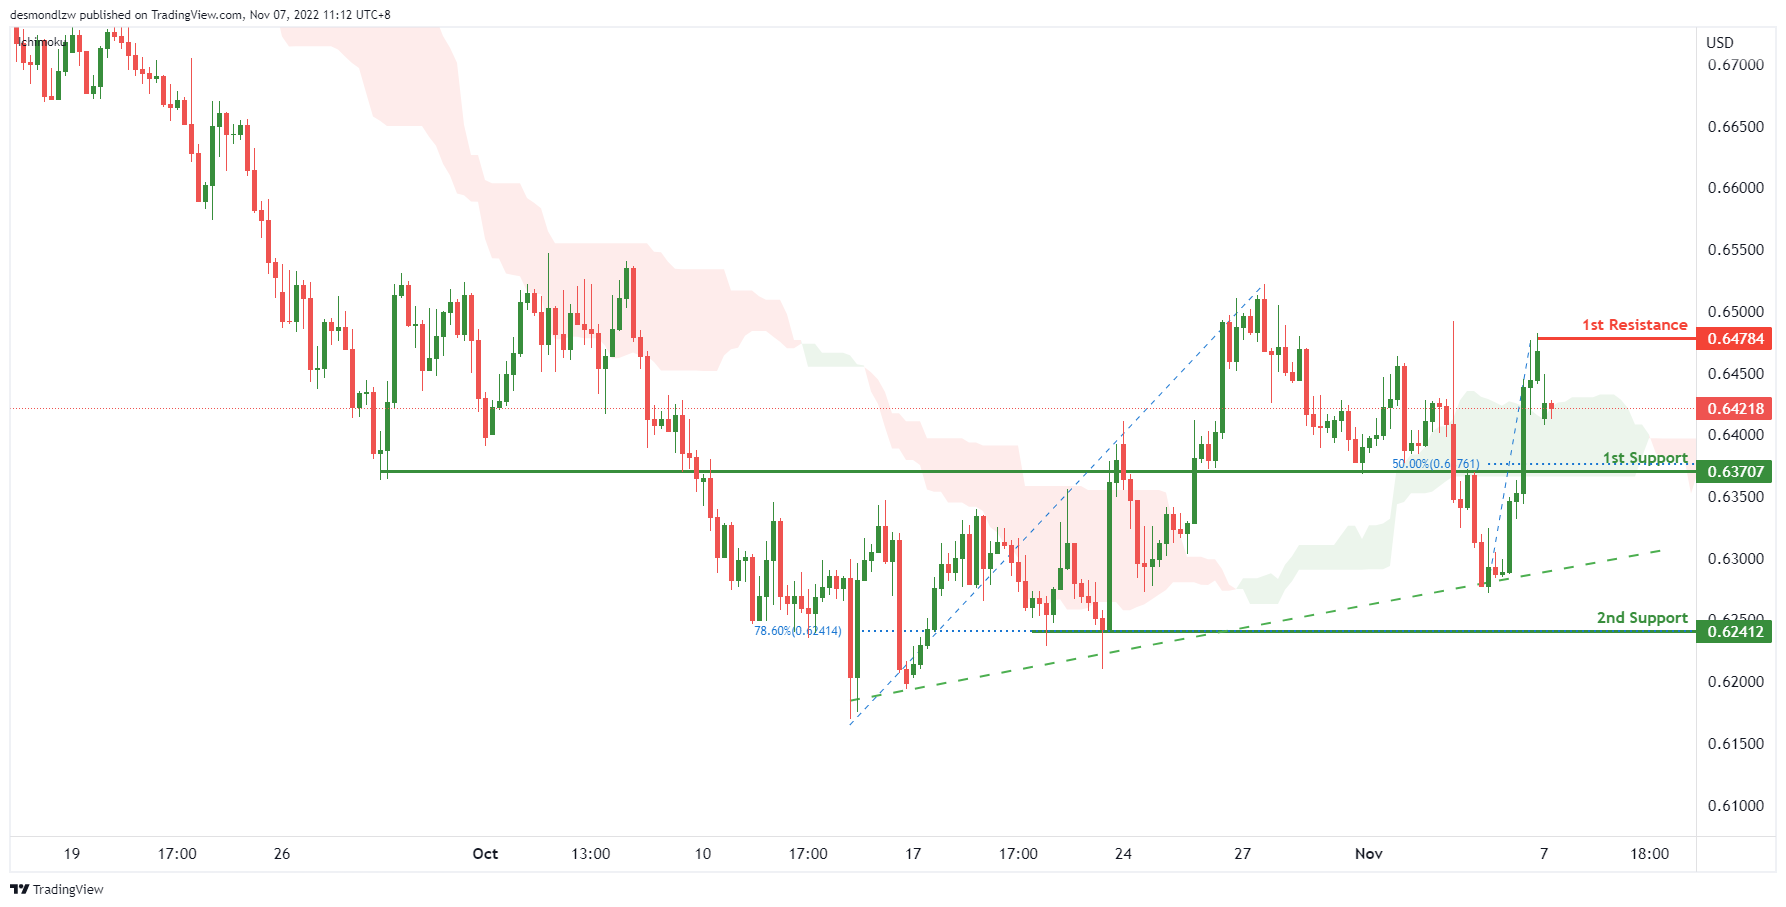
On the H4, with the price crossing the ichimoku cloud and moving above the ascending trendline, we can expect the price to rise to the 1st resistance at 0.64784, which is in line with the swing high. After testing the swing high, the price may reverse and drop to the 1st support at 0.63707, which is in line with the 50% fibonacci retracement and overlap support. If the 1st support is broken, the 2nd support is at 0.62412, where the 778.6% fibonacci retracement is.
Areas of consideration
- H4, 1st resistance at 0.64784
- H4, 1st support at 0.63707
NZD/USD:
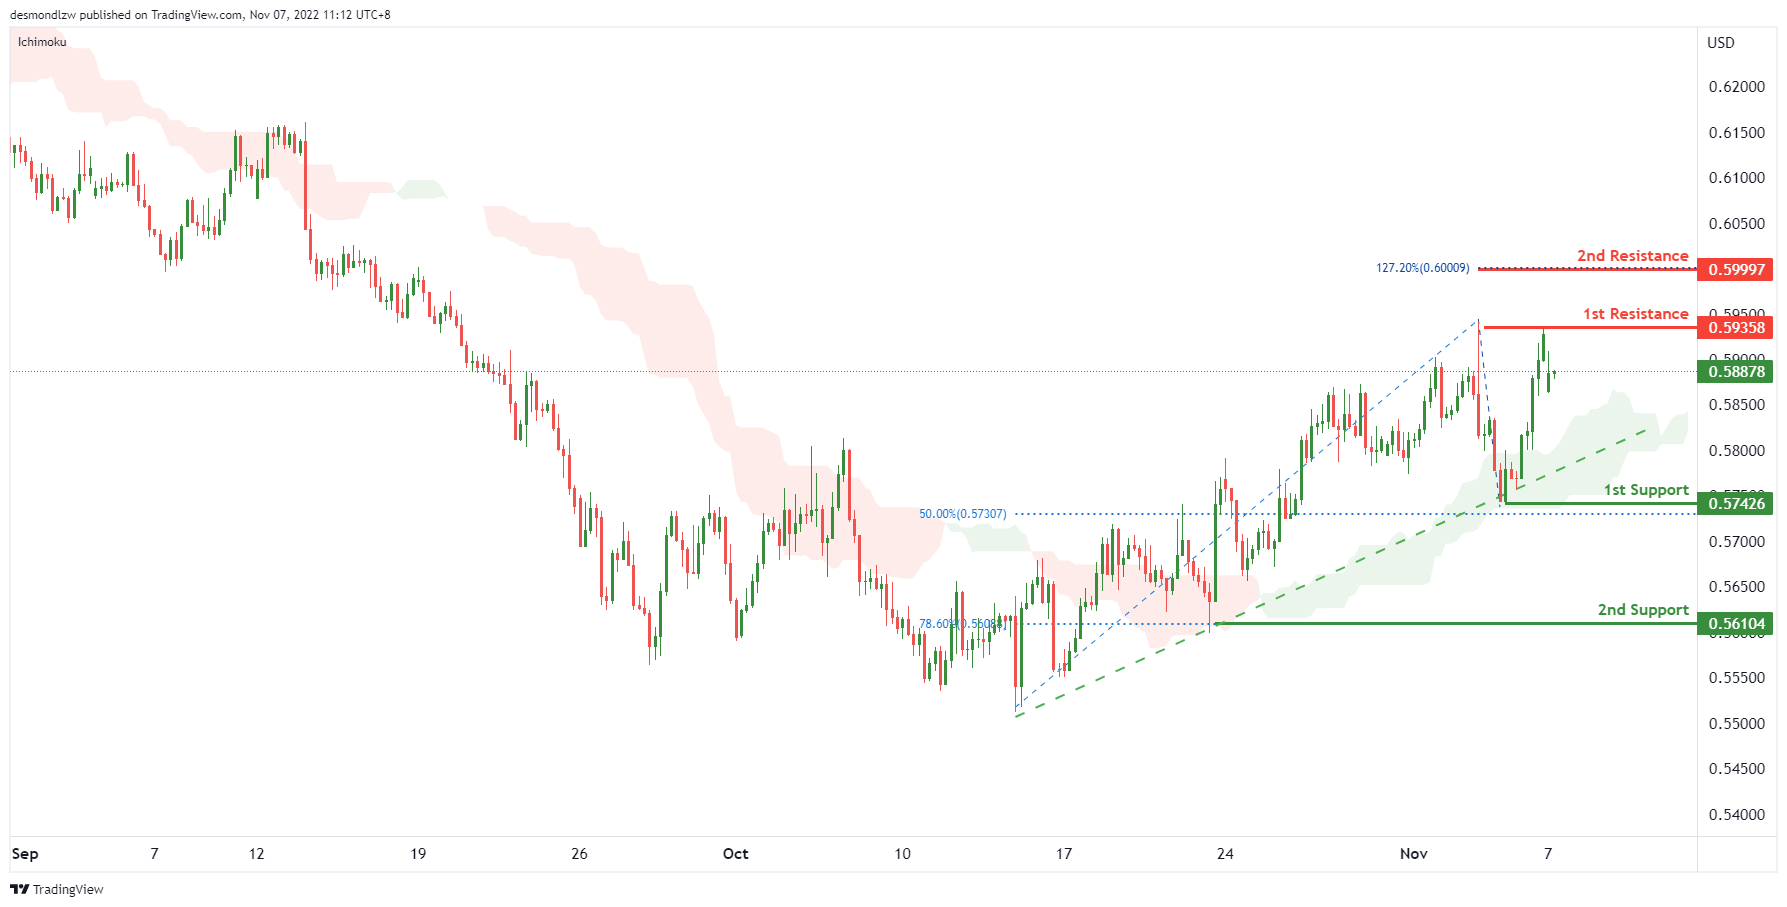
On the H4 chart, as the price is moving above ichimoku cloud and ascending trendline, the price may rise to the 1st resistance at 0.59358, which is in line with the swing highs. If the 1st resistance is broken, the 2nd resistance is at 0.59997, which is in line with the 127.2% fibonacci extension. Alternatively, the price may drop to the 1st support at 0.57426, which is in line with the swing low and 50% fibonacci retracement. If the 1st support is broken, the 2nd support is at 0.56014, which is in line with the 78.6% fibonacci retracement.
Areas of consideration:
- H4 time frame, 1st resistance at 0.59358
- H4 time frame, 2nd resistance at 0.59997
USD/CAD:
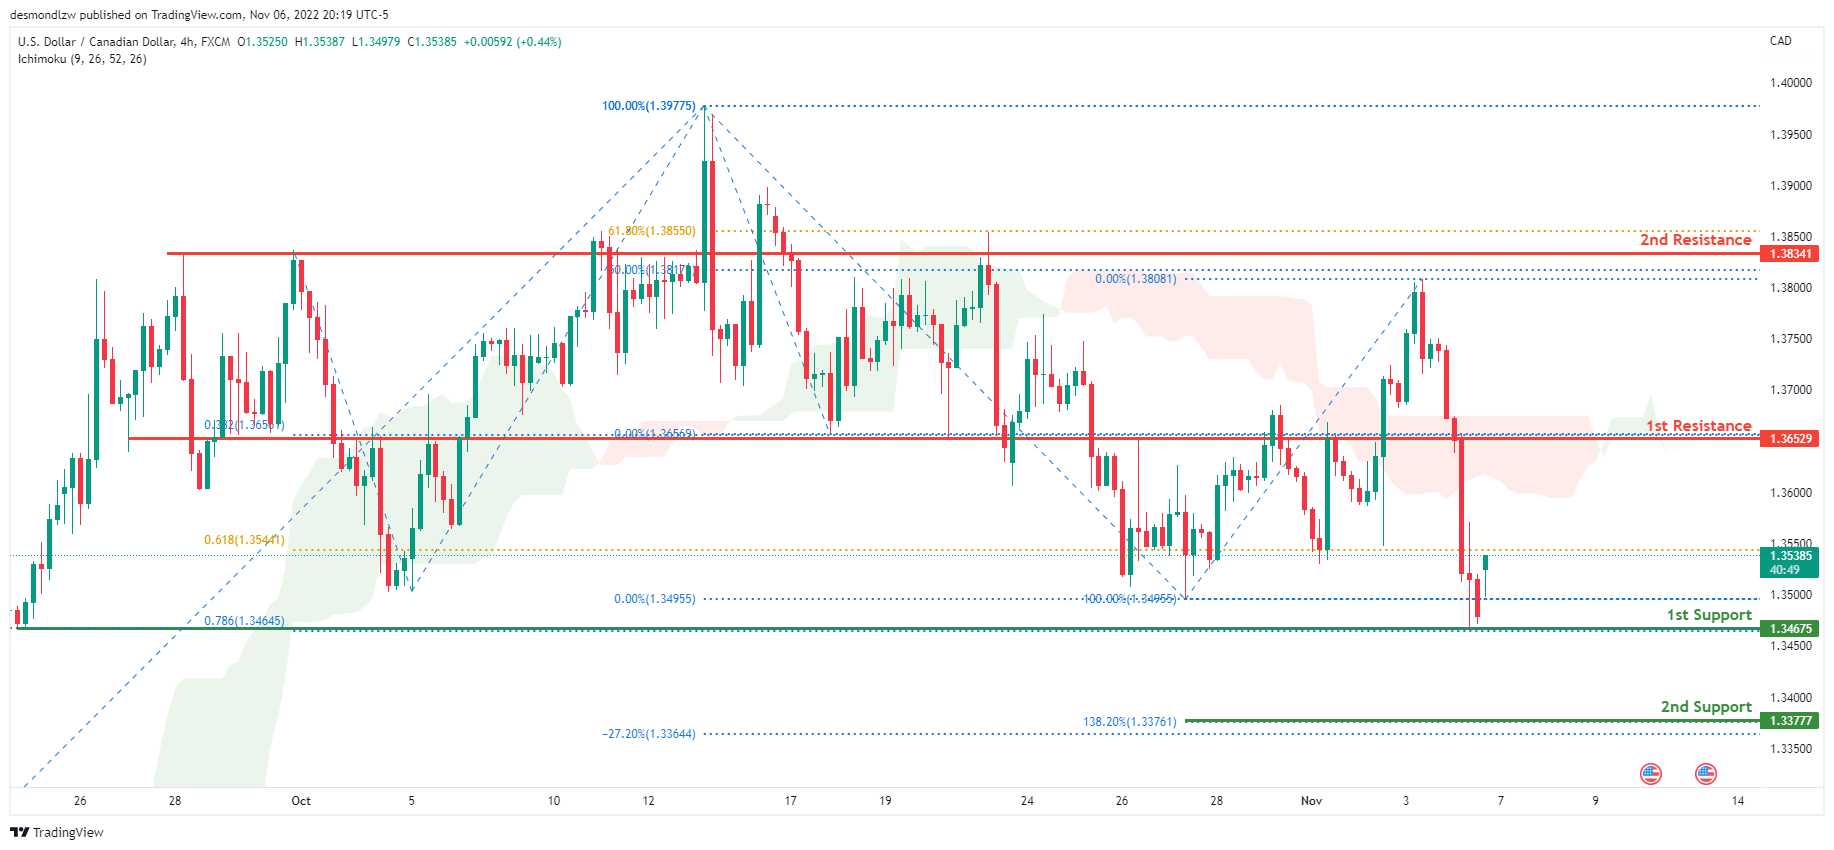
On the H4 chart, the overall bias for USDCAD is bearish. To add confluence to this, the price is below the Ichimoku cloud which indicates a bearish market. Towards the end of last week, the price had huge bearish momentum downwards due to the release of the NFP data. The price is currently trading at 1.35390 at the time of writing. If this bearish momentum continues, expect the price to head back down towards the 1st support line at 1.34675 where the 78.6% Fibonacci projection line and previous low is located. In an alternative scenario, price could head back up towards the 1st resistance line at 1.36529, where the 38.2% Fibonacci projection line is located.
Areas of consideration:
- H4 time frame, 1st resistance at 1.36529
- H4 time frame, 1st support at 1.34675
OIL:
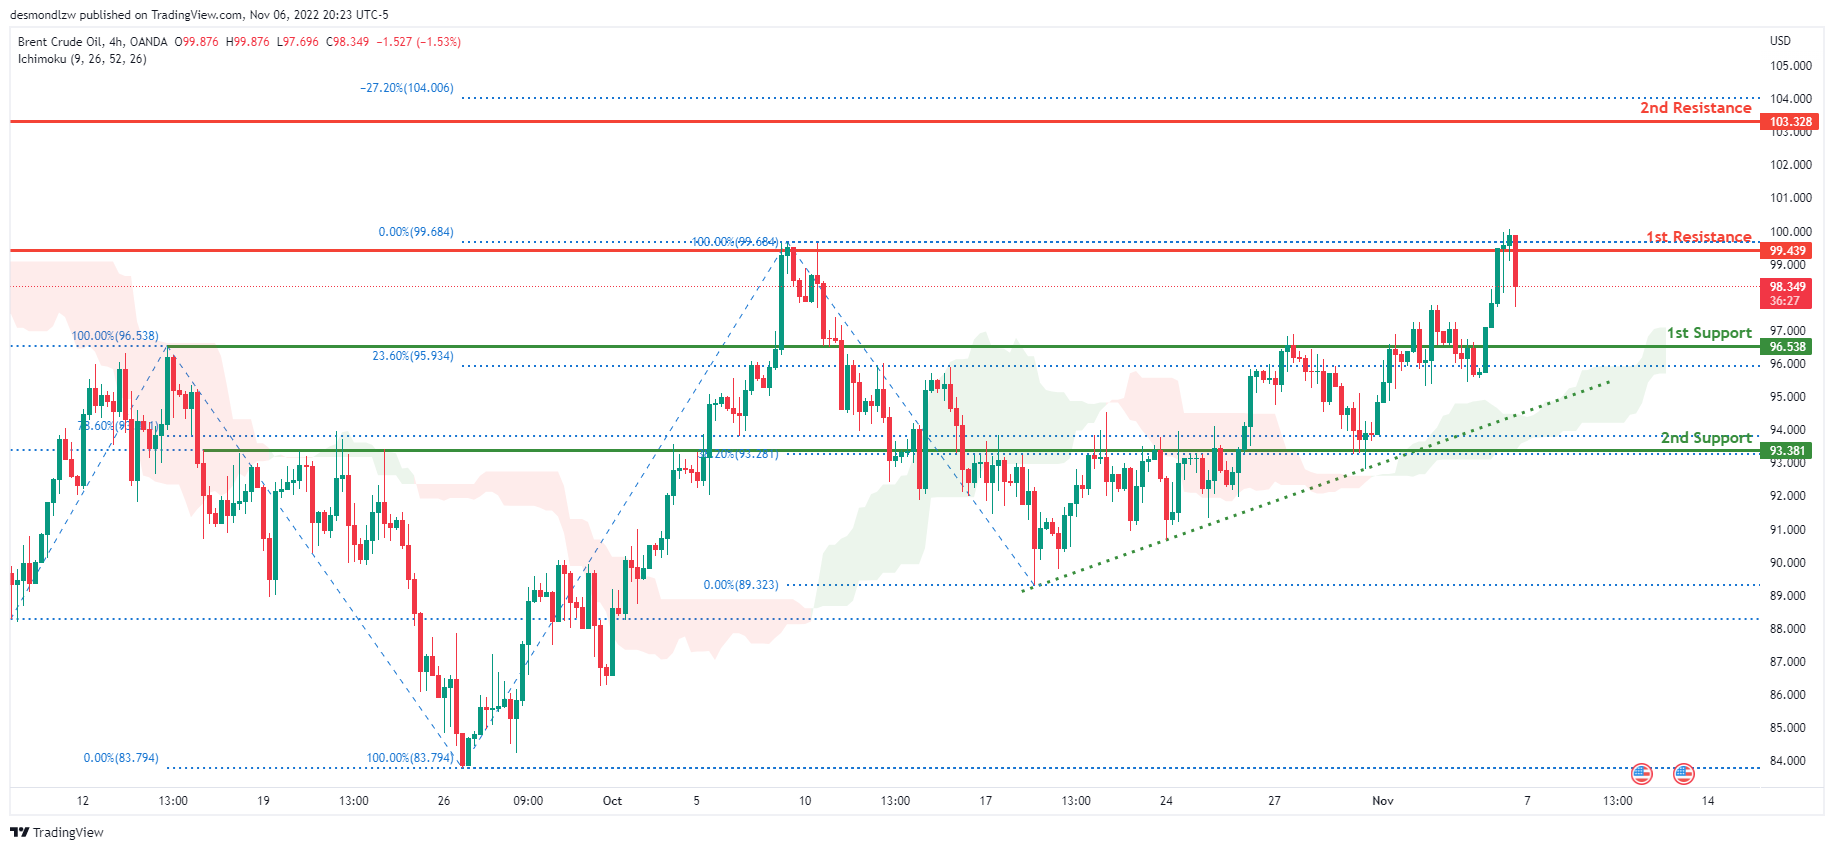
Looking at the H4 chart, the current overall bias for Oil is bullish. To add confluence to this, the price is above the Ichimoku cloud which indicates a bullish market. Towards the end of last week, price had bullish momentum due to the release of the NFP data. The price is currently trading at 98.455 at the time of writing. If this bullish momentum continues, expect price to possibly head back up towards the 1st resistance at 99.439 where previous swing high and 0% Fibonacci line is located. In an alternative scenario, price could head back down to the 1st support level at 96.538 where the 23.6% and 100% Fibonacci lines are located.
Areas of consideration:
- H4 time frame, 1st resistance at 99.439
- H4 time frame, 1st support at 96.538
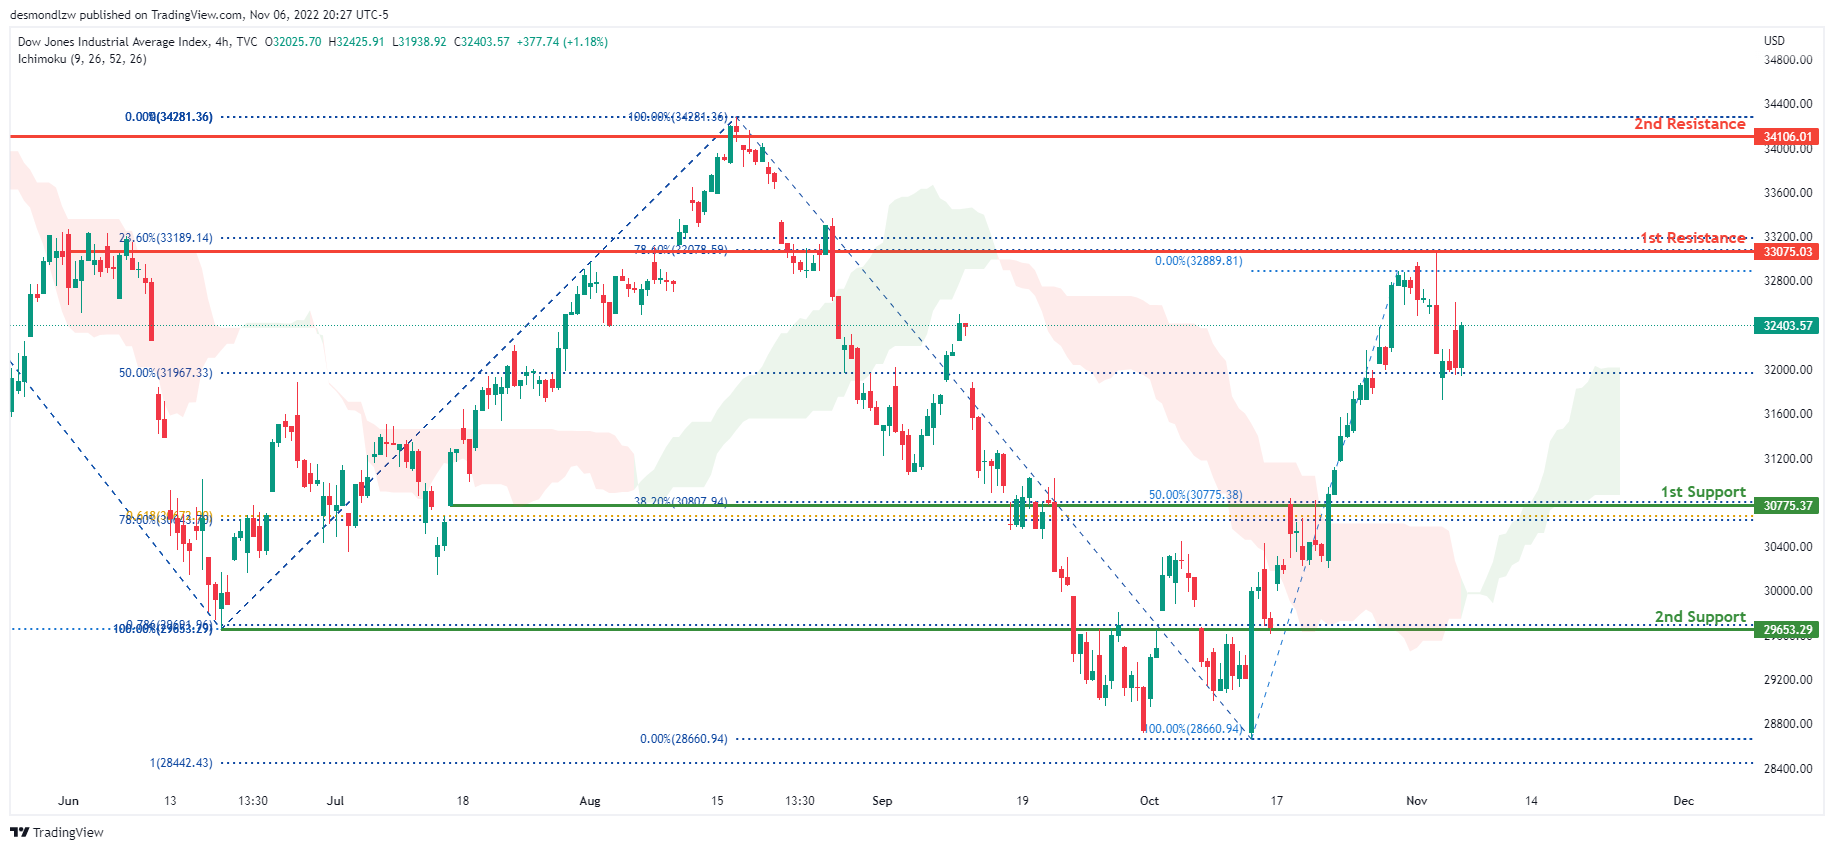
Dow Jones Industrial Average:
On the H4 chart, the overall bias for DJI is bullish. To add confluence to this, the price is above the Ichimoku cloud which indicates a bullish market. Towards the end of last week, it continued its bearish momentum downwards due to the release of the NFP data. The price is currently trading at 32403.57 at time of writing. If this bullish momentum continues, expect the price to possibly head towards the 1st resistance at 33272.34 where the 23.6% and 78.6% Fibonacci lines are located. In an alternative scenario, price could head towards the 1st support line at 30775.37, where the 38.2% and 50% Fibonacci lines are located.
Areas of consideration:
- H4 time frame, 1st support at 30775.37
- H4 time frame, 1st Resistance at 33272.34
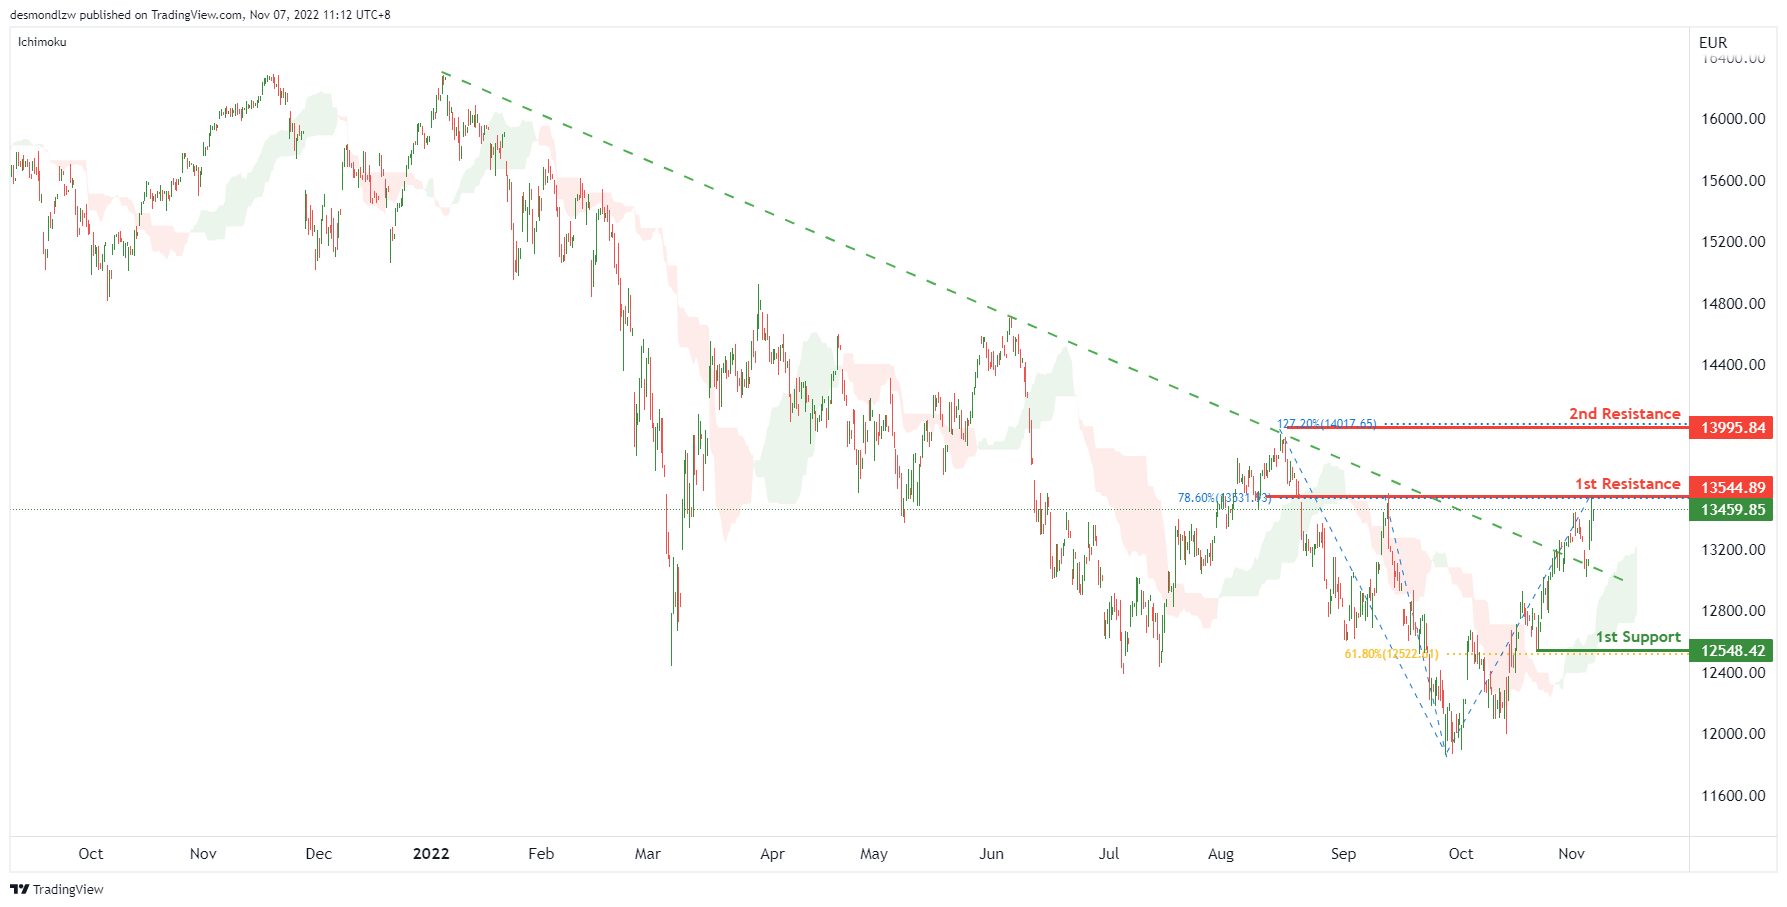
DAX:
On the H4 chart, the price breaking descending trendline. Expecting price to possibly continue this bullish momentum and break the 1st resistance at 13544.89, which is in line with the previous swing high and 78.6% fibonacci retracement. If the 1st resistance is broken, the 2nd resistance is at 13995.84, where 127.2% fibonacci extension sits. Alternatively, the price may drop to the 1st support at 12548.42, which is in line with the 61.8% fibonacci retracement.
Areas of consideration:
- H4 time frame, 1st resistance at 13544.89
- H4 time frame, 2nd resistance is at 13995.84
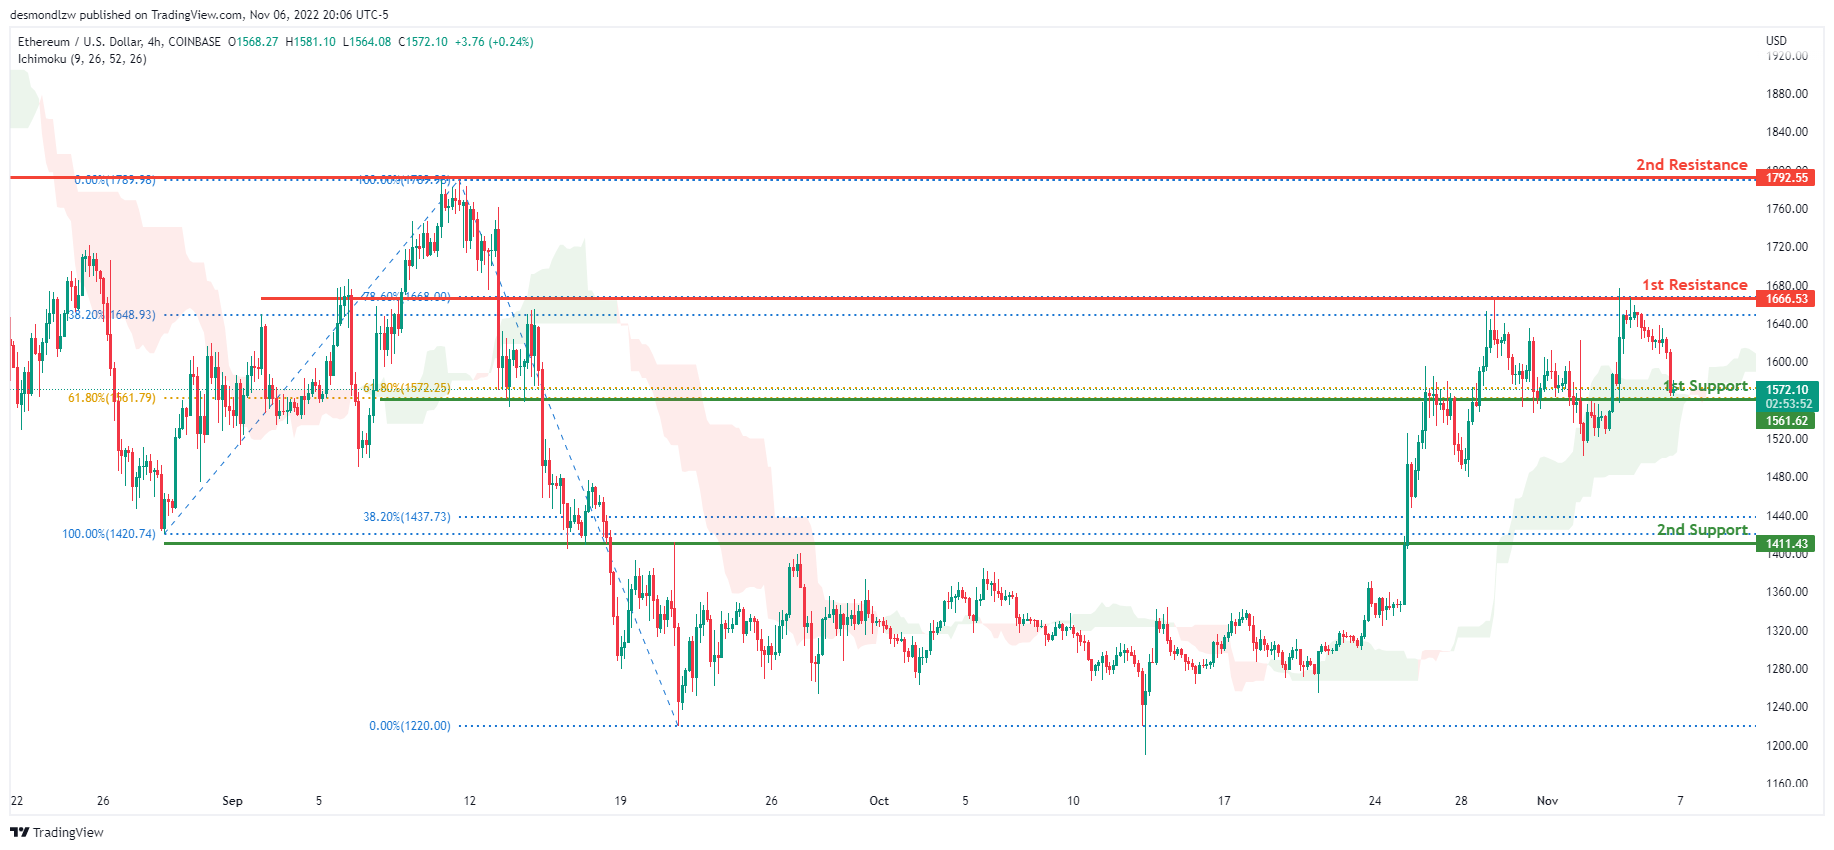
ETHUSD:
Looking at the H4 chart, the current overall bias for ETHUSD is bullish, with price currently within the green Ichimoku cloud. Towards the end of last week, price had a bearish retracement downwards with price currently resting on the 1st support line at 1561.62, where 2 of the 61.8% Fibonacci lines are located. The price is currently trading at 1561.62 at the time of writing. If this bullish momentum continues, expect the price to head towards the 1st resistance line at 1666.53, where the 78.6% and 38.2% Fibonacci lines are located. In an alternative scenario, price could break the 1st support line and head towards the 2nd support line at 1411.43, where the 38.2% and 100% Fibonacci lines are located.
Areas of consideration:
- H4 time frame, 1st resistance of 1666.53
- H4 time frame, 1st support at 1561.62
- H4 time frame, 2nd support at 1411.43
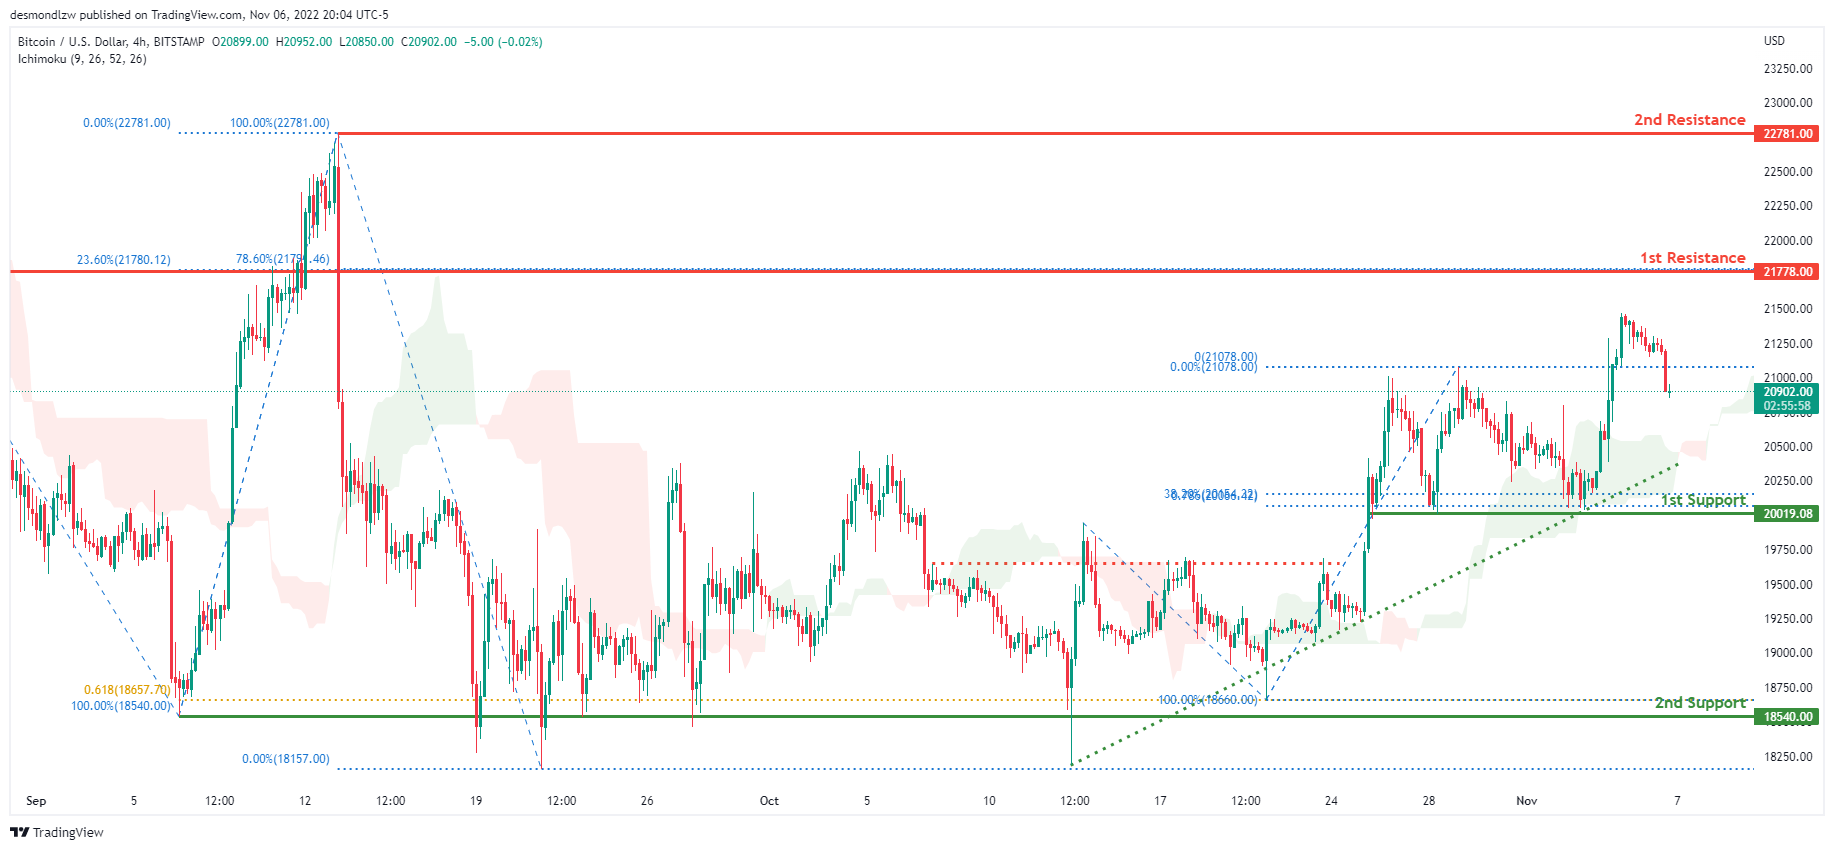
BTCUSD:
On the H4 chart, the overall bias for BTCUSD is bullish. To add confluence to this, the price is above the Ichimoku cloud which indicates a bullish market. Towards the end of last week, price had bullish momentum before having a downwards bearish retracement. Price is currently trading at 20897.00 at time of writing. If this bullish momentum continues, expect the price to head towards the 1st resistance line at 21788.00 where the 78.6% and 23.6% Fibonacci lines are located. In an alternative scenario, price could continue its bearish retracement and head towards the 1st support line at 20019.08, where the 38.2% Fibonacci line and 78.6% Fibonacci projection line is located.
Areas of consideration:
- H4 time frame, 1st resistance 21778.00
- H4 time frame, 1st support at 20019.08
S&P 500:
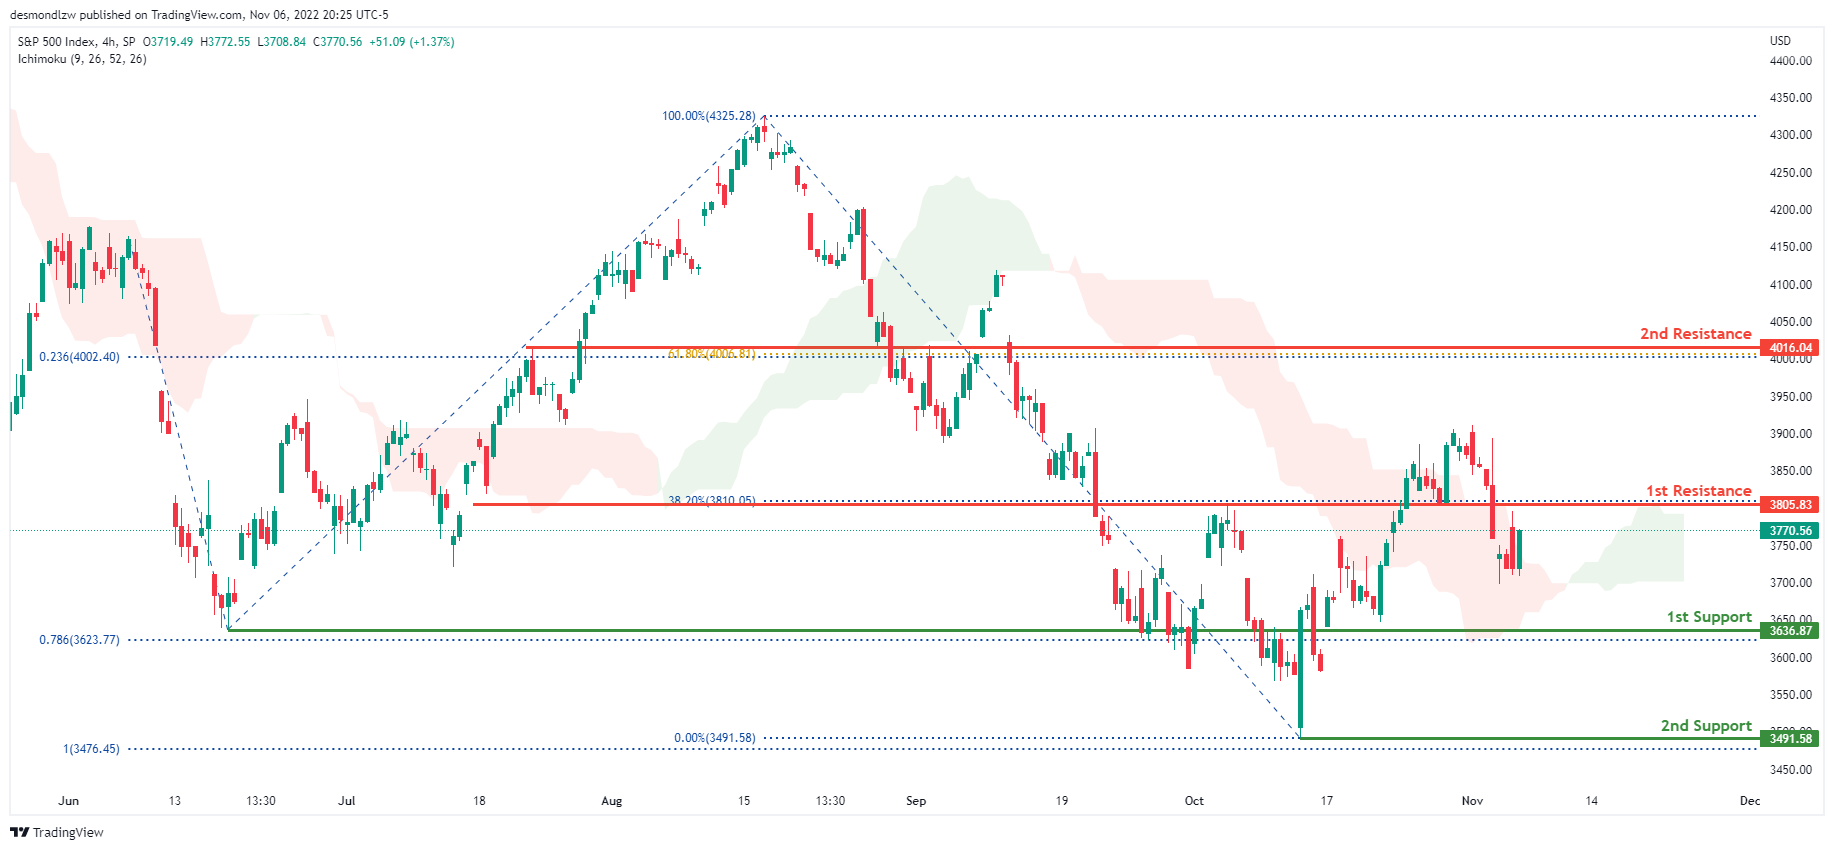
On the H4 chart, the overall bias for S&P500 is bearish with price currently crossing under the Ichimoku cloud. Towards the end of last week, price continued its bearish momentum with price closing under the 1st resistance at 3805.83 where the 38.2% Fibonacci line is located. The price is currently trading at 3770.56 at time of writing. If this bearish momentum continues, expect price to possibly head towards the 1st support at 3636.87 where the previous swing low and 78.6% Fibonacci projection line is located. In an alternative scenario, price could break back up to test the 1st resistance line.
Areas of consideration:
- H4 time frame, 1st support at 3636.87
- H4 time frame, 1st resistance at 3805.83
USD/CAD Daily Outlook
Daily Pivots: (S1) 1.3383; (P) 1.3567; (R1) 1.3808; More....
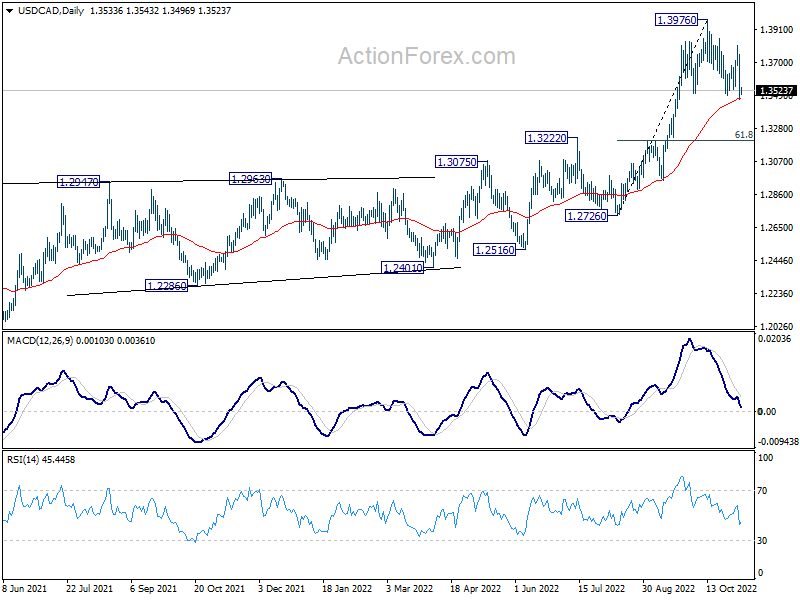
Intraday bias in USD/CAD stays on the downside at this point. A head and should top pattern (1.3832; h: 1.3976; rs: 1.3807) should be formed already. Sustained trading below 1.3494 will confirm, and bring deeper fall to .3207 cluster support (61.8% retracement of 1.2726 to 1.3976 at 1.3204. Strong support should be seen there to bring rebound. But for now, risk will stay on the downside as long as 1.3807 resistance holds, in case of recovery.
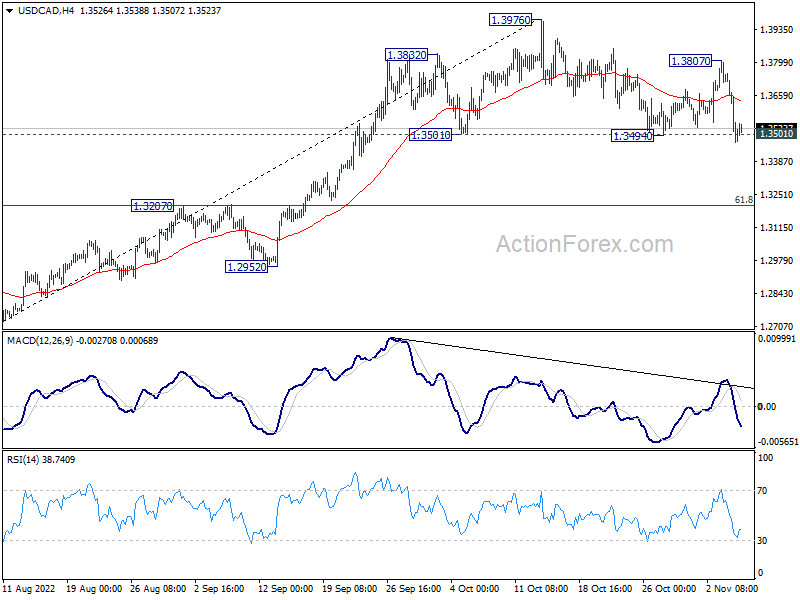
In the bigger picture, up trend from 1.2005 (2021 low) is still in progress. Based on current impulsive momentum, it could be resuming long term up trend from 0.9056 (2007 low). Whether it is or it isn't, retest of 1.4689 (2016 high) should be seen next. This will now remain the favored case as long as 1.3222 resistance turned support holds.
Asia Extends Rebound, But Aussie Not Following… Yet
The forex markets are rather steady in Asia today. While stocks in China and Hong Kong extending last week's strong rebound, Aussie and Kiwi are not following for now. Some traders are on guard to rumors of reopening in China, in particular with a district in Guangzhou still extending tough lockdown. The economic calendar is relative light this week. Main focus will be on consumer inflation data in the US.\
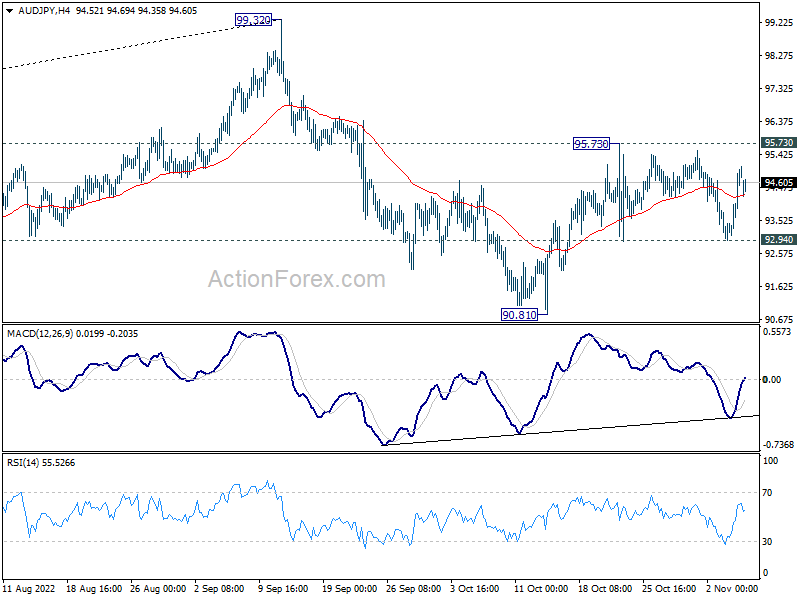
Technically, it's possible that AUD/JPY's consolidation from 95.73 has completed with three waves to 92.94. That is, rebound from 90.81 might be ready to resume. Break of 95.73 resistance will confirm this case and target 99.32 high. For now, a break of 99.32 is not envisaged given the threat of intervention in USD/JPY. But that could depend on the momentum in AUD/USD upon breaking through 0.6521 resistance to complete a head and should bottom pattern.
In Asia, at the time of writing, Nikkei is up 1.30%. Hong Kong HSI is up 3.42%. China Shanghai SSE is up 0.46%. Singapore Strait Times is up 0.21%. Japan 10-year JGB yield is down -0.0074 at 0.250.
China exports dropped -0.3% yoy in Oct, imports down -0.7% yoy
In USD term, China's exports dropped -0.3% yoy to USD 298.37B in October, well below expectation of 4.3% yoy. That's the worst performance since May 2020.
Imports dropped -0.7% yoy to USD 213.22B, below expectation of 0.1% yoy. That's the the worst since August 2020.
The simultaneous contraction in both exports and imports was the first since May 2020.
Trade surplus widened slightly from USD 84.74B to USD 85.15B, short of expectation of USD 95.95.
US CPI to highlight a "relatively" light week
US CPI highlights a "relatively" light week. Fed Chair Jerome Powell indicated clearly that tightening pace could slow as soon as in December, but the terminal rate could be higher than earlier expected. Chicago Fed President Charles Evans later said the projection of peak rate might be revised "slightly higher" in the upcoming forecasts. But after all, the path will remain heavily data dependent, especially on whether inflation shows more signs of cooling.
Other data to be watched closely include US U of Michigan consumer sentiment; Eurozone Sentix investor confidence, UK GDP. In term of central bank activities, BoJ will publish summary of opinions. ECB will publish monthly bulletin.
Here are some highlights for the week:
- Monday: China trade balance; Swiss unemployment rate, foreign currency reserves; Germany industrial production; Eurozone Sentix investor confidence.
- Tuesday: Australia AiG services, Westpac consumer sentiment, NAB business confidence; New Zealand inflation expectations; Japan average cash earnings, household spending, leading indicators, BoJ summary of opinions; France trade balance; Eurozone retail sales.
- Wednesday: Japan current account, bank lending; China CPI, PPI; US wholesale inventories.
- Thursday: Australia MI inflation expectations, UK RICS house price balance; ECB economic bulletin; US CPI, jobless claims.
- Friday: New Zealand BusinessNZ manufacturing index; Japan PPI; Germany CPI final; UK GDP, production, trade balance, NIESR GDP estimate; US U of Michigan consumer sentiment.
USD/CAD Daily Outlook
Daily Pivots: (S1) 1.3383; (P) 1.3567; (R1) 1.3808; More....
Intraday bias in USD/CAD stays on the downside at this point. A head and should top pattern (1.3832; h: 1.3976; rs: 1.3807) should be formed already. Sustained trading below 1.3494 will confirm, and bring deeper fall to .3207 cluster support (61.8% retracement of 1.2726 to 1.3976 at 1.3204. Strong support should be seen there to bring rebound. But for now, risk will stay on the downside as long as 1.3807 resistance holds, in case of recovery.
In the bigger picture, up trend from 1.2005 (2021 low) is still in progress. Based on current impulsive momentum, it could be resuming long term up trend from 0.9056 (2007 low). Whether it is or it isn't, retest of 1.4689 (2016 high) should be seen next. This will now remain the favored case as long as 1.3222 resistance turned support holds.
Economic Indicators Update
| GMT | Ccy | Events | Actual | Forecast | Previous | Revised |
|---|---|---|---|---|---|---|
| 02:00 | CNY | Trade Balance (USD) Oct | 85.2B | 96.0B | 84.7B | |
| 02:00 | CNY | Trade Balance (CNY) Oct | 85.2B | 702B | 574B | |
| 06:00 | JPY | Machine Tool Orders Y/Y Oct | 4.30% | |||
| 07:00 | EUR | Germany Industrial Production M/M Sep | -0.20% | -0.80% | ||
| 08:00 | CHF | Foreign Currency Reserves (CHF) Oct | 807B | |||
| 09:30 | EUR | Eurozone Sentix Investor Confidence Nov | -35 | -38.3 |