Sample Category Title
GBP/USD Daily Outlook
Daily Pivots: (S1) 1.1414; (P) 1.1514; (R1) 1.1567; More...
Intraday bias in GBP/USD remains neutral as consolidation from 1.1664 is extending. Further rise is expected as long as 1.1256 minor support holds. On the upside, break of 1.1644 will resume rise form 1.0351 to 100% projection of 1.0351 to 1.1494 from 1.0922 at 1.2065. However, break of 1.1256 will turn bias back to the downside for 1.0922 support and below.
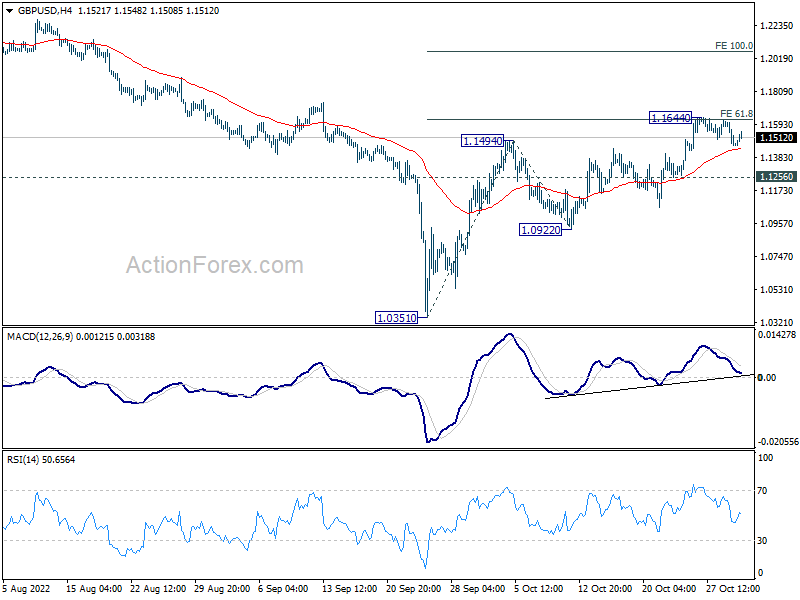
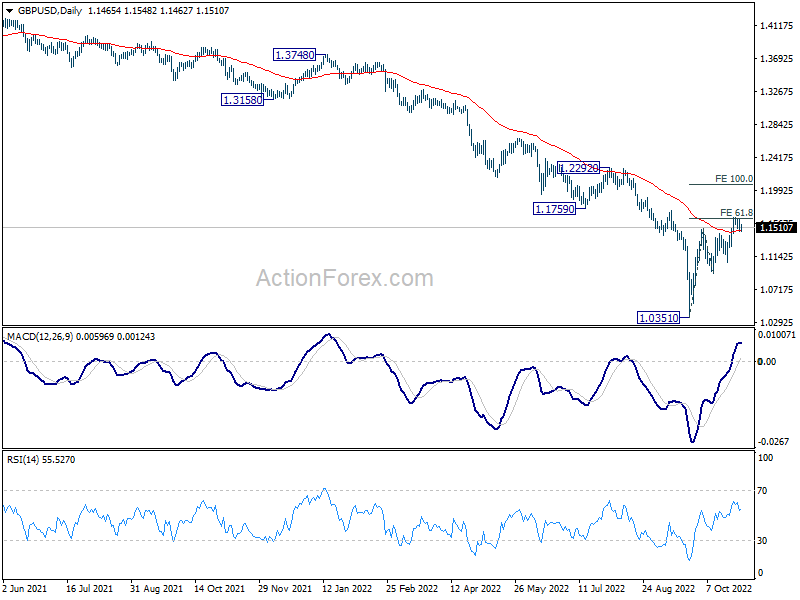
In the bigger picture, fall from 1.4248 (2018 high) is part of the long term down trend from 2.1161 (2007 high). Outlook will stay bearish as long as 1.1759 support turned resistance holds. Parity would be the next target on resumption. Nevertheless, firm break of 1.1759 will confirm medium term bottoming, and open up stronger rise back to 55 week EMA (now at 1.2392).
USD/CHF Daily Outlook
Daily Pivots: (S1) 0.9972; (P) 1.0003; (R1) 1.0047; More...
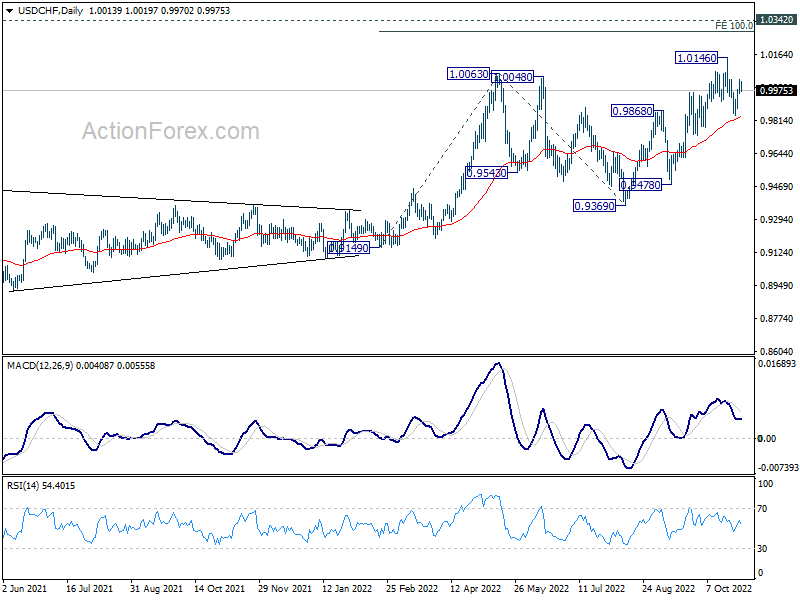
USD/CHF retreated after touching 1.0030 minor resistance and intraday bias stays neutral first. On the upside, break of 1.0030 minor resistance will suggest that pull back from 1.0146 has completed at 0.9840. Bias will be back on the upside for retesting 1.0146. Firm break there will resume larger up trend to 1.0283 projection level. However, break of 0.9840 support will now be a sign of reversal, and bring deeper decline back to 0.9779 support instead.
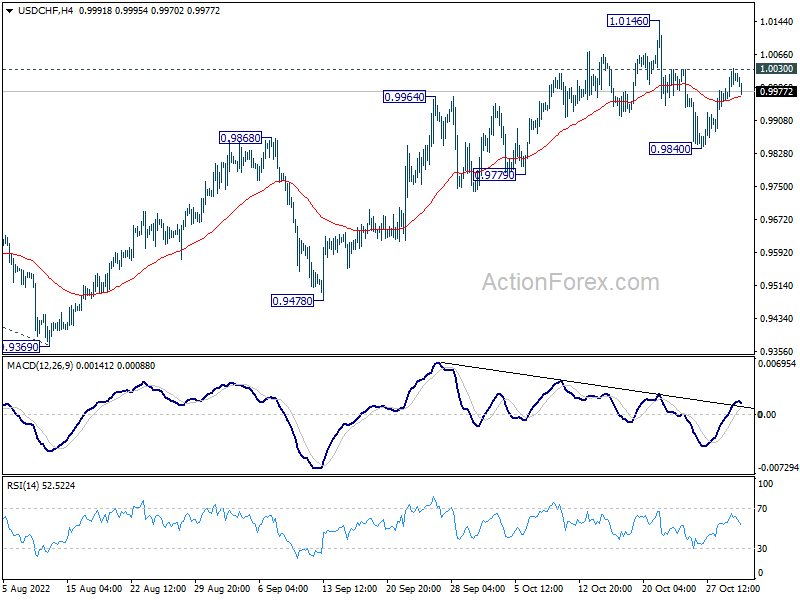
In the bigger picture, current development suggests that up trend from 0.8756 (2021 low) is still in progress. Next target is 100% projection of 0.9149 to 1.0063 from 0.9369 at 1.0283, and then 1.0342 (2016 high). For now, this will remain the favored case as long as 0.9779 support holds, even in case of deep pull back.
USD/JPY Daily Outlook
Daily Pivots: (S1) 147.92; (P) 148.38; (R1) 149.22; More...
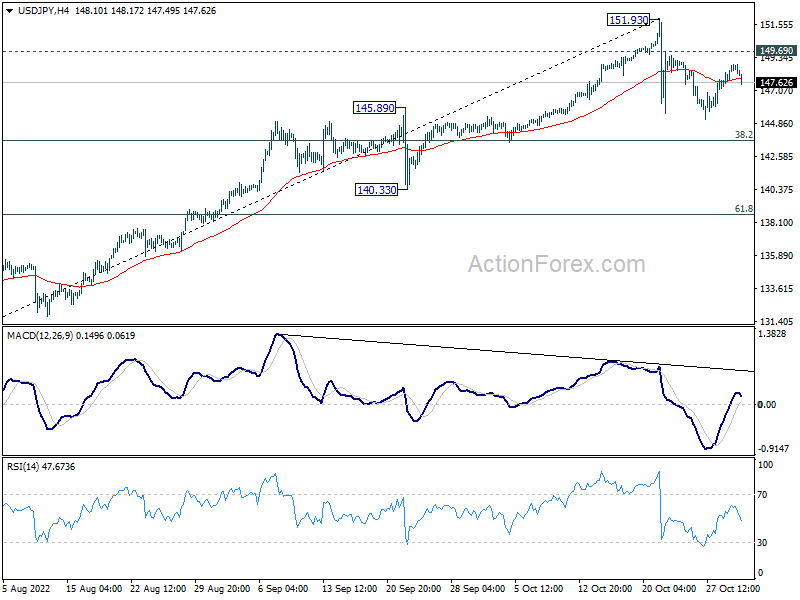
Intraday bias in USD/JPY remains neutral as corrective pattern from 151.93 is extending. Another fall could be seen, but downside should be contained by 38.2% retracement of 130.38 to 151.93 at 143.69 to bring rebound. On the upside, above 149.69 minor resistance will bring stronger rebound back towards 151.93 high. But upside should be limited there to continue the corrective pattern.
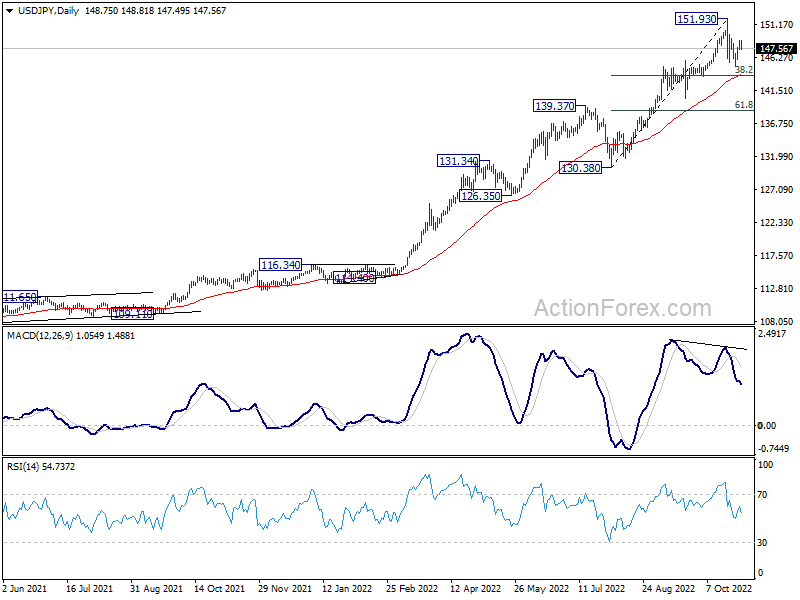
In the bigger picture, up trend from 101.18 is still in progress, as part of the whole up trend from 75.56 (2011 low). 147.68 (1998 high) was already met and there is no clearly sign of topping yet. In any case, break of 140.33 support is needed to be the first sign of medium term topping. Otherwise, further rise is in favor to next target at 160.16 (1990 high).
USD/CAD Daily Outlook
Daily Pivots: (S1) 1.3588; (P) 1.3636; (R1) 1.3672; More....
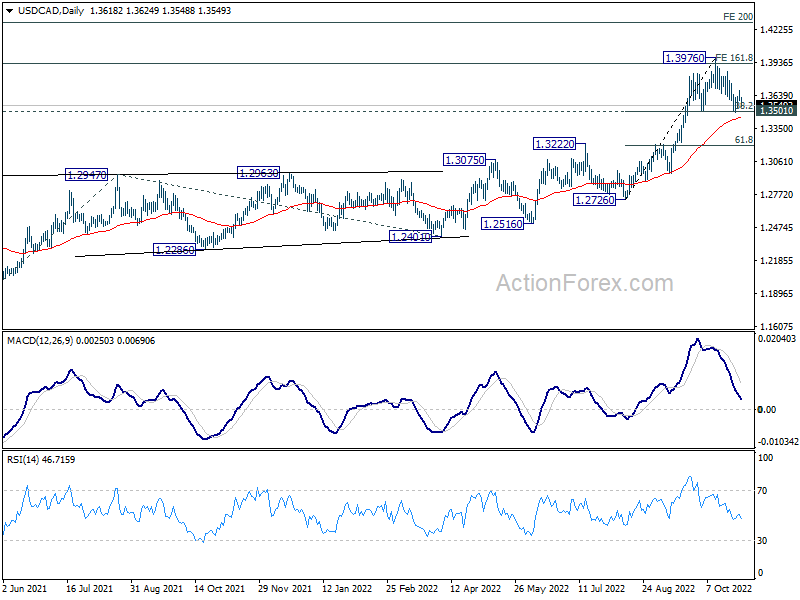
Intraday bias in USD/CAD remains neutral for the moment. On the downside, firm break of 1.3501 will bring deeper correction 55 day EMA (now at 1.3439) and below. On the upside, decisive break of 1.3976 will resume larger up trend and target 200% projection of 1.2005 to 1.2947 from 1.2401 at 1.4285.
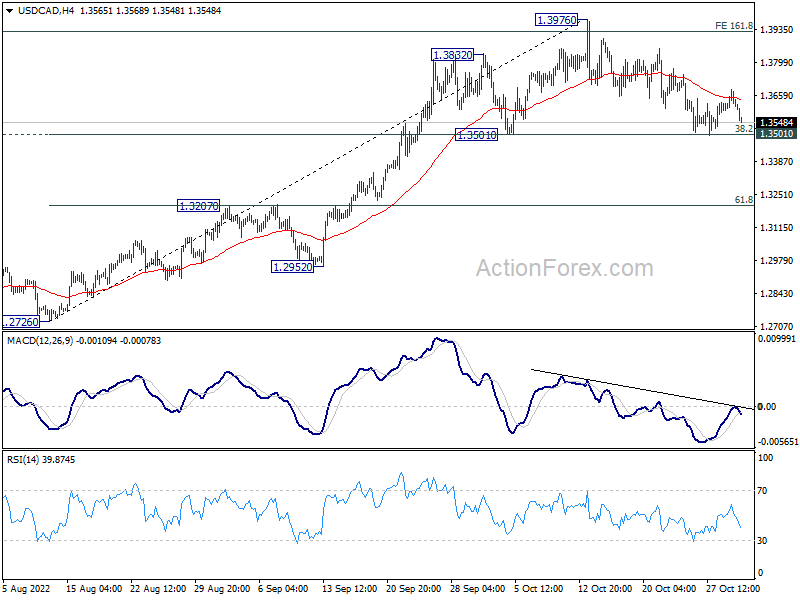
In the bigger picture, up trend from 1.2005 (2021 low) is still in progress. Based on current impulsive momentum, it could be resuming long term up trend from 0.9056 (2007 low). Whether it is or it isn't, retest of 1.4689 (2016 high) should be seen next. This will now remain the favored case as long as 1.3222 resistance turned support holds.
RBA Board Sticks with 25 Basis Point Increase in Cash Rate
Despite a significant lift in the inflation outlook the RBA Board decided to maintain its low key 25 basis point policy.
The Reserve Bank Board raised the cash rate by 25 basis points to 2.85% at its November meeting.
This result was widely predicted by the market and analysts.
Our view has been that the shock September quarter inflation report which showed a lift in core inflation of 1.8% (annual rate of 6.1%) compared to the market forecast of 1.5% and evidence of a widening of inflation pressures justified a 50 basis point move. That move would be to emphasise the Board’s commitment to returning inflation to the target range of 2–3%.
The Board recognised this unwelcome boost to inflation pressures by lifting the forecast for inflation in 2022 from 7.8% to 8.0% and the forecast for 2023 from 4.3% to 4.75%.
The 2023 forecast increase is particularly troubling – a central bank which has a 2-3% inflation target and accepts that 4.75% inflation in the following policy year runs the risk of embedding an inflationary psychology for both businesses and employees making it more difficult to avoid an even more extended period of high inflation.
Forecast growth rates have been lowered to 1.5% (from 1.8%) in 2023 and 1.5% (from 1.7%) in 2024.
The forecast for the unemployment rate by year’s end is 3.5% (up from 3.4% in September) constrained by labour supply rather than demand, highlighting a risk to wages growth.
While the Statement did not provide a new forecast for wages growth recall that the August forecast is for only 3.6% in 2023 compared to the Westpac forecast of 4.5%.
When we raised our forecast for the November Board meeting to a 50 basis point move we increased our forecast terminal rate from 3.6% to 3.85%.
In response to the September Inflation Report we have raised our quarterly profiles for underlying inflation from 1.5% to 1.8% (September quarter); 1.2% to 1.8% (December quarter) and 0.8% to 1.2% (March quarter). This is not only because the September quarter proved to be higher than expected but also because the evidence from September was that inflation pressures were becoming more widespread, implying a deepening of inflation psychology.
Despite the Board not moving by 50 basis points today we think this higher inflation profile justifies maintaining the 3.85% terminal rate forecast.
Given that the Board chose not to respond to the inflation shock with more than 25 basis points we can only conclude that as rates continue to rise the increments will be 25 basis points.
We had expected that the 0.8% underlying inflation print we were anticipating for the March quarter would allow the Board to go on hold from March.
Now we expect that the March quarter Inflation Report which will print in late April will require a further rate increase.
Going forward we now expect 25 basis point increments in December; February; March and May.
We have not changed our growth forecasts for 2023 (1.0%) and 2024 (2.0%).
The growth momentum in the first half of 2023, while still slowing, is likely to be faster than the second half of 2023 where growth could stall completely.
The Board does recognise the risks of embedding inflation psychology in the system “The Board will continue to pay close attention to the evolution of labour costs and the price setting behaviour of firms.”
The final paragraph continues to emphasise that “The size and timing of interest rate increases will continue to be determined by the incoming data and the outlook for inflation and the labour market.”
Based on the decision to hold the increase to 0.25% at the November meeting this “incoming data” condition looks to be a very high hurdle.
Conclusion
The Board decided to stick with the 25 basis point path despite a significant lift in the inflation forecast for 2023 from 4.3% to 4.75%.
It now seems that the Board is prepared to await the impact of the series of hikes at that risk of embedding an inflation psychology in the system which would eventually require a much more damaging policy response.
Westpac retains its terminal rate forecast of 3.85% but now extends the length of the tightening cycle to May as inflation becomes more entrenched in the near term.
Hawkish Fed Fears Resurface
Equities fell and bond yields rose, as the hawkish Federal Reserve (Fed) fears resurfaced before Wednesday’s FOMC decision.
The Fed starts its two-day meeting, and expectations are mixed. The Fed could call the end of the aggressive rate tightening and signal slower rate hikes to enter the final phase of policy tightening, before pausing.
So, we are at that point, where, after this week’s 4th consecutive 75bp rate hike, the Fed could hint at a 50bp hike in December. Then, the season finale would come with a couple of 25bp hikes in the first quarter of 2023, then a pause.
But there is a risk in there. The risk is, because investors are waiting in ambush for the Fed to soften its tone, any sign of a less hawkish Fed could send both the bond and equity markets rallying.
And that’s exactly what the Fed doesn’t want to happen. A broadly cheerful market rally would boost inflation expectations, and inflation. And inflation is nowhere close to the Fed’s 2% policy target.
Therefore, if we see a determined inflation warrior that is ready to send everything under the bus to fight inflation, then we could call the end of the latest bear market rally and expect fresh lows in this selloff cycle.
If however, Powell sounds reasonably hawkish, we shall see consolidation, with hope of further recovery.
The S&P500 tests the 100-DMA to the upside for the first time in a month, and recovered around half of losses it made since the summer peak. Another selloff could send the S&P500 down to 3400 level, following an ABCD pattern since March.
Inflation that comes from nowhere
The Eurozone inflation hit a record high of 10.7% in October, versus 10.2% expected by analysts, and the European Central Bank (ECB) Chief Christine Lagarde said that inflation came from nowhere, ignoring a decade-and-a-half of aggressive bond buying that threw the foundations of the present spike in inflation, boosted by the pandemic, the war and a global energy crisis
The Eurozone yields spiked on expectation that higher inflation would mean higher ECB rate hikes in the future. But the euro didn’t gain, as currency traders priced in the rising recession fears that come along with the higher interest rates. The EURUSD is now back to testing its 50-DMA, and with investors broader moving back to the US dollar, to protect themselves against a hawkish Fed statement tomorrow, we could see the pair sink below the 50-DMA, which stands near 0.9890.
Elsewhere
The Reserve Bank of Australia (RBA) raised the interest rates by 25bp as expected and said there will be more rate hikes, but the whole thing will depend on economic data… a similar blah blah to what we heard from the ECB last week. The AUDUSD gained, because the US dollar was softer this morning.
In Switzerland, the Swiss National Bank announced a 142 billion franc loss in the first nine months of the year; melting currency valuations, especially the melting euro, was to blame.
In precious metals, gold remains under pressure. The $1615 is the next important support. If the US dollar strengthens as a result of a sufficiently hawkish Fed statement this week, gold bears could pull out the $1615 support and tip a toe into the $1500s for the first time since April 2020.
High Euro Area Inflation and Q3 GDP Better than Feared
Market movers today
Today we get US ISM manufacturing PMI. Consensus sees a decline to index 50 after the weaker than expected Markit PMIs last week.
We also get PMIs out of Sweden and Norway and in Denmark it is Election Day, see more below.
The 60 second overview
Double-digit inflation: Euro area HICP inflation jumped to a new high at 10.7% y/y in October (from 9.90% y/y in September). The higher print was driven by an increase in energy, food and core inflation. Energy inflation rose to 41.9% (from 40.72% in Sep) as the pass-through of higher gas/electricity prices continues in most countries, more than off-setting the negative base effects that are weighing on fuel prices and German VAT cuts for gas and district heating. Food price inflation (13.1% from 11.76% in September) also showing no signs of moderating yet, despite farm-gate and wholesale market prices pointing to an approaching peak.
Core inflation rose further (5.0% from 4.75% in September). Country figures suggest the increase was broad-based, even for 'luxury' services like recreation, hotels and restaurants, airfares and package holidays. For goods, strong momentum is still visible for non-durable goods price especially, as companies continue to pass on higher input and energy costs and selling price expectations showed no signs of peaking yet in October.
Euro area GDP still growing in Q3: Euro area GDP expanded by 0.2% q/q in Q3 (after 0.8% q/q in Q2). Lower post-pandemic pent-up demand in services led to noticeable cooling of the growth pace in Italy and Spain from the summer, while - despite the record-high gas prices - Germany's economy (+0.3% q/q) is weathering the economic storm better than expected.
Despite sky-high inflation and a worsening energy crisis, country figures suggest private consumption remained fairly resilient during Q3. The delayed energy pass-through, pandemic savings and fiscal mitigating measures probably helped keep a hand under domestic demand, while a decent order backlog coupled with easing supply constraints in manufacturing still support export performance near-term. The ongoing euro area recovery is a welcome positive surprise, especially for countries such as Spain, which has yet to reach pre-pandemic GDP levels. But we still think it will be difficult to avoid a recession during the winter, amid slowing industrial activity, while domestic demand should increasingly feel the impact of falling real disposable incomes and higher borrowing costs.
Australia rate hike: Overnight the RBA hiked its policy rate by 25bp to 2.85% and signalled more tightening ahead. Importantly, the decision underlined the move or pivot last month away from large rate hikes. The rate hike was expected, but still worth keeping an eye on as RBA is one of the first G10 central banks to have moved away from big rate hikes as it has started to put more focus on the recession risks despite high inflation. That said, one should remember that RBA meets every month making it easier to move in small steps. Norway is another central bank that has started to focus more on the outlook for growth. Hence, we expect a similar move like the RBA to a smaller 25bp rate hike on Thursday from 50bp in September.
Equities: Global equities lower yesterday led down by US and tech with most other regions higher. Defensives outperforming with health care and energy the only two sectors higher. Tech, media struggling, and small caps outperforming. In US Dow -0.4%, S&P 500 -0.8%), Nasdaq -1.0% and Russell 2000 -0.00%. Optimism is coming back this morning with Asian markets higher across the region while also European and US futures are higher.
FI: European rates did not react to the record-high inflation print, however, the print confirms to us, that making firm conclusions of an inflation peak is too soon, and thereby the ECB pivot as a market theme is too early. As a result rates sold off by 4bp in core countries while the Italian-German spread widened 9bp yesterday after flirting with the 200bp level last week. Bunds currently stand at 2.14%.
FX: USD rebounded further on broad basis yesterday. EUR/USD dropped below 0.99 and USD/JPY rose above 148. Scandies were broadly stable vis-à-vis EUR yesterday.
Nordic macro
Sweden: Yesterday, Industrial unions in Sweden informed on their demand for a 4.4% wage increase for the coming year. Historically, outcomes ended up at roughly 75% of the demands, implying c.3.3% this time around. The week before Christmas the industrial employers will respond to the requests with their number.
Swedish PMI manufacturing numbers for October will be released today (CET 8:30) where a continued drop below the 50-threshold is expected.
Norway: Based on the deterioration in global PMIs in October, we expect the Norwegian PMI to drop below 50 for the first time since August 2020. Also, keep an eye on the employment index, as the demand for labour has been surprisingly strong.
Denmark: There is a general election in Denmark today. Polls point to a result where negotiations to form a new government will be difficult and possibly lengthy. There appears to be broad agreement about the macroeconomic framework among the main parties, so there should be no near-term market impact.
AUD/USD Daily Report
Daily Pivots: (S1) 0.6368; (P) 0.6398; (R1) 0.6428; More...
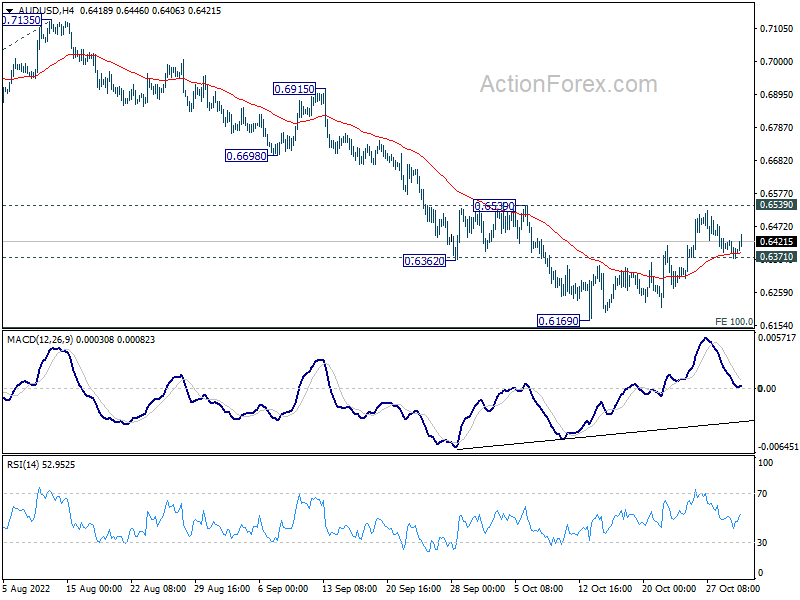
AUD/USD recovered after drawing support from 0.6371, but stays below 0.6539 resistance. Intraday bias stays neutral first. On the upside, decisive break of 0.6535 resistance, and sustained trading above 55 day EMA (now at 0.6553), will raise the chance of medium term bottoming, and target 0.6680 support turned resistance next. On the downside, below 0.6371 minor support will turn bias back to the downside for retesting 0.6169 low instead.
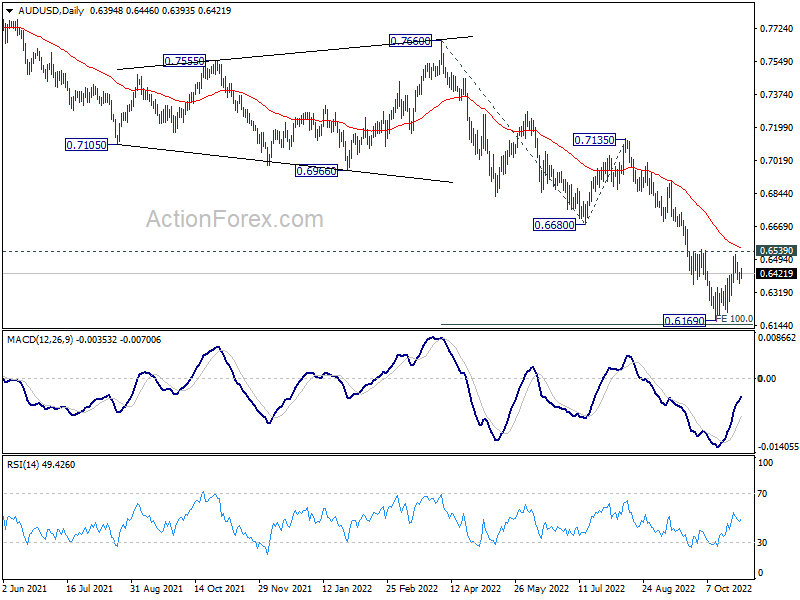
In the bigger picture, down trend form 0.8006 (2021 high) is expected to continue as long as 0.6680 support turned resistance holds. Medium term momentum remains strong and retest of 0.5506 (2020 low) cannot be ruled out. But firm break of 0.6680 will be the first sign of reversal, and bring stronger rebound back to 0.7135 resistance.
Aussie Higher after RBA Hike, Except Versus Kiwi
Australian Dollar trades higher today, following recovery in Asian stock markets. RBA hikes by 25 bps as widely expected and indicates more tightening to come ahead. There is little reaction as the message is well digested by the markets already. Nevertheless, Aussie is slightly outperformed by New Zealand Dollar for the moment. On the other hand, Dollar, Yen and Swiss France turned softer while European majors are mixed with Canadian.
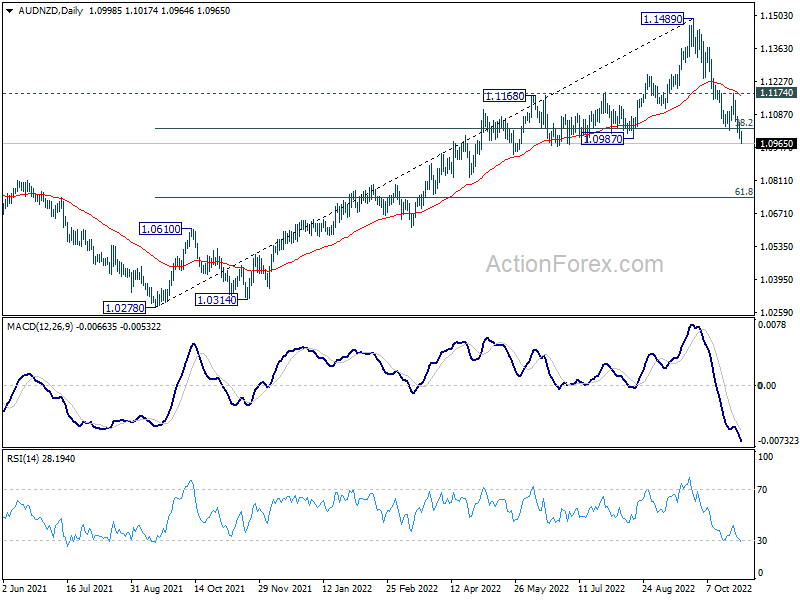
Technically, while Aussie is firmed elsewhere, it's extending recent decline against Kiwi. AUD/NZD's break of 1.0987 support suggests that deeper correction is underway. Near term outlook will stay bearish as long as 1.1174 resistance holds. Next target is 61.8% retracement of 1.0287 to 1.1489 at 1.0746. Such development would momentum of Aussie's rebound elsewhere.
In Asia, at the time of writing, Nikkei is up 0.11%. Hong Kong HSI is up 2.80%. China Shanghai SSE is up 1.03%. Singapore Strait Times is up 0.89%. Japan 10-year JGB yield is up 0.0101 at 0.255. Overnight, DOW dropped -0.39%. S&P 500 dropped -0.75%. NASDAQ dropped -1.03%. 10-year yield rose 0.0067 to 4.077.
RBA hikes 25bps, rates to rise further over the period ahead
RBA raises cash rate target by 25bps to 2.85% as widely expected. It maintains tightening bias and expects to "increase interest rates further over the period ahead". The size and timing of future rate hikes will be determined by incoming data and the outlook for inflation and labor market.
The central bank expects inflation to "further increase" over the months ahead and peak at around 8% this year. CPI inflation is forecast to be around 4.75% over 2023 and a little above 3% over 2024. GDP growth forecast was "revised down a little" to 3% this year, 1.50% in 2023 and 2024. Unemployment rate is forecast to rise gradually from current 3.5% to a little above 4% in 2024 as economic growth slow.
China Caixin PMI manufacturing recovered to 49.2, impact of Covid controls lingered
China Caixin PMI Manufacturing rose from 48.1 to 49.2 in October, above expectation of 49.0. Caixin noted that output and new orders fell again as COVID-19 containment measures continued. Selling prices fell for the sixth consecutive month. Business confidence edged up slightly.
Wang Zhe, Senior Economist at Caixin Insight Group said: "Overall, the negative impact of Covid controls on the economy lingered. In October, supply, domestic and overseas demand, and employment in the manufacturing sector all contracted, but the rates of contraction slowed from the previous month. Costs rose slightly, and cuts to output prices were still common. Logistics and transportation were still sluggish, and companies' purchases and inventories rose slightly. Market sentiment improved, but optimism remained limited from a long-term perspective.
Japan PMI manufacturing finalized at 50.7, but business remained optimistic
Japan PMI Manufacturing was finalized at 50.7 in October, slightly down from September's 50.8. That's the lowest level in 21 months. S&P Global noted that inflationary pressure remained severer. Business remained optimistic with sentiment at nine-month high.
Laura Denman, Economist at S&P Global Market Intelligence, said: "Sluggish markets and weaker demand conditions, on both a domestic and international level, became a recurring trend throughout the report and were seemingly the driving forces behind the slower sector performance... Meanwhile, inflationary pressures remained severe..
"Japanese manufacturing firms increased their selling prices more aggressively, as signalled by a near-record rate of output cost inflation.... Despite this, firms seem unfazed by the challenges that the sector is currently facing remaining optimistic towards their 12-month outlook on growth in October. In fact, the degree of confidence accelerated from September and reached a nine-month high."
Looking ahead
Germany import prices, Swiss SECO consumer climate and SVME PMI, UK PMI manufacturing final will be featured in European session. Later in the day, US ISM manufacturing will take center stage while Canada will release PMI manufacturing.
AUD/USD Daily Report
Daily Pivots: (S1) 0.6368; (P) 0.6398; (R1) 0.6428; More...
AUD/USD recovered after drawing support from 0.6371, but stays below 0.6539 resistance. Intraday bias stays neutral first. On the upside, decisive break of 0.6535 resistance, and sustained trading above 55 day EMA (now at 0.6553), will raise the chance of medium term bottoming, and target 0.6680 support turned resistance next. On the downside, below 0.6371 minor support will turn bias back to the downside for retesting 0.6169 low instead.
In the bigger picture, down trend form 0.8006 (2021 high) is expected to continue as long as 0.6680 support turned resistance holds. Medium term momentum remains strong and retest of 0.5506 (2020 low) cannot be ruled out. But firm break of 0.6680 will be the first sign of reversal, and bring stronger rebound back to 0.7135 resistance.
Economic Indicators Update
| GMT | Ccy | Events | Actual | Forecast | Previous | Revised |
|---|---|---|---|---|---|---|
| 21:45 | NZD | Building Permits M/M Sep | 3.80% | -1.60% | ||
| 00:30 | JPY | Manufacturing PMI Oct F | 50.7 | 50.7 | 50.7 | |
| 01:45 | CNY | Caixin Manufacturing PMI Oct | 49.2 | 49 | 48.1 | |
| 03:30 | AUD | RBA Interest Rate Decision | 2.85% | 2.85% | 2.60% | |
| 07:00 | EUR | Germany Import Price Index M/M Sep | 0.60% | 4.30% | ||
| 08:00 | CHF | SECO Consumer Climate Q4 | -43 | -42 | ||
| 08:30 | CHF | SVME PMI Oct | 56 | 57.1 | ||
| 09:30 | GBP | Manufacturing PMI Oct F | 45.8 | 45.8 | ||
| 13:30 | CAD | Manufacturing PMI Oct | 49.2 | 49.8 | ||
| 13:45 | USD | Manufacturing PMI Oct F | 49.9 | 49.9 | ||
| 14:00 | USD | ISM Manufacturing PMI Oct | 50 | 50.9 | ||
| 14:00 | USD | ISM Manufacturing Prices Paid Oct | 53 | 51.7 | ||
| 14:00 | USD | ISM Manufacturing Employment Index Oct | 48.7 | |||
| 14:00 | USD | Construction Spending M/M Sep | -0.50% | -0.70% |
Technical Outlook and Review
USD/JPY:
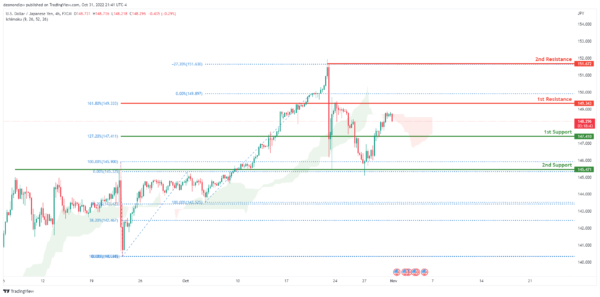
The current general bias for USDJPY on the H4 chart is bullish. Overnight, USDJPY had some bearish momentum downwards. Price is currently trading above the support at 147.710 at time of writing. If this bullish momentum continues, expect USDJPY to head upwards and retest the 1st resistance at 149.343 where the 161.8% Fibonacci extension line is located.
Areas of consideration:
- H4 time frame, 1st resistance at 149.343
- H4 time frame, 1st support at 147.410
DXY:
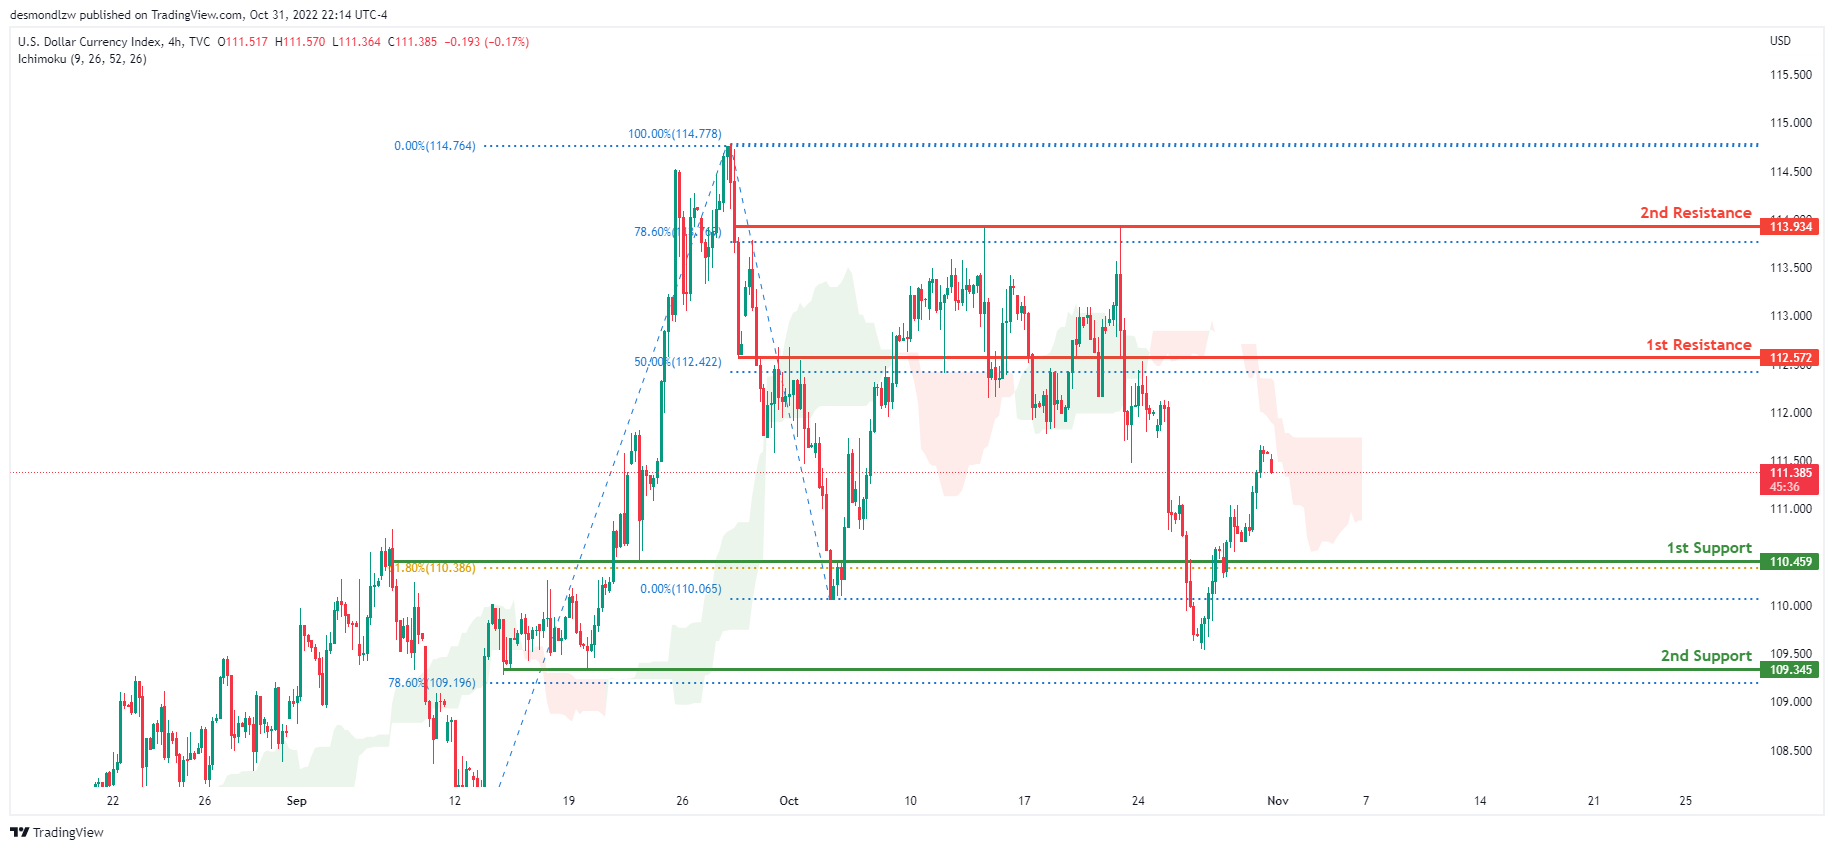
On the H4 chart, the overall bias for DXY is bearish. To add confluence to this, the price is below the Ichimoku cloud which indicates a bearish market. Overnight, DXY had bullish momentum upwards with the price currently trading at 111.377 at time of writing. If this bearish momentum continues, expect price to possibly head towards the 2nd support at 109.340, where the 78.6% Fibonacci line is located.
Areas of consideration:
- H4 time frame, 1st resistance at 112.572
- H4 time frame, 1st support at 110.459
EUR/USD:
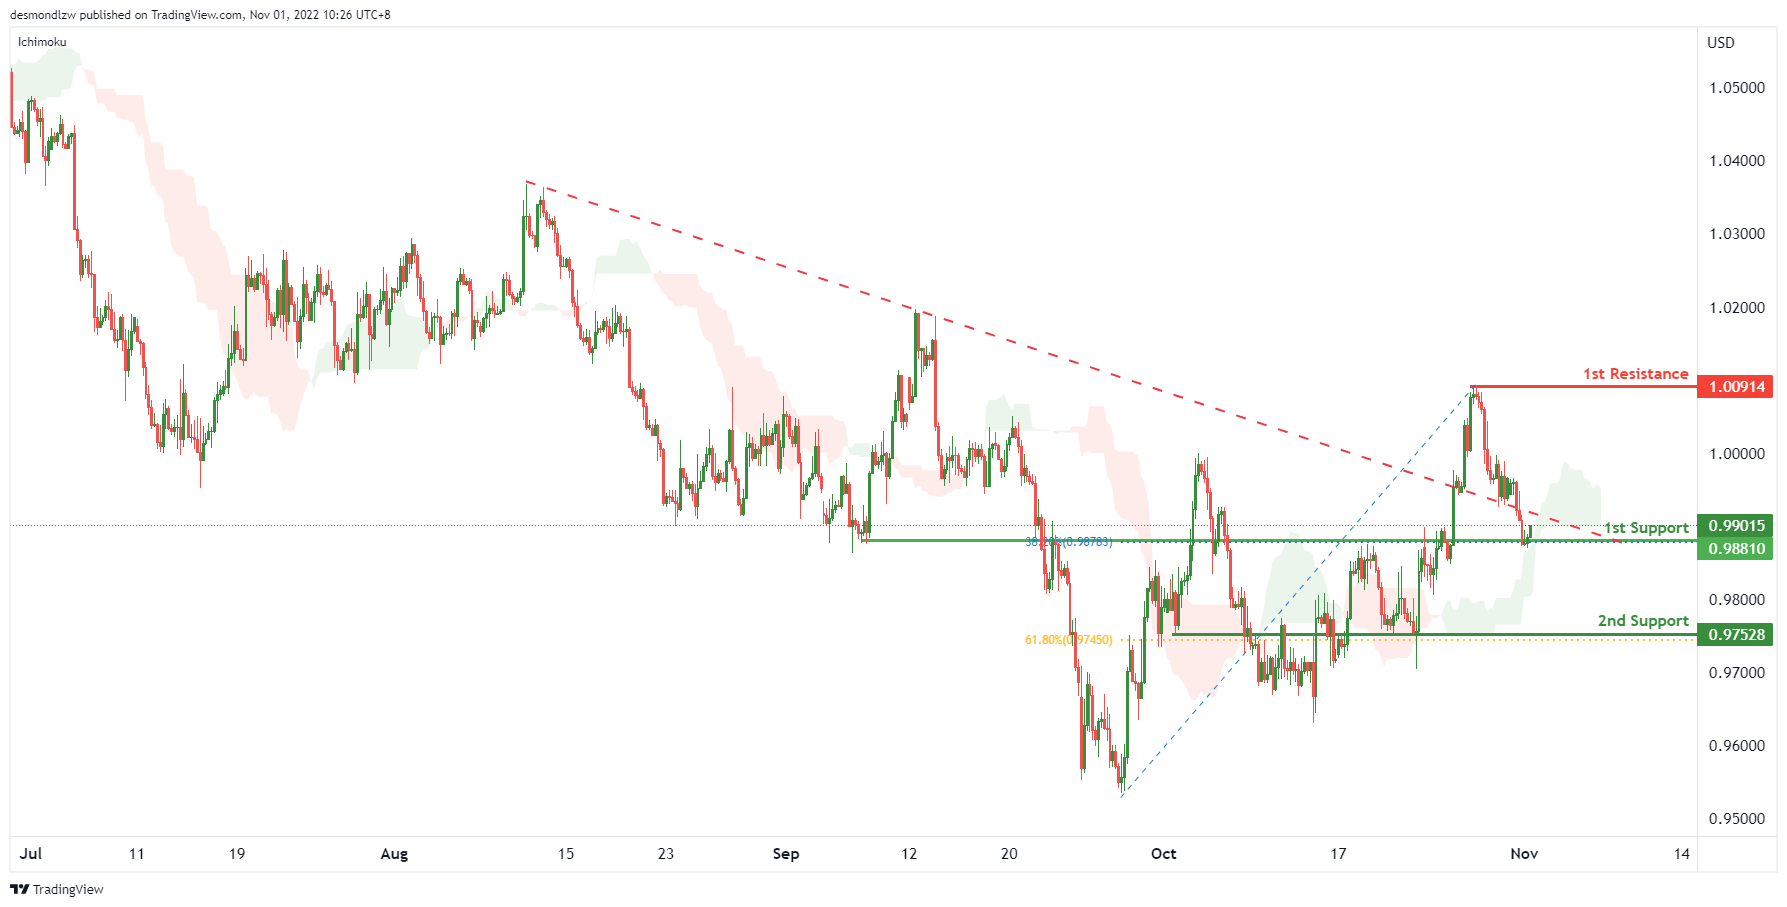
On the H4, with the price dropping back to the long term descending trendline, the price may break the 1st support at 0.98810, which is in line with the 38.2% fibonacci retracement and overlap support. If the 1st support is broken, the price may drop to the 2nd support at 0.97528, where the 61.8% fibonacci retracement and overlap support are. Alternatively, as the price is still above ichimoku cloud, we can expect the price bounce off from the 1st support and rise to the 1st resistance at 1.00914, which is in line with the previous swing high.
Areas of consideration :
- H4 1st support at 0.98810
- H4 2nd support at 0.97528
GBP/USD:
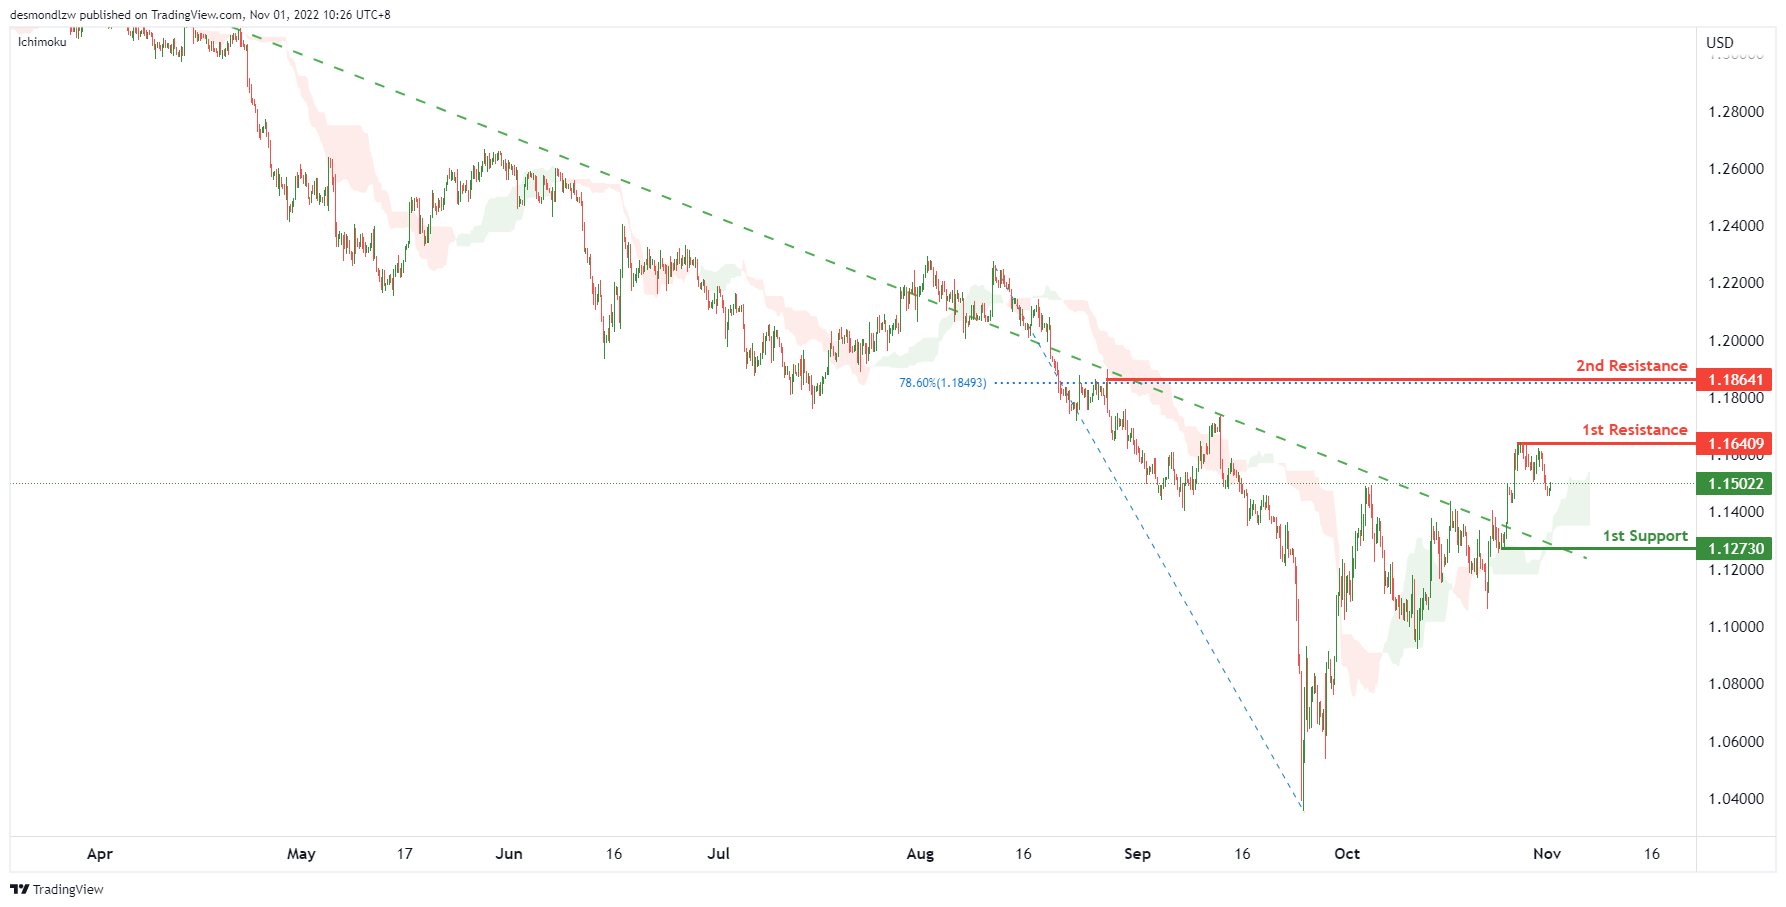
On the H4, price is above the ichimoku cloud and breaking the descending trendline, we have a bullish bias that the price may test the 1st resistance at 1.16409, which is in line with the previous swing high. If the 1st resistance is broken, the 2nd resistance is at 1.18641, where the 78.6% fibonacci retracement sits. Alternatively, the price may drop to the 1st support at 1.12730, where the swing low support is.
Areas of consideration:
- H4 current price
- H4 1st resistance at 1.16409
USD/CHF:
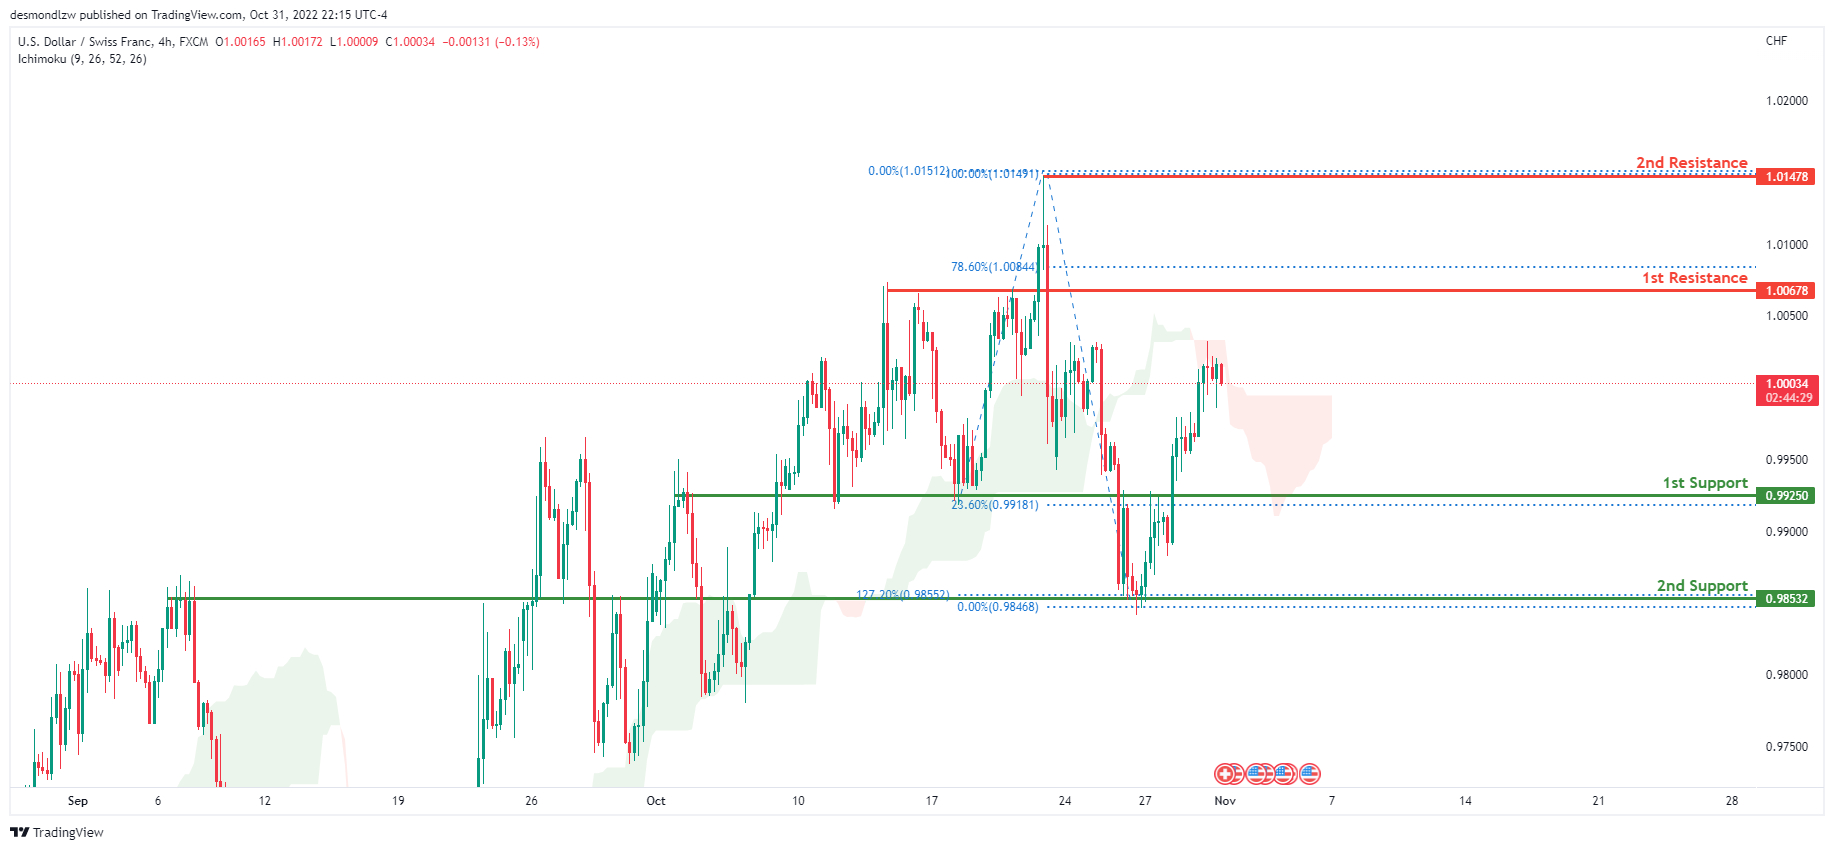
On the H4 chart, the overall bias for USDCHF is bearish. To add confluence to this, the price is below the Ichimoku cloud which indicates a bearish market. Overnight, USDCHF had some bullish momentum upwards with price currently trading at 1.00045 at time of writing. Expecting price to possibly head back up to retest the 1st resistance line at 1.00678 where the 78.6% Fibonacci line is located.
Areas of consideration
- H4 1st support at 0.99250
- H4 2nd support at 0.98532
- H4 1st resistance at 1.00678
XAU/USD (GOLD):
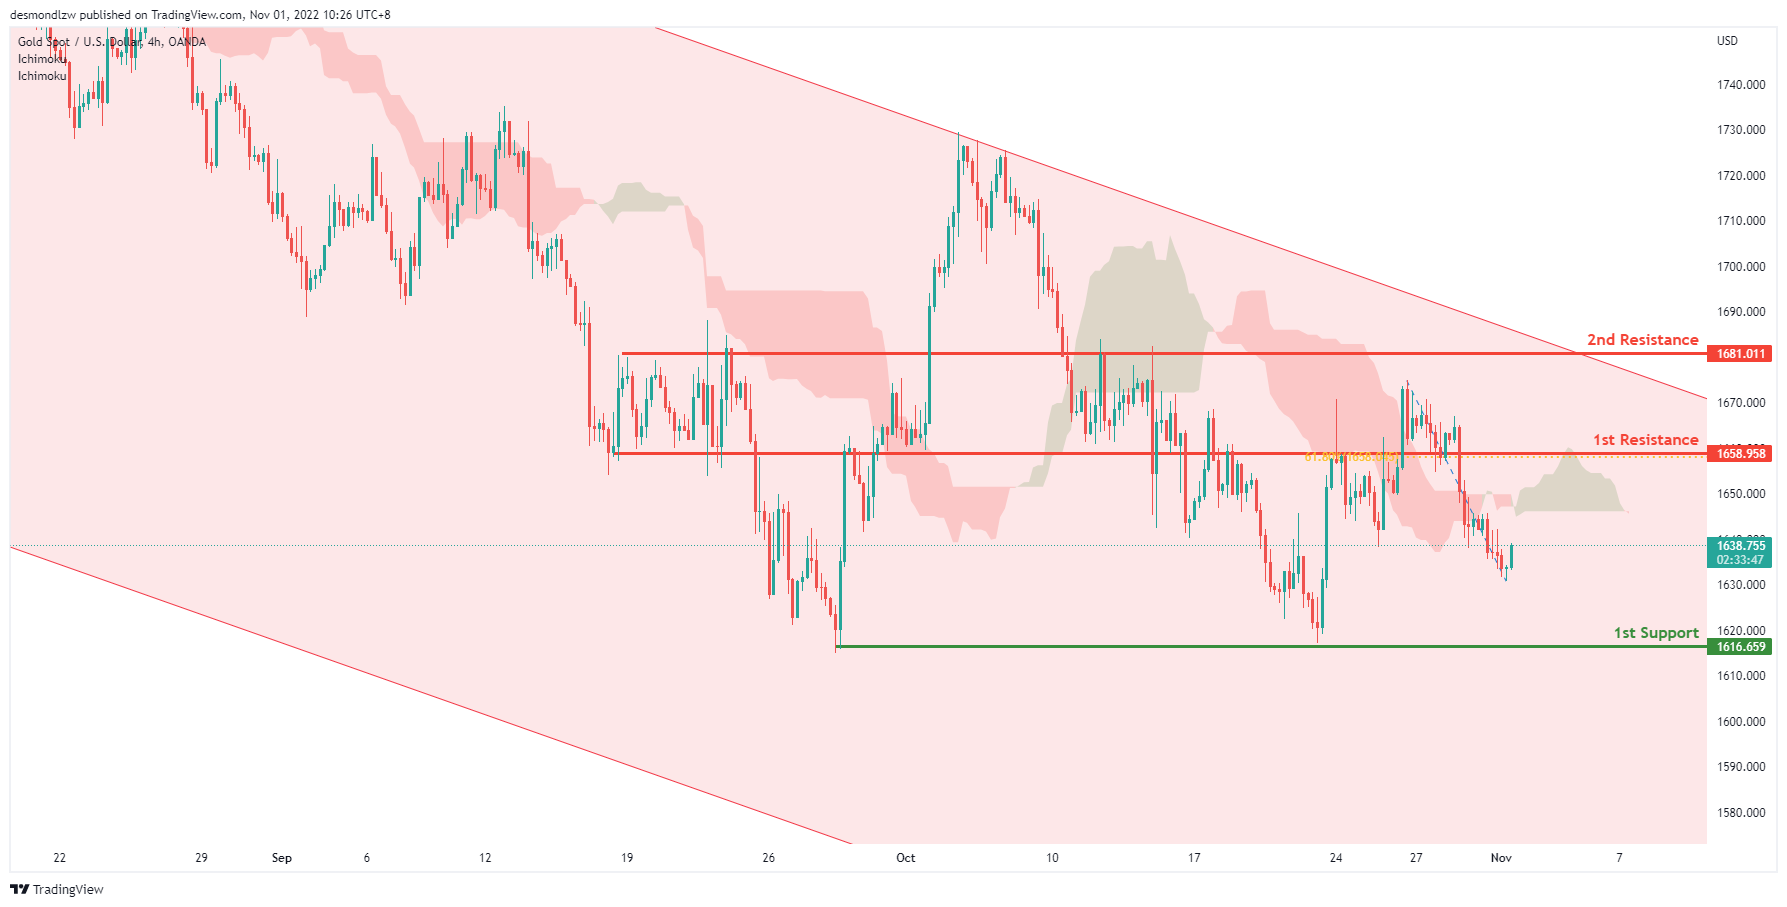
On H4, with the price within the descending channel and crossing ichimoku cloud, we have a bearish bias that the price may drop to the 1st support at 1616.659, where the previous swing lows are. Alternatively, the price may rise to retest the 1st resistance at 1658.958, which is in line with the 61.8% fibonacci retracement and overlap resistance. If the 1st resistance is broken, the 2nd resistance is at 1681.011, where the previous swing highs are
Areas of consideration:
- H4 time frame, 1st support at 1616.659
- H4 time frame, 1st resistance at 1658.958
AUD/USD:
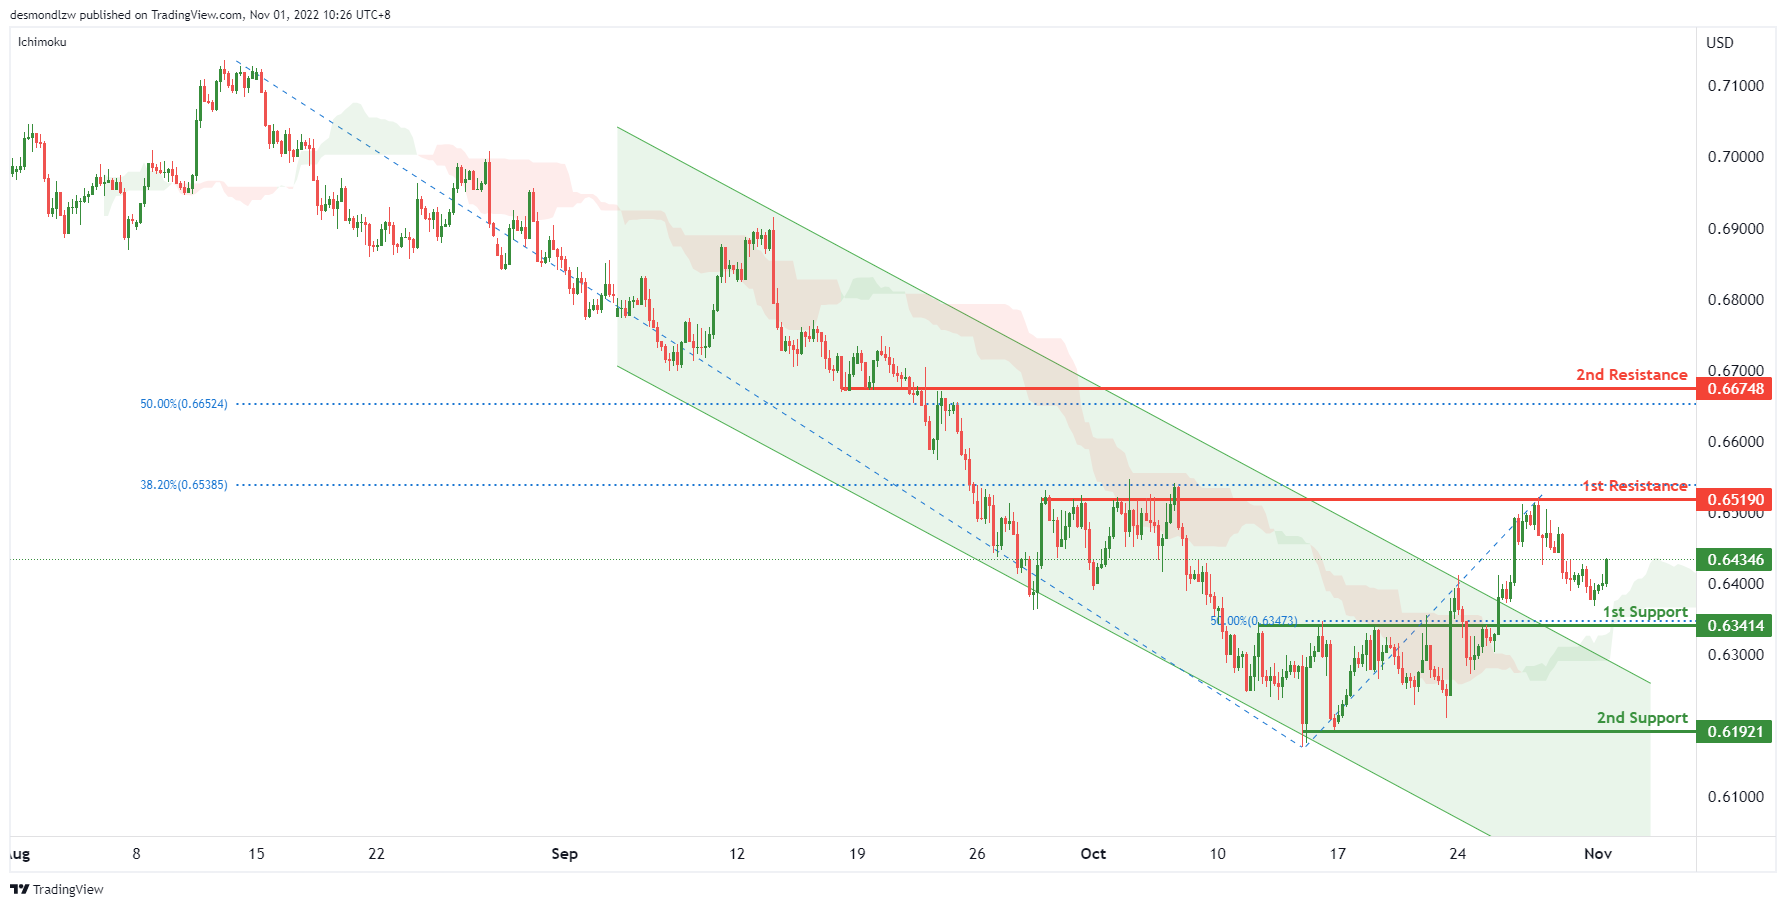
On the H4, with the price breaking the descending channel and above ichimoku cloud, we have a bullish bias that the price may retest the 1st resistance at 0.65190, which is in line with the overlap resistance, if the 1st resistance is broken, the 2nd resistance is at 0.66748, where the 50% fibonacci retracement is. Alternatively, the price may drop to the 1st support at 0.63414, which is in line with the 50% fibonacci retracement. If the 1st support is broken, the price may drop to the 2nd support at 0.61921, where the previous swing low is.
Areas of consideration
- H4, 1st resistance at 0.65190
- H4, 1st support at 0.63414
NZD/USD:
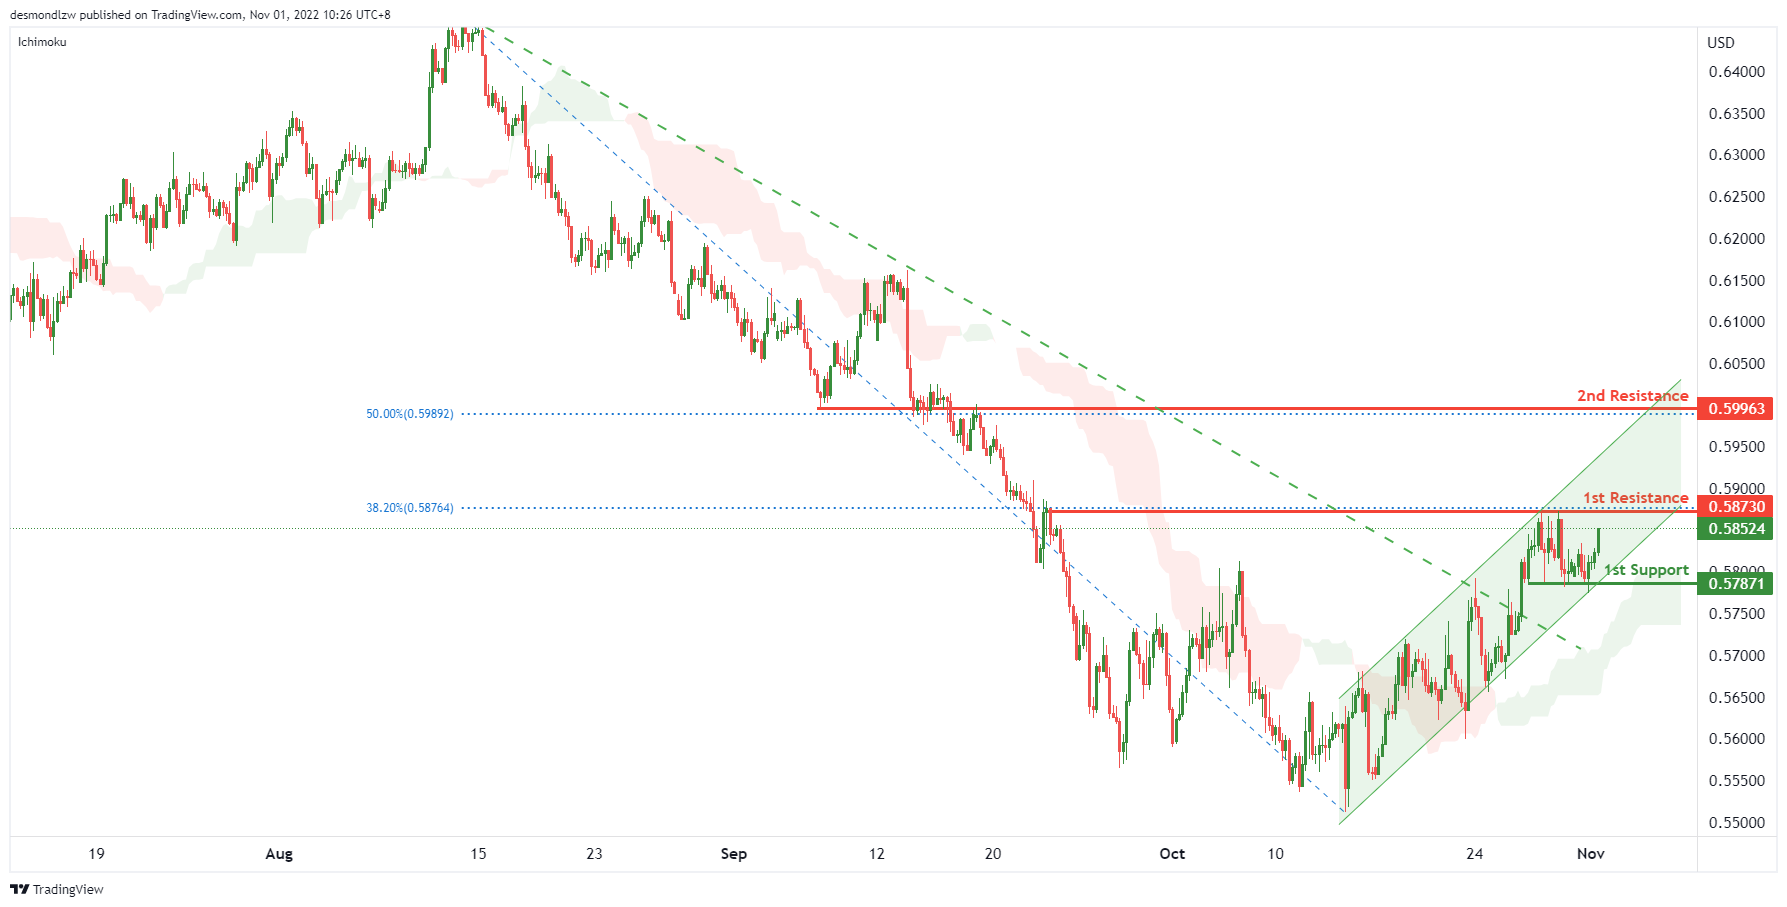
On the H4 chart, as the price is breaking the descending trendline, moving within the ascending channel and the price is above ichimoku cloud, we have a bullish bias that the price may rise to the 1st resistance at 0.58730, which is in line with the previous swing high and 38.2% fibonacci retracement. If the 1st resistance is broken, the 2nd resistance is at 0.59963, where the 50% fibonacci retracement is. Alternatively, the price may drop to the 1st support at 0.57871, where the previous swing lows and 50% fibonacci retracement are.
Areas of consideration:
- H4 time frame, 1st resistance at 0.58730
- H4 time frame, 2nd resistance at 0.59963
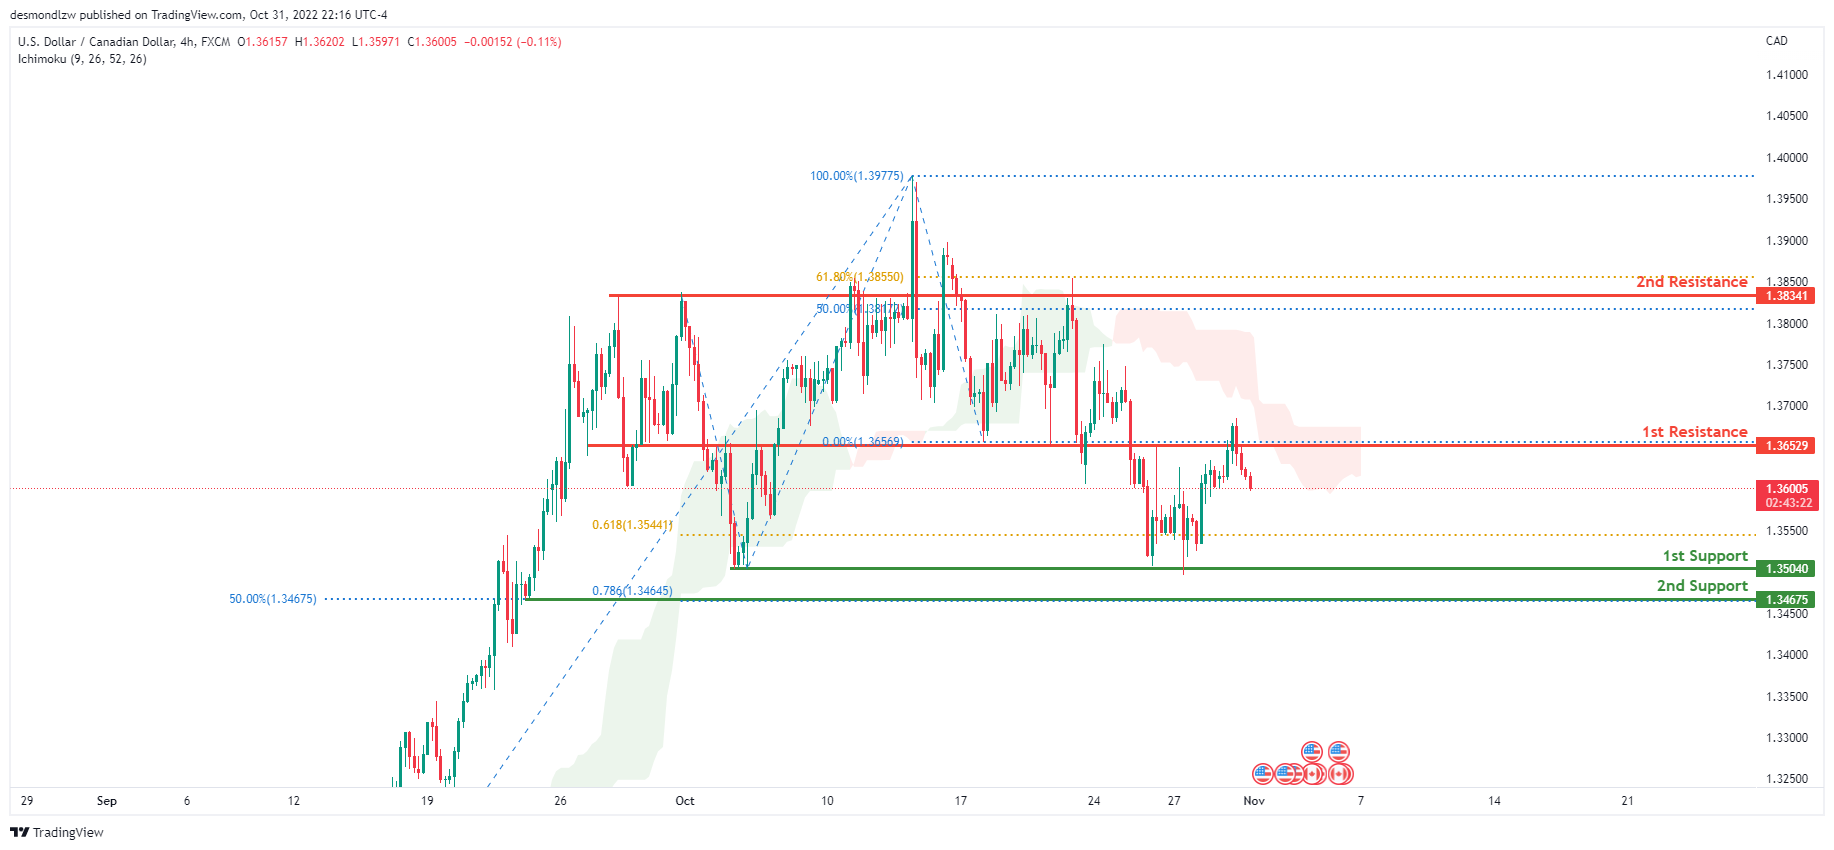
USD/CAD:
On the H4 chart, the overall bias for USDCAD is bearish. To add confluence to this, the price is below the Ichimoku cloud which indicates a bearish market. Overnight, price reflected off the 1st resistance at 1.36751 where the 0% fibonacci line is located. If this bearish momentum continues, the price to head towards the 1st support at 1.35040 where the previous swing low and 61.8% Fibonacci projection line is located.
Areas of consideration:
- H4 time frame, 1st resistance at 1.36751
- H4 time frame, 1st support at 1.35029
- H4 time frame, 2nd support at 1.34675
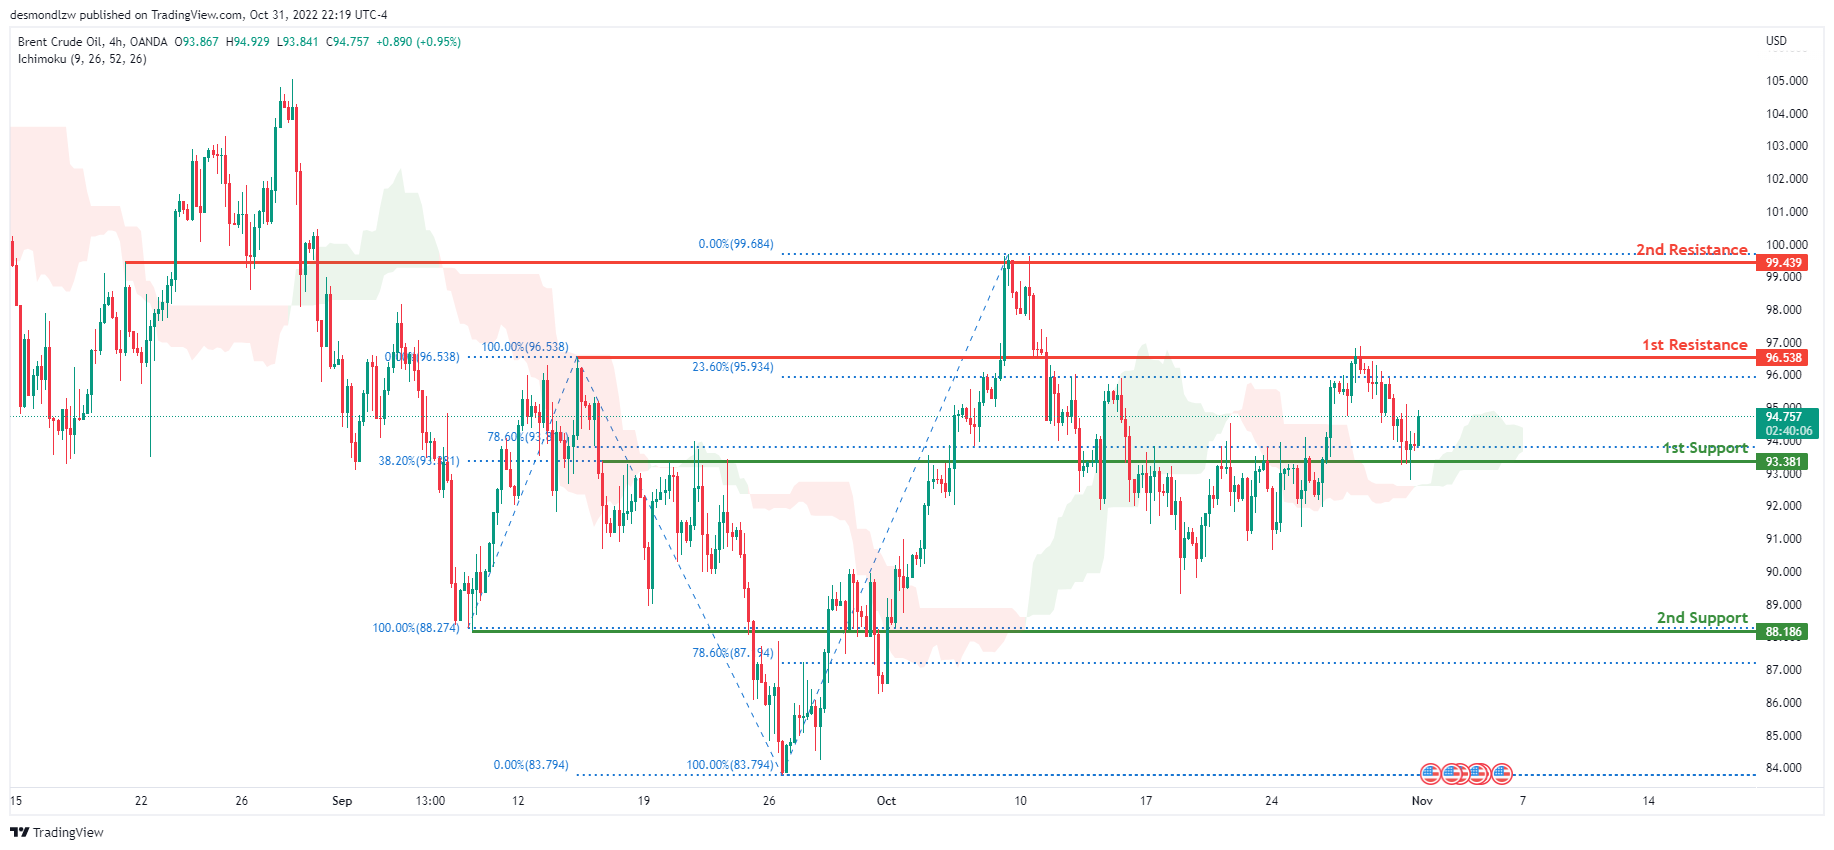
OIL:
Looking at the H4 chart, the current overall bias for Oil is bullish. To add confluence to this, the price is above the Ichimoku cloud which indicates a bullish market. Overnight, price reflected off the 1st support line at 93.381 where the 78.6% and 38.2% Fibonacci lines are located. If this bullish momentum continues, expect price to possibly break above the 1st resistance at 96.538 where the 100% and 23.6% Fibonacci lines are and head towards the 2nd resistance at 99.439 where previous swing high and 0% Fibonacci line is located.
Areas of consideration:
- H4 time frame, 1st resistance at 93.381
- H4 time frame, 2nd resistance at 99.439
- H4 time frame, 1st support at 93.381
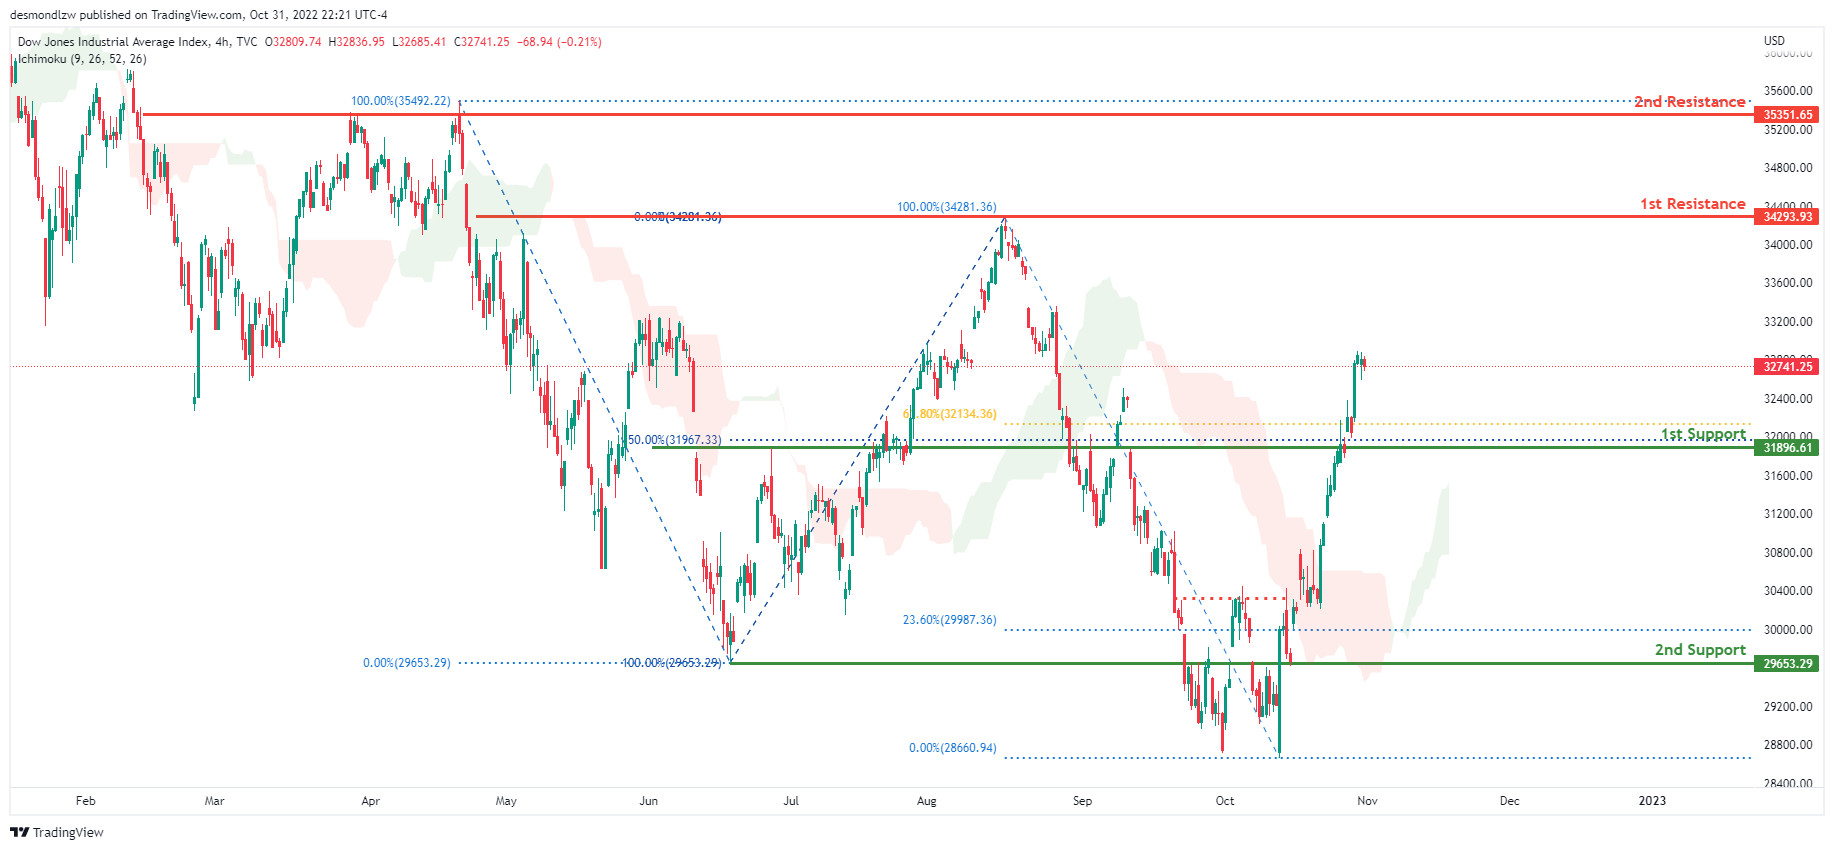
Dow Jones Industrial Average:
On the H4 chart, the overall bias for DJI is bullish. To add confluence to this, the price is above the Ichimoku cloud which indicates a bullish market. Overnight, DXY consolidated around the area of 32741.25. If this bullish momentum continues, expect the price to possibly head towards the 1st resistance at 34293.93 where the previous swing high and 100% Fibonacci line is located.
Areas of consideration:
- H4 time frame, 1st support at 31896.61
- H4 time frame, 1st Resistance at 34293.93
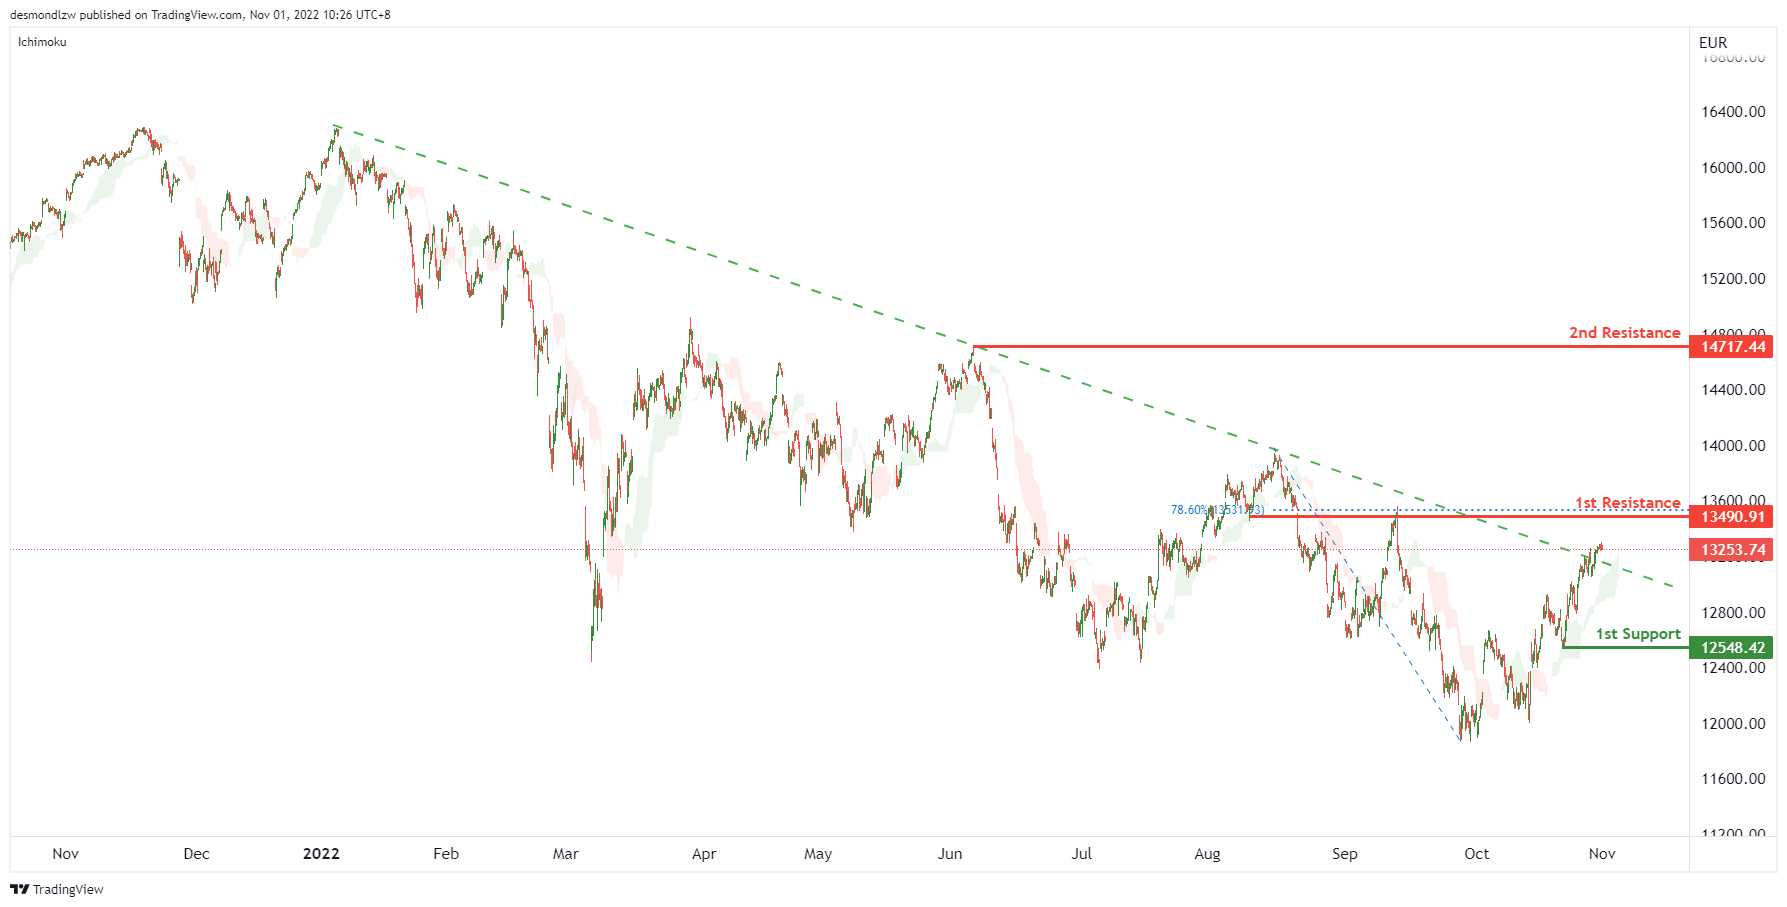
DAX:
On the H4 chart, the price has now closed above the Ichimoku cloud which indicates a breakout of a descending trendline. Expecting price to possibly continue this bullish momentum and head towards the 1st resistance at 13490.91, where the 78.6% Fibonacci line is located. If the 1st resistance is broken, the 2nd resistance could be at 14717.44, which is in line with the previous swing high. Alternatively, the price may drop to the 1st support at 12548.42, which is in line with the swing low.
Areas of consideration:
- H4 time frame, 1st resistance at 13490.91
- H4 time frame, 2nd resistance at 14717.44
ETHUSD:
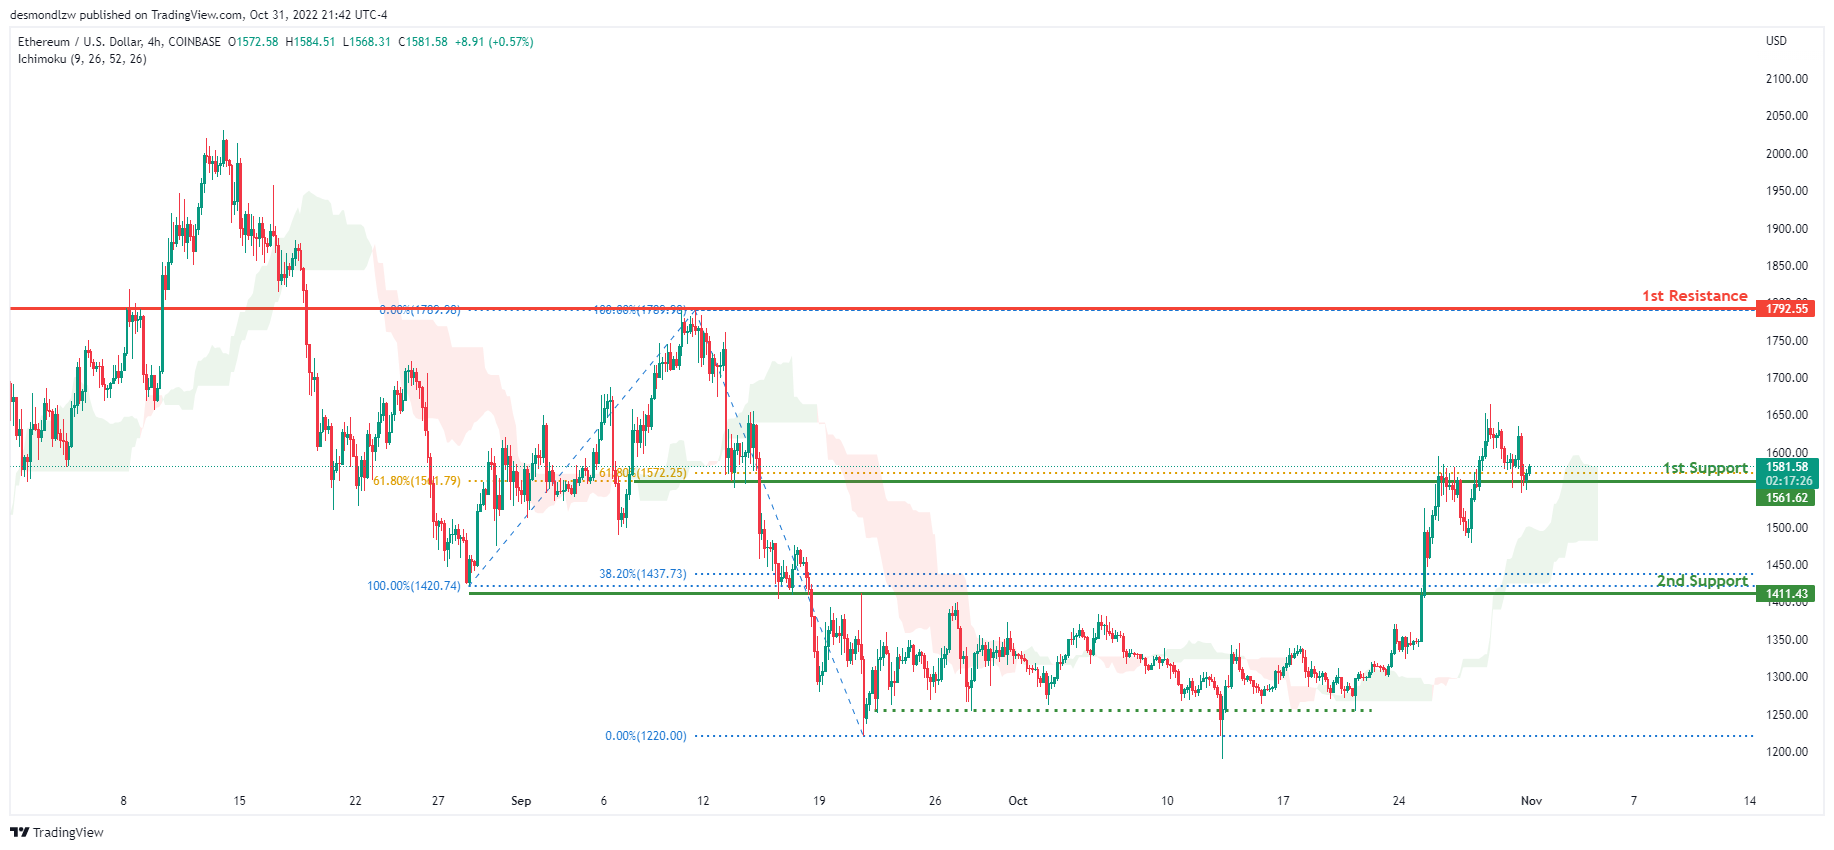
Looking at the H4 chart, the current overall bias for ETHUSD is bullish. To add confluence to this, the price is above the Ichimoku cloud which indicates a bullish market. Overnight, price had bearish momentum downwards with the price currently resting on the 1st support level at 1561.62 where 2 of the 61.8% Fibonacci lines are located. If this bullish momentum continues, expect the price to head towards the 1st resistance at 1792.55 where the previous swing high and 100% Fibonacci line is located.
Areas of consideration:
- H4 time frame, 1st resistance of 1792.55
- H4 time frame, 1st support at 1561.62
BTCUSD:
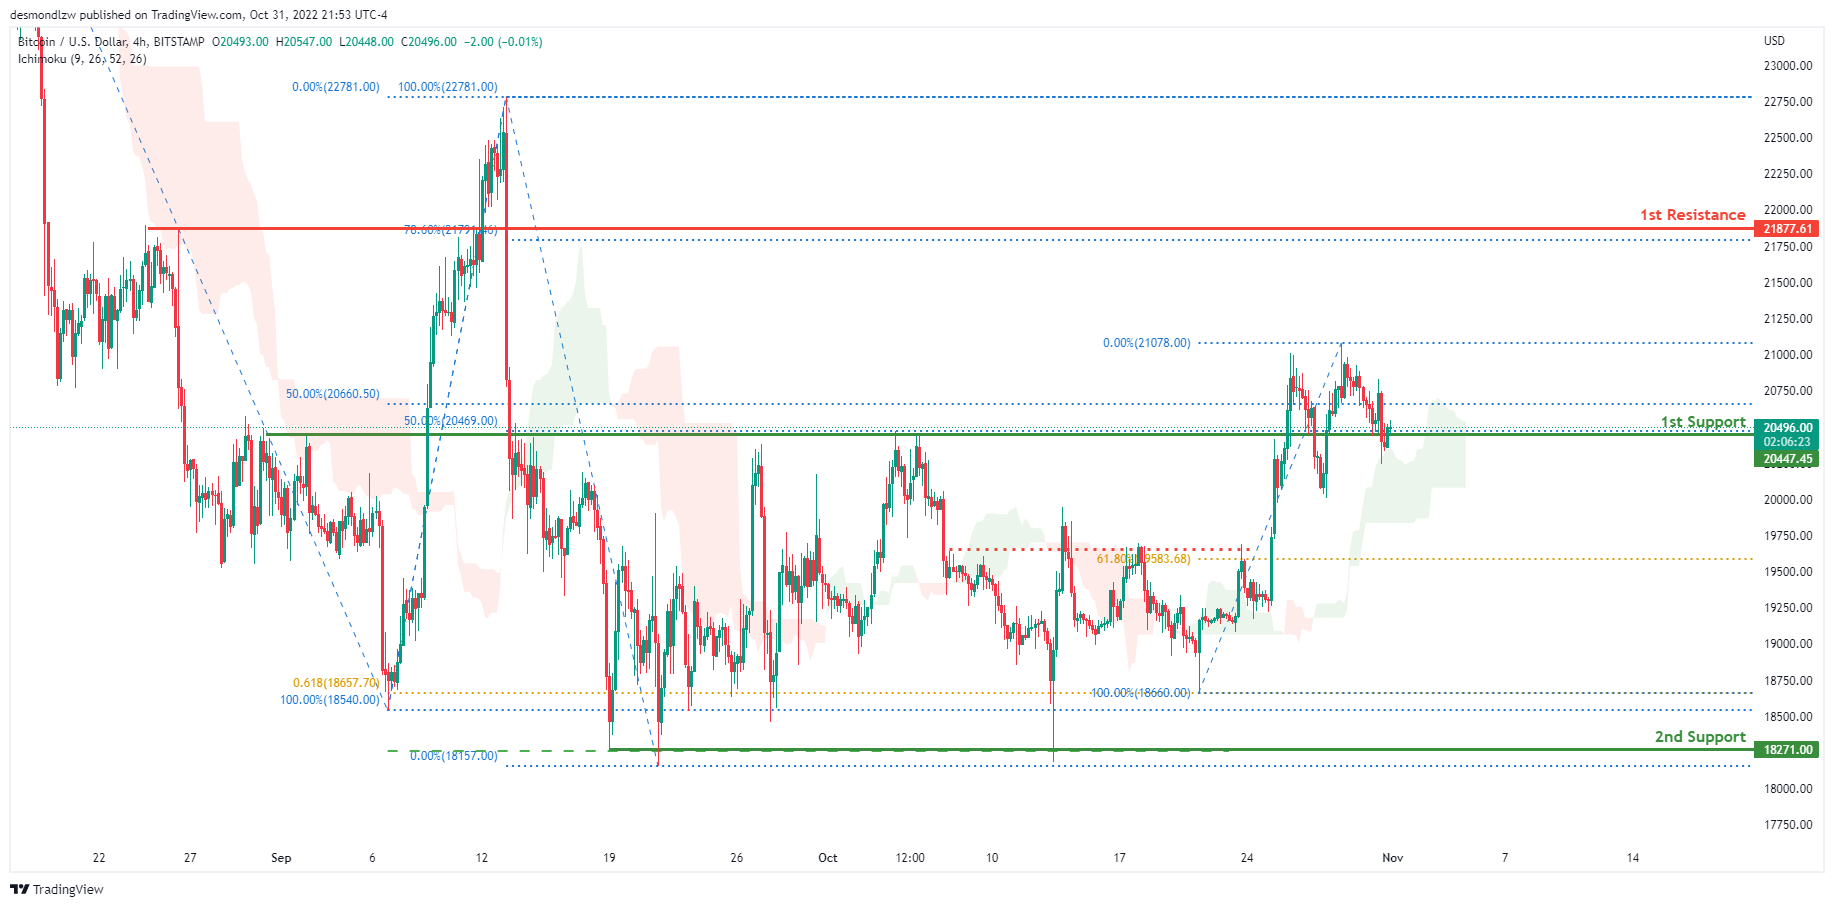
On the H4 chart, the overall bias for BTCUSD is bullish. To add confluence to this, the price is above the Ichimoku cloud which indicates a bullish market. Overnight, price retraced downwards and is currently resting on the 1st support at 20440.00 where the 2 of the 50% Fibonacci lines are located. If this bullish momentum continues, expect the price to head towards the 1st resistance at 21892.00, where the 78.6% Fibonacci line is located.
Areas of consideration:
- H4 time frame, 1st resistance 21892.00
- H4 time frame, 1st support at 20440.00
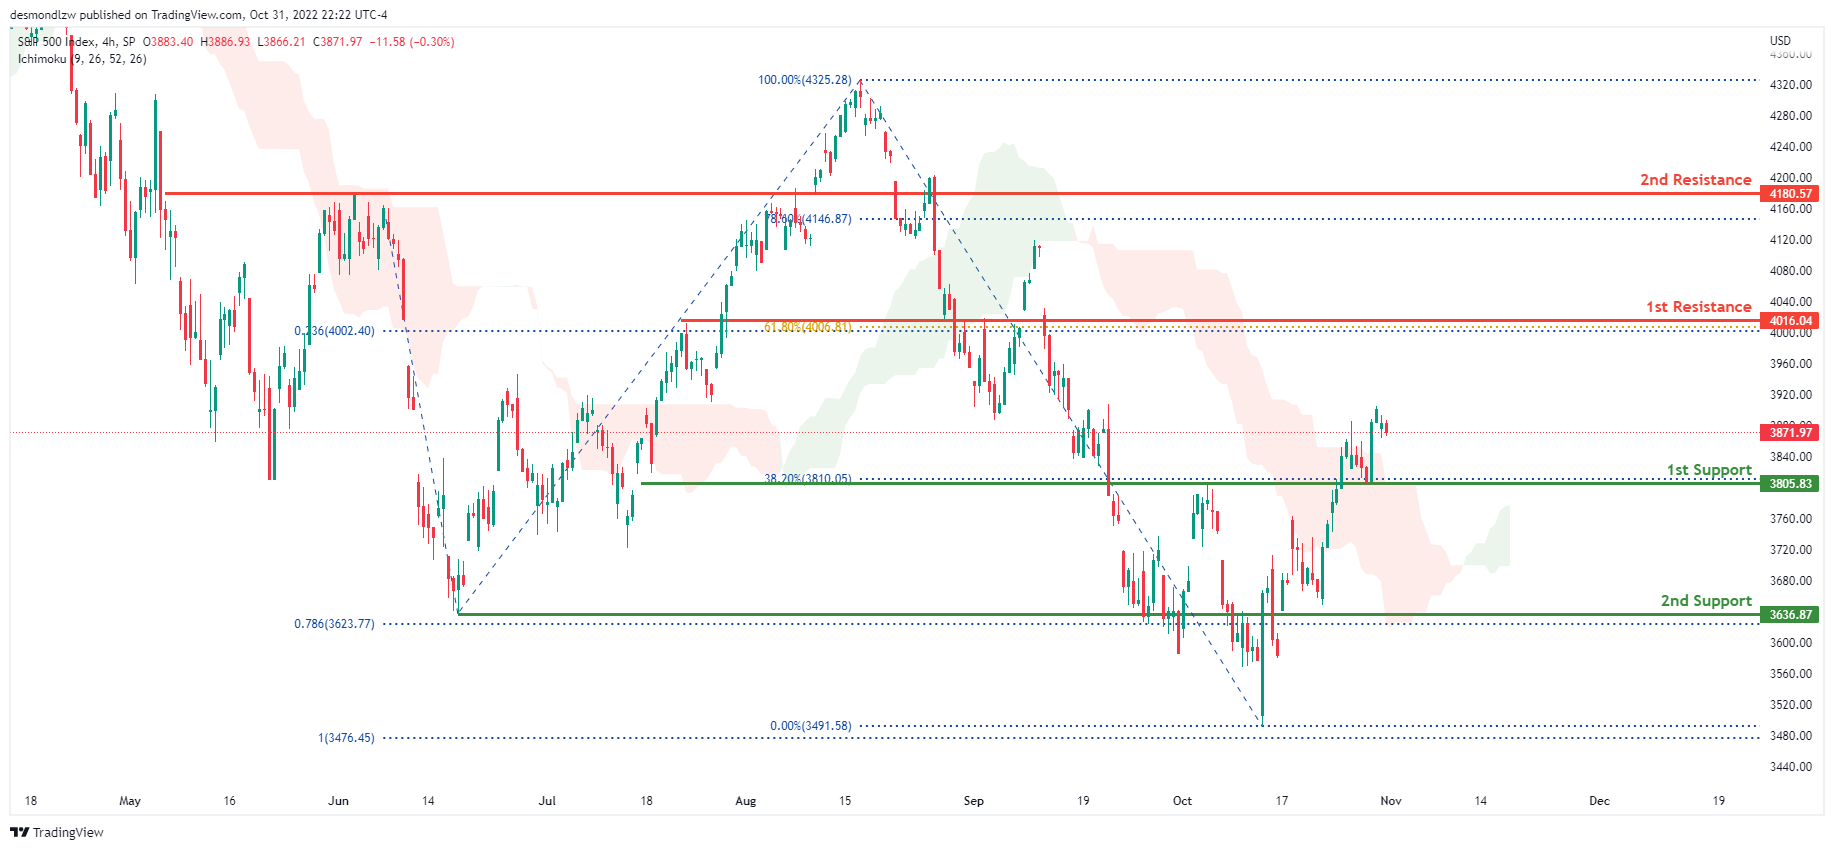
S&P 500:
On the H4 chart, the overall bias for S&P500 is bullish. To add confluence to this, the price is above the Ichimoku cloud which indicates a bullish market. Overnight, price continued to consolidate with price currently trading at 3871.97 at time of writing. If this bullish momentum continues, expect price to possibly head towards the 1st resistance at 4016.04 where the 61.8% Fibonacci line and 23.6% Fibonacci projection line is located.
Areas of consideration:
- H4 time frame, 1st support at 3805.83
- H4 time frame, 1st resistance at 4016.04