Sample Category Title
ISM Manufacturing stalls in October
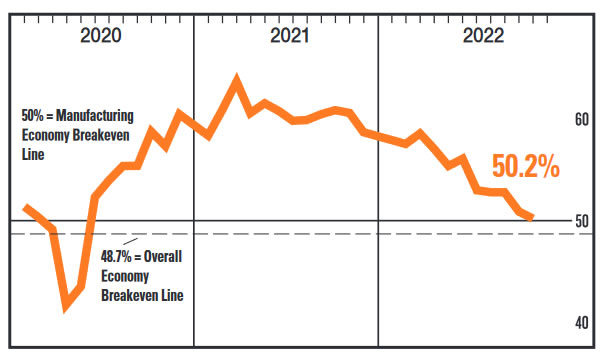
The October ISM manufacturing index registered 50.2, narrowly beating expectations of a 50.0 print. The index fell 0.7 percentage points from the September's reading of 50.9.
New orders rose by 2.1 percentage points to 49.2, while new export orders fell 1.3 percentage points to 46.5.
The backlog of orders sub-index came in at 45.3, falling 5.6 percentage points from September's 50.9 print.
The production and employment indexes rose 1.7 and 1.3 percentage points, respectively, to 52.3 and 50.0.
The supplier deliveries sub-index fell to 46.8 from 52.4 in September.
Eight of 18 manufacturing industries reported growth in October. Growth was led by Apparel, Leather & Allied Products; Nonmetallic Mineral Products; Machinery; Petroleum & Coal Products; and Transportation Equipment.
Key Implications
The ISM manufacturing index just managed to stay above the expansionary reading of 50 that signifies growth in October. Beneath the headline figure, the details of the report show a manufacturing sector slowing rapidly. New orders have now contracted in four of the past five months, while new export orders have fallen for three months in a row. The silver lining to the falling demand is that manufacturers have been able to improve supply-side conditions. Order backlogs fell for the first time since June 2020 while supplier delivery times accelerated – a first since 2016.
There is nothing in the October ISM that will dissuade the Fed from its current path. Softening demand is what the FOMC has been hoping to achieve since it set off on its rate hiking cycle and this month's report shows that it's working. Moreover, with more hikes on the way, goods demand should moderate further in the coming months, unwinding some of its spectacular rise over the past two years.
XAU/USD: Gold Eyes Fed’s Decision for Direction Signal
Spot gold price jumped on Tuesday, lifted by weaker dollar on the latest speculations that the Fed may temper its aggressive policy stance from next month.
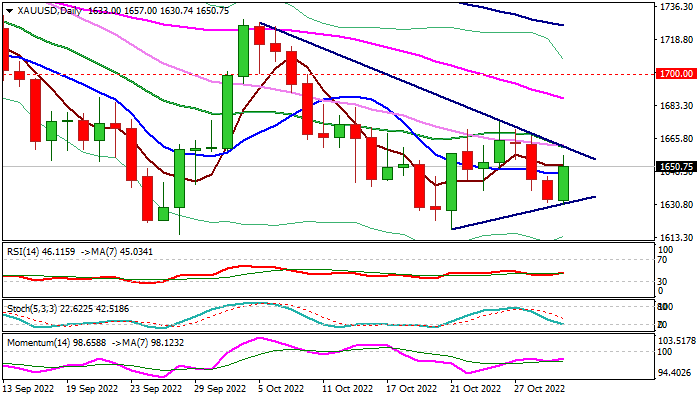
The yellow metal advanced around 1.2% since opening in Asia and retraced over 50% of the recent $1674/$1630 bear-leg, although daily studies remain bearishly aligned as 14-d momentum is in negative territory and MA’s predominantly in bearish setup.
The minimum requirement for fresh bulls will be a close above $1647 (10DMA / Fibo 38.2% of $1674/$1630 bear-leg) with more evidence of positive developments expected on violation of pivots at $1658/62 (Fibo 61.8%/falling 20DMA).
Fed’s decision on conclusion of two-day policy meeting on Wednesday will be a key for gold’s near-term direction.
The central bank is likely to deliver another 75 basis points hike on Wednesday, but signals about their next steps will be crucial.
In hawkish scenario, with extended aggressive stance by the Fed, the metal would lose ground and attack at a temporary base at $1614/17 double-bottom, loss of which would risk test of psychological $1600 level and possible extension below here.
On the other side, recovery may accelerate and attack key near-term barrier at $1674 (Oct 26 lower top), break of which would open way for stronger recovery on completion of failure swing pattern on daily chart.
Res: 1660; 1630; 1673; 1686.
Sup: 1643; 1630; 1614; 1598.
US ISM manufacturing dropped to 50.2, prices decreasing for the first time since May 2020
US ISM Manufacturing PMI dropped slightly from 50.9 to 50.2 in October, a touch above expectation of 50.0. Looking at some details, new orders rose 2.1 to 49.2. Production rose 1.7 to 52.3. Employment rose 1.3 to 50.0. Supplier deliveries dropped -5.6 to 46.8. Inventories dropped -3.0 to 52.5. Prices dropped -5.1 to 46.6.
ISM noted that price index indicated decreasing prices for the first time since May 2020. Mentions of large-scale layoffs were absent from panelists' comments, indicating companies are confident of near-term demand. Overall, the PMI corresponds to a 0.5% annualized growth in real GDP.
Powell and NFP Release Will Crash USD
What will happen?
On November 2, the Federal Reserve will make an update on the interest rate and publish the Rate Statement with commentary on economic conditions that influenced their decision. According to the analysts, the Fed will come up with a 75-basis-points rate hike raising the rate to 4%.
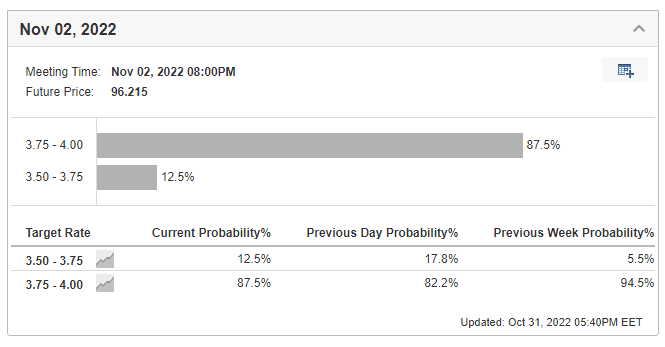
Markets are already pricing in this decision. Thus, all attention will be drawn to Powell's rhetoric regarding the next decision at the December 14 meeting. Currently, the chances of another 75-bps hike in December are estimated by the markets at 50.3%. Another 44.4% relates to a 50-point rate hike. Therefore, the Powell Speech can significantly turn the markets one way or another regarding the future actions of the Fed.
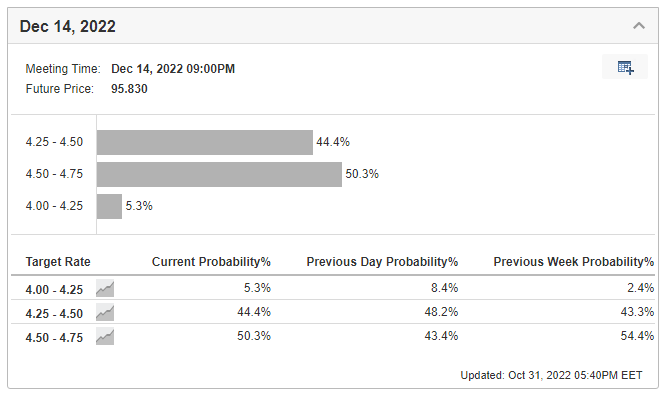
However, despite Powell's remarks, the main driver of dollar volatility will be the NFP and the CPI report on November 4 and November 10, respectively. This time, according to analysts' forecast, 200K new jobs are expected in October, against 260K a month earlier. These are rather low expectations. Therefore, as in previous times, the actual result may exceed expectations and boost the US dollar index in the short term. Nevertheless, we have to mention that the previous three times, the USD has fallen two days after the NFP release.
FBS analysts’ prediction
We expect the US dollar to stay under pressure until the CPI release on November 10. Jerome Powell might give a fresh breath to the stock and crypto markets ahead of the 2022 United States elections on November 8, where all 435 seats in the House of Representatives and 35 of the 100 seats in the Senate will be contested. Moreover, as recent history shows, NFP results might boost the greenback, but it usually falls after.
Thus, until the CPI release, we await a bullish rally in XAUUSD, EURUSD, GBPUSD, US100, US500, and crypto coins.
Technical analysis
US500, weekly timeframe
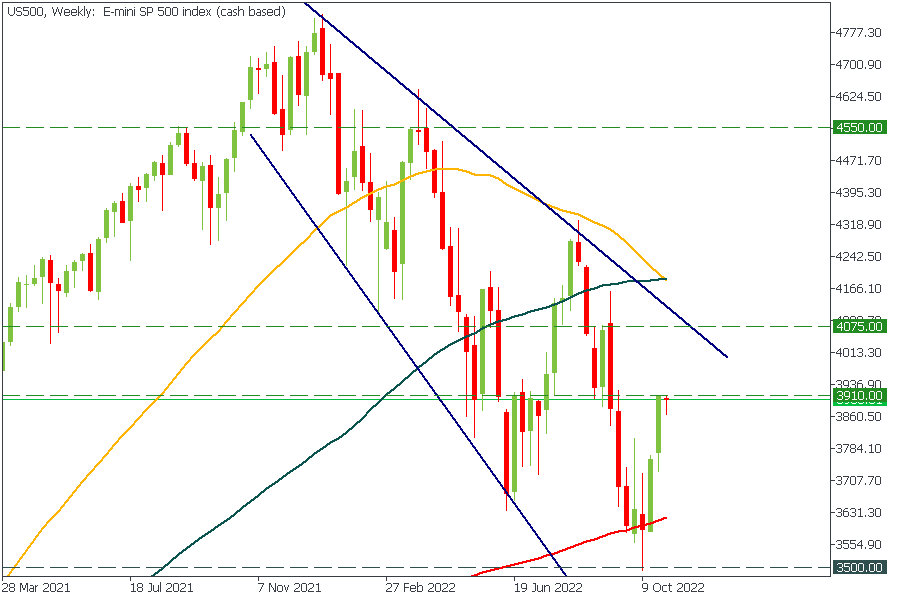
Buyers are trying to push the US500 index above the 3900 resistance. After the breakout, the way to 4075 will be open.
EURUSD, Daily timeframe
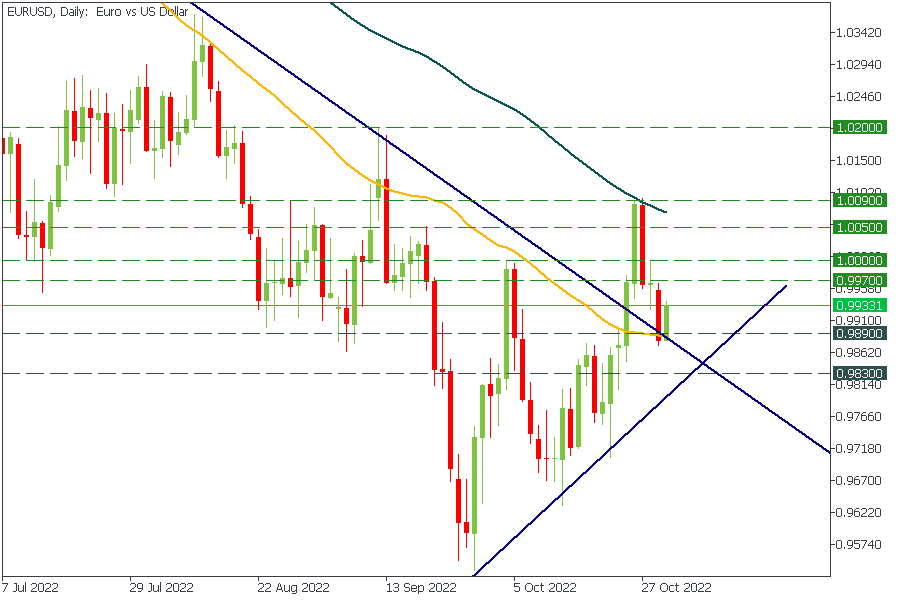
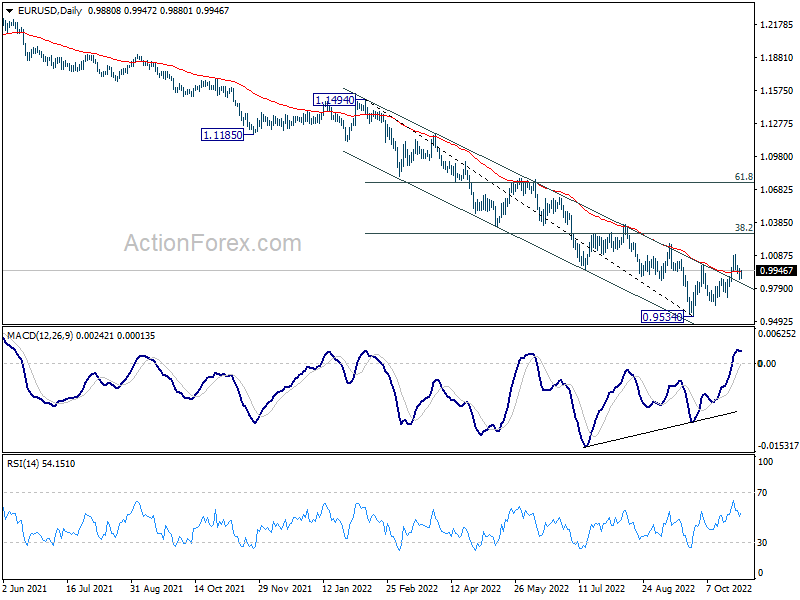
EURUSD broke above the descending trend line and the 50-day moving average. Moreover, at this moment, the price is testing this breakout, and it seems like the retest will be successful. We expect the pair to reverse toward the 100-day MA, which is currently moving between 1.0050 and 1.0090. Moreover, if the price breaks above this MA, it will move higher to 1.0200.
Gold About to Turn Up But Needs Confirmation from Fed
Gold retreated to $1633 by the start of this month, close to the lows of September and October, but gained about 1% surpassing $1650. We saw a similar buying spree the month before, and such buying activity looks like a reversal to the upside. However, in the current circumstances, it is better to wait for the price to surpass $1700, confirming a bullish reversal.
While central banks are signalling one after the other that they are decelerating their rate hikes, gold is enjoying ‘buying the dip’ behaviour, as some investors see the current prices at the bear market’s edge (-20% of the peak) as attractive for buying in the mid-to-long term.
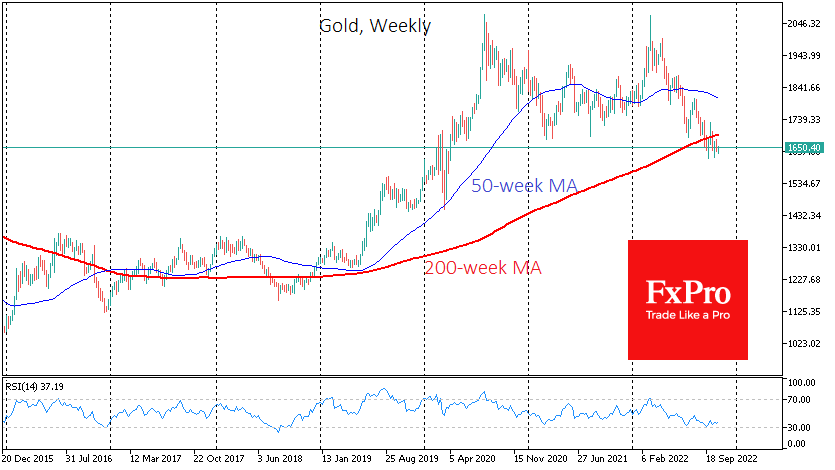
On the weekly charts, gold trades below its 200-week average, which is often a bearish sign. But experienced traders must have noticed that in 2016 and 2018, the price reached a local bottom about five weeks after falling below that line, just like now.
However, this is a case where waiting seems like a prudent tactic. On the technical analysis side, it is more sensible for medium-term buyers to wait for the price to return to the area above the 200-week average, surpassing $1700.
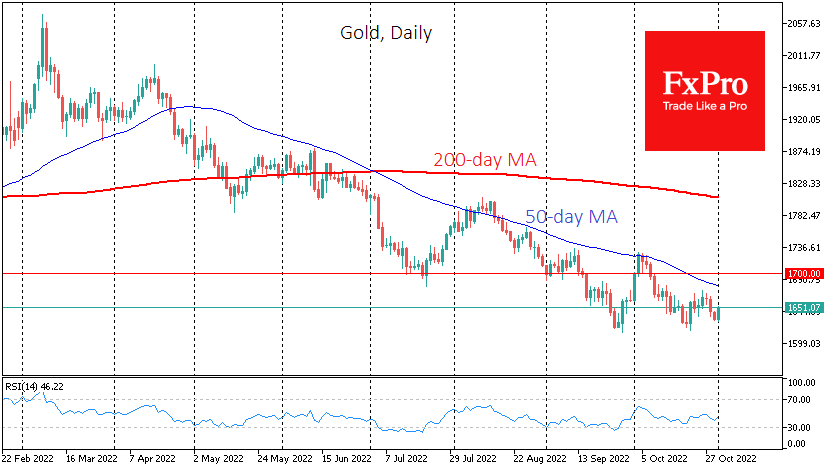
Also, long-term buyers of gold would be better off waiting for official signals from the Fed that it will lower the pace of rate hikes. Despite the reparations by the speakers and the media to soften the call, there is still a risk that it will not happen this coming Wednesday, as the Fed has already surprised many times with its hawkishness over the summer months.
Notwithstanding the risks noted above, in our view, the prevailing scenario is still a reversal in gold following a change in the degree of rhetoric. A similar reversal but in a different direction was in March 2022, when the Fed started to “surprise” the markets with increasingly hawkish rhetoric.
Aussie Jumps after RBA Hike
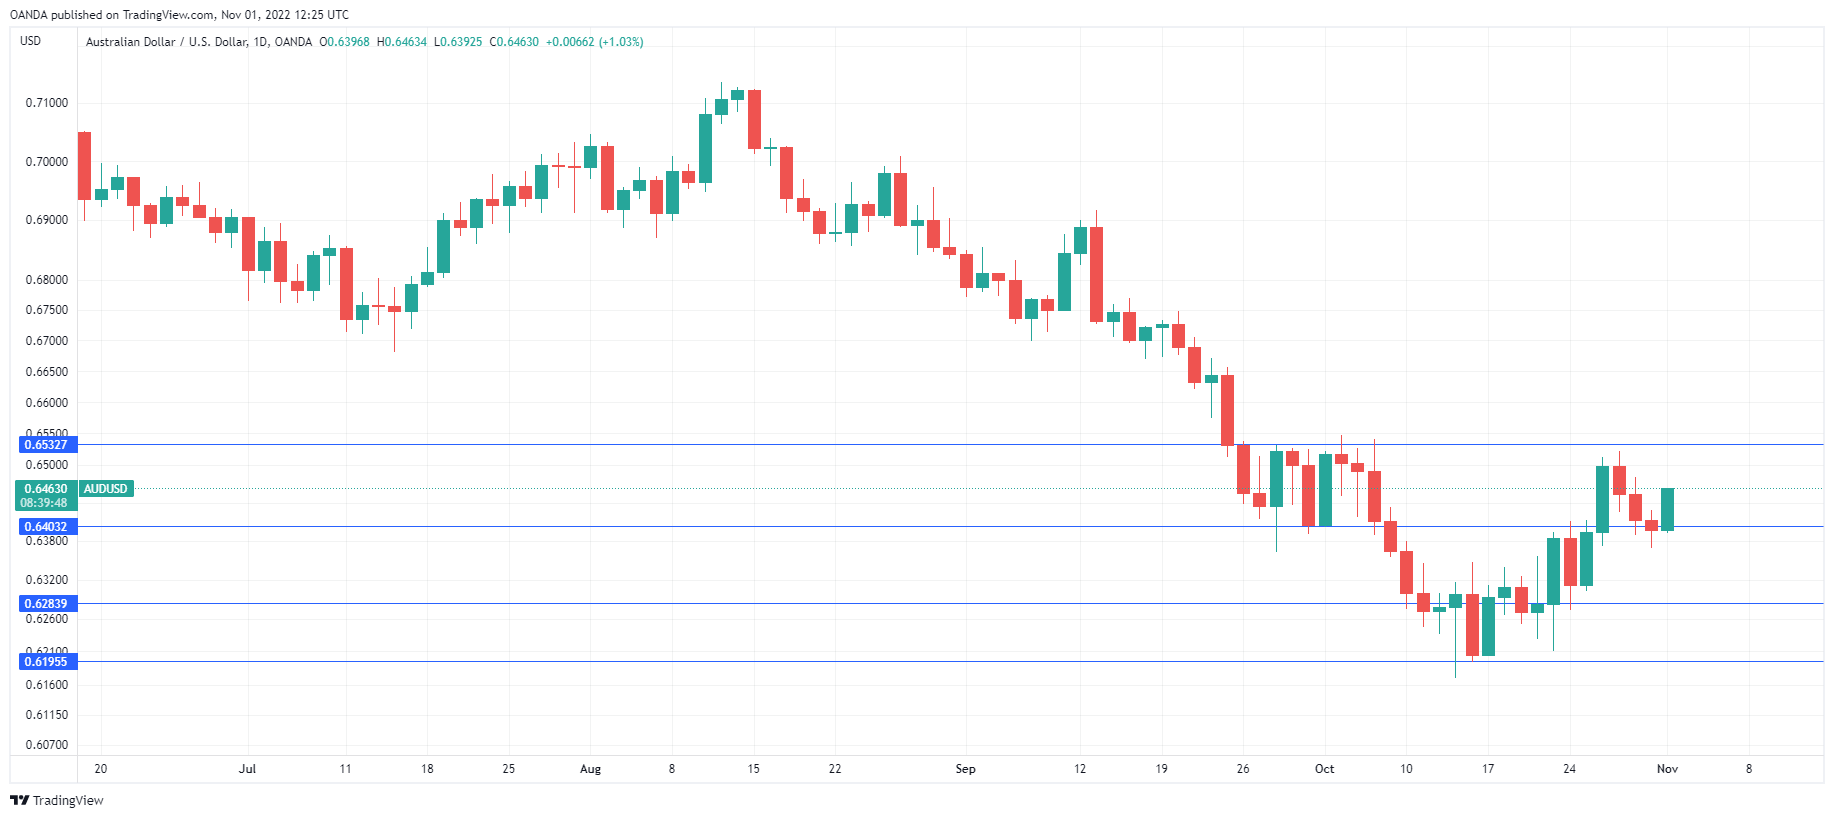
AUD/USD has put the brakes on a 3-day slide today and has posted sharp gains. In the European session, the Australian dollar is trading at 0.6449, up 0.81%.
RBA delivers modest 0.25% hike
As was widely expected, the Reserve Bank of Australia raised rates today by just 25 basis points to 2.85%. This move follows the 25 bp increase in September, which was lower than the markets expected. The cash rate is now at its highest level since April 2013, but the RBA is easing its foot off the rate pedal, despite inflation remaining stubbornly high. Investors appeared pleased with the move, as the Australian dollar has climbed sharply.
Inflation jumped to 7.3% in the third quarter, up sharply from 6.1% in Q2, as inflation has not shown any indication of peaking, despite the aggressive tightening cycle that the RBA started in May. The inflation data had some market observers predicting a 50 bp hike, as the RBA has made inflation its top priority, but in the end, policymakers opted for the smaller increase. The RBA may be concerned that rate increases take time to trickle throughout the economy and further oversize hikes could be extremely detrimental to economic growth.
The central bank has projected that inflation will peak at 7.5%, but if it is wrong and inflation hits 8% or higher, the RBA will have to backtrack and resort to rate hikes of 40 bp or higher in order to curb inflation. The RBA would like to continue with 25 bp hikes in the coming months, but that is contingent on inflation cooperating, which currently seems to be a very big “if”. The terminal rate is expected in the range of 3.35-3.6%, which means that the current rate-tightening cycle is expected to continue until early 2023.
AUD/USD Technical
- AUD/USD is testing resistance at 0.6403. Above, there is resistance at 0.6532
- There is support at 0.6283 and 0.6196
EUR/USD Mid-Day Outlook
Daily Pivots: (S1) 0.9849; (P) 0.9908; (R1) 0.9942; More...
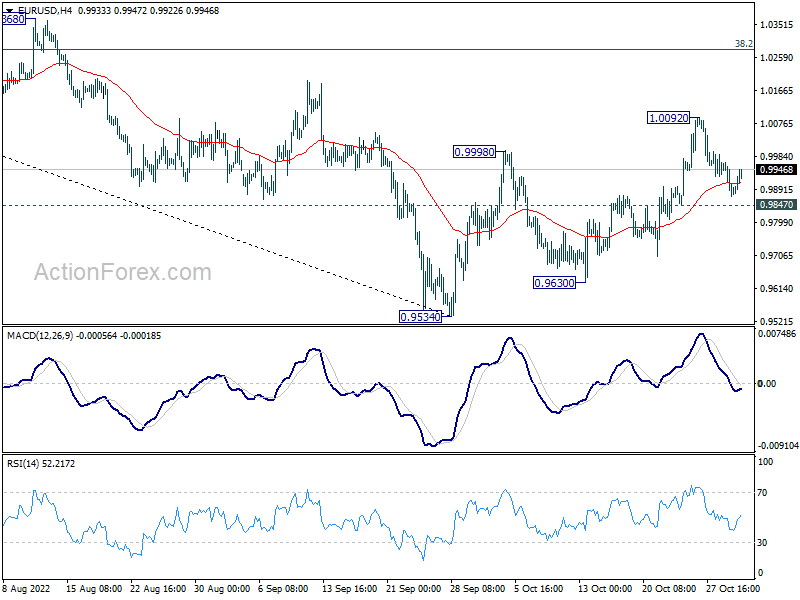
Intraday bias in EUR/USD stays neutral and outlook is unchanged. Further rise is in favor as long as 0.9847 minor support holds. Break of 1.0092 will target 38.2% retracement of 1.1494 to 0.9534 at 1.0283. However, break of 0.9847 will turn bias back to the downside for 0.9534/9630 support zone instead.
In the bigger picture, the case of medium term bottoming at 0.9534 building up, with bullish convergence condition in daily MACD. While it is too early to call for trend reversal, firm break of 0.9998 opens up stronger rebound back to 55 week EMA (now at 1.0630) even as a corrective rise. However, sustained trading back below 55 day EMA (now at 0.9938) will revive medium term bearishness for another fall through 0.9534 low.
USD/CHF Mid-Day Outlook
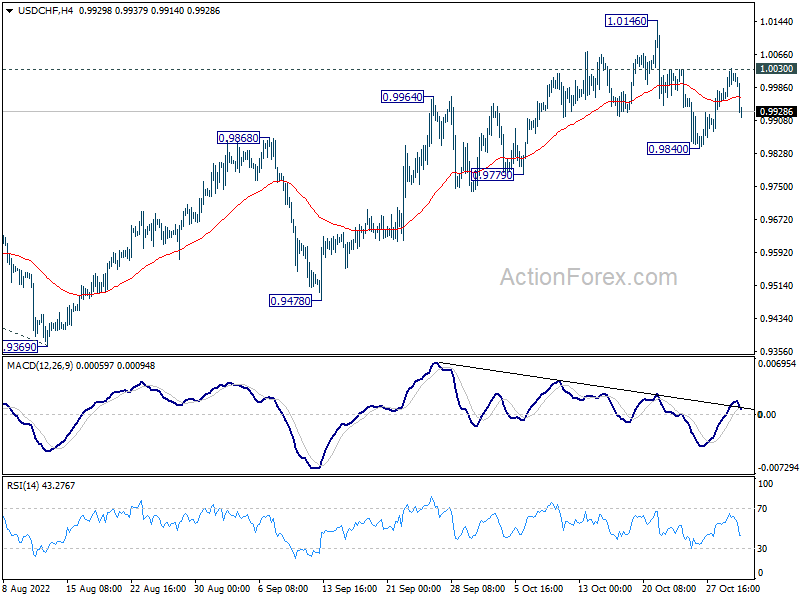
Daily Pivots: (S1) 0.9972; (P) 1.0003; (R1) 1.0047; More...
Intraday bias in USD/CHF remains neutral for the moment. On the upside, break of 1.0030 minor resistance will suggest that pull back from 1.0146 has completed at 0.9840. Bias will be back on the upside for retesting 1.0146. Firm break there will resume larger up trend to 1.0283 projection level. However, break of 0.9840 support will now be a sign of reversal, and bring deeper decline back to 0.9779 support instead.
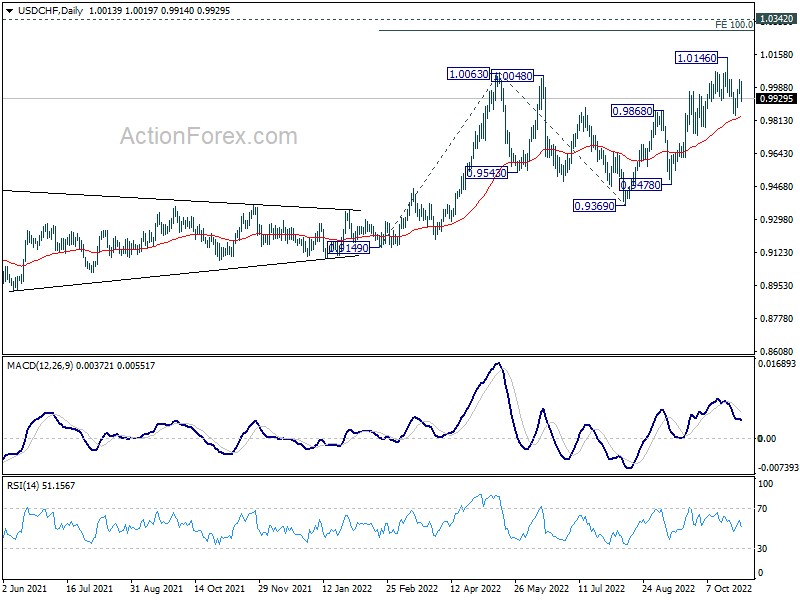
In the bigger picture, current development suggests that up trend from 0.8756 (2021 low) is still in progress. Next target is 100% projection of 0.9149 to 1.0063 from 0.9369 at 1.0283, and then 1.0342 (2016 high). For now, this will remain the favored case as long as 0.9779 support holds, even in case of deep pull back.
USD/JPY Mid-Day Outlook
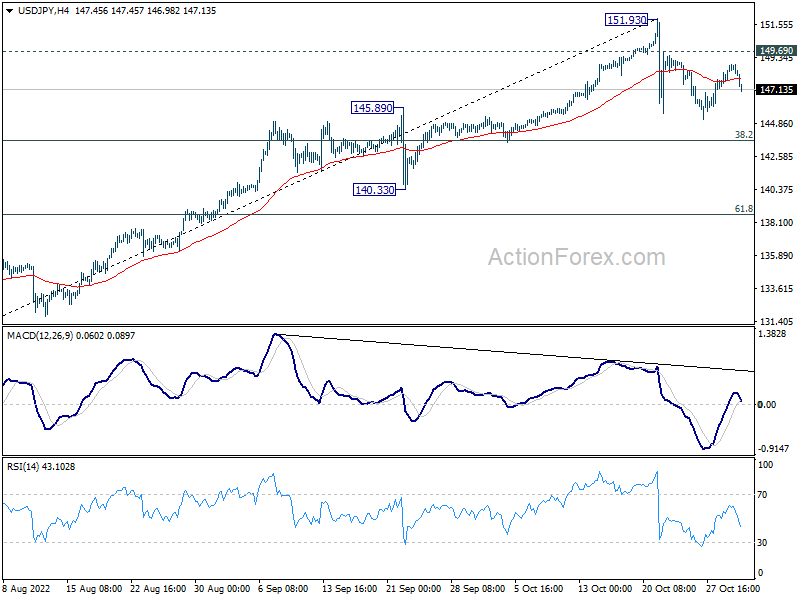
Daily Pivots: (S1) 147.92; (P) 148.38; (R1) 149.22; More...
USD/JPY is extending the corrective pattern from 151.93 and outlook is unchanged. Deeper decline cannot be ruled out, but downside should be contained by 38.2% retracement of 130.38 to 151.93 at 143.69 to bring rebound. On the upside, above 149.69 minor resistance will bring stronger rebound back towards 151.93 high. But upside should be limited there to continue the corrective pattern.
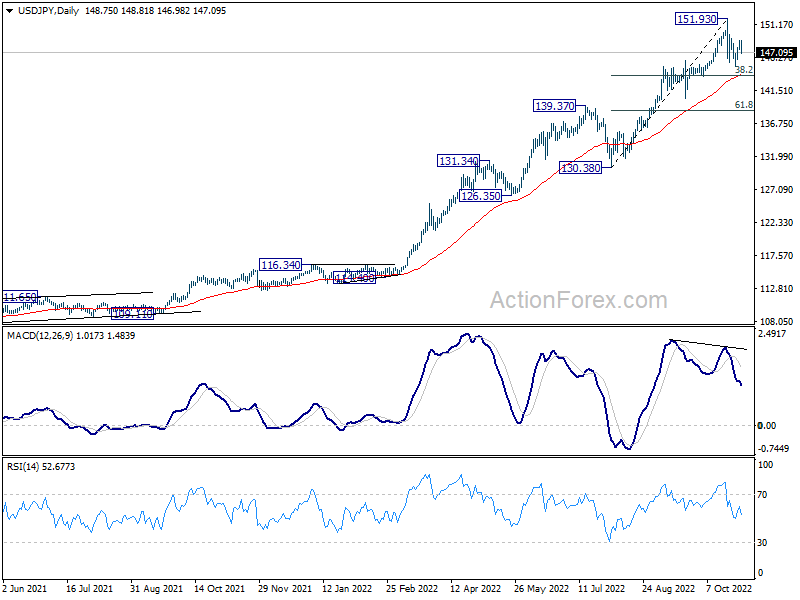
In the bigger picture, up trend from 101.18 is still in progress, as part of the whole up trend from 75.56 (2011 low). 147.68 (1998 high) was already met and there is no clearly sign of topping yet. In any case, break of 140.33 support is needed to be the first sign of medium term topping. Otherwise, further rise is in favor to next target at 160.16 (1990 high).
GBP/USD Mid-Day Outlook
Daily Pivots: (S1) 1.1414; (P) 1.1514; (R1) 1.1567; More...
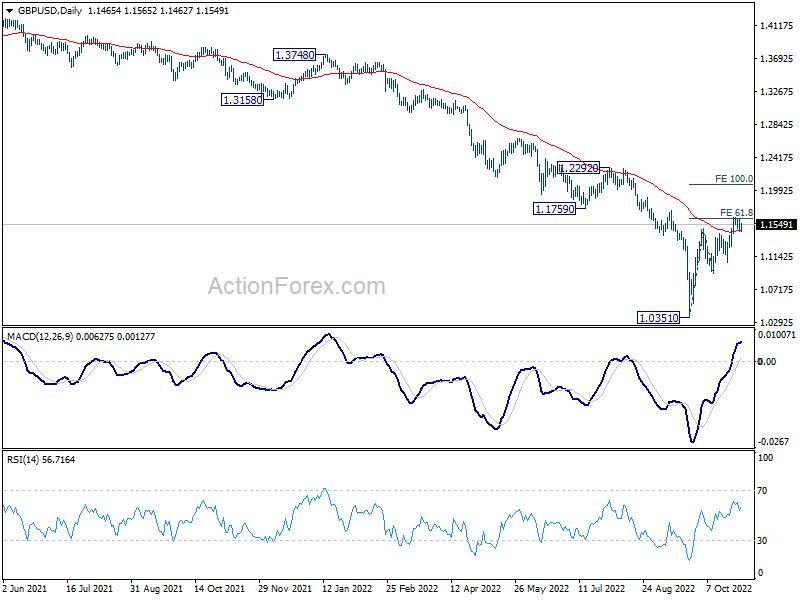
Intraday bias in GBP./USD stays neutral and outlook is unchanged. Consolidation from 1.1664 could extend but overall, further rise is expected as long as 1.1256 minor support holds. On the upside, break of 1.1644 will resume rise from 1.0351 to 100% projection of 1.0351 to 1.1494 from 1.0922 at 1.2065. However, break of 1.1256 will turn bias back to the downside for 1.0922 support and below.
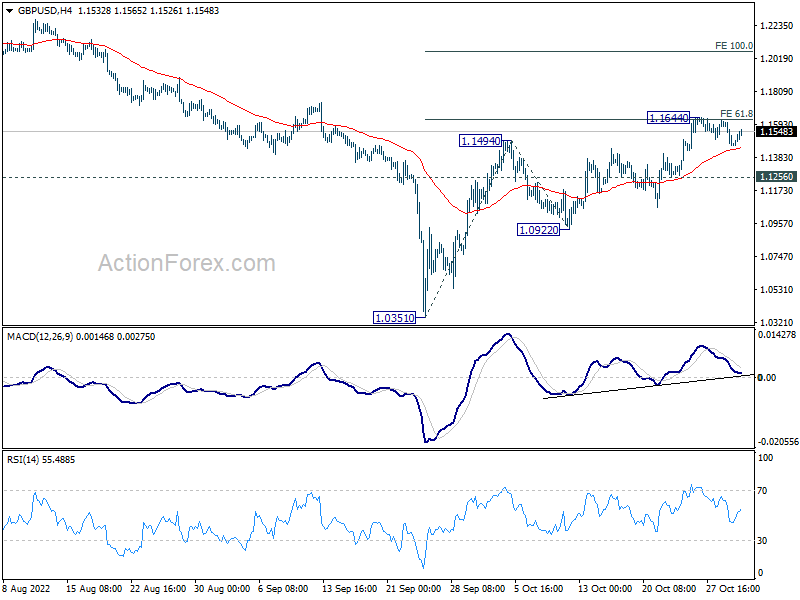
In the bigger picture, fall from 1.4248 (2018 high) is part of the long term down trend from 2.1161 (2007 high). Outlook will stay bearish as long as 1.1759 support turned resistance holds. Parity would be the next target on resumption. Nevertheless, firm break of 1.1759 will confirm medium term bottoming, and open up stronger rise back to 55 week EMA (now at 1.2392).