Sample Category Title
China PMI manufacturing and services fell to contraction
China PMI Manufacturing fell from 50.1 to 49.2 in October, below expectation of 50.0.
PMI Non-Manufacturing dropped from 50.6 to 48.7, below expectation of 50.2. Both readings were below 50-mark which separates growth from contraction on a monthly basis.
"In October, affected by the spread of the pandemic and other factors within the country, China's PMI fell, with the manufacturing PMI, non-manufacturing PMI and comprehensive PMI standing at 49.2 per cent, 48.7 per cent and 49.0 per cent, respectively, and the foundation of China's economic recovery needs to be further consolidated," said senior NBS statistician Zhao Qinghe.
"In October, the composite PMI stood at 49.0 per cent, down 1.9 percentage points from the previous month, falling below the critical point, indicating a general slowdown in the production and operating activities of Chinese enterprises."
Australia retail sales rose 0.6% mom in Sep
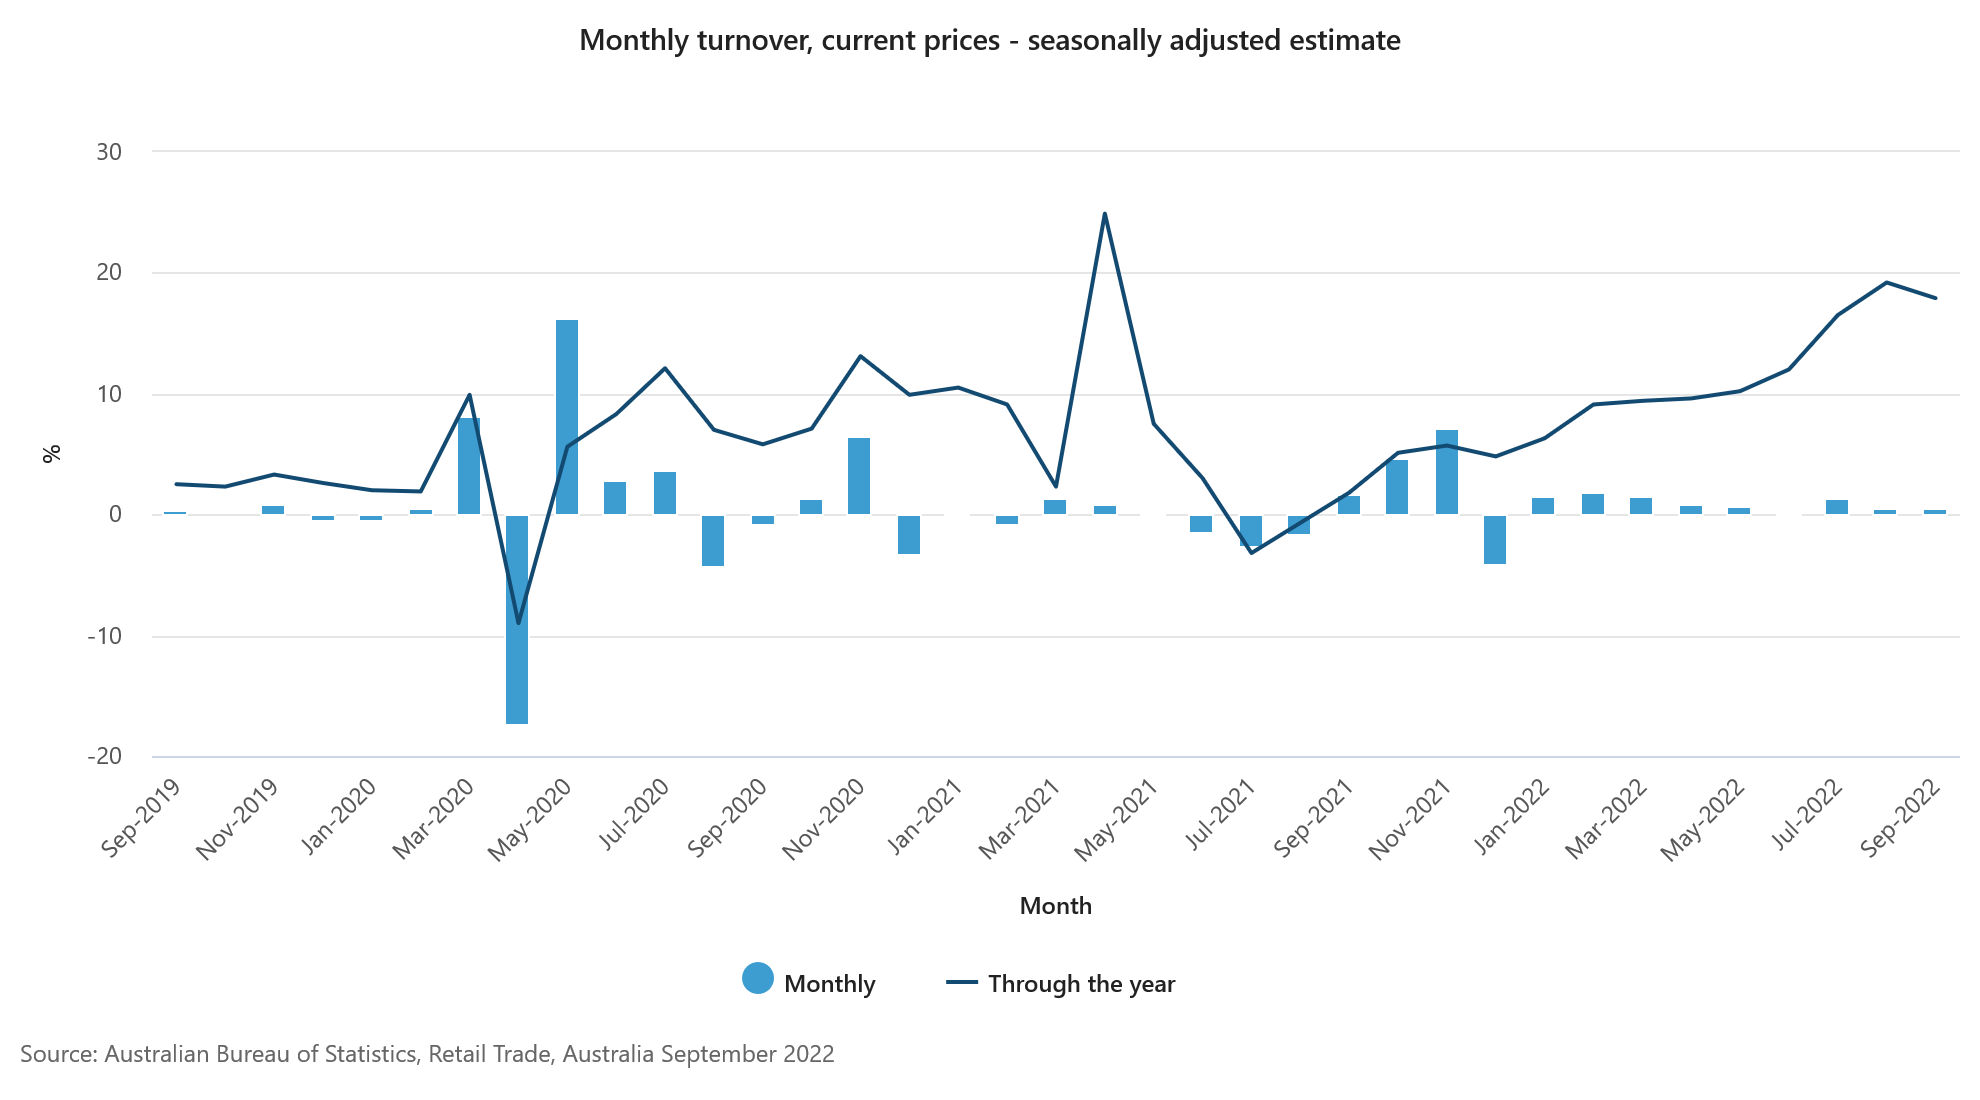
Australia retail sales rose 0.6% mom in September, matched expectations.
Ben Dorber, ABS head of retail statistics said, "This month's rise was again driven by the combined strength in the food industries. Food retailing rose 1.0 per cent, while cafes, restaurants, and takeaway food services rose 1.3 per cent.
"Many retailers remained open for the National Day of Mourning, an additional one-off public holiday in September, and this boosted spending on food, alcohol and dining out."
Japan industrial production dropped -1.6% mom, as auto-related production dived
Japan industrial production declined -1.6% mom in September, below expectation of -1.0% mom. That's also the first contract in four months. The fall was driven by -12.4% mom decline in auto-related production, the steepest fall in eight months.
Manufacturers surveyed by the Ministry of Economy, Trade and Industry (METI) expected output to fall another -0.4% in October and then rise 0.8% in November.
Retail sales rose 4.5% yoy in September, above expectation of 4.1% yoy.
ECB Knot: We’re not in even half-time yet in inflation fight
ECB GoverningCouncil member Klaas Knot said on Sunday, "we will take a significant interest step again in December," adding that next hike would either be 50bps or 75bps.
He said, "we are not in even half-time yet" in the fight against inflation. "We are still returning interest rates towards their neutral level, for which we will also need the December meeting."
"From 2023 we will play the second half, with smaller interest rate steps and by shrinking our balance sheet," he said. "Then we will be in the zone where we will effectively cool down the economy, which is necessary to bring inflation down from 10% to 2% in the next 18 to 24 months."
EUR/USD Could Resume Increase If It Holds This Support
Key Highlights
- EUR/USD tested 1.0090 before it corrected lower.
- A major bullish trend line is forming with support at 0.9820 on the 4-hours chart.
- GBP/USD gained pace above 1.1500, and gold price slowly moved lower.
- The Euro Zone GDP could grow 0.2% in Q3 2022 (Preliminary) (QoQ), down from 0.8%.
EUR/USD Technical Analysis
The Euro started a steady increase above the 0.9900 resistance against the US Dollar. EUR/USD cleared the 1.0000 resistance and extended gains.
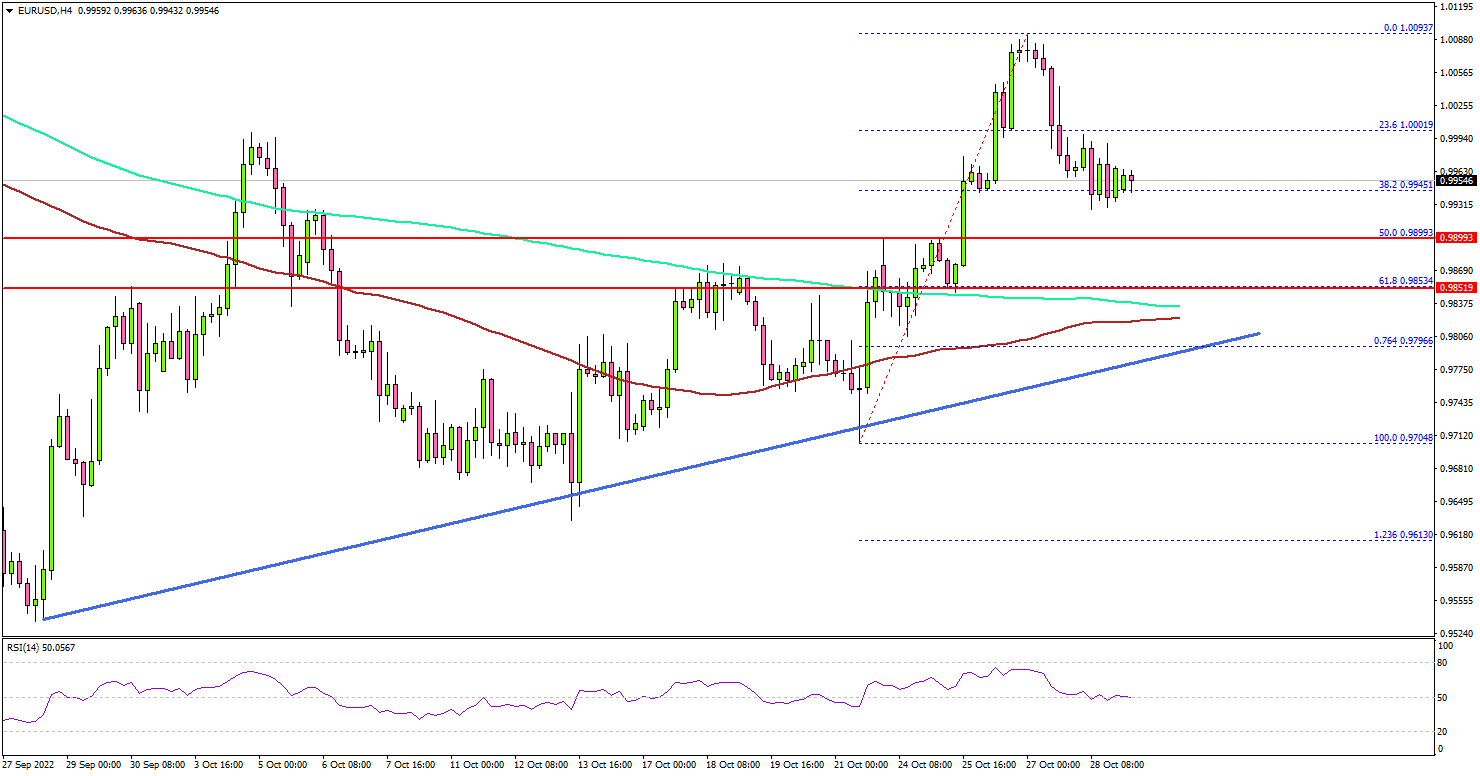
Looking at the 4-hours chart, the pair even broke the 1.0050 resistance level and settled well above the 100 simple moving average (red, 4-hours) plus the 200 simple moving average (green, 4-hours).
A high was formed near 1.0091 before there was a downside correction. The pair declined below the 1.0050 and 1.0020 support levels. The bears pushed the pair below the 23.6% Fib retracement level of the upward move from the 0.9704 swing low to 1.0093 high.
An initial support is near the 0.9890 level. It is near the 50% Fib retracement level of the upward move from the 0.9704 swing low to 1.0093 high.
The next major support is near the 0.9840 zone and the 100 simple moving average (red, 4-hours). There is also a major bullish trend line forming with support at 0.9820 on the same chart.
A downside break below the 0.9840 zone could push the pair into a bearish zone. In the stated case, it could decline towards the 0.9750 support. On the upside, EUR/USD is facing a major resistance near the 1.0020 zone.
The next major resistance may perhaps be near 1.0050. Any more gains could set the pace for a move towards the 1.0120 level, above which it could even test 1.0180.
Looking at GBP/USD, the pair gained pace for a move above the 1.1500 resistance zone and there are chances of more upsides.
Economic Releases
- German Retail Sales for Sep 2022 (MoM) – Forecast -0.3%, versus -1.3% previous.
- German Retail Sales for Sep 2022 (YoY) – Forecast -0.4%, versus -4.3% previous.
- Euro Zone GDP for Q3 2022 (Preliminary) (QoQ) - Forecast 0.2%, versus 0.8% previous.
Forex and Cryptocurrency Forecast
EUR/USD: Is the Interest Rate Race Close to Its End?
EUR/USD grew until Thursday, October 27, and even rose above the landmark level of 1.0000, reaching 1.0092. The reason for this, most likely, was the hope of a number of investors that the ECB would raise the rate not by 0.75, but by 1.0 or even more basis points (bp) at its meeting. However, their dreams remained dreams. There happened exactly what most market participants expected: the European regulator raised the rate by 0.75 bp, from 1.25% to 2.0%. (Although this figure is the highest over the past 10 years).
The final statement of the Central Bank says that the ECB Governing Council has already made significant progress in abandoning the stimulating monetary policy (QE). There is not a single word in the text either that the interest rate will be raised regularly at the next meetings. The head of the ECB, Christine Lagarde, also noted at a press conference that economic activity in the Eurozone is likely to slow down significantly in Q3 2022. Based on all this, market participants concluded that the ECB is counting on the recession in Europe to help it cope with inflation without a further sharp increase in rates. If the regulator acts as aggressively as the US Federal Reserve, such steps, along with rising energy prices, could simply plunge the European economy into the abyss.
Many analysts believe that the ECB will raise the rate not by 75 bp, but by only 50 bp at its next meeting on December 15. There is no January meeting in the calendar, and the rate will be increased by some "pathetic" 25 bp in February, reaching 2.75%. where it all will end.
Against this backdrop, EUR/USD went below the 1.0000 horizon once again. The growth of US GDP helped strengthen the dollar. With a forecast of +2.4%, this indicator increased by +2.6% q/q in Q3 2022, breaking a series of falls: -1.6% in Q1 and -0.6% in Q2.
On the one hand, this economic growth shows that it is able to withstand even greater monetary tightening by the Fed. On the other hand, it turned out that such an important component as the real estate market is actively shrinking. Investments here have fallen by more than 26%, and rates on 30-year mortgages have reached 7% per annum, which has sharply reduced demand for housing.
Of course, this is unlikely to stop the Fed from fighting inflation. But it may force it to act more cautiously. As for the next meeting of the regulator on November 02, the market is still confident that the rate will be increased by 0.75 bp, from 3.25% to 4.0%. However, regarding the Fed's next move in December, the federal funds futures market is inclined to a more moderate rise by 50 bps. But even if this forecast turns out to be correct, the difference between rates on the euro and the dollar will remain, which will support the US currency.
EUR/USD closed last week at 0.9964. 50% of analysts support the fact that it will continue to move south in the near future, another 20% expect a correction to the north, and the remaining 30% vote for a sideways trend. It should be noted here that when moving to the forecast by the end of the year, 80% of experts vote for the bearish scenario. Among the trend indicators on D1, only 40% are red, 60% are green. Among the oscillators, all 100% advise to buy the pair.
The immediate support for EUR/USD is at 0.9900, followed by 0.9765, 0.9700, 0.9645, 0.9580 and finally the September 28 low at 0.9535. The next target of the bears is 0.9500. For the bulls, the first priority will be to break the 1.0000 barrier. Then they will meet resistance at the levels of 1.0100, 1.0250, 1.030 and 1.0370.
The most important event of the upcoming week will certainly be the meeting of the FOMC (Federal Open Market Committee) of the US Federal Reserve on Wednesday, November 02, and the subsequent press conference of the regulator's management. In addition, the economic calendar can mark Monday October 31, when the data on GDP and the consumer market (CPI) of the Eurozone, as well as on the volume of retail sales in Germany, will be released. The value of the ISM Business Activity Index (PMI) in the manufacturing sector will become known the next day, on Tuesday, November 01, and that of the US services sector on Thursday, November 03. In addition, we are traditionally waiting for a portion of statistics from the US labor market on November 02 and 04, including the unemployment rate and the number of new jobs created outside the agricultural sector (NFP) of the country.
GBP/USD: Stake Larger Than Life
In general, the dynamics of GBP/USD followed the dynamics of the EUR/USD last week.The five-day low was recorded at 1.1257, the high was 1.1645, and the finish was at 1.1615. The coming week, or rather its second half, is expected to be much more turbulent, since in addition to the FOMC meeting of the US Federal Reserve, a meeting of the Bank of England is also due on Thursday, November 03.
There was such an old Polish adventure series called Stake Larger Than Life. In our case, the decision of the British Central Bank on the interest rate will determine how the pound will continue to live. And the fact that it will face numerous "adventures" is for sure.
At the height of the fiscal policy fiasco, the market briefly predicted that the pound rate would reach 3.90% after the November meeting. However, investors' appetites have subsided considerably, and they would like it to rise from the current 2.25% to at least 3.0%, that is, by 75 bp. However, strategists at ING, the largest banking group in the Netherlands, believe that the chances of a 50 bp rate hike are now higher, and this is a negative factor for the pound. Therefore, its further growth will be difficult. "The GBP/USD correction may continue to the 1.1750 area, but we doubt that this increase will last long," ING says.
The opposite view is shared by their colleagues at Scotiabank. In their opinion, although the pound failed to break above 1.1650 on October 27, the pair will maintain a positive trend in the next few weeks. And the main support for it will be the level of 1.1400.
As for the median forecast, here the majority of analysts (50%) side with the bears, 15% have taken a neutral position, while the number of supporters of the strengthening of the pound is 35%. Among the oscillators on D1, 100% are on the green side, but a quarter of them are in the overbought zone. Among trend indicators, only 35% are red, 65% are green. The levels and zones of support for the British currency are 1.1550, 1.1475-1.1500, 1.1400, 1.1350, 1.1230, 1.1100, 1.0985-1.1000, 1.0750, 1.0500 and the September 26 low at 1.0350. When the pair moves north, the bulls will meet resistance at the levels of 1.1645, 1.1720, 1.1830, 1.1900, 1.1960, 1.2135 and 1.2200.
Of the events of the upcoming week, in addition to the mentioned meeting of the Bank of England, we can note the publication of the Business Activity Index (PMI) in the construction sector of the United Kingdom on Friday, November 04.
USD/JPY: The Mystery of the Pair's Collapse Is Revealed
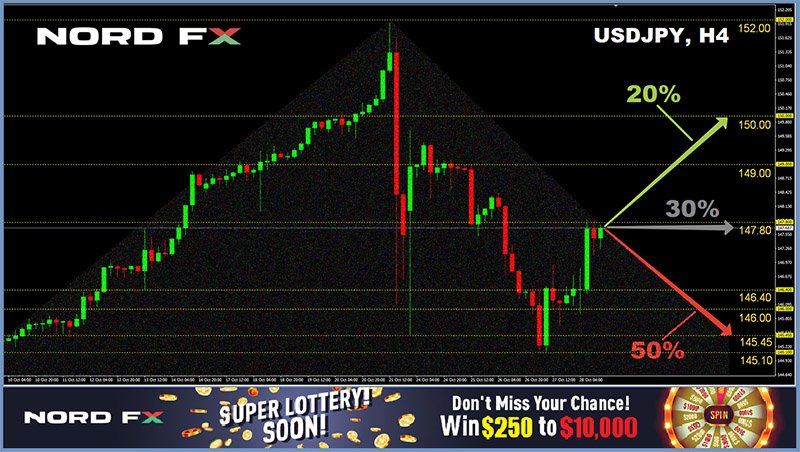
As we predicted back in May, USD/JPY reached 115.00 in autumn, and it reached 151.94 on Friday, October 21, hitting a 32-year high this time. However, everything was clear in advance as for the growth of the pair. But what came as a shock was its subsequent massive collapse. The pair collapsed by more than 500 points within a few minutes: from 151.63 to 146.24. According to the Financial Times, the Bank of Japan (BOJ) sold at least $30 billion at that moment, in an attempt to support the yen. The pair turned around and soared again after this intervention: apparently, $30 billion was not enough. Another intervention followed on Monday, October 24, causing the pair to fall to 145.48. And then, a bounce up again. Last week's low was fixed at 145.10, while the last chord sounded much higher at 147.40. It is curious that all these jumps in the Japanese currency occurred against the backdrop of recent statements by Japanese Prime Minister Fumio Kishida that "sharp, one-sided movements of the yen are undesirable."
Such over-volatility in USD/JPY suggests that the Ministry of Finance and the Bank of Japan will have to work hard to stop demand for the dollar against the troubled yen. "The Japanese authorities are really in a quandary," ING analysts comment. "We can easily understand their interest in not drawing the 150.00 line, given the market is very volatile, but by allowing the yen to break higher, they risk causing a sharp sell-off of the currency that Tokyo would like to contain in the first place."
"Unless the BoJ moves to a less dovish stance, foreign exchange intervention remains the most viable option," ING adds. But, apparently, BoJ is not going to tighten its monetary policy. The regulator remained true to itself at its last meeting last Friday, October 28 and kept the interest rate at a negative, ultra-dove level of -0.1%. So now the pair's dynamics depends on whether the BoJ has enough money to intervene to withstand a rise in rates by the US Federal Reserve.
At the moment, half of the analysts believe that there will be enough money. And therefore, they vote for the downtrend of the pair. 30% have taken a neutral position and 20% are waiting for another victory for the dollar. The oscillators on D1 have a mixed picture: 50% are looking north, 30% are looking south, and 20% are gray neutral. Among the trend indicators, 85% are on the green side and 15% are on the red side. The nearest support level is 146.90, then 145.30, 143.75, 140.60, 140.00, 138.35-139.05 and 137.40. Resistance levels are 148.45, 149.45, 150.00, 151.55. The purpose of the bulls is to rise and gain a foothold above 152.00. Next are the 1990 highs around 158.00.
No important statistics on the state of the Japanese economy are expected to be released this week. The only interest is the publication of the report on the meeting of the Bank of Japan Monetary Policy Committee on Wednesday, November 02, in which market participants will try to catch at least hints of a possible change in the regulator's position. In addition, traders should keep in mind that the country has a day off on Thursday, November 03, the National Day of Culture. And of course, one should not forget about possible "surprises" in the form of BoJ interventions in support of the yen.
CRYPTOCURRENCIES: Just a Rise? Or a Rise Before a Fall?
Following the growth of US stock indices (S&P500, Dow Jones and Nasdaq) last week, bitcoin and ethereum went up, bringing joy to investors. Against the background of the fact that BTC/USD has not been able to gain a foothold above the $20,400 mark since September 13, the bulls can consider what is happening to be their success. However, it should be noted that the pair has been migrating along the $20,000 Pivot Point in the medium-term $18,100-25,000 side corridor for 19 weeks, since mid-June. So, the rise to the last seven-day high of $21.015 can only be considered a local micro-success, but not a reversal of the bearish trend.
Intense tightening of the Fed's monetary policy has already put the US economy on the brink of a recession. One more step, and recession will become inevitable. Some experts believe that the economic downturn could force the US Central Bank to abandon quantitative tightening (QT), at least for a while, without curbing inflation to the end. Against this background, the correlation between the prices of bitcoin and gold over the past 40 days has reached a significant value of 0.5, which is a strong increase after this indicator was almost zero in mid-August. Bank of America opined that "the rapidly growing relationship with gold indicates that investors may view bitcoin as a relatively safe haven in a situation where there remains macroeconomic uncertainty in the world, and the market bottom may eventually be fixed".
The bitcoin community is divided over whether BTC will rise or fall next year. There is reason to believe that BTC is likely to collapse sharply in the coming months but will then rise in middle to late 2023. Most analysts and technical indicators suggest that bitcoin could drop to $12,000-$16,000 in the coming months. This correlates with a volatile macro environment, stock prices, inflation, Fed data, and (at least according to Elon Musk) a possible recession that could last until 2024.
For example, the well-known trader Ton Weiss believes that against the backdrop of the upcoming halving-2024, the quotes of the first cryptocurrency will reach $100,000 next year. But at the same time, he does not exclude the possibility of a fall in the price of digital gold to the level of $10,000-14,000 before the onset of the bull market. According to Weiss, capital flows from Europe to the United States and the syndrome of lost profits can become the engine of growth. "They missed their chance to catch the low in 2018. This is another possibility. If bitcoin ever drops below $10,000, investors will immediately take advantage of this," the trader explained.
Many experts say that the upcoming halving could significantly push the BTC price up. This opinion is also shared by a well-known specialist aka PlanB, who predicts the price movement of the main cryptocurrency based on the Stock-to-Flow (S2F) model. He is supported by fellow trader and analyst Josh Rager, who also expects a significant increase in bitcoin, but only after halving in 2024. In his opinion, growth should not be expected before this event.
As you know, the last bitcoin halving occurred on May 11, 2020, when the reward for each created block was halved to 6.25 BTC. This reward will again be halved to 3.125 BTC per block during the fourth halving, which is expected to take place in May 2024.
The legendary trader and analyst Peter Brandt is of the same opinion. He said that bitcoin would reach a new all-time high in about 32 months, but it would first fall to $13,000. The expert believes that the first cryptocurrency will find this bottom at the beginning of 2023 and will not show "impressive" performance over the next year and a half.
According to Brandt, the US Federal Reserve is not going to ease monetary policy. He assumes that the regulator will raise interest rates by another 75 basis points at least twice more by the end of 2022 in order to combat inflation. However, the analyst expects that the value of the first cryptocurrency will no longer depend on other markets at some point. "Bitcoin will eventually correlate with bitcoin," Brandt explained. The expert also noted that the cryptocurrency will become the "main store of value" in the next 10 years.
Recall that Peter Brandt has been working in the financial markets for more than 40 years, he is the creator of the Factor Trading service, which provides expert reports and analysis of asset value charts. Brandt has repeatedly noted that bitcoin is one of the largest parts of his investment portfolio.
Now more details about the forecast for the next 2 months. Most of the 564 crypto investors surveyed by MLIV Pulse think that bitcoin will continue to trade in the $17,600-25,000 price range. According to an October survey conducted by financial company Finder, the first cryptocurrency will be trading at $21,344 by the end of this year.
The forecast of Eight trading firm CEO Michael van de Poppe is a little more optimistic. He believes that bitcoin has been consolidating around $20,000 for too long and should soon get out of the corridor to shake things up. "Bitcoin will break through all levels within two to three weeks. And I think it will be up. I think we'll get to $30,000." This growth is evidenced by the outflow of BTC from centralized exchanges: investors withdraw funds to cold wallets in anticipation of the strengthening of the first cryptocurrency.
Other experts, on the contrary, believe that we will not see a surge either in the near future or in 2023. Gareth Soloway of InTheMoneyStocks has pointed out that there is a small chance that the coin could even crash to $3,500. "I think we will see a small bounce in the near future, then a wave down to $12,000-13,000, and then, I am afraid, we will move to $8,000-10,000, maybe even see a drop to $3,500," he says. At the same time, Gareth Soloway warns that if BTC falls to $12,000 or below, it may not be profitable for miners to manage the ecosystem. This would mean that transactions are no longer being processed. And this, in turn, can not only damage the industry, but also destroy the bitcoin market.
According to billionaire Frank Giustra, the end of the bitcoin era will be actively promoted by the US authorities, who will destroy cryptocurrencies sooner or later. "I think the US authorities really want to be ahead of the rest of the planet in terms of blockchain, not in bitcoin, but in a state-owned digital currency that they can fully control. Like all other countries, they don't need bitcoin competition. Therefore, I see BTC as a game against sovereign fiat money," Giustra said, adding that bitcoin has no chance of standing up to world governments.
Of course, such statements are alarming. But we wouldn't be us if we hadn't finished our review on an optimistic note. According to the mentioned survey conducted by the financial company Finder, the median forecast of analysts is that the price of BTC will reach $270,722 by 2030.
In the meantime, at the time of writing the review, on the evening of Friday October 28, the BTC/USD pair is trading in the $20,600 zone, the total capitalization of the crypto market is $1.005 trillion ($0.913 trillion a week ago). The Crypto Fear & Greed Index rose 7 points in seven days from 23 to 30 and moved from the Extreme Fear zone to the Fear zone. According to the creators of the Index, it is worth thinking about opening long positions at this point. Although, in our opinion, the situation is very shaky, and traders need to act as carefully and cautiously as possible.
Sterling Jumped on Political Stabilization, Dollar Lost Ground ahead of Fed
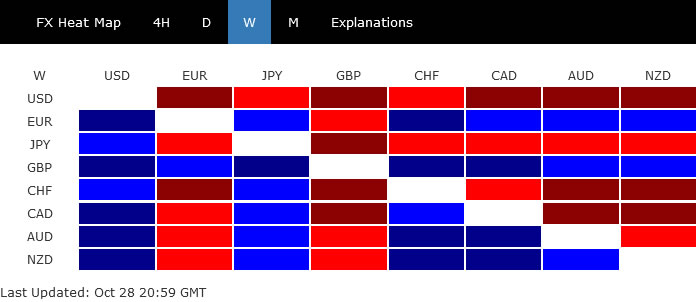
Dollar ended as the worst performer, followed by Yen and Swiss Franc. The US stock markets traded with risk-on sentiment, on talks that Fed would start slowing down tightening pace after one more 75bps hike. But it should be noted that such sentiment was not seen everywhere in the world, in particular China. Thus, rally in commodity currencies was somewhat capped.
Sterling and Euro were the best performers. The Pound was supported by stabilization in UK politics, and expectations of a 75bps hike by BoE. There is prospect of further rally in Sterling ahead, especially in crosses, if the new again UK government could restore investor confidence with the budget to be announced in the middle of the month.
DOW surged on earnings and Fed pivot talks
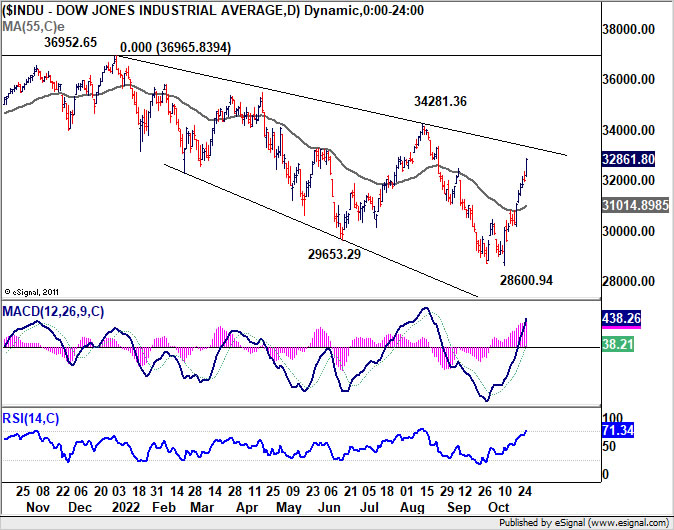
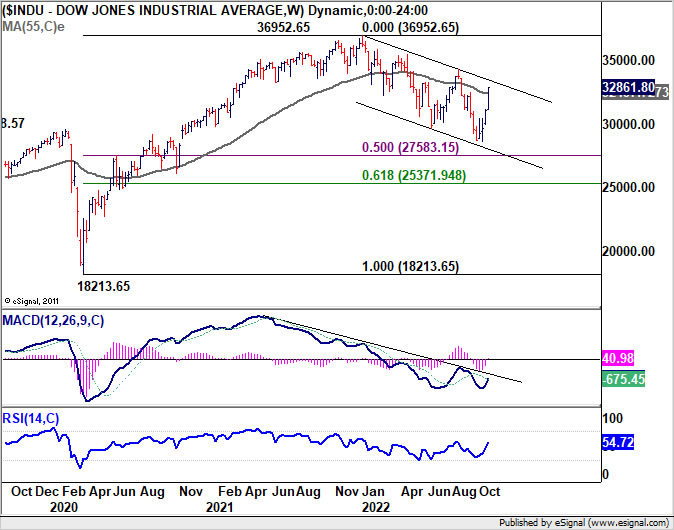
DOW registered the fourth straight week of gains and closed strongly last week. Sentiment was partly supported by strong earnings of some stocks. Additionally, investors were raising bets that Fed will start slowing down tightening pace later in the year.
For now, fed fund futures are still pricing in 82.2% chance of a 75bps hike to 3.75-4.00% on November 2, the coming Wednesday. But change of another 75bps hike to 4.50-4.75% dropped below 50%. The move came as some central banks, like RBA and BoC, have already "pivot" to a smaller hikes.
DOW's strong rise now raises the chance that corrective down trend from 36952.65 has completed at 28600.94 already. Firm break of trend line resistance (now at 33380) will affirm this bullish case and target 34281.36 resistance for confirmation. Even in case of retreat, near term bias will stay on the upside as long as 55 day EMA (now at 31014.89) holds.
Nevertheless, it should be noted that NASDAQ is lagging far far behind in the rebound. Thus, overall sentiment was not overwhelmingly positive.
But it's risk-off in China and Hong Kong
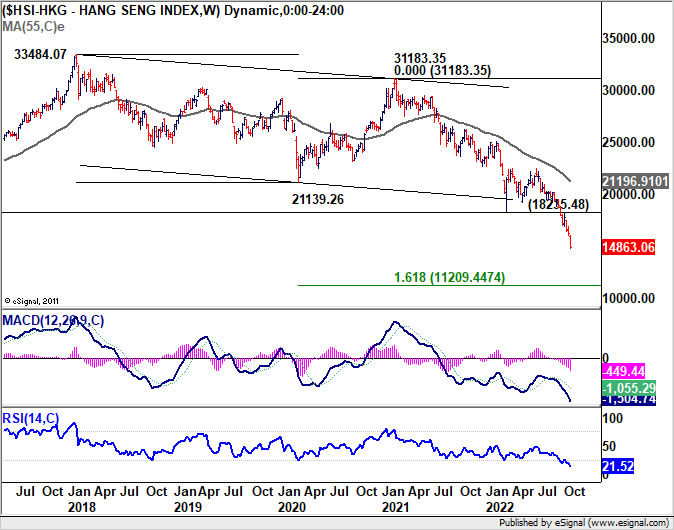
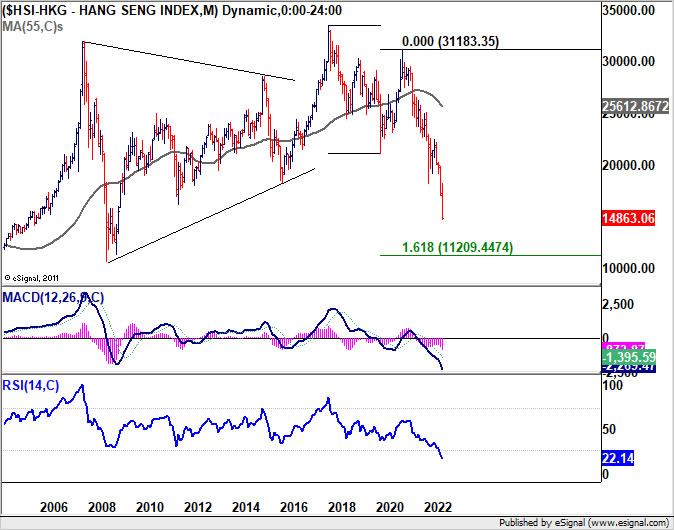
Also, risk-on sentiment was not shared evenly globally. In particular, stocks in China and Hong Kong suffered steep selling as aftermath of the 20th Communist Party Congress. The Shanghai SSE hit the lowest level since May. Hong Kong HSI even fell to lowest level since 2009.
Current downside momentum in HSI suggests that it could well dive further to 161.8% projection of 33484.07 to 21139.26 from 31183.35 at 11209.44 before finding a bottom.
Risk-off sentiment in China is a factor capping rallies in Aussie and Kiwi, and could continue to do so.
It could be a pivot week for Dollar
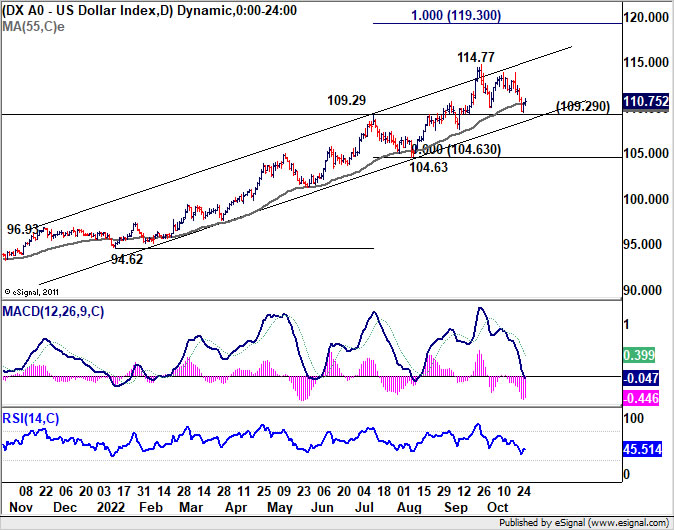
As for Dollar index, corrective pattern from 114.77 continued with another dip last week and touched 55 day EMA. (now at 110.45). It's now close to an important support zone, with 109.29 resistance turned support and medium term channel support. There is prospect of DXY completing the three wave pattern from 114.7. Strong bounce from current level will push DXY through 114.77 to resume larger up trend. However, sustained break of this support zone will indicate medium term topping, and bring deeper correction pack towards 104.63 support.
The next move will very much depends on FOMC decision and statement, as well as the set of economic data including ISM indexes and non-farm payroll. It could be a pivot week for Dollar, even if it's too early for Fed.
Sterling rose broadly as policy situation stabilized
Sterling was the best performer last week as the political situation appeared to have stabilized for now. Rishi Sunak was confirmed as the new UK Prime Minister, and he kept Jeremy Hunt in the position of Finance Minister. The new budget is delayed from October 31 to November 17, and there are expectations of some spending cuts and tax hikes to restore fiscal health of the country.
As for BoE, markets are now expecting 75bps hike on the coming Thursday. New economic projections might not be too meaningful given that the government's budget won't be ready.
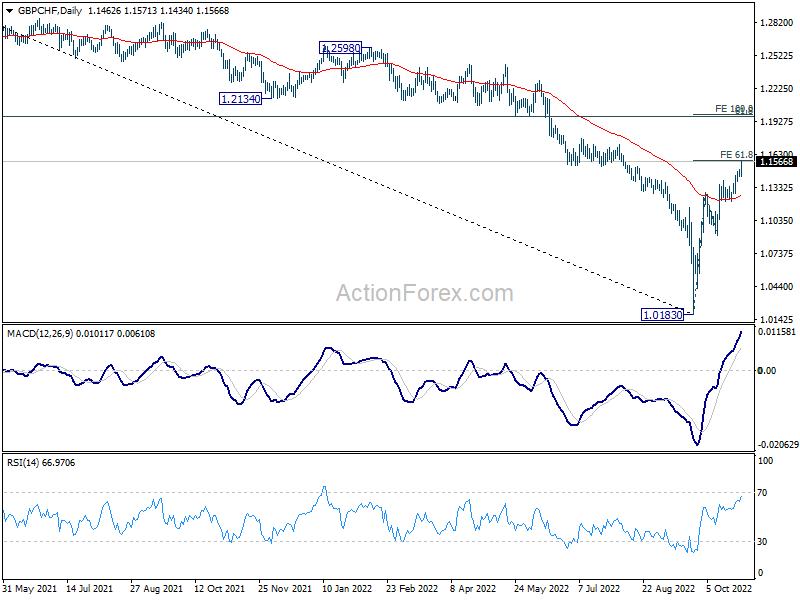
GBP/CHF extended the rebound from 1.0183 and is just inch below 61.8% projection of 1.0183 to 1.0893 to 1.1283 at 1.1573. Firm break of 1.1573 will target cluster level at 100% projection at 1.1993 and 61.8% retracement of 1.3070 to 1.0183 at 1.1967. In any case, further rally is in favor as long as 55 day EMA (now at 1.1251) holds.
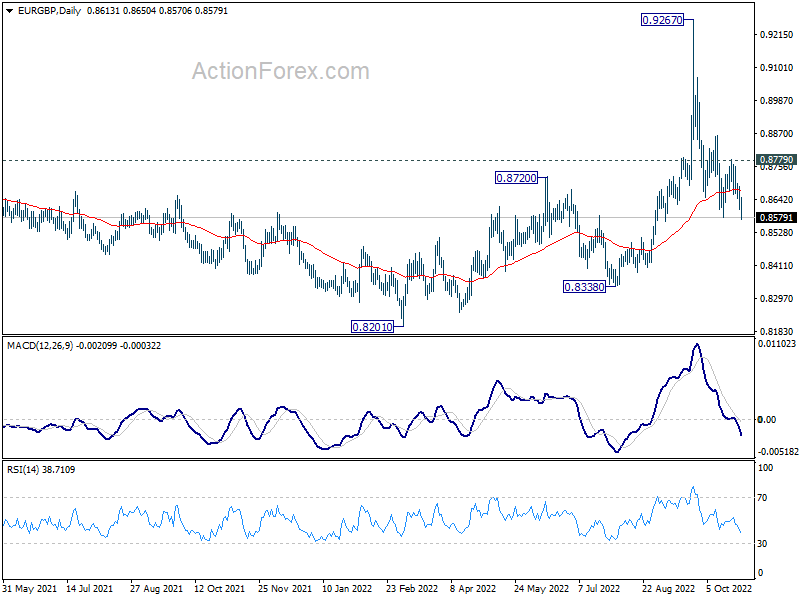
EUR/GBP is resuming the decline from 0.9267 with late breach of 0.8577 support. Outlook will stay bearish as long as 0.8779 resistance holds. Next target is 0.8201/8338 support zone.
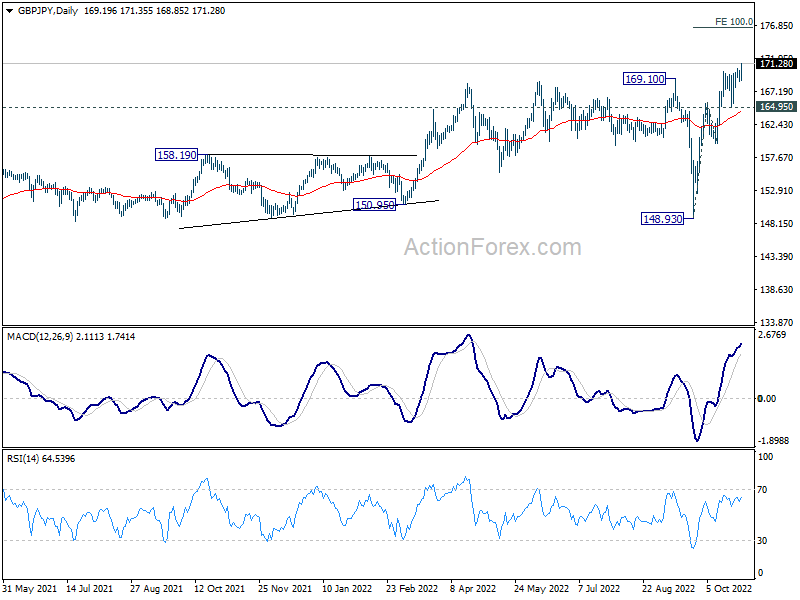
GBP/JPY's up trend also resumed with late break of 170.57 resistance. Outlook will now stay bullish as long as 164.99 support holds. Next target is 100% projection of 148.93 to 165.69 from 159.71 at 176.47.
GBP/USD Weekly Outlook
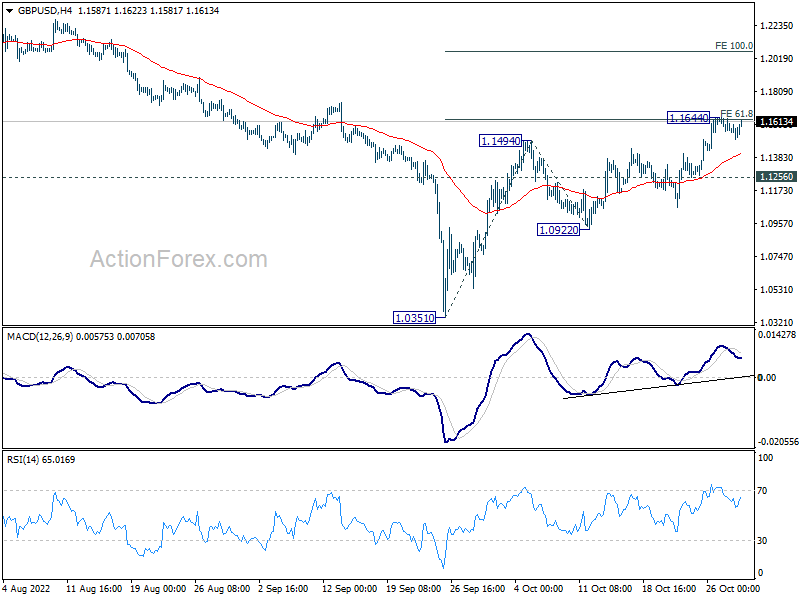
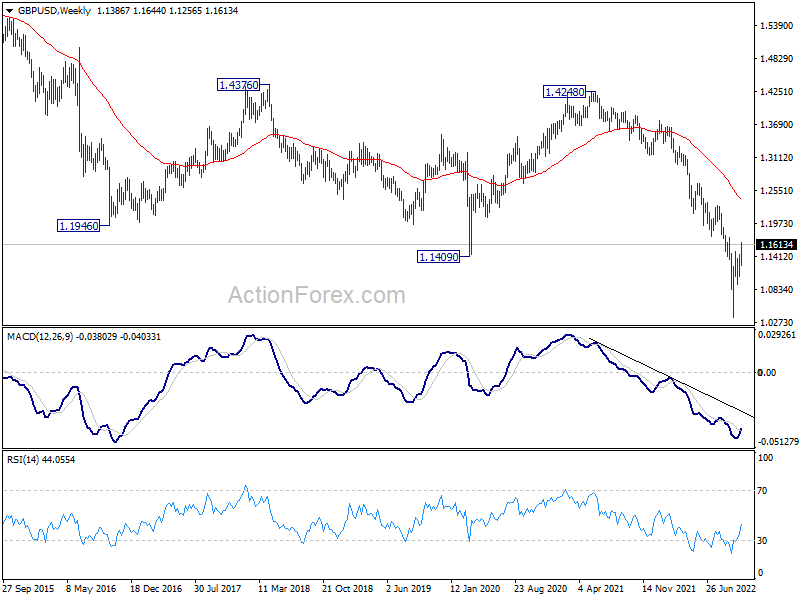
GBP/USD's rebound from 1.0351 resumed last week and hit 1.1644 before retreating. Initial bias stays neutral this week first, but further rise is expected as long as 1.1256 minor support holds. Break of 1.1644 will resume rise form 1.0351 to 100% projection of 1.0351 to 1.1494 from 1.0922 at 1.2065. However, break of 1.1256 will turn bias back to the downside for 1.0922 support and below.
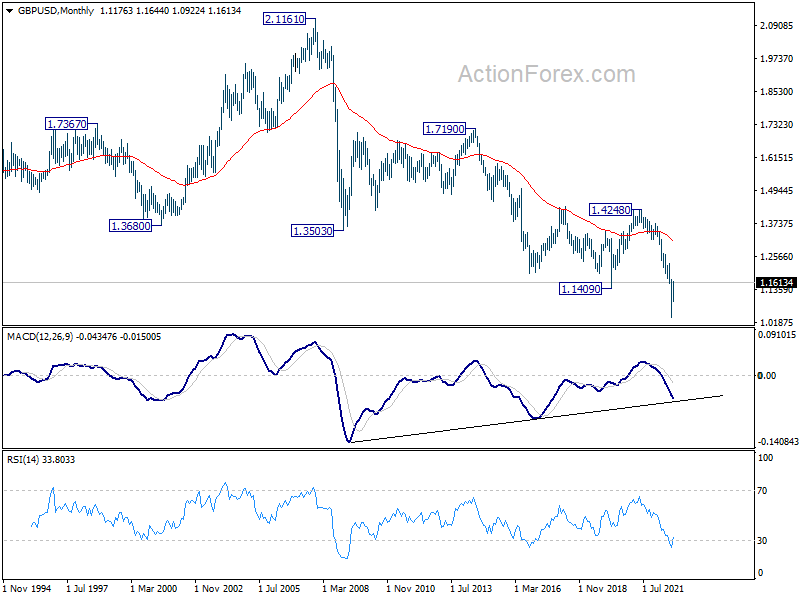
In the bigger picture, fall from 1.4248 (2018 high) is part of the long term down trend from 2.1161 (2007 high). Outlook will stay bearish as long as 1.1759 support turned resistance holds. Parity would be the next target on resumption. Nevertheless, firm break of 1.1759 will confirm medium term bottoming, and open up stronger rise back to 55 week EMA (now at 1.2392).
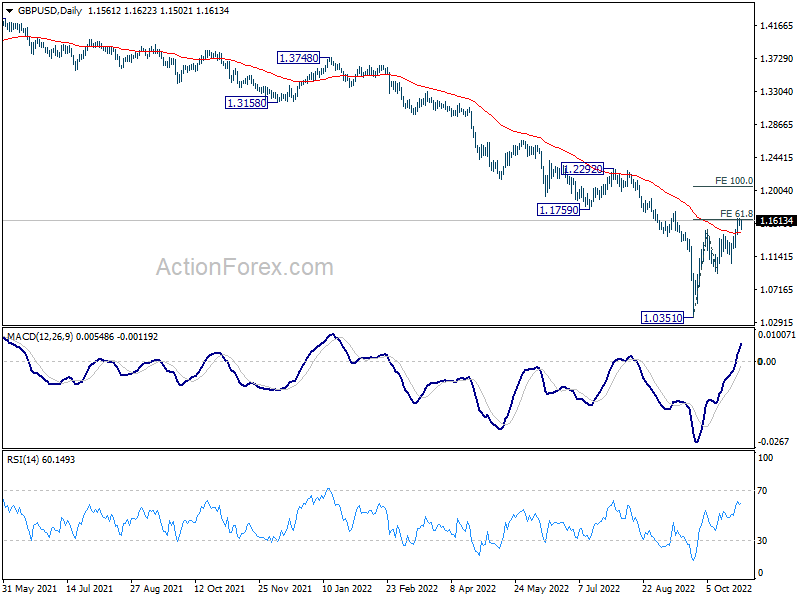
In the longer term picture, as long as 1.4248 resistance holds (2021 high), there is no confirmation of long term bottoming yet. That is, down trend from 2.1161 (2007) could still resume for another low through 1.0351.
EUR/USD Weekly Outlook
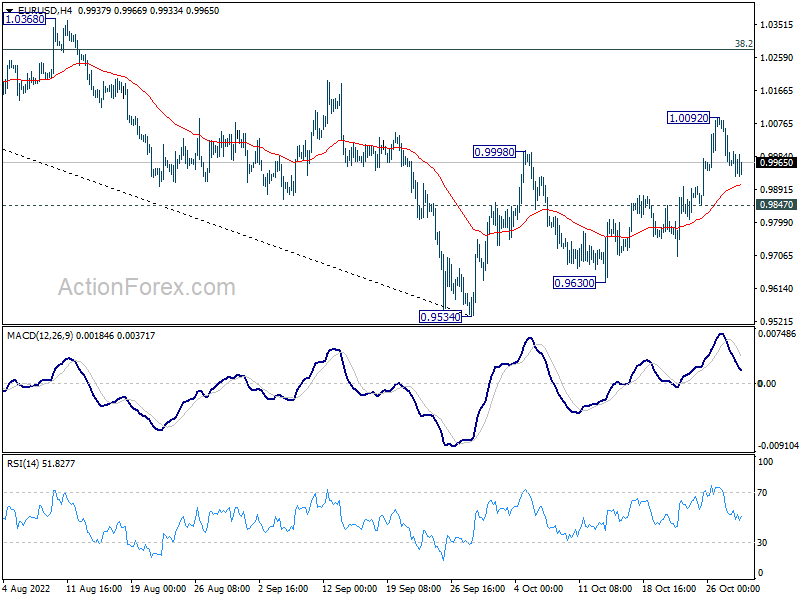
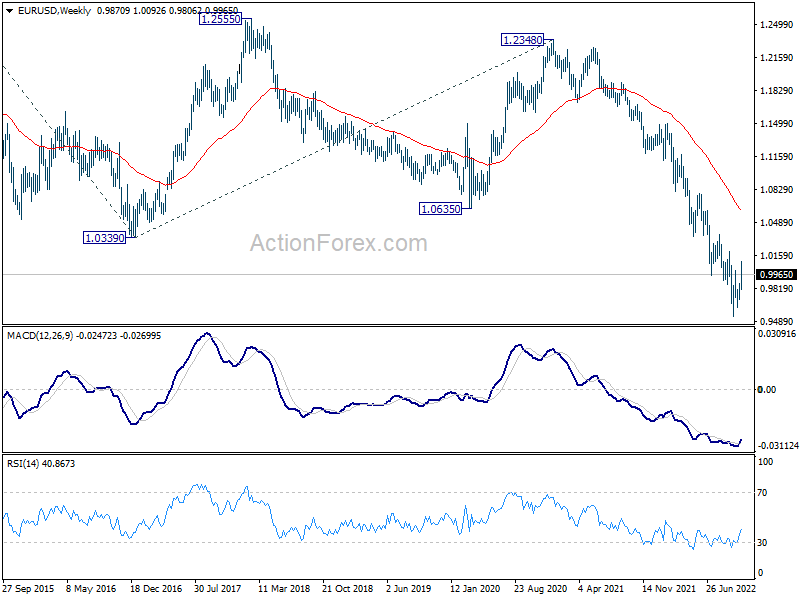
EUR/USD's rebound from 0.9534 resumed last week but retreated after hitting 1.0092. Initial bias is neutral this week first. Further rise is in favor as long as 0.9847 minor support holds. Break of 1.0092 will target 38.2% retracement of 1.1494 to 0.9534 at 1.0283. However, break of 0.9847 will turn bias back to the downside for 0.9534/9630 support zone instead.
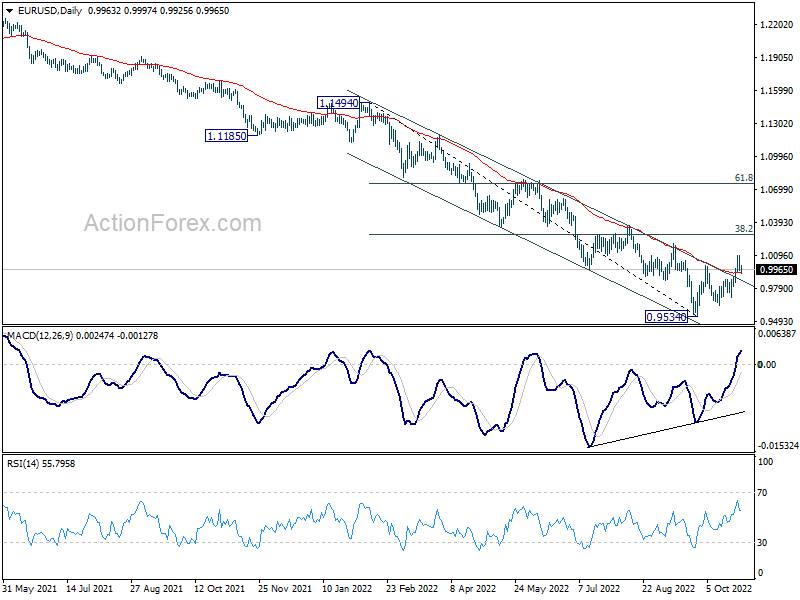
In the bigger picture, the case of medium term bottoming at 0.9534 building up, with bullish convergence condition in daily MACD. While it is too early to call for trend reversal, firm break of 0.9998 opens up stronger rebound back to 55 week EMA (now at 1.0630) even as a corrective rise. However, sustained trading back below 55 day EMA (now at 0.9938) will revive medium term bearishness for another fall through 0.9534 low.
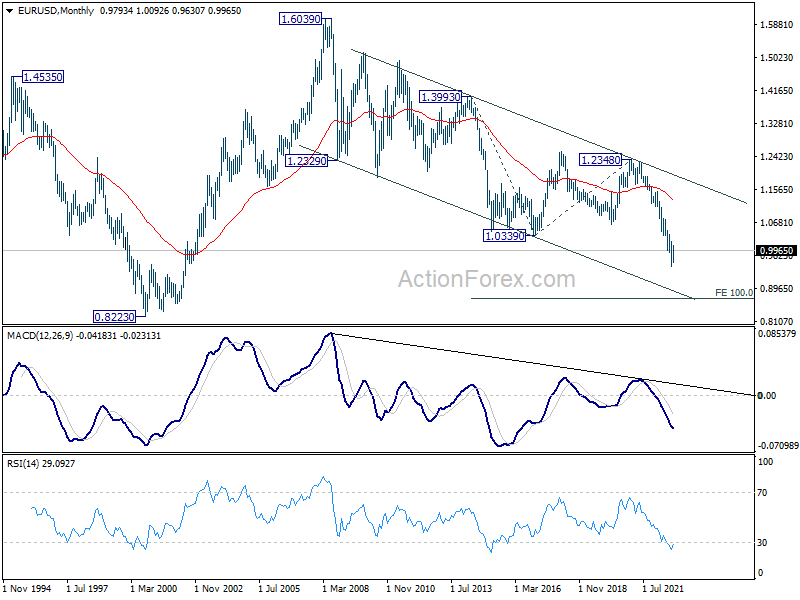
In the long term picture, long term down trend from 1.6039 (2008 high) is extending. Next target is 100% projection of 1.3993 to 1.0339 from 1.2348 at 0.8694. This will now remain the favored case as long as 1.0635 support turned resistance holds.
USD/JPY Weekly Outlook
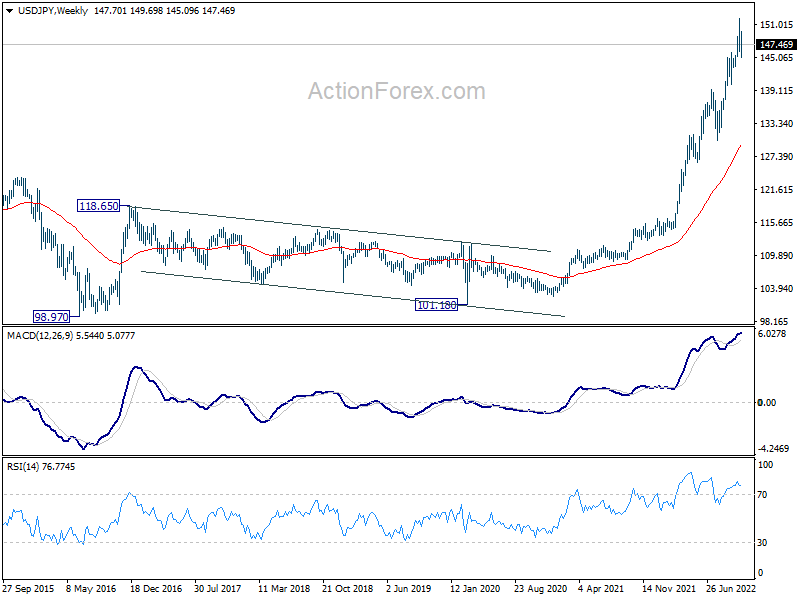
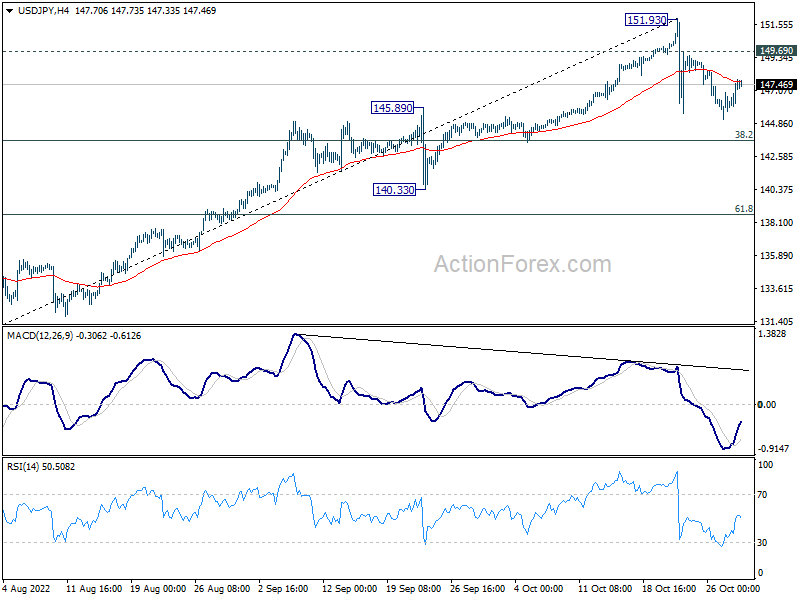
USD/JPY stayed in consolidation below 151.93 last week and outlook is unchanged. Initial bias remains neutral this week first. Another fall could be seen, but downside should be contained by 38.2% retracement of 130.38 to 151.93 at 143.69 to bring rebound. On the upside, above 149.69 minor resistance will bring stronger rebound back towards 151.93 high. But upside should be limited there to continue the corrective pattern.
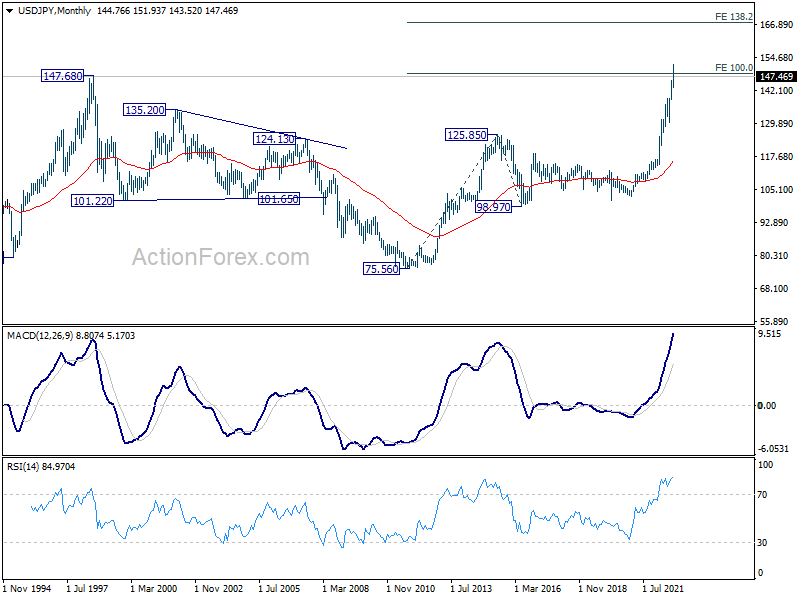
In the bigger picture, up trend from 101.18 is still in progress, as part of the whole up trend from 75.56 (2011 low). 147.68 (1998 high) was already met and there is no clearly sign of topping yet. In any case, break of 140.33 support is needed to be the first sign of medium term topping. Otherwise, further rise is in favor to next target at 160.16 (1990 high).
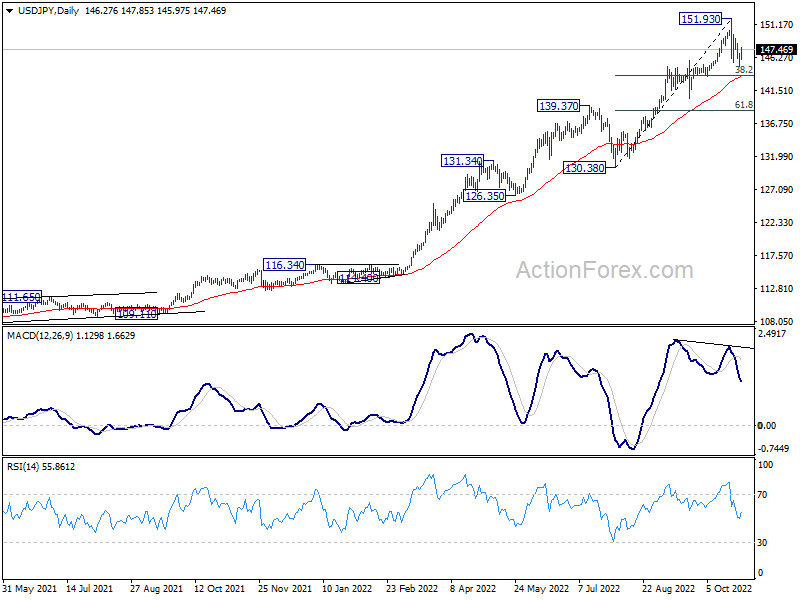
In the long term picture, rise from 101.18 is seen as part of the up trend from 75.56 (2011 low). Sustained break of 100% projection of 75.56 (2011 low) to 125.85 (2015 high) from 98.97 at 149.26, will pave the way to 138.2% projection at 168.47. This will remain the favored case as long as 130.38 support holds.