Sample Category Title
USD/JPY Daily Outlook
Daily Pivots: (S1) 146.36; (P) 147.11; (R1) 148.23; More...
Intraday bias in USD/JPY remains neutral as consolidation from 151.93 is extending. Another fall could be seen, but downside should be contained by 38.2% retracement of 130.38 to 151.93 at 143.69 to bring rebound. On the upside, above 149.69 minor resistance will bring stronger rebound back towards 151.93 high. But upside should be limited there to continue the corrective pattern.
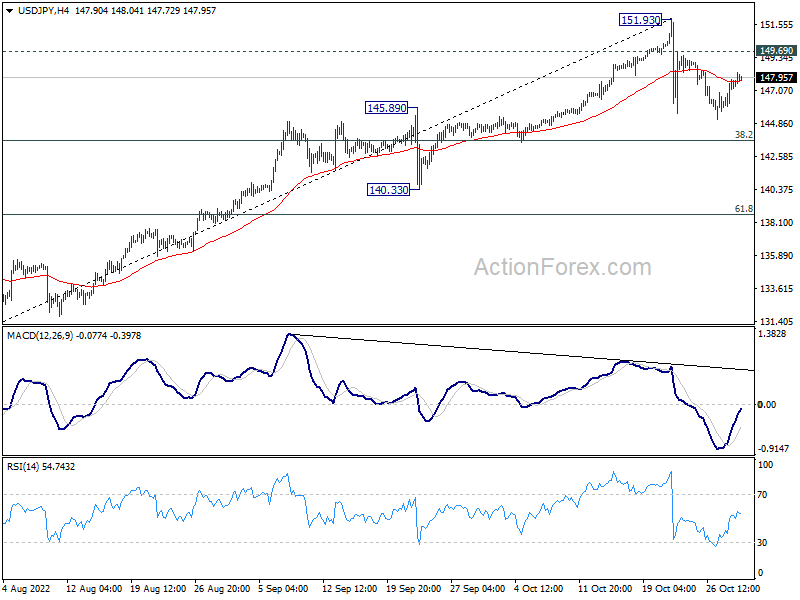
In the bigger picture, up trend from 101.18 is still in progress, as part of the whole up trend from 75.56 (2011 low). 147.68 (1998 high) was already met and there is no clearly sign of topping yet. In any case, break of 140.33 support is needed to be the first sign of medium term topping. Otherwise, further rise is in favor to next target at 160.16 (1990 high).
EUR/GBP Daily Outlook
Daily Pivots: (S1) 0.8552; (P) 0.8601; (R1) 0.8631; More...
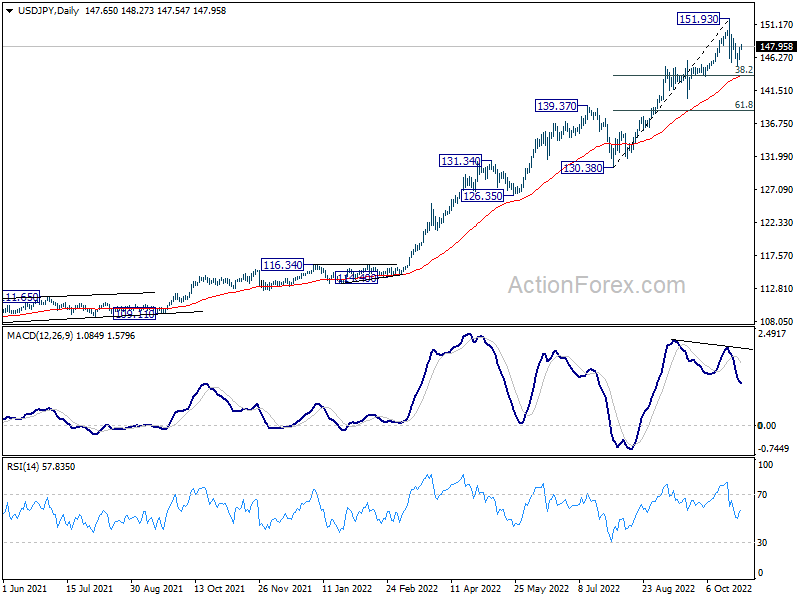
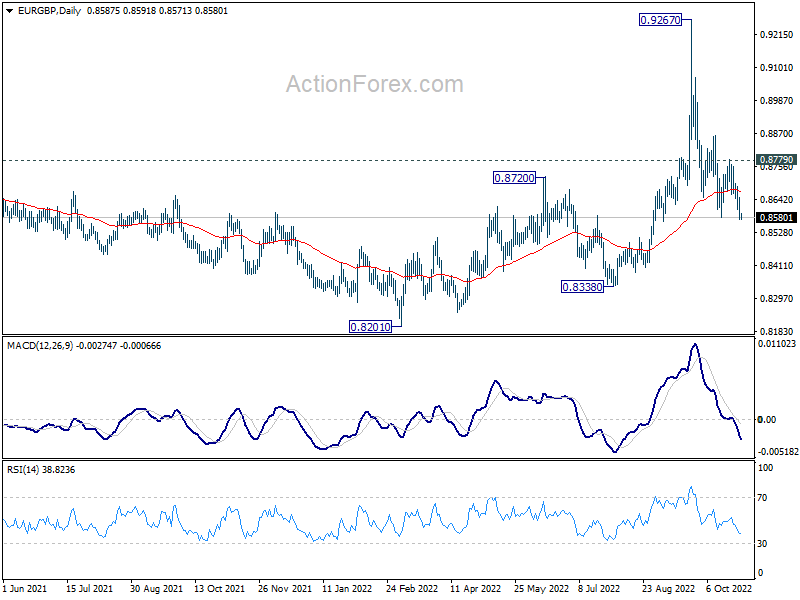
Intraday bias in EUR/GBP remains on the downside at this point. Fall from 0.9267 is in progress and should target 0.8201/8388 support zone. For now, near term outlook will remain bearish as long as 0.8779 resistance holds, in case of recovery.
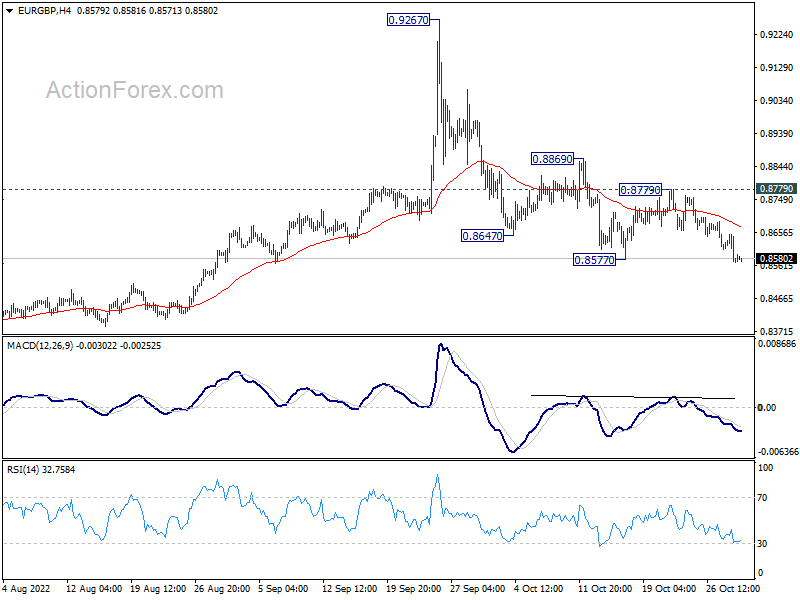
In the bigger picture, current development suggests that fall from 0.9267 is a down leg inside long term range pattern. Deeper fall could be seen towards 0.8201/8338 support zone. But strong support should be seen there to bring reversal.
EUR/AUD Daily Outlook
Daily Pivots: (S1) 1.5450; (P) 1.5509; (R1) 1.5601; More...
Intraday bias in EUR/AUD stays neutral as consolidation from 1.5704 is extending. Deeper decline cannot be ruled out. But downside should be contained by 55 day EMA (now at 1.5163) to bring rebound. On the upside, break of 1.5704 will resume the rally from 1.4281.
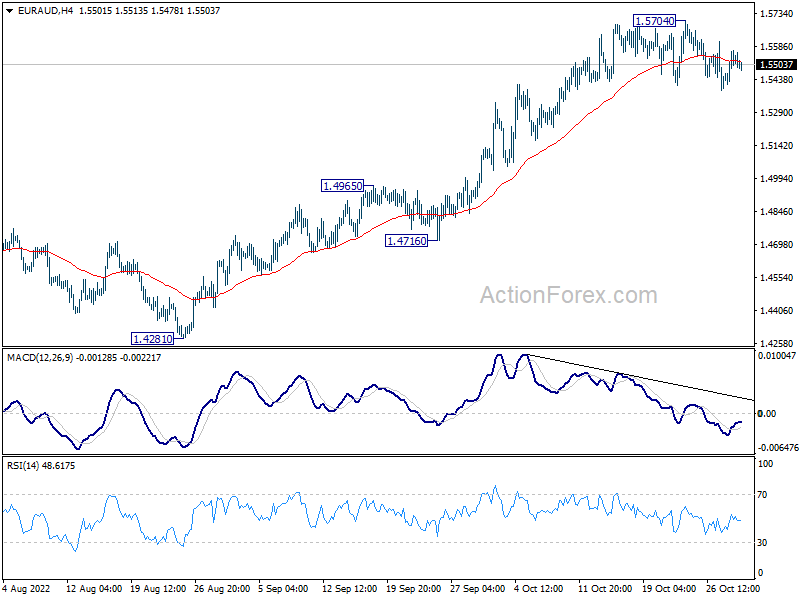
In the bigger picture, a medium term bottom should be in place at 1.4281, on bullish convergence condition in daily MACD. Further rise would be seen back to 1.6434 key resistance next. Break of 1.4965 resistance turned support is needed to indicate reversal. Otherwise, further rally will remain in favor.
EUR/CHF Daily Outlook
Daily Pivots: (S1) 0.9881; (P) 0.9913; (R1) 0.9957; More....
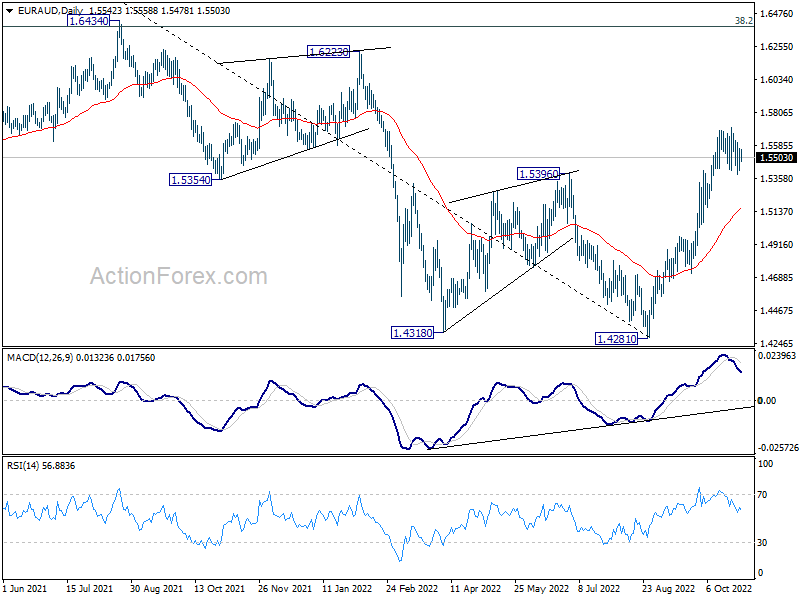
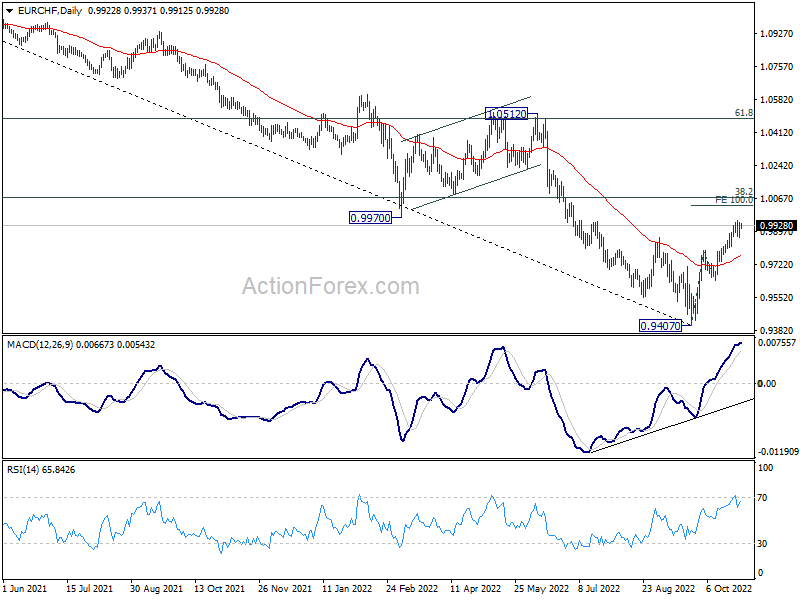
EUR/CHF is staying in consolidation from 0.9953 and intraday bias remains neutral. In case of another fall, downside should be contained by 0.9798 support to bring rebound. Break of 0.9953 will resume the rise from 0.9407 to 100% projection of 0.9407 to 0.9798 from 0.9641 at 1.0032.
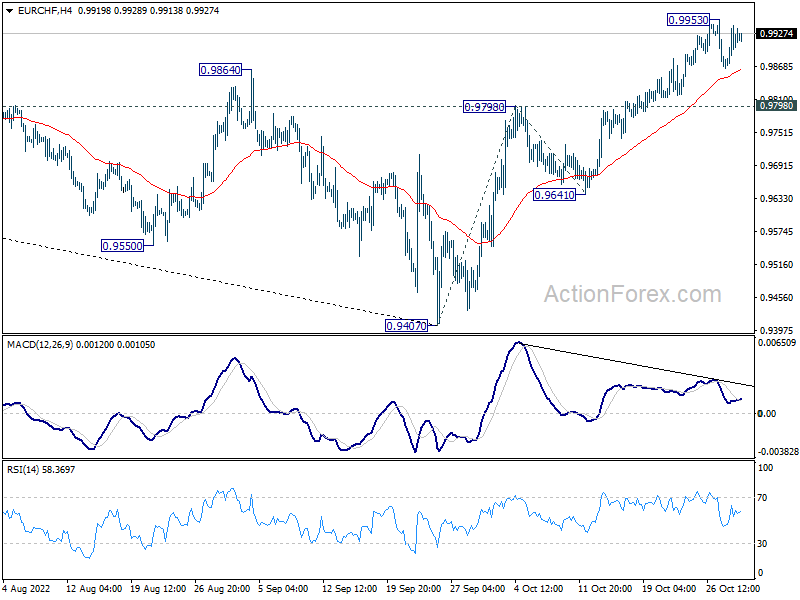
In the bigger picture, a medium term bottom should be in place at 0.9407. Further rally is expected as long as 0.9641 support holds, even as a corrective rebound. Next target 38.2% retracement of 1.1149 to 0.9407 at 1.0072. Reaction from there, as well as 55 week EMA (now at 1.0128) will reveal whether the trend is reversing.
EUR/JPY Daily Outlook
Daily Pivots: (S1) 145.94; (P) 146.66; (R1) 147.68; More....
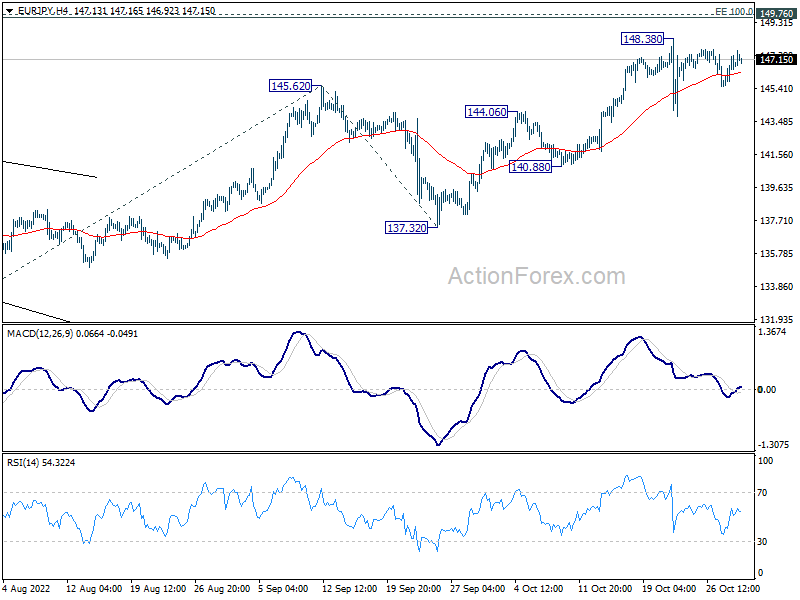
EUR/JPY is staying in consolidation below 148.38 and intraday bias remains neutral. In case of another fall, downside should be contained 140.88/144.06 support zone to bring another rally. Break of 148.38 will resume larger up trend to 100% projection of 133.38 to 145.62 from 137.32 at 149.56, which is close to 149.76 long term resistance.
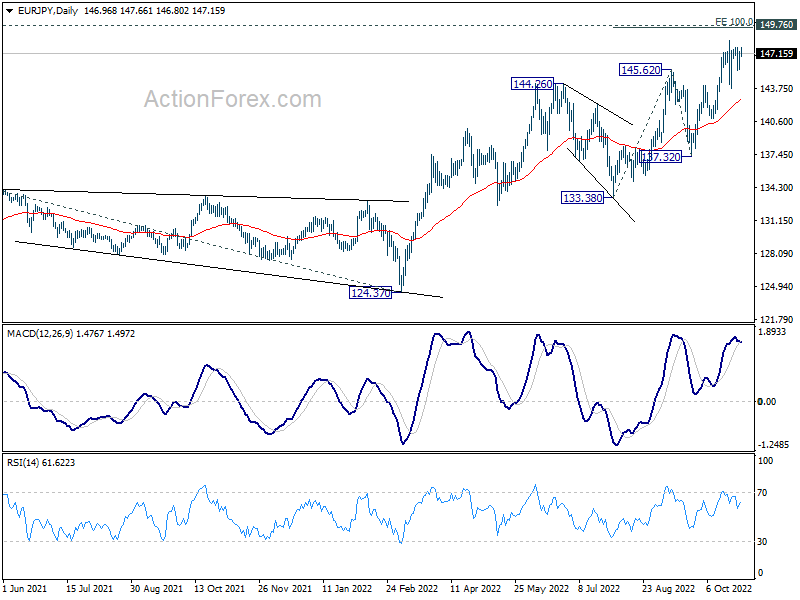
In the bigger picture, the up trend from 114.42 (2020 low) is still in progress for 149.76 (2014 high). Decisive break there will pave the way to 161.8% projection of 114.42 to 134.11 from 124.37 at 156.22. This will now remain the favored case as long as 137.32 support holds.
Wheat Futures Jump, China Slows, Attention Shifts to FOMC
Despite the broadly disappointing Big Tech earnings, and the heavy selloff we saw in most Big Tech stocks, US equities ended last week on a positive note, thanks to record profits from US Big Oil companies, and a much better than expected reaction to Apple results.
Big oil reveal big profits
Exxon Mobil posted the strongest quarter of its 152-year history. The company tripled its earnings compared to the same time last year, and made an almost $20 billion profit in Q3 on the back of higher production and soaring nat as prices. Exxon shares rallied almost 3%, and they recorded their best month on record with a nice 27% jump over the month.
Chevron, on the other hand, made a bit more than $11 billion, a bit less than last quarter, but better than market expectations and almost double the amount it made a year ago. Together with Exxon, they made a combined $30bn in just three months. The stock gained more than 1%.
In the UK, Shell also announced $9billion revenue last quarter, increased its dividend by 15% and announced a $4 billion share buyback program. The stock broke above the June-October horizontal range, to the upside. BP is due announce earnings tomorrow and will likely have a similar surprise for its investors.
In the meantime, the American crude consolidates above the 50-DMA, but failed to clear the $90 offers last week, as recession fears prevent a further rally from developing.
Higher oil prices mean higher inflation. Higher inflation means tighter Fed, and other central banks, and tighter central bank policies mean less growth, which in return means less demand for oil - even though, oil demand is expected to increase to record levels next year, and there is not enough oil, or enough willingness from oil producers to satisfy that extra demand.
Therefore, the downside in oil is as strongly capped as the upside. Solid support is seen around $78/82 region, and oil will be posting its first monthly advance since May.
Powell could again slap the Fed doves
Released last Friday, the US PCE index, which is a gauge of inflation closely monitored by the Federal Reserve (Fed) remained flat at 6.2% over the year, while the core PCE continued increasing, but happily less than expected.
The US core PCE now stands at 5.1% - that’s more than twice the Fed’s 2% policy target. Therefore, even though the data was less scary than many feared, it will hardly change the Fed’s plan to hike the rates by another 75bp this week, which is given some 80% probability at the start of this week.
What’s more important than the rate hike itself is what the Fed will be doing next. While some Fed members voiced possibility of slowing the pace of rate increases over the past weeks, there is a good chance that Jerome Powell slashes the dovish hopes this week, as he has done earlier this year. If that’s the case, we could see positive market vibes evaporate.
Bad news
Russia decided to pull out of a deal to allow Ukrainian crop shipments, blaming strikes on its naval fleet, which it said was due to drone attacks that were launched from Odessa. Turkey and the UN will be trying hard to save the pact, but we already see wheat futures jump more than 5% this morning - which is also bad for inflation expectations.
China on other hand missed both the manufacturing and services PMI expectations; both PMI indices slipped below 50, to the contraction zone in October due to Covid restrictions in major cities, and many cities are still dealing with lockdown measures, and Xi Jinping made sure to emphasize that he will continue to fight… the virus.
In Brazil, Lula won the election bearing Bolsonaro by less than 2 percentage points. The latter said he refuses the defeat, which means that we will see some more political uncertainty in Brazil in the coming weeks.
High European Inflation Data Push Yields Higher Again
Market movers today
Today we get euro area HICP figures for October. Following the higher than expected prints out of Germany, Italy and France we expect an increase to 10.8% from 9.9% in September.
We also get Q3 flash GDP figures for the euro area. Following some better than expected country figures last week, we expect 0.3% qoq growth.
This week, markets' main focus will be on the US with both FOMC meeting and jobs report. We think it is too early to turn soft for the Fed, and we look for a 75bp hike and hawkish communication. We expect to see a relatively strong jobs report with another 220,000 employed.
We also have the Bank of England meeting this week. Markets lean towards a 75 bp rate hike.
The 60 second overview
Inflation: European inflation continues to surprise on the upside. On Friday German CPI for October rose to 10.4% from 10.0% in September. The HCPI measure jumped from 10.9% to 11.6%. In Italy the jump in inflation was even bigger as October HICP rose from 9.4% in September to 12.8% in October. Spain, however, was the "positive" surprise with headline inflation rising "just" 7.3% in October down from 9.0% in September. Part of the explanation is that Spanish energy inflation is now lower reflects the drop in natural gas and power prices in October that contrary to e.g. Germany feeds quickly into consumer prices. Today, we will see the euro area HCPI figures. Taking into account the numbers on Friday we expect a jump from 9.9% to 10.8%.
Brazil: Luiz Inácio Lula da Silva beat the incumbent Jair Bolsonaro in a heated second round of Brazil's presidential election. Lula won 50.9% percent of the votes versus Bolsonaro's 49.1%. Thanks to an electric voting system, the result was ready after three hours of counting. The electric voting system is only one of the things criticised by Bolsonaro during his election campaign, and many fear he may not accept a defeat but could instead instigate his voters to protest, in the worst case, triggering broad social unrest and instability. Lula is a 77-year old left-winger who served as Brazil's president from 2003 until 2010. His pledge to end illegal deforestation of the Amazon is good news for the global fight against climate change. Yet, his reputation has been tarnished by accusations of corruption despite the court annulling his convictions. During his last time in power, a commodity price boom helped him push through successful social reforms that led to a substantial reduction in poverty. This time around, we can expect more centrist and moderate policies as Lula will have to govern a much divided country together with a broadly right-leaning Congress.
Bond sell-off: The higher than expected CPI numbers on Friday triggered a new move higher in European yields with 10Y bunds up 14bp to 2.10% and a new repricing of the ECB. The market is now pricing in roughly a peak in ECB rates at 2.75%. It was below 2.60% after the ECB meeting on Thursday that was perceived "dovish" by the market. That said, yields and rate expectations are still significantly lower than they were two weeks ago. The next couple of months we see further upside. However, as we discuss in Yield Outlook: Pressure on long yields to set to ease as central bank rates and inflation approach a turning point that we published on 28 October, the market is now looking for a change in central bank rhetoric (a pivot) and a peak in inflation which should point towards stable to lower yields in 2023. In respect of that, note that the Dutch ECB member Knot yesterday openly admitted that a recession is likely though he still calls for a 50 or 75bp hike in December.
Japan: On Friday, the Japanese government announced a USD270 billion (5.5% of GDP) spending package to ease inflation pains. This includes subsidies to cut utility bills. Electricity bills will be cut by roughly 20% from January to September next year, which will pull inflation lower. The package will largely be financed by an extra budget and thus more debt.
Equities rose Friday led by a strong US cash session where most indices ended close to day-high. Huge sector differences with the tech sector 3% higher and consumer discretionary 1%. These two cyclical sectors are normally strongly positive correlated but on Friday the effect of earnings reports sent the two sectors in opposite directions. The general take on earnings results hand-in Friday was positive, which probably boosted sentiment. With 53% reported of the S&P 500 companies, we have the earnings surprise factor at 3.5%. This is below the historical average despite revenues once again coming in at super solid surprise factor at 1.4%, which is way above the historical average. US equities on Friday, Dow +2.6%, S&P 500 +2.5%, Nasdaq +2.9% and Russell 2000 +2.3%. Asian markets higher this morning with China mainland being a negative outlier. European futures are higher this morning while US futures are mixed.
FI: The main event this week is the Federal Reserve meeting on Wednesday, where the consensus expectation is for a rate hike of 75bp. This is fully priced in the market rates, and the focus will be on the comments regarding policy outlook and the terminal rate. On top of this, there is the Bank of England meeting on Thursday and the US labour market report on Friday.
FX: EUR/USD slid back down below parity on Friday, where short-term EUR interest rates rebounded. USD/JPY rose close to 148 due to high oil price and higher US Treasury yields.
Credit: Credit markets were back in a positive mood on Friday weighing prospects of further relief to rates markets. Itrax main tightened 1.7bp to close at 116.6bp while Itrax main tightened 11.9bp to close at 542.8bp (the tightest level since mid-September).
Nordic macro
Sweden: In Sweden, we get wage data for August at 08:00 and at 14:30 Stefan Ingves participates in a panel discussion about price stability at Danmarks Nationalbank. We do not expect new signals there. Perhaps better chance for that tomorrow when he gives a speech about the economic outlook. Tomorrow we also have PMI figures and on Wednesday the Riksbank's company survey is published, which will give interesting anecdotal evidence how the economy is faring.
GBP/JPY Daily Outlook
Daily Pivots: (S1) 169.66; (P) 170.52; (R1) 172.16; More...
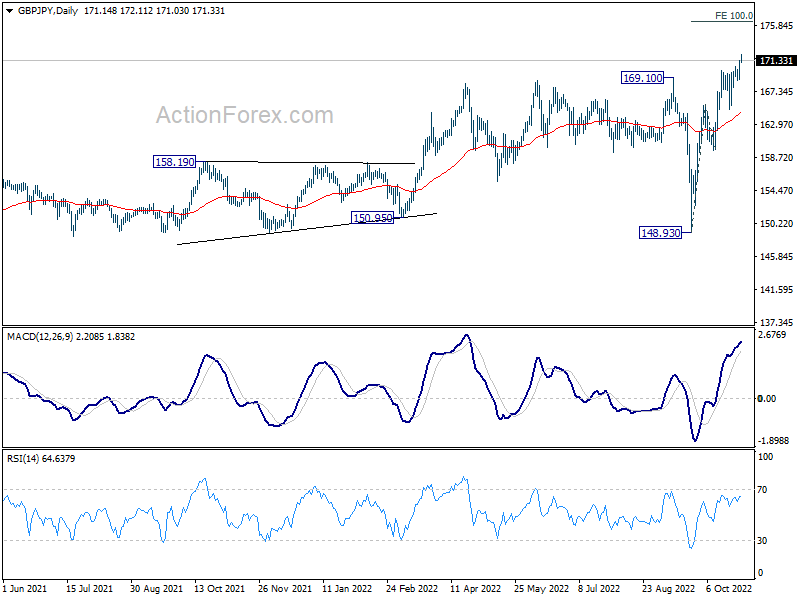
Intraday bias in GBP/JPY remains on the upside at this point. Current rally should target 100% projection of 148.93 to 165.69 from 159.71 at 176.47 next. On the downside, break of 168.71 minor support will turn intraday bias neutral and bring consolidations, before staging another rally.
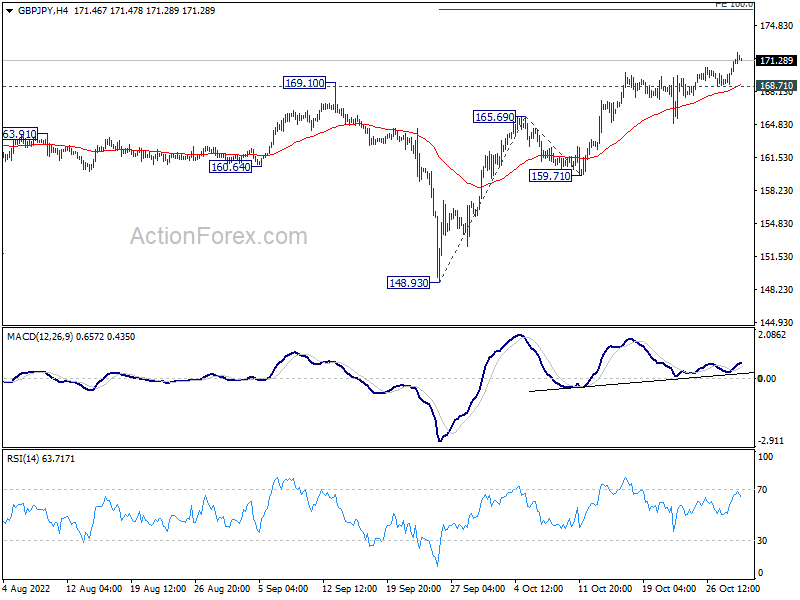
In the bigger picture, up trend from 123.94 (2020 low), as part of the trend from 122.75 (2016 low) is still in progress. Further rise would be seen to 161.8% projection of 122.75 to 156.59 (2018 high) from 123.94 at 178.69. This will now remain the favored case as long as 148.93 support holds.
Yen Mildly Lower in Quiet Trading; RBA, Fed and BoE to Hike This Week
Yen trades generally lower in quite Asian session today, but markets are relatively steady elsewhere. Stock markets are mixed with Nikkei closing higher, following the rebound in the US last Friday. But China is weighed down by poor PMI data. Generally speaking, traders are cautious ahead of many key events ahead in the week, including rate decisions of Fed, BoE and RBA, as well as some heavy weight data like non-farm payrolls.
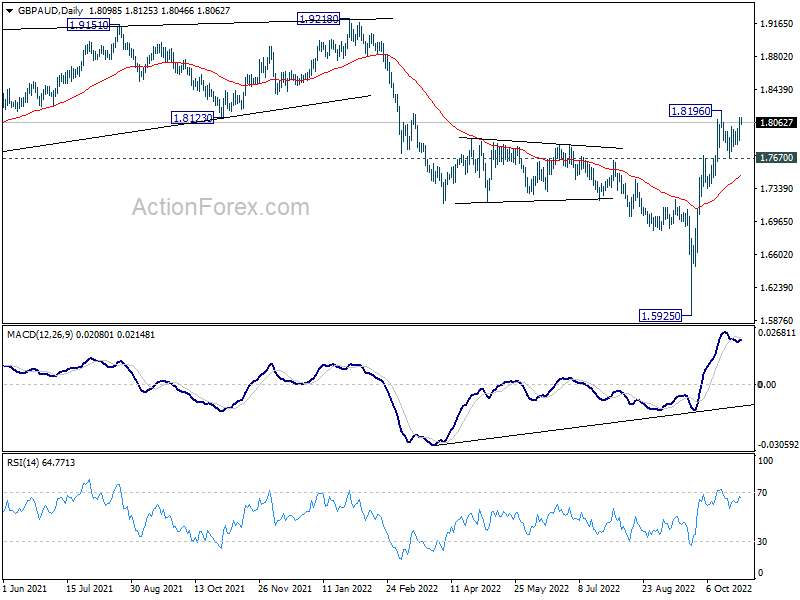
GBP/AUD is an interesting one to watch this week. The cross is now back above pre-Truss level while BoE is expected to outpace RBA's tightening for the next few months. As long as 1.7670 support holds, an upside breakout should happen sooner rather than later. Rise from 1.5925 should then be on track to take on 1.9218 medium term resistance, probably later in the quarter.
In Asia, Nikkei closed up 1.64%. Hong Kong HSI is up 0.08%. China Shanghai SSE is down -0.72%. Singapore Strait Times is up 1.78%. Japan 10-year JGB yield is up 0.0009 at 0.243.
ECB Knot: We're not in even half-time yet in inflation fight
ECB Governing Council member Klaas Knot said on Sunday, "we will take a significant interest step again in December," adding that next hike would either be 50bps or 75bps.
He said, "we are not in even half-time yet" in the fight against inflation. "We are still returning interest rates towards their neutral level, for which we will also need the December meeting."
"From 2023 we will play the second half, with smaller interest rate steps and by shrinking our balance sheet," he said. "Then we will be in the zone where we will effectively cool down the economy, which is necessary to bring inflation down from 10% to 2% in the next 18 to 24 months."
Japan industrial production dropped -1.6% mom, as auto-related production dived
Japan industrial production declined -1.6% mom in September, below expectation of -1.0% mom. That's also the first contract in four months. The fall was driven by -12.4% mom decline in auto-related production, the steepest fall in eight months.
Manufacturers surveyed by the Ministry of Economy, Trade and Industry (METI) expected output to fall another -0.4% in October and then rise 0.8% in November.
Retail sales rose 4.5% yoy in September, above expectation of 4.1% yoy. Housing starts rose 1.0% yoy, below expectation of 2.3% yoy.
In October, consumer confidence dropped from 30.8 to 29.9, below expectation of 31.5.
Australia retail sales rose 0.6% mom in Sep
Australia retail sales rose 0.6% mom in September, matched expectations.
Ben Dorber, ABS head of retail statistics said, "This month's rise was again driven by the combined strength in the food industries. Food retailing rose 1.0 per cent, while cafes, restaurants, and takeaway food services rose 1.3 per cent.
"Many retailers remained open for the National Day of Mourning, an additional one-off public holiday in September, and this boosted spending on food, alcohol and dining out."
China PMI manufacturing and services fell to contraction
China PMI Manufacturing fell from 50.1 to 49.2 in October, below expectation of 50.0.
PMI Non-Manufacturing dropped from 50.6 to 48.7, below expectation of 50.2. Both readings were below 50-mark which separates growth from contraction on a monthly basis.
"In October, affected by the spread of the pandemic and other factors within the country, China's PMI fell, with the manufacturing PMI, non-manufacturing PMI and comprehensive PMI standing at 49.2 per cent, 48.7 per cent and 49.0 per cent, respectively, and the foundation of China's economic recovery needs to be further consolidated," said senior NBS statistician Zhao Qinghe.
"In October, the composite PMI stood at 49.0 per cent, down 1.9 percentage points from the previous month, falling below the critical point, indicating a general slowdown in the production and operating activities of Chinese enterprises."
RBA, Fed and BoE to hike; lots of data featured
Three central banks will meet this week. RBA is expected hike by 25bps to 2.85%. There are expectations that tightening will continue with two more 25bps hike in December and February before a pause. So, focuses will be on any indication from the Monetary Policy Statement.
Fed is expected to continue with another 75bps hike to 3.75-4.00%. There are also speculations that tightening pace will start to slow in December. Hence, markets will look for hints from Fed Chair Jerome Powell's press conference to confirm this view.
BoE is also widely expected to hike 75bps to 3.00%. The new economic projections might not be too meaningful, as the outlook will be heavily affected by the new government's new budget to be released in mid-November. Yet, the voting will still reveal some hints on the hawk/dove split in the MPC.
In addition to these central bank activities, economic data calendar is also ultra-busy. Non-far payroll report in the US, and ISM indexes should carry a large weight on Fed's decision in December. Other data to watch include Eurozone GDP and CPI flash, Swiss CPI, Canada employment, New Zealand employment and China PMIs.
Here are some highlights for the week:
- Monday: Japan industrial production, retail sales, consumer confidence, housing starts; Australia MI inflation gauge, private sector credit, retail sales; China PMIs; Germany retail sales; Swiss retail sales; UK M4 money supply, mortgage approvals; Eurozone CPI flash, GDP; US Chicago PMI.
- Tuesday: New Zealand building permits; Japan PMI manufacturing final; RBA rate decision; China Caixin PMI manufacturing; Germany import prices; Swiss SECO consumer climate, PMI manufacturing; UK PMI manufacturing final; Canada PMI manufacturing; ISM manufacturing, construction spending.
- Wednesday: Australia AiG manufacturing, building approvals; New Zealand employment, labor cost index; Japan monetary base, BoJ minutes; Germany trade balance, unemployment; Eurozone PMI manufacturing final; US ADP employment, FOMC rate decision.
- Thursday: Australia trade balance; China Caixin PMI services; Swiss CPI;UK PMI Services final, BoE rate decision; Eurozone unemployment rate; Canada building permits, trade balance; US jobless claims, non-farm productivity, trade balance, ISM services, factory orders.
- Friday: Australia AiG services; Germany factory orders; France industrial production; Eurozone PMI services final, PPI; UK PMI construction; Canada employment, Ivey PMI; US non-farm payroll employment.
GBP/JPY Daily Outlook
Daily Pivots: (S1) 169.66; (P) 170.52; (R1) 172.16; More...
Intraday bias in GBP/JPY remains on the upside at this point. Current rally should target 100% projection of 148.93 to 165.69 from 159.71 at 176.47 next. On the downside, break of 168.71 minor support will turn intraday bias neutral and bring consolidations, before staging another rally.
In the bigger picture, up trend from 123.94 (2020 low), as part of the trend from 122.75 (2016 low) is still in progress. Further rise would be seen to 161.8% projection of 122.75 to 156.59 (2018 high) from 123.94 at 178.69. This will now remain the favored case as long as 148.93 support holds.
Economic Indicators Update
| GMT | Ccy | Events | Actual | Forecast | Previous | Revised |
|---|---|---|---|---|---|---|
| 23:50 | JPY | Industrial Production M/M Sep P | -1.60% | -1.00% | 3.40% | |
| 23:50 | JPY | Retail Trade Y/Y Sep | 4.50% | 4.10% | 4.10% | |
| 00:00 | AUD | TD Securities Inflation M/M Oct | 0.40% | 0.50% | ||
| 00:30 | AUD | Private Sector Credit M/M Sep | 0.70% | 0.80% | 0.80% | |
| 00:30 | AUD | Retail Sales M/M Sep | 0.60% | 0.60% | 0.60% | |
| 01:00 | CNY | Manufacturing PMI Oct | 49.2 | 50 | 50.1 | |
| 01:00 | CNY | Non-Manufacturing PMI Oct | 48.7 | 50.2 | 50.6 | |
| 05:00 | JPY | Consumer Confidence Oct | 29.9 | 31.5 | 30.8 | |
| 05:00 | JPY | Housing Starts Y/Y Sep | 1.00% | 2.30% | 4.60% | |
| 07:00 | EUR | Germany Retail Sales M/M Sep | -0.50% | -1.30% | ||
| 07:30 | CHF | Real Retail Sales Y/Y Sep | 3.30% | 3.00% | ||
| 09:00 | EUR | Italy GDP Q/Q Q3 P | -0.10% | 1.10% | ||
| 09:30 | GBP | M4 Money Supply M/M Sep | 0.10% | -0.20% | ||
| 09:30 | GBP | Mortgage Approvals Sep | 66K | 74K | ||
| 10:00 | EUR | Eurozone GDP Q/Q Q3 P | 0.10% | 0.80% | ||
| 10:00 | EUR | Eurozone CPI Y/Y Oct P | 9.90% | 10.00% | ||
| 10:00 | EUR | Eurozone CPI Core Y/Y Oct P | 4.80% | 4.80% | ||
| 13:45 | USD | Chicago PMI Oct | 47.1 | 45.7 |
Technical Outlook and Review
USD/JPY:
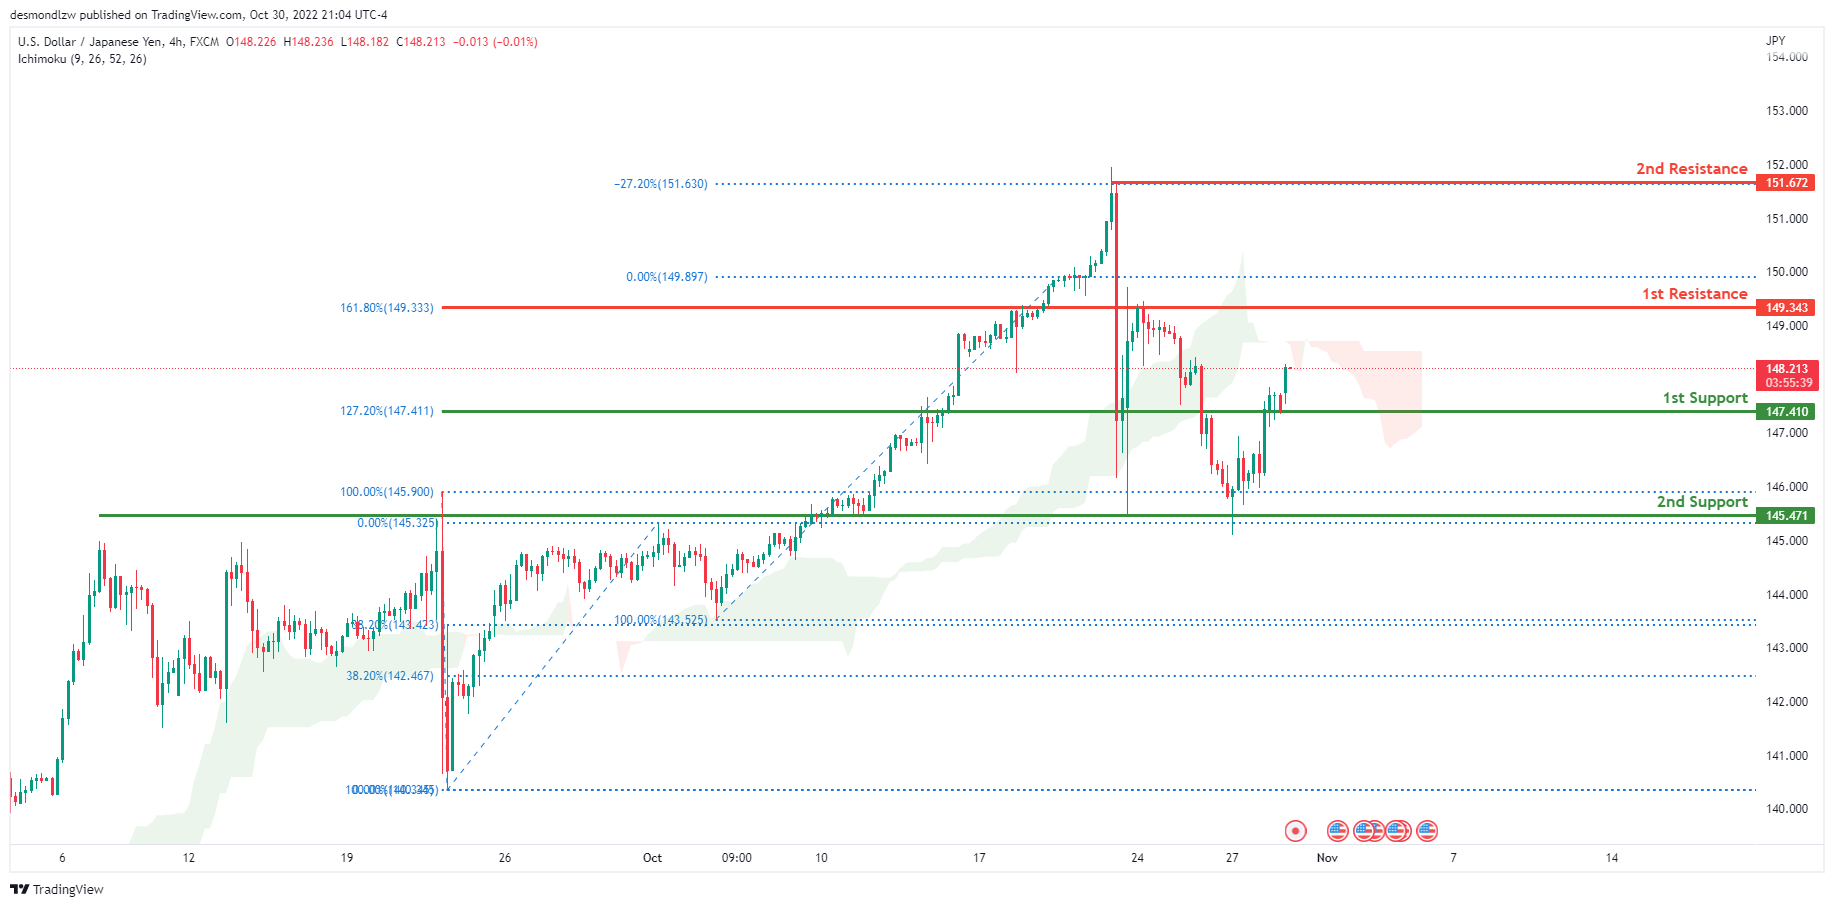
The current general bias for USDJPY on the H4 chart is bullish. Towards the end of last week, USDJPY had some bullish momentum upwards due to the strengthening of the DXY. Price is currently trading above the support at 148.214. If this bullish momentum continues, expect USDJPY to head upwards and retest the 1st resistance at 149.343 where the 161.8% Fibonacci extension line is located.
Areas of consideration:
- H4 time frame, 1st resistance at 149.343
- H4 time frame, 1st support at 147.410
DXY:
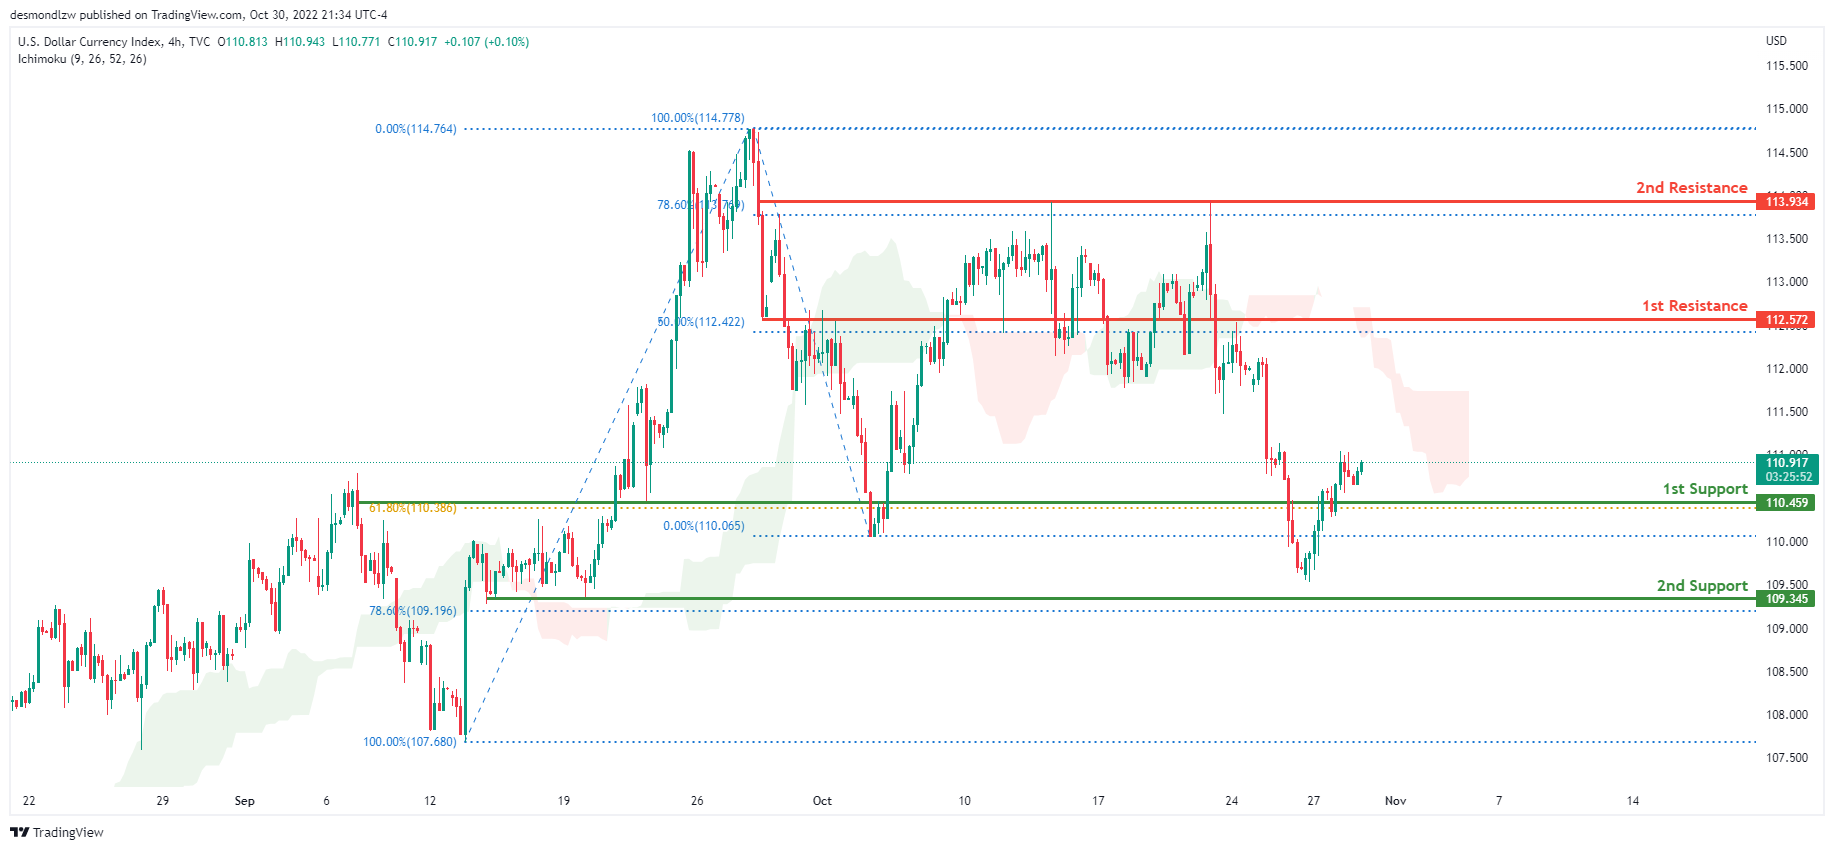
On the H4 chart, the overall bias for DXY is bearish. To add confluence to this, the price is below the Ichimoku cloud which indicates a bearish market. Towards the end of last week, DXY had bullish momentum going above the 1st support at 110.459 where the 61.8% Fibonacci line is located and is currently trading above it. If this bearish momentum continues, expect price to possibly head towards the 2nd support at 109.340, where the 78.6% Fibonacci line is located.
Areas of consideration:
- H4 time frame, 1st resistance at 112.572
- H4 time frame, 1st support at 110.459
EUR/USD:
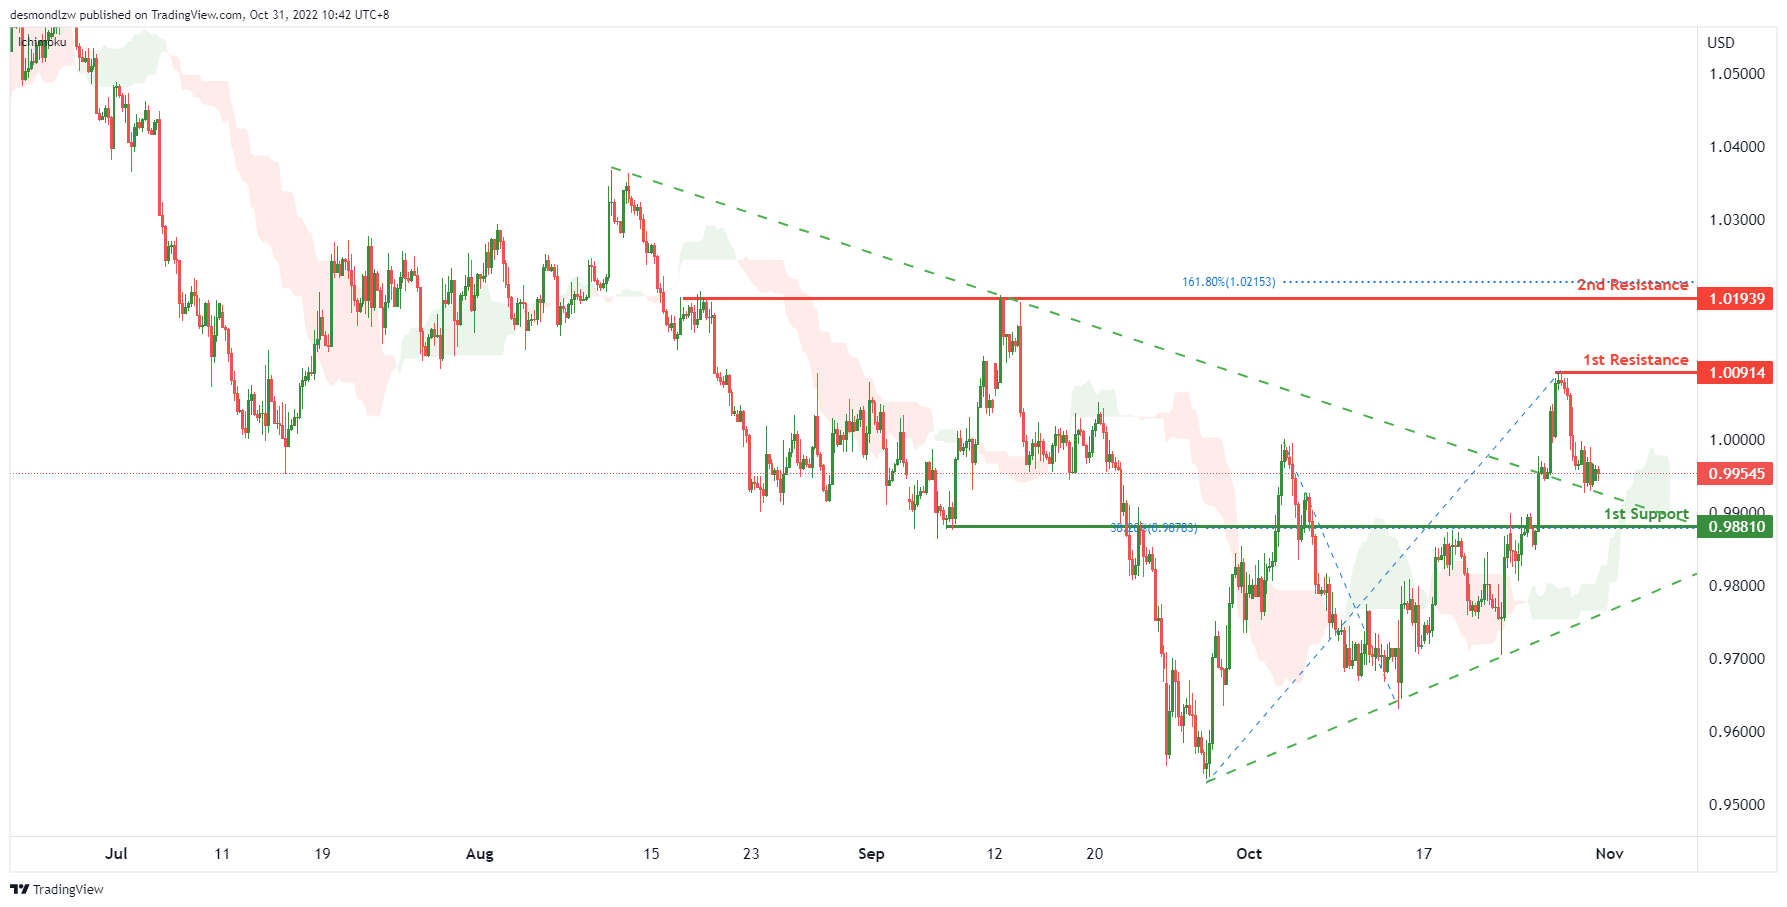
On the H4, price is dropping to the long term descending trendline, the price may drop to the 1st support at 0.98810, which is in line with the 38.2% fibonacci retracement and overlap support. Alternatively, as the price is above ichimoku cloud and short term ascending trendline, we can expect the price to rise to the 1st resistance at 1.00914, which is in line with the previous swing high. If the 1st resistance is broken, the 2nd resistance is at 1.01939, where the 161.8% fibonacci extension and previous swing highs are.
Areas of consideration :
- H4 1st support at 0.98810
- H4 1st resistance at 1.00914
GBP/USD:
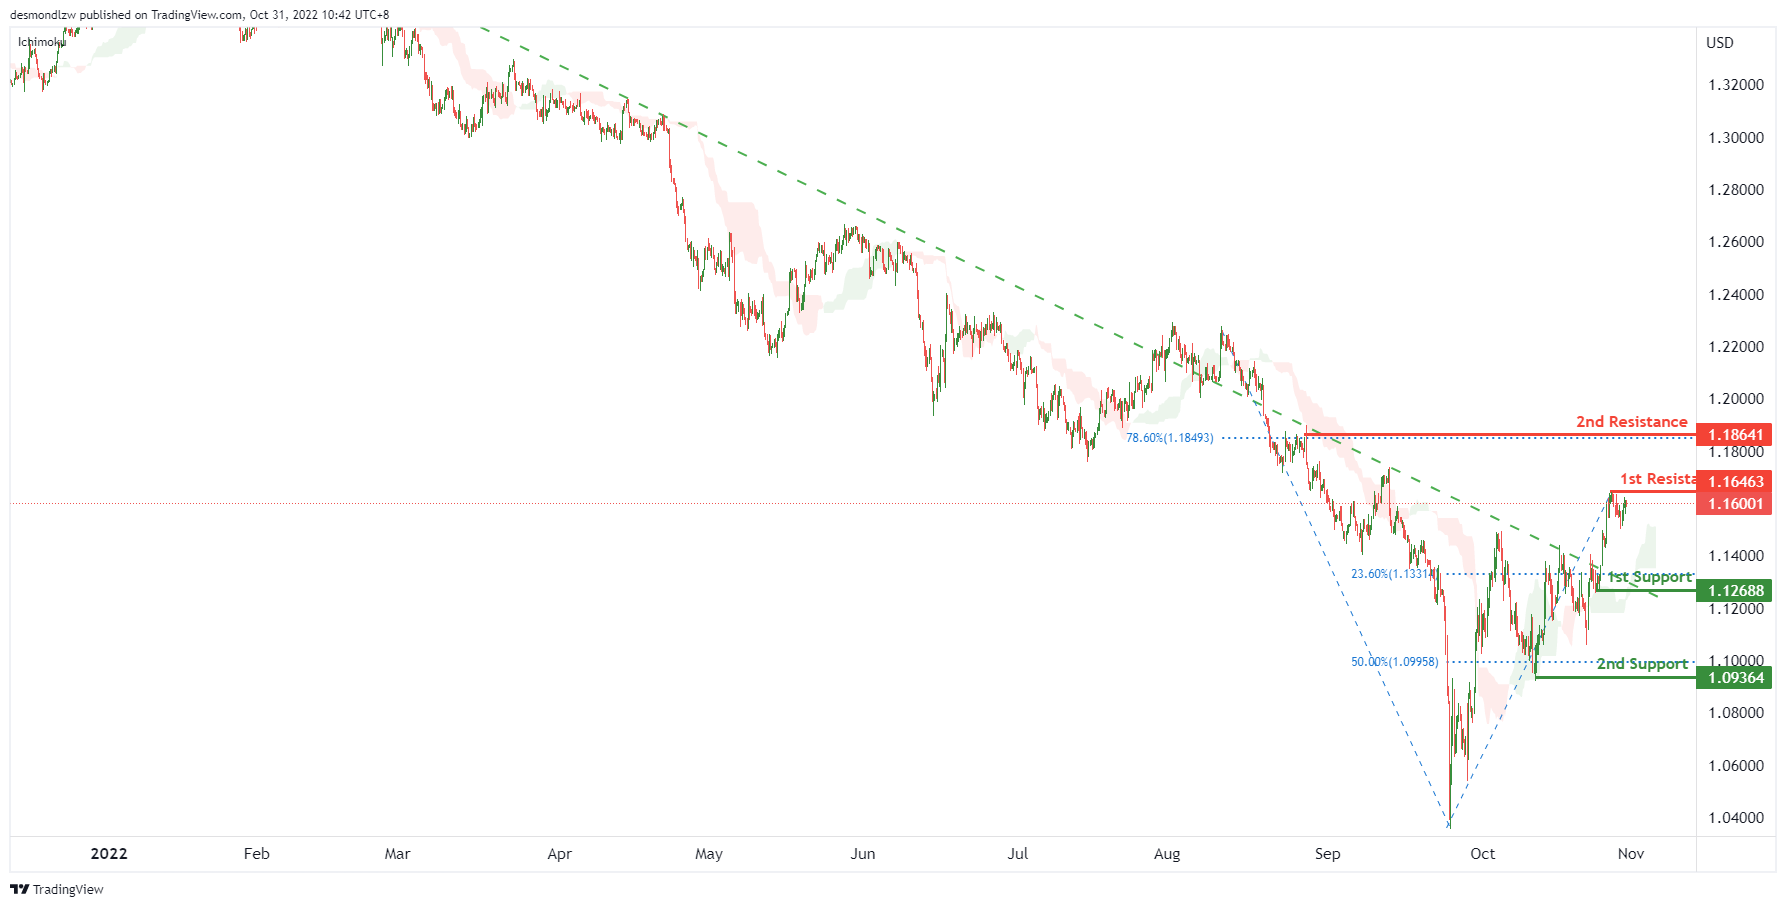
On the H4, price is crossing the ichimoku cloud and breaking the descending trendline, we have a bullish bias that the price may test the 1st resistance at 1.16463, which is in line with the previous swing high. If the 1st resistance is broken, the 2nd resistance is at 1.18641, where the 78.6% fibonacci retracement sits. Alternatively, the price may drop to the 1st support at 1.12688, where the swing low support and 23.6% fibonacci retracement are. If the 1st support is broken, the 2nd support is at 1.09364, which is in line with the 50% fibonacci retracement.
Areas of consideration:
- H4 1st resistance at 1.16463
- H4 2nd resistance is at 1.18641
USD/CHF:
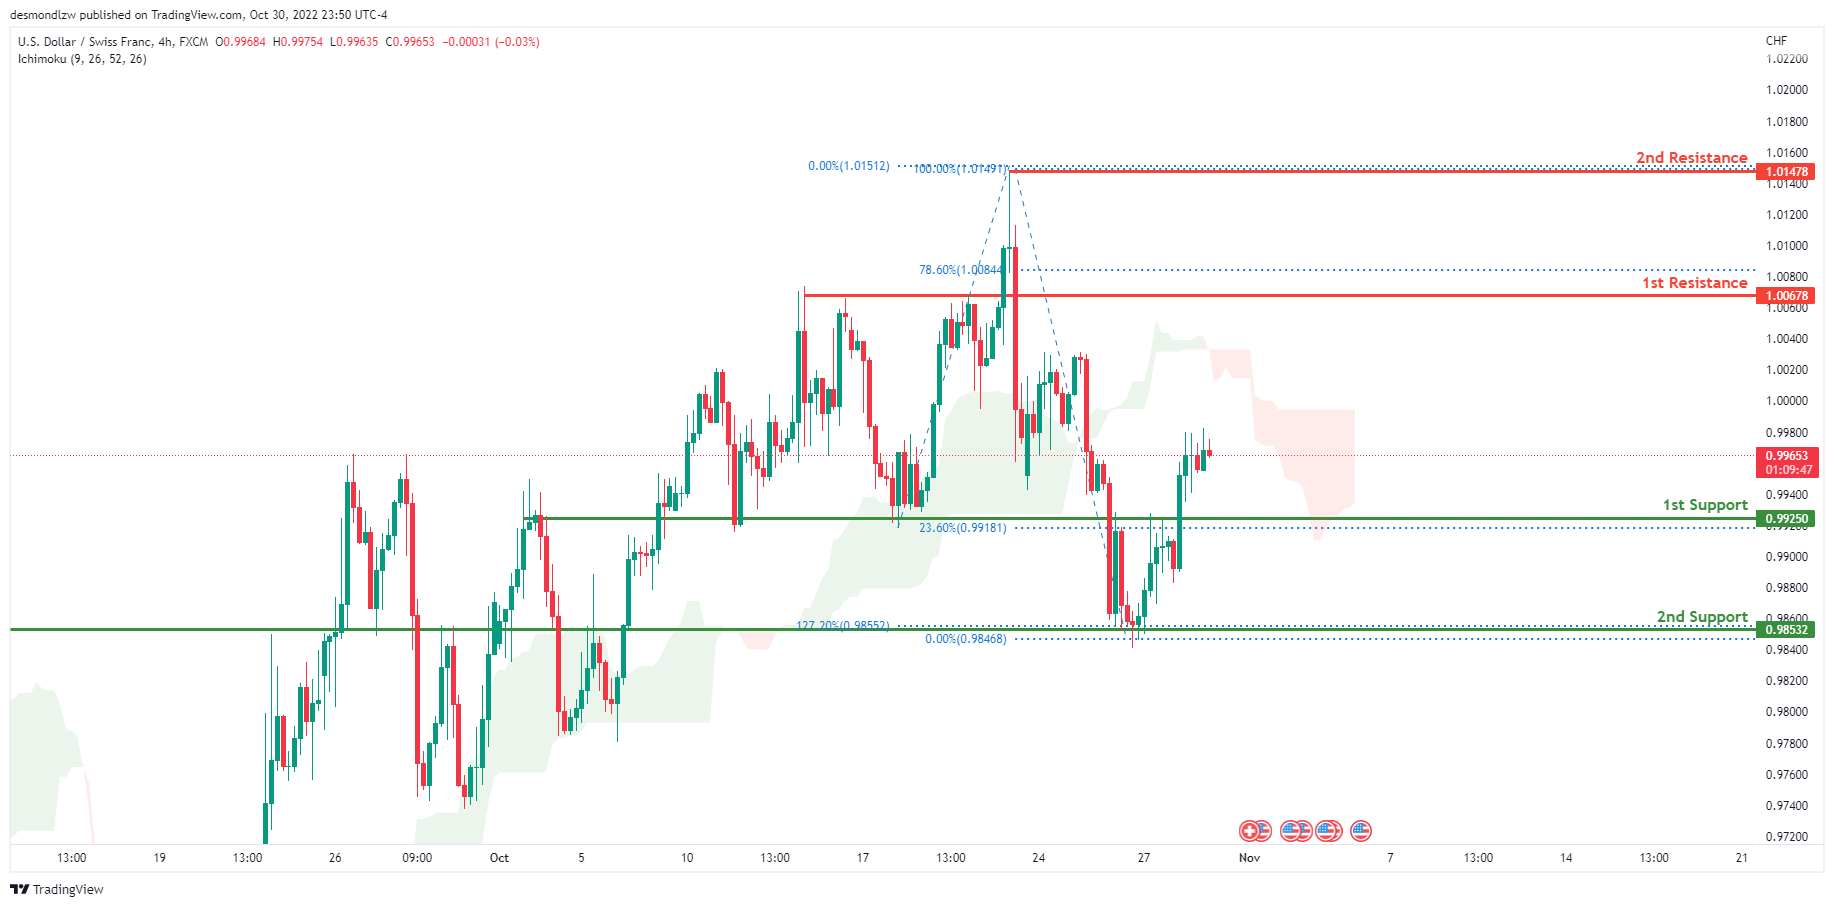
On the H4 chart, the overall bias for USDCHF is bearish. To add confluence to this, the price is below the Ichimoku cloud which indicates a bearish market. Towards the end of last week, USDCHF had some bullish momentum with price bouncing off the 2nd support at 0.98532 with price currently trading above the 1st support at 0.99250 where the 23.6% Fibonacci line is located. Expecting price to possibly head back up to retest the 1st resistance line at 1.00678 where the 78.6% Fibonacci line is located.
Areas of consideration
- H4 1st support at 0.99250
- H4 2nd support at 0.98532
- H4 1st resistance at 1.00678
XAU/USD (GOLD):
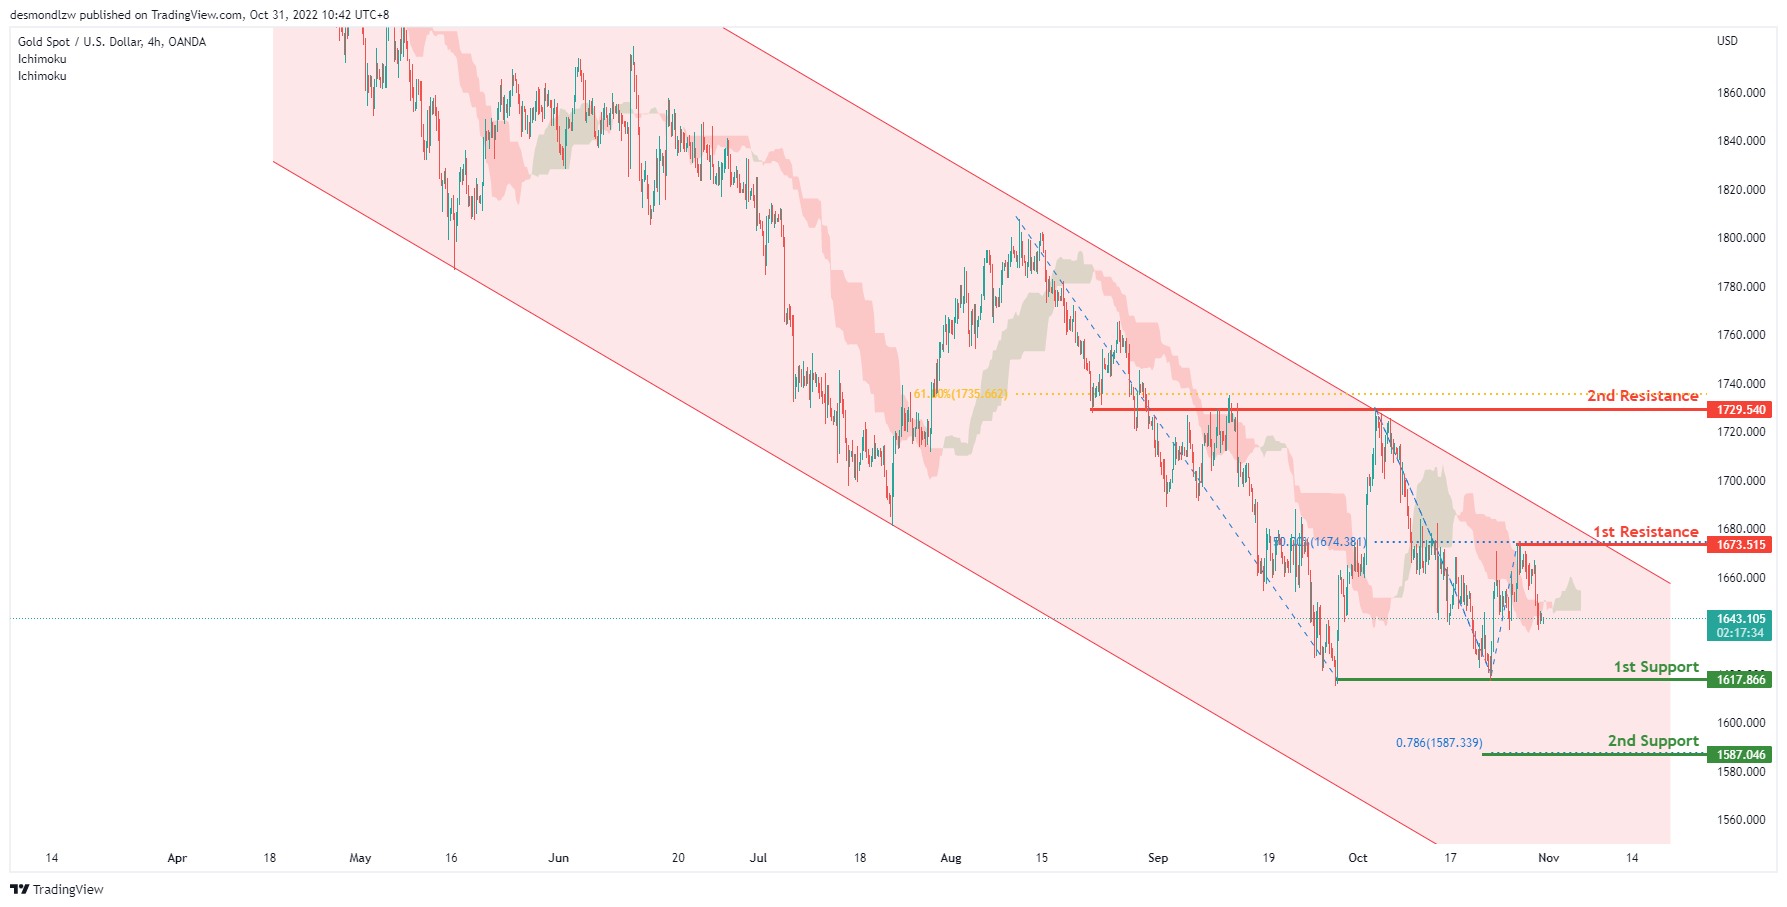
On H4, with the price within the descending channel and crossing ichimoku cloud, we have a bearish bias that the price may drop to test the 1st support at 1617.866, where the previous swing lows are. If the 1st support is broken, the 2nd support could be at 1587.046, which is in line with the 78.6% fibonacci projection. Alternatively, the price may rise to retest the 1st resistance at 1673.515, which is in line with the 50% fibonacci retracement and previous swing high. If the 1st resistance is broken, the 2nd resistance is at 1729.540, where the 61.8% fibonacci retracement and previous swing high are.
Areas of consideration:
- H4 time frame, 1st resistance at 1673.515
- H4 time frame, 1st support at 1617.866
AUD/USD:
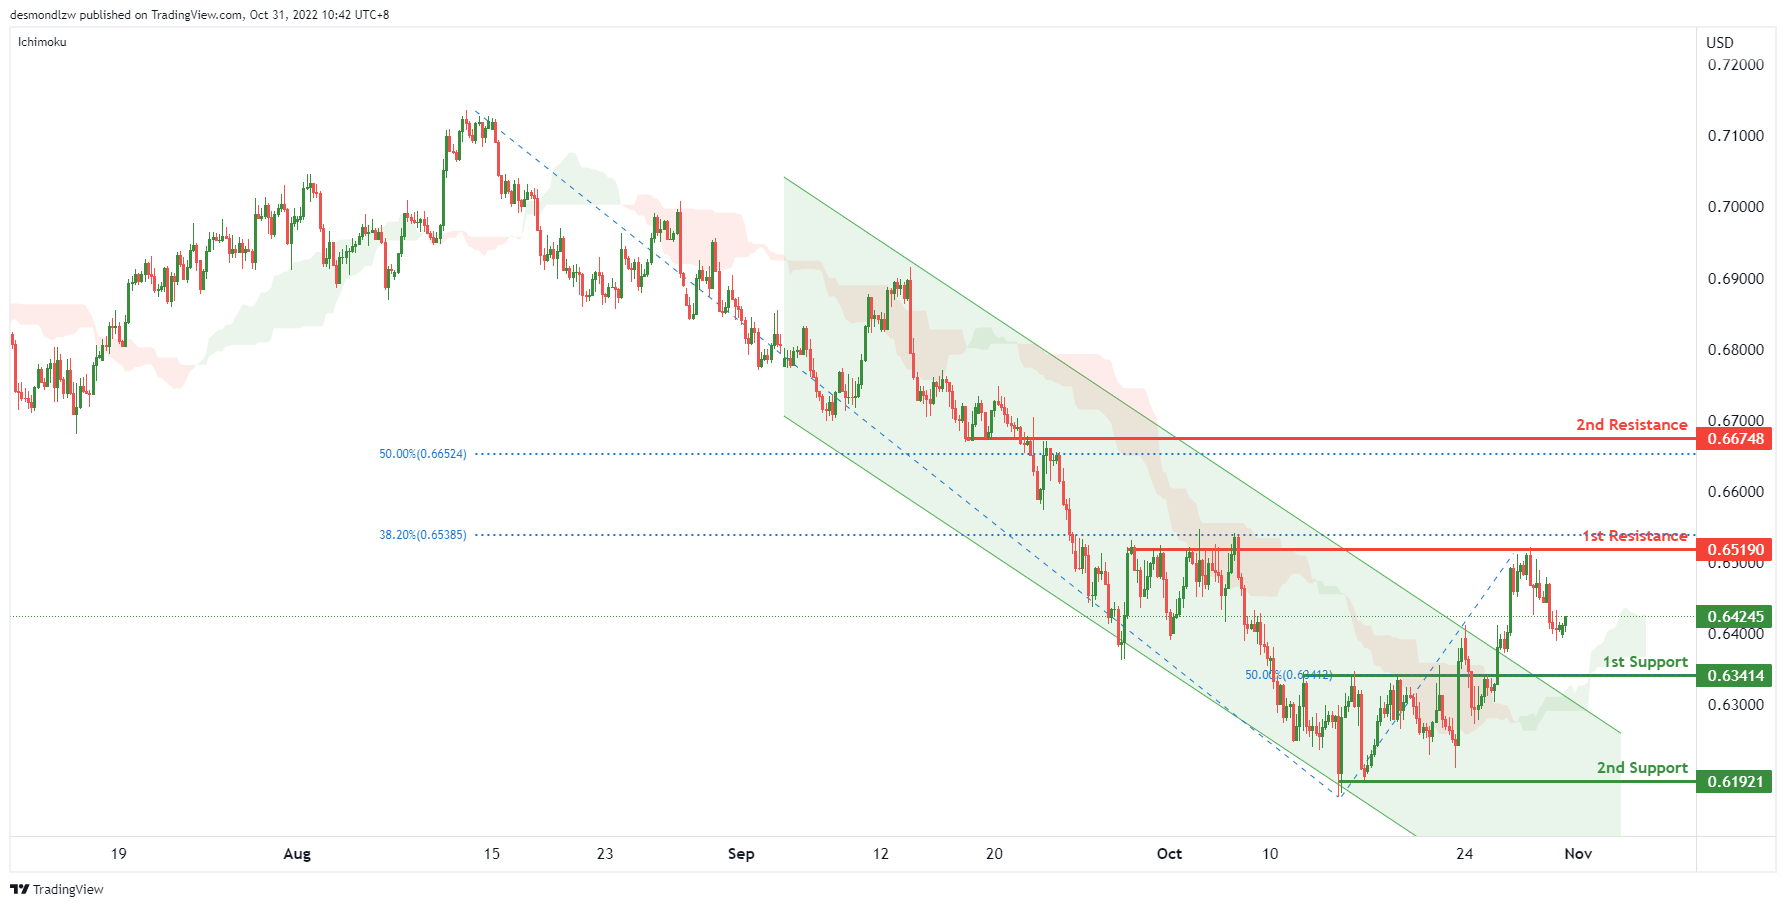
On the H4, with the price breaking the descending channel and above ichimoku cloud, we have a bullish bias that the price may retest the 1st resistance at 0.65190, which is in line with the overlap resistance, if the 1st resistance is broken, the 2nd resistance is at 0.66748, where the 50% fibonacci retracement is. Alternatively, the price may drop to the 1st support at 0.63414, which is in line with the 50% fibonacci retracement. If the 1st support is broken, the price may drop to the 2nd support at 0.61921, where the previous swing low is.
Areas of consideration
- H4, 1st resistance at 0.65190
- H4, 1st support at 0.63414
NZD/USD:
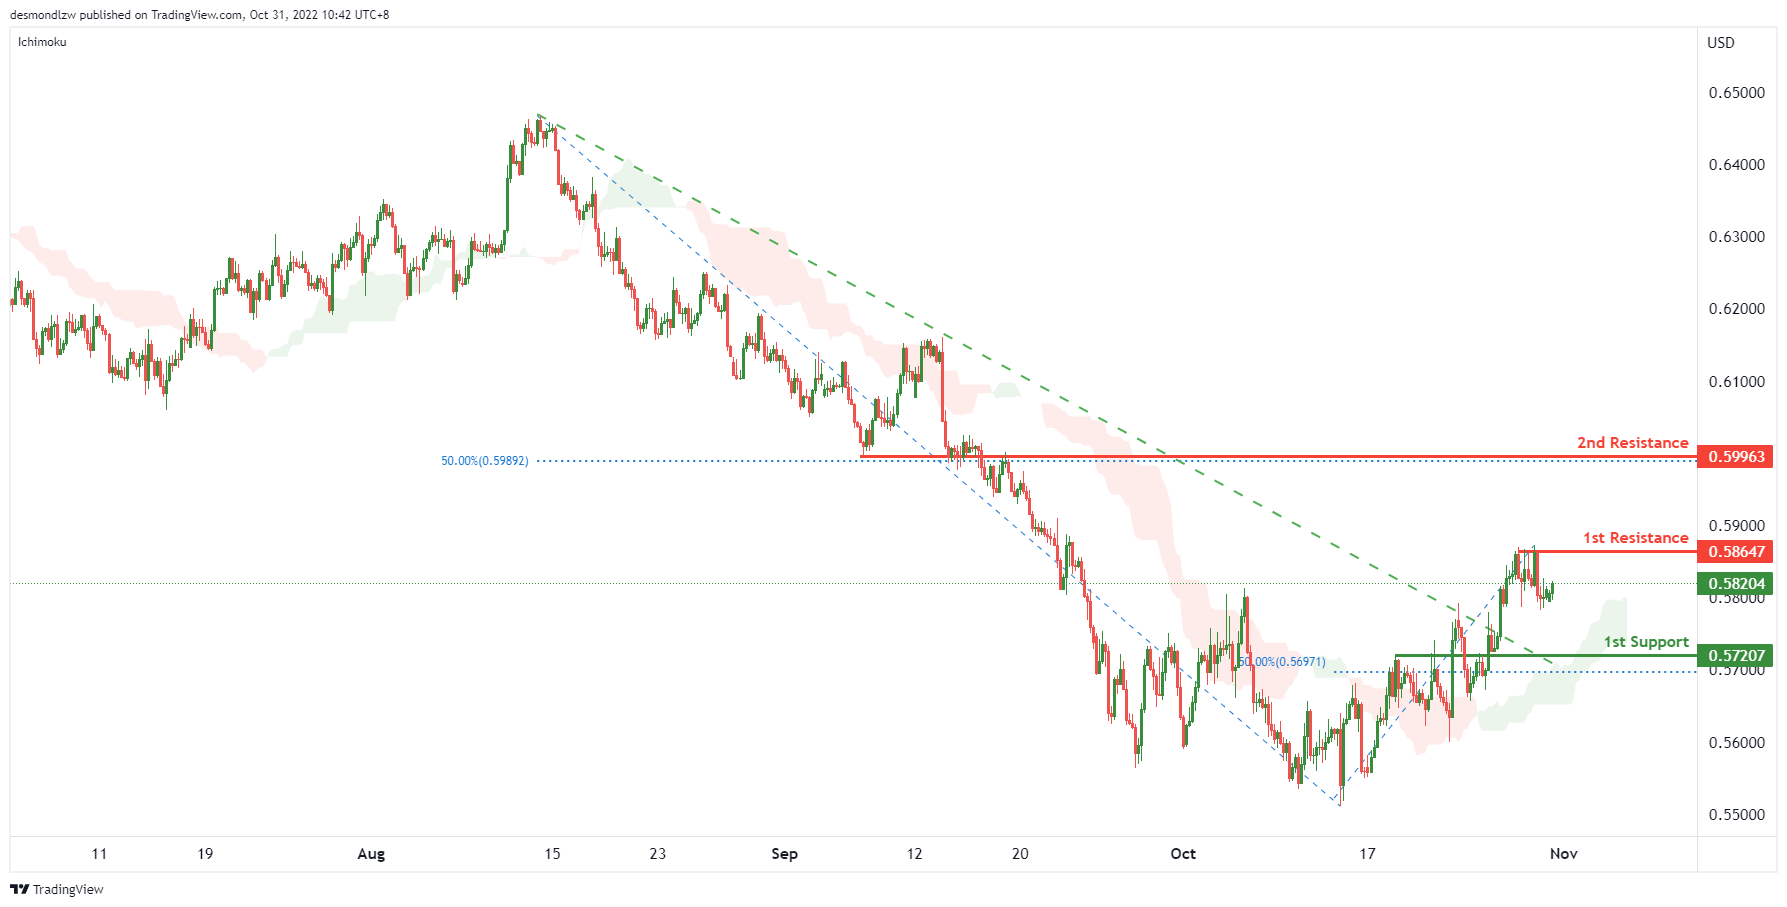
On the H4 chart, as the price is breaking the descending trendline and the price is above ichimoku cloud, we have a bullish bias that the price may rise to the 1st resistance at 0.58647, which is in line with the previous swing high. If the 1st resistance is broken, the 2nd resistance is at 0.59963, where the 50% fibonacci retracement is. Alternatively, the price may drop to the 1st support at 0.57207, where the previous swing low and 50% fibonacci retracement are.
Areas of consideration:
- H4 time frame, 1st resistance at 0.58647
- H4 time frame, 2nd resistance is at 0.59963
USD/CAD:
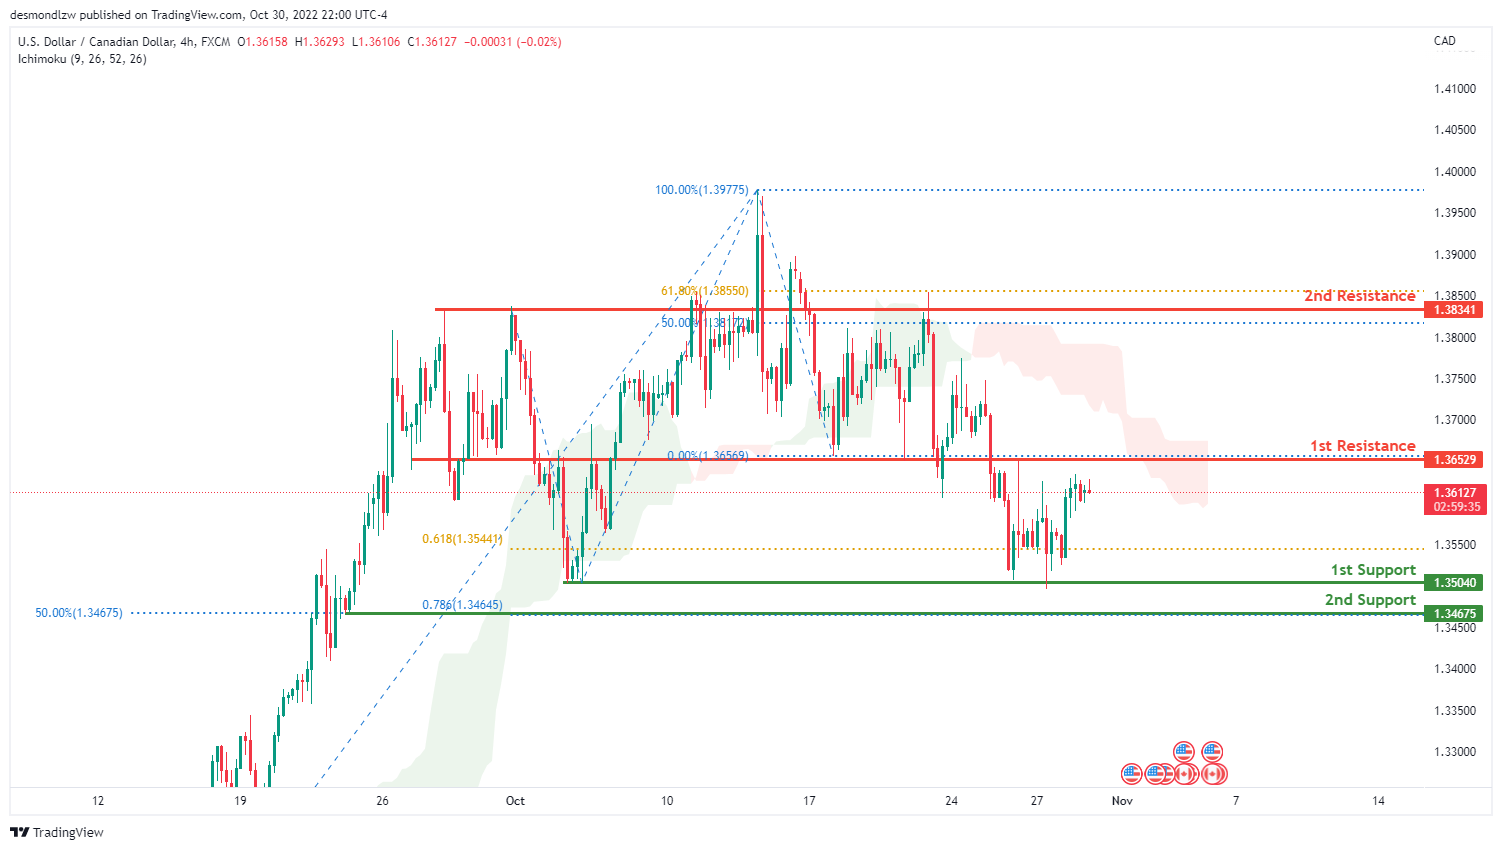
On the H4 chart, the overall bias for USDCAD is bearish. To add confluence to this, the price is below the Ichimoku cloud which indicates a bearish market. Towards the end of last week, price reflected off the 1st support at 1.35029 where the previous low is. If this bearish momentum continues, expect price to break the 1st support and head towards the 2nd support at 1.34675 where the -61.8% Fibonacci expansion line and 50% Fibonacci line is located.
Areas of consideration:
- H4 time frame, 1st resistance at 1.36751
- H4 time frame, 1st support at 1.35029
- H4 time frame, 2nd support at 1.34675
OIL:
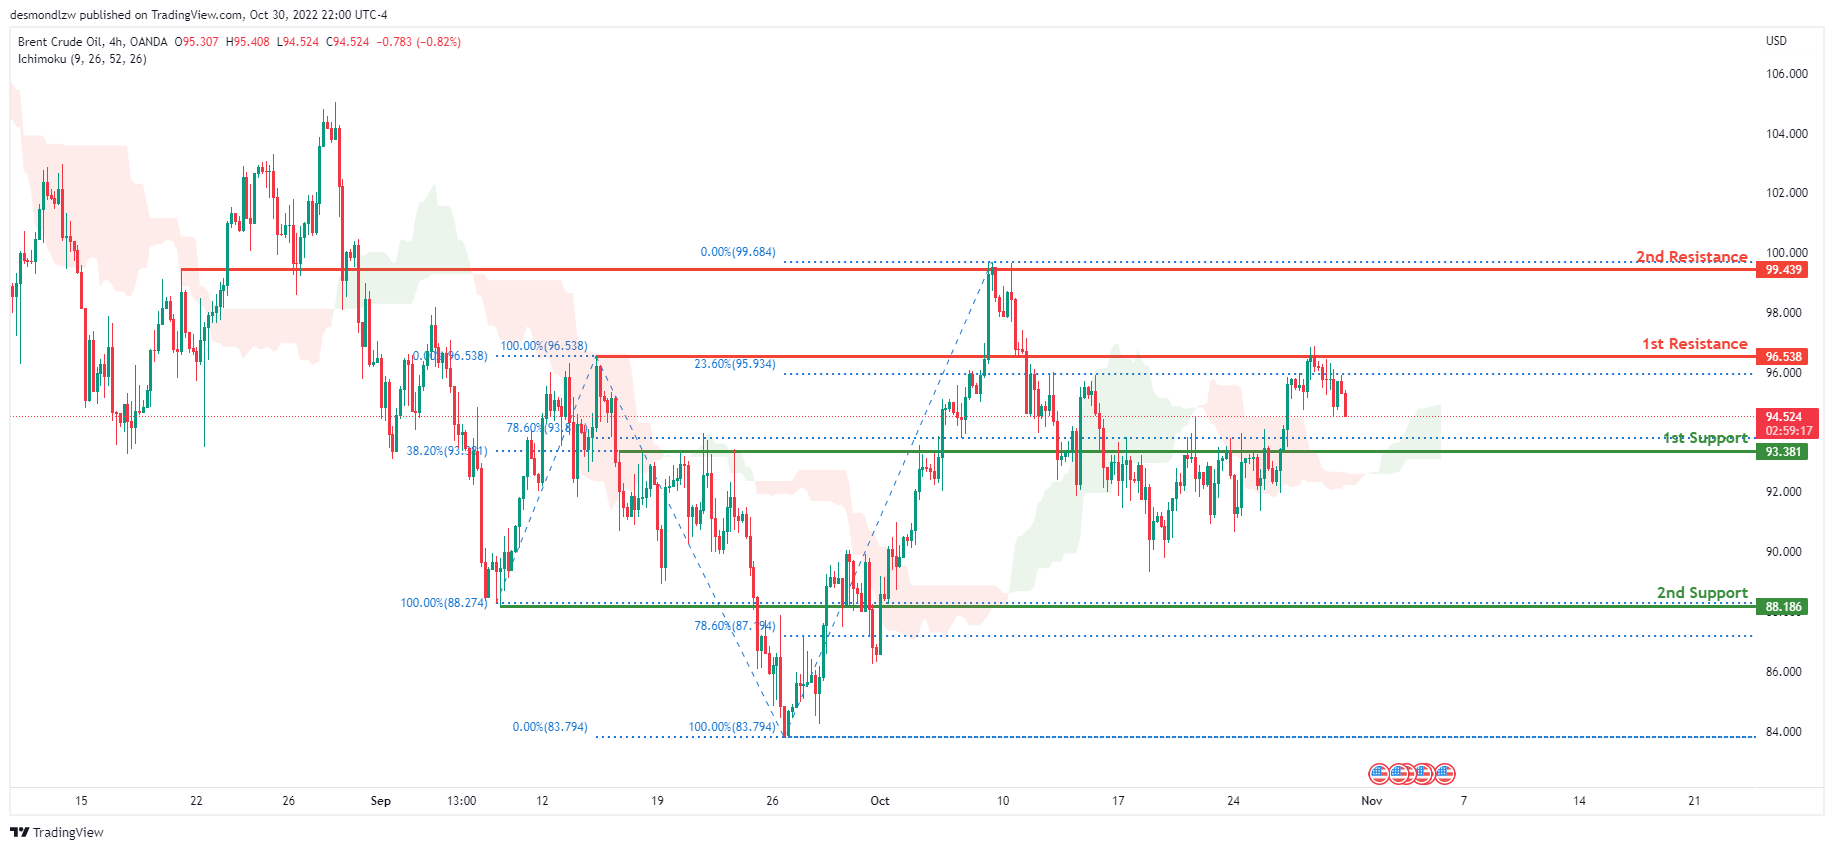
Looking at the H4 chart, the current overall bias for Oil is bullish. To add confluence to this, the price is above the Ichimoku cloud which indicates a bullish market. Towards the end of last week, price reflected off the 1st resistance line at 96.538 where the 100% and 23.6% Fibonacci lines are. If this bullish momentum continues, expect price to possibly break above the 1st resistance and head towards the 2nd resistance at 99.439 where previous swing high and 0% Fibonacci line is located.
Areas of consideration:
- H4 time frame, 1st resistance at 93.381
- H4 time frame, 2nd resistance at 99.439
- H4 time frame, 1st support at 93.381
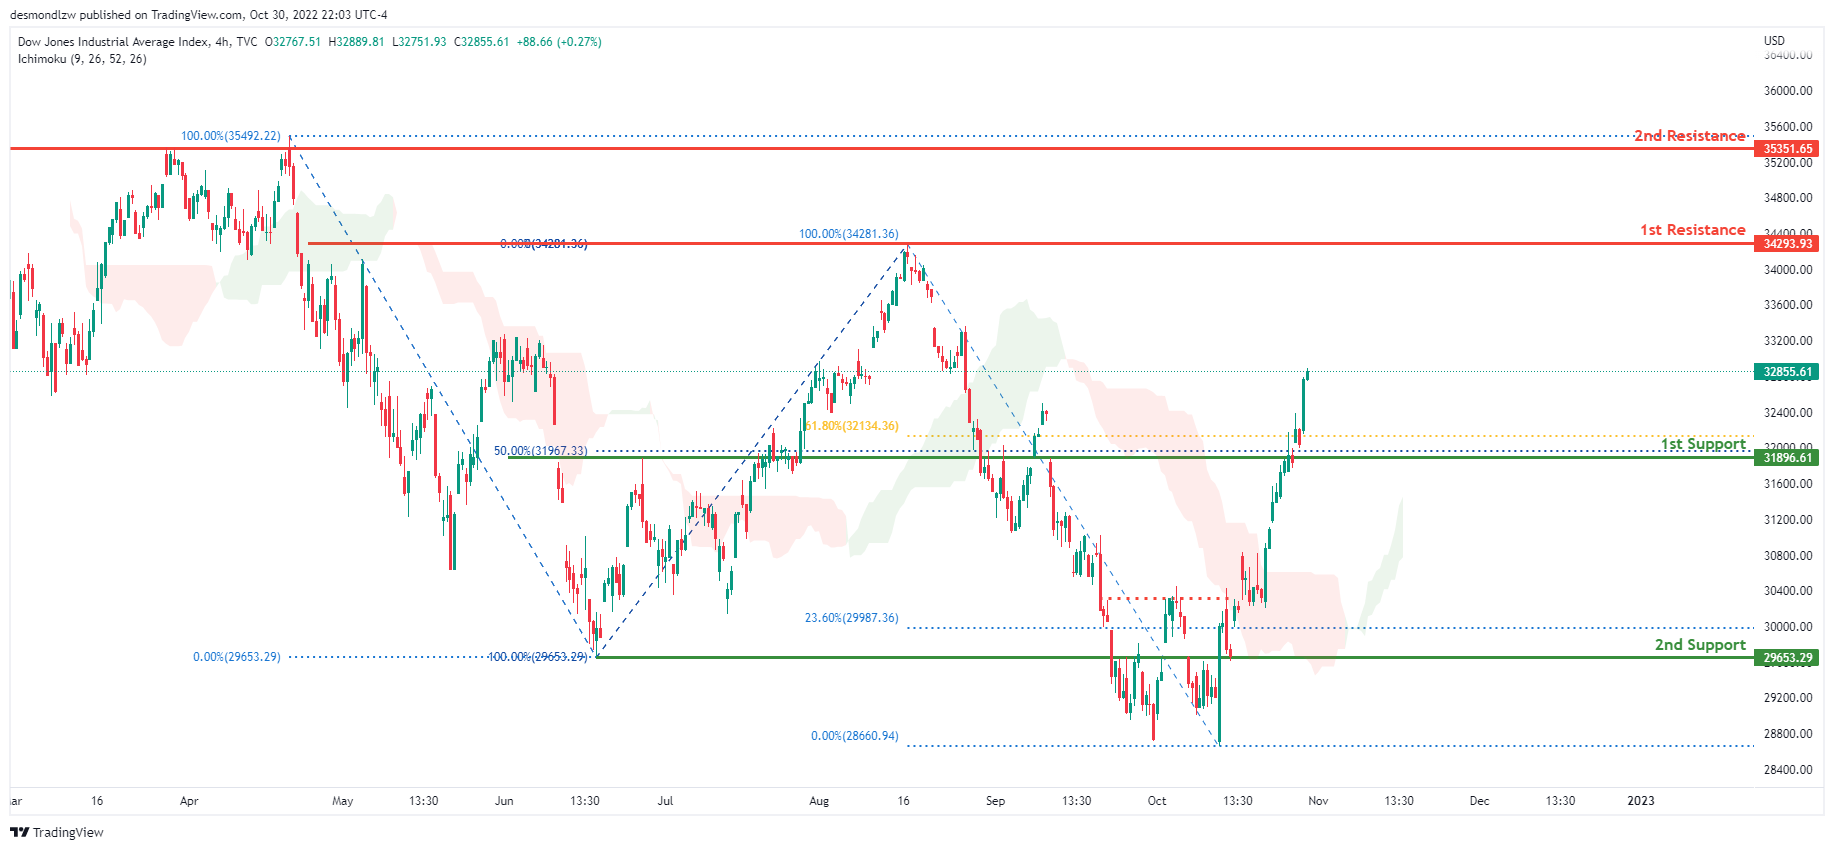
Dow Jones Industrial Average:
On the H4 chart, the overall bias for DJI is bullish. To add confluence to this, the price is above the Ichimoku cloud which indicates a bullish market. Towards the end of last week, price had massive bullish momentum upwards due to the weakening of the DXY. Price has closed above the 1st support at 31896.61, where the 61.8% and 50% Fibonacci lines are. If this bullish momentum continues, expect the price to possibly head towards the 1st resistance at 34293.93 where the previous swing high and 100% Fibonacci line is located.
Areas of consideration:
- H4 time frame, 1st support at 31896.61
- H4 time frame, 1st Resistance at 34293.93
DAX:
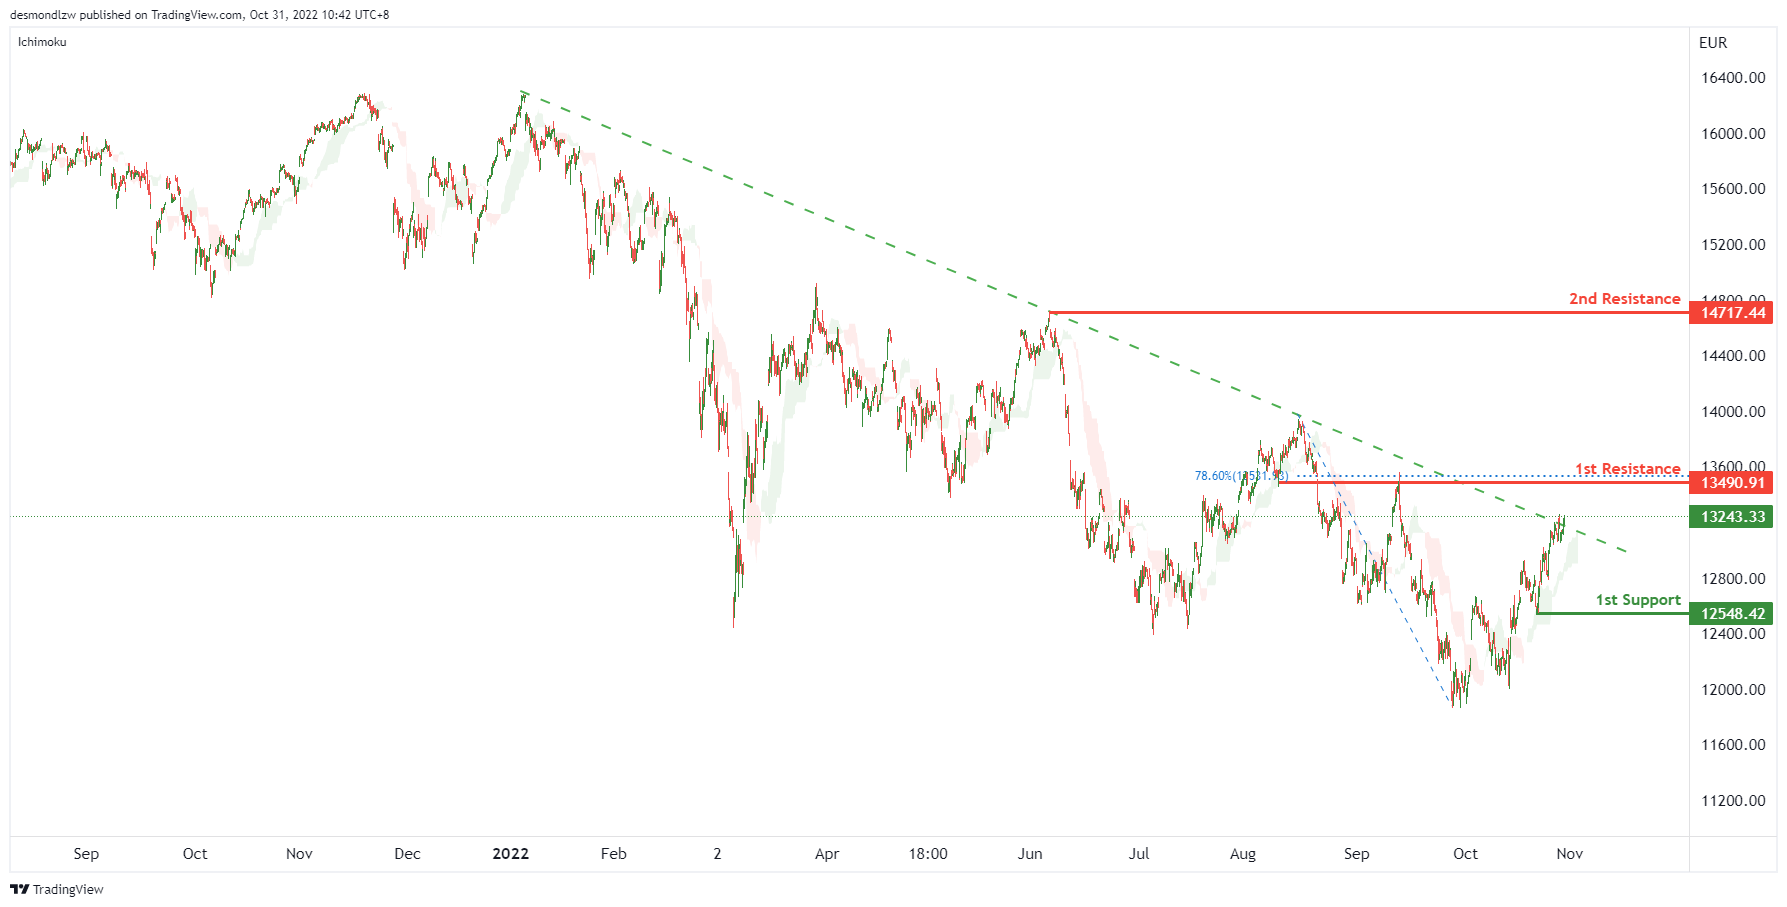
On the H4 chart, the price has now closed above the Ichimoku cloud which indicates a breakout of a descending trendline. Expecting price to possibly continue this bullish momentum and head towards the 1st resistance at 13490.91, where the 78.6% Fibonacci line is located. If the 1st resistance is broken, the 2nd resistance could be at 14717.44, which is in line with the previous swing high. Alternatively, the price may drop to the 1st support at 12548.42, which is in line with the swing low.
Areas of consideration:
- H4 time frame, current price
- H4 time frame, 1st resistance at 13490.91
ETHUSD:
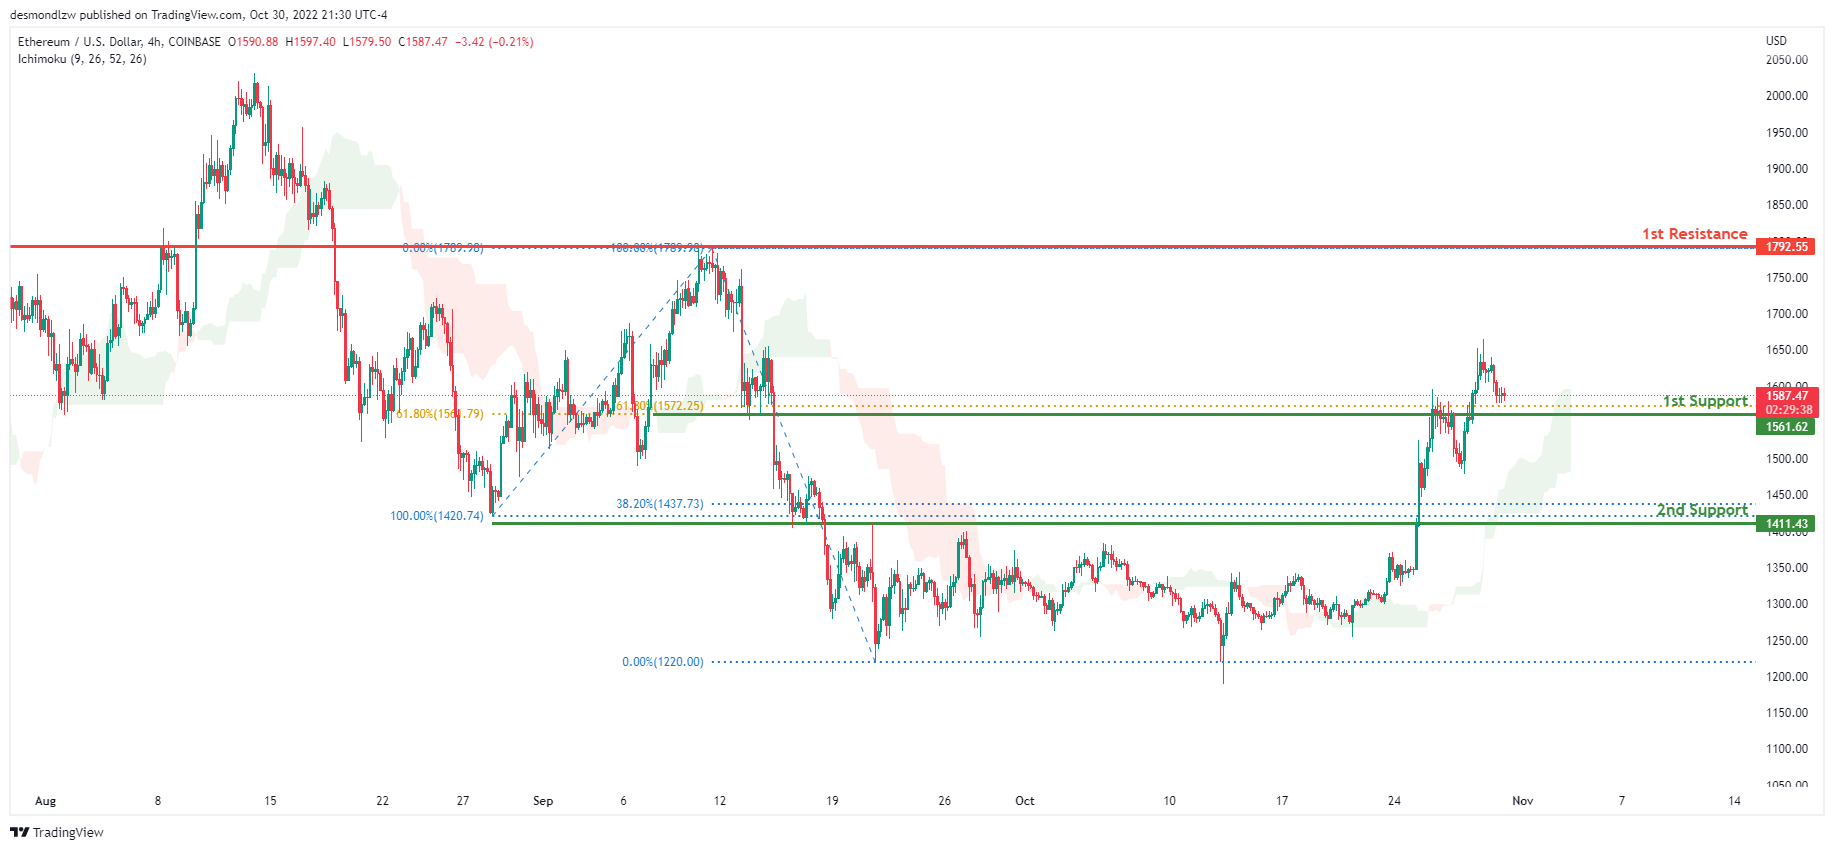
Looking at the H4 chart, the current overall bias for ETHUSD is bullish. To add confluence to this, the price is above the Ichimoku cloud which indicates a bullish market. Over the last week, price had bullish momentum upwards with the price currently trading above the 1st support level at 1561.62 where 2 of the 61.8% Fibonacci lines are located. If this bullish momentum continues, expect the price to head towards the 1st resistance at 1792.55 where the previous swing high and 100% Fibonacci line is located.
Areas of consideration:
- H4 time frame, 1st resistance of 1792.55
- H4 time frame, 1st support at 1561.62
BTCUSD:
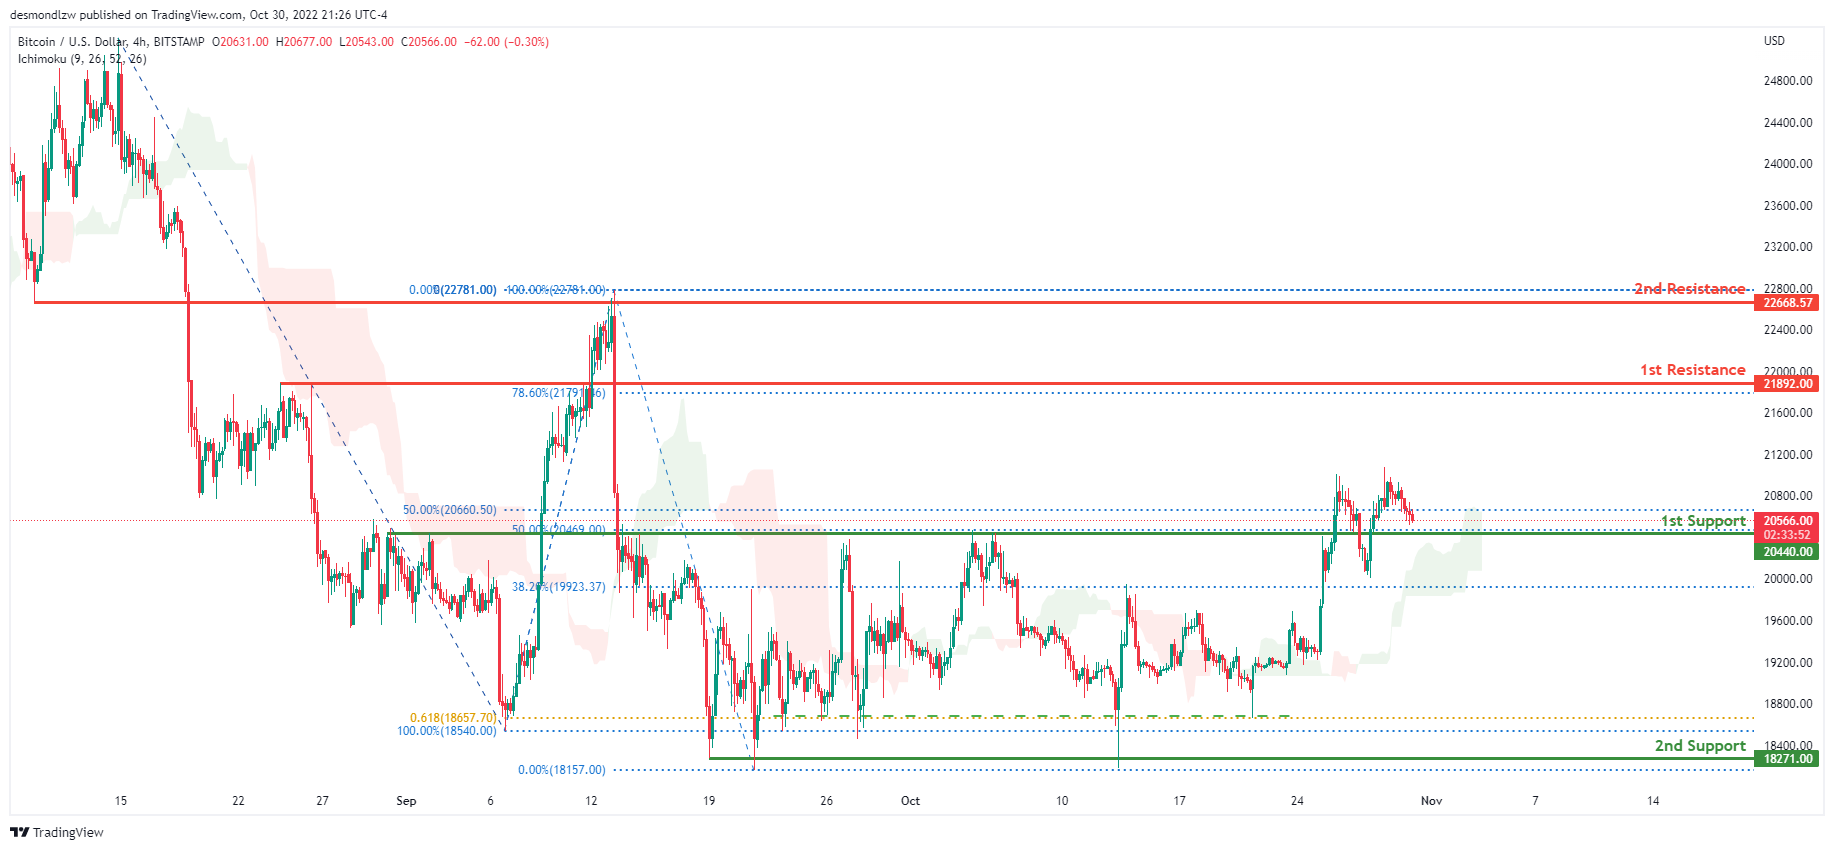
On the H4 chart, the overall bias for BTCUSD is bullish. To add confluence to this, the price is above the Ichimoku cloud which indicates a bullish market. Towards the 3nd of last week, price continued to consolidate along the 1st support at 20440.00 where the 2 of the 50% Fibonacci lines are located. If this bullish momentum continues, expect the price to head towards the 1st resistance at 21892.00, where the 78.6% Fibonacci line is located.
Areas of consideration:
- H4 time frame, 1st resistance 21892.00
- H4 time frame, 1st support at 20440.00
S&P 500:
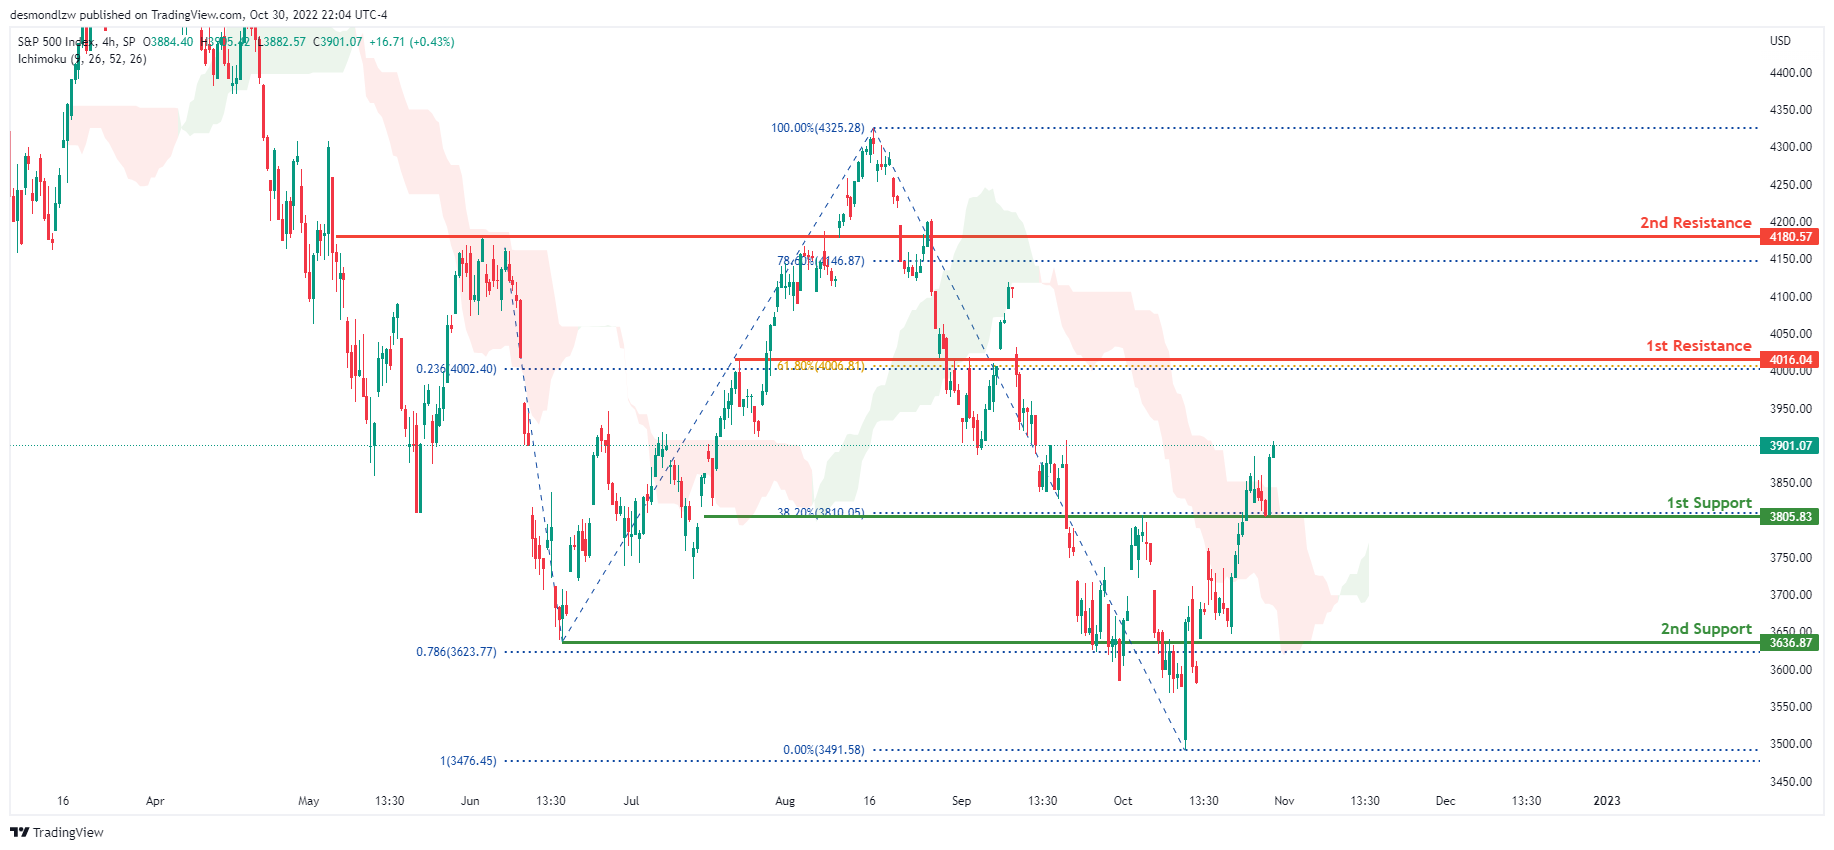
On the H4 chart, the overall bias for S&P500 is bearish. However due to the weakening of the DXY, S&P500 had bullish momentum during the course of last week. Towards the end of last week, price reflected off the 1st support at 3805.83 where the 38.2% Fibonacci line is located. If this bullish momentum continues, expect price to possibly head towards the 1st resistance at 4016.04 where the 61.8% Fibonacci line and 23.6% Fibonacci projection line is located.
Areas of consideration:
- H4 time frame, 1st support at 3805.83
- H4 time frame, 1st resistance at 4016.04