
Sample Category Title
EUR/AUD Daily Outlook
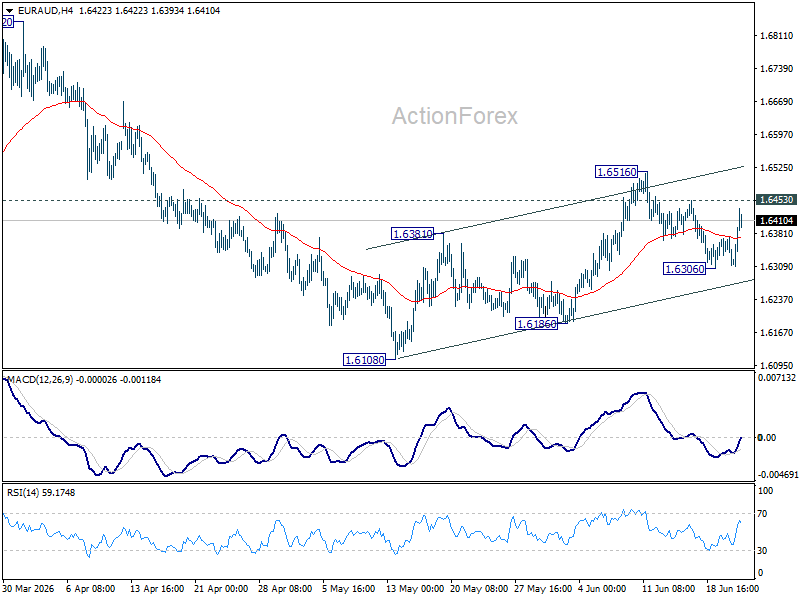
Intraday bias in EUR/AUD stays neutral first. On the upside, break of 1.6306 will argue that rise from 1.6108 is still in progress. Retest of 1.6516 will be seen first, and break will confirm this case. On the downside, below 1.6306 will turn bias back to the downside for 1.6186 support.
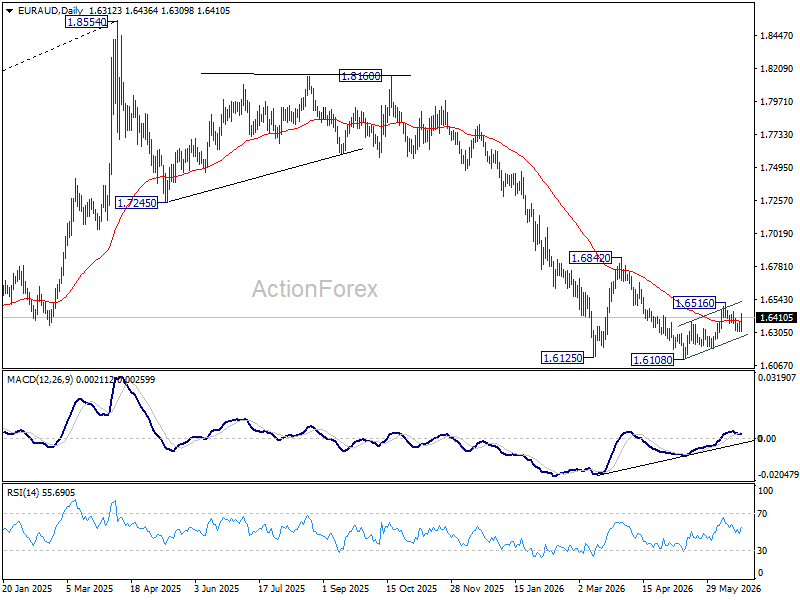
In the bigger picture, outlook will stay bearish as long as 1.6842 resistance holds. Fall from 1.8554 (2025 high) is expected to continue to 61.8% retracement of 1.4281 to 1.8554 at 1.5913. Decisive break there will pave the way back to 1.4281 (2022 low). However, firm break of 1.6842 should confirm medium term bottoming, and bring stronger rally.
EUR/CHF Daily Outlook
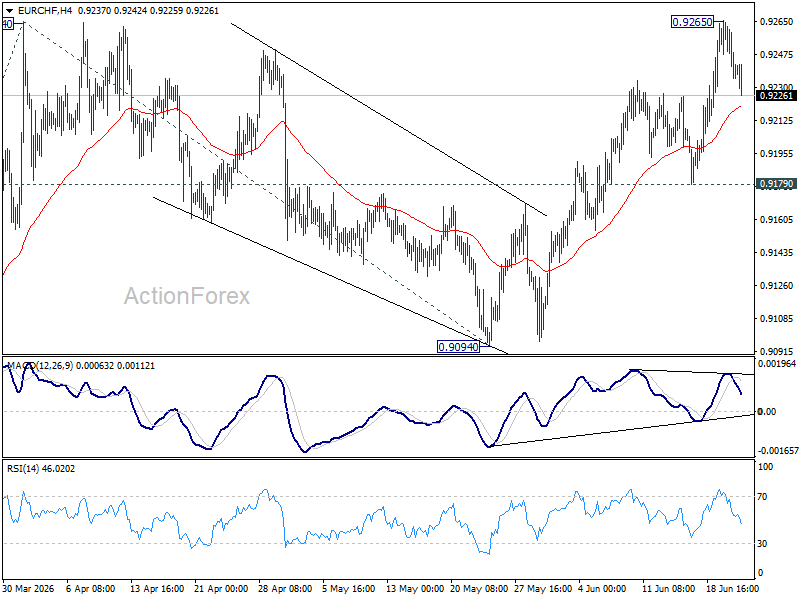
Intraday bias in EUR/CHF is turned neutral first with current retreat. Some consolidations would be seen below 0.9265 temporary top. But outlook will remain bullish as long as 0.9179 support holds On the upside, decisive break of 0.9264 resistance will resume the rally from 0.8979 to 100% projection of 0.8979 to 0.9264 from 0.9094 at 0.9379.
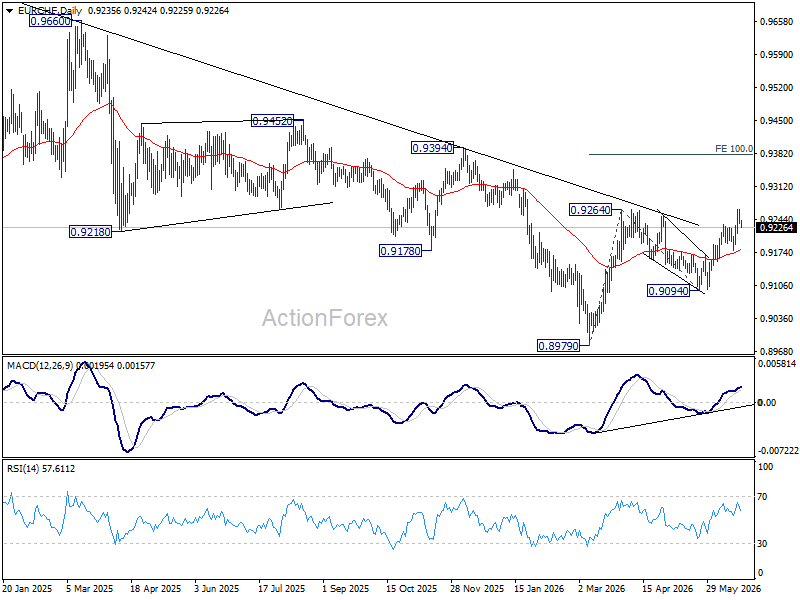
In the bigger picture, the break of medium term falling trend line resistance indicate that 0.8979 is already on medium term bottom. Considering bullish convergence condition in W MACD, rise from there should at least be reversing the fall from 0.9928, with prospect of developing into a medium term up trend. Firm break of 0.9394 resistance will add more credence to this case. For now rise will remain on the upside as long as 0.9094 support holds, in case of retreat.
Lane: ECB’s Response Is “Calibrated,” Not a “Huge, Gigantic” Tightening Push
ECB Chief Economist Philip Lane emphasized on Tuesday that the central bank's recent policy tightening should be viewed as a measured response to inflation risks rather than the start of an aggressive hiking cycle. Speaking before the European Parliament's ECON committee, Lane acknowledged that progress toward resolving the conflict in the Middle East was encouraging but warned that "uncertainty remains elevated" and that there are "continued risks for inflation to stay above our 2% medium-term target for quite some time."
Lane sought to strike a balance between vigilance and restraint. Defending the ECB's June rate hike, he said, "We're taking a measured approach," adding that "this is not a kind of huge, gigantic response. It's a calibrated response to what we see." His comments suggest policymakers remain concerned that higher energy costs could feed into broader inflation expectations, even as oil prices have retreated significantly from their recent peaks. At the same time, updated ECB scenarios indicate that current oil prices are now tracking between the bank's baseline and milder assumptions, reducing pressure for another immediate move.
While inflation may remain above target into the first half of 2027, Lane pushed back against concerns that the Eurozone economy is heading toward stagnation. He argued that strong labor markets, heavy investment in artificial intelligence, and increased public spending on defense and infrastructure should continue to support activity. "It's lower growth than we had hoped for but this is far above a stagnating economy," Lane said. "There is a fair amount of momentum in the economy." The remarks reinforce market expectations that the ECB is likely to remain on a tightening path, though with little urgency to follow June's rate hike with another increase as soon as July.
Will PCE Inflation Data Fuel Bets of Early Fed Rate Hike?
- Warsh's hawkish debut sparks sharp repricing in Fed funds futures.
- Inflation is front and centre as September hike now seen likely.
- Will PCE report due Thursday, 12:30 GMT, support the hawkish bets?
Markets brace for first Fed hike in 3 years
New Fed chief Kevin Warsh didn't waste any time in stamping his authority when he chaired his first ever FOMC meeting on June 16 and 17. Not only did he ditch the much-loved-by-the-markets forward guidance, he also set up task forces to oversee a host of other reforms such as evaluating the size of the balance sheet and the inflation framework.
But those are problems for another day. In the immediate term, investors are still reeling from the Fed's far bigger hawkish shift than anyone anticipated. Although FOMC members were split almost 50/50 whether rates should move higher or stay where they are (but only because Warsh refused to add his own projections), the median dot plot for 2026 has changed from a 25-bps cut to a 25-bps increase.
Inflation is creeping higher
The significant de-escalation in the Middle East has done little to ease inflation worries. Even though hopes of a permanent resolution of the conflict are high after the US and Iran agreed to a 60-day negotiating period and there appears to be a gradual normalization of energy flows through the Strait of Hormuz, the impact of three months of elevated oil prices is still being filtered through prices.
The Fed upped its projection of core PCE in 2026 from 2.7% to 3.3% and doesn't see it falling to its 2% target by 2028 at the earliest. The last time either CPI or PCE inflation readings were at or below 2% was in early 2021. That's not a good record for any central bank that has an explicit price objective.
Hence, the Fed would have probably felt the need to recommit to its inflation mandate whoever was at the helm to bolster its credibility. Bond markets certainly liked Warsh's no-nonsense appearance at the FOMC press conference, as the 30-year Treasury yield finished the week 7 bps lower on greater confidence in the Fed's ability to fight inflation.
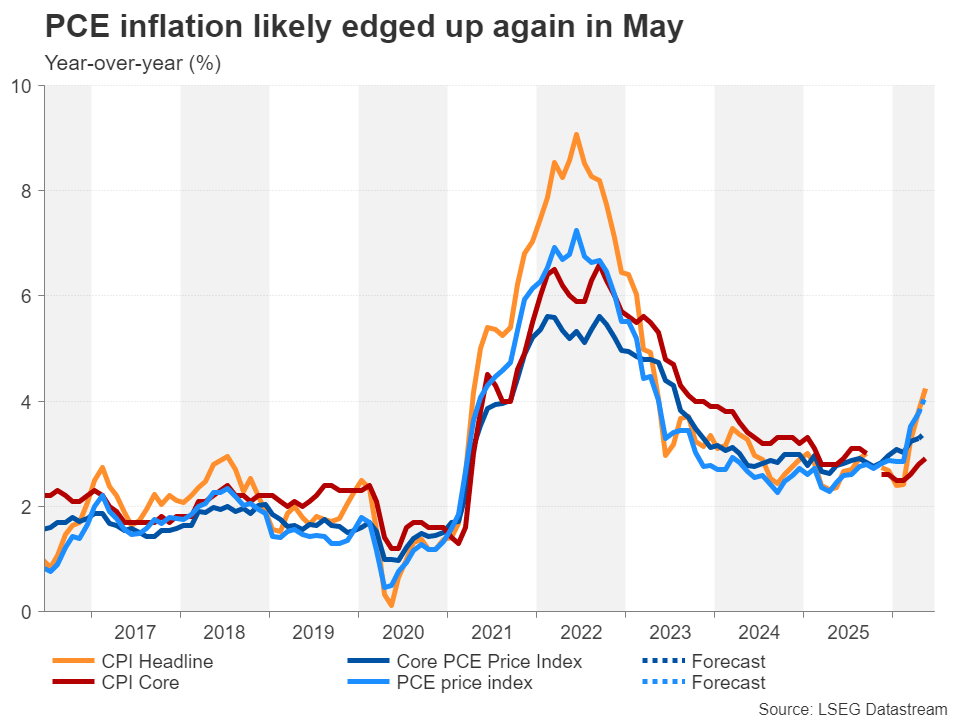
All eyes on core PCE
Thursday's PCE price indices for May are set to add more pressure on the Fed to tame inflation as quickly as possible. The core PCE price index – the Fed's preferred inflation metric – is expected to have ticked up slightly in May from 3.3% to 3.4% y/y, while headline PCE is forecast to have jumped from 3.8% to 4.1% y/y amid the surge in gasoline prices.
However, the squeeze on disposable incomes from higher energy costs isn't projected to have hugely hurt households, as personal consumption is expected to have risen by 0.6% m/m, with personal income also forecast to have grown a decent 0.4% m/m.
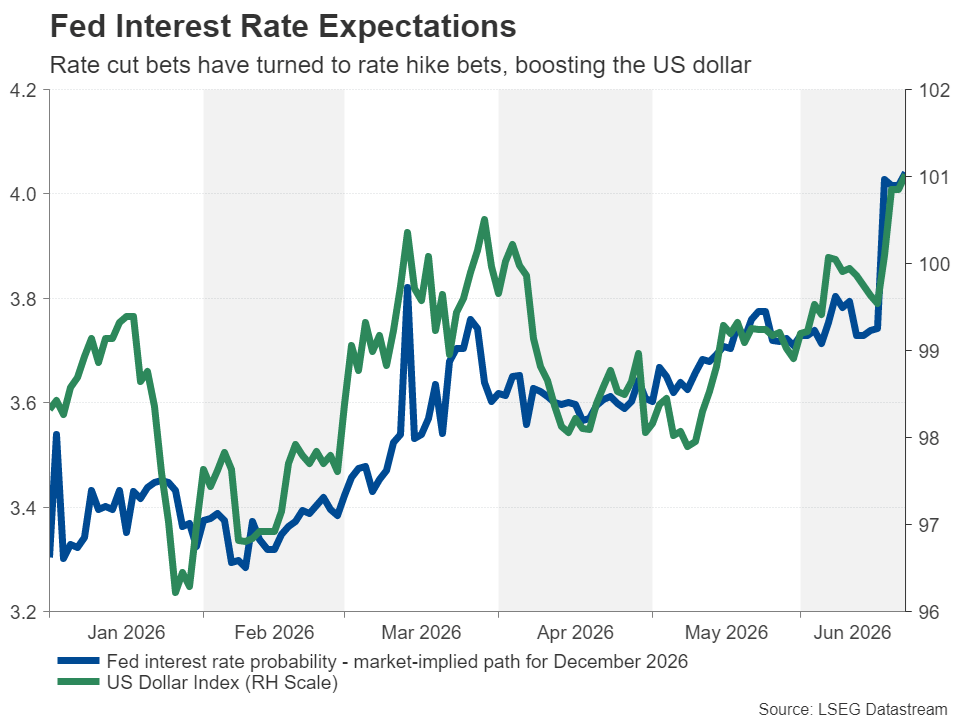
Dollar at multi-week highs
The Fed's hawkish pivot combined with still solid economic indicators have lifted the US dollar to near four-week highs against a basket of currencies, even as geopolitical risks have subsided.
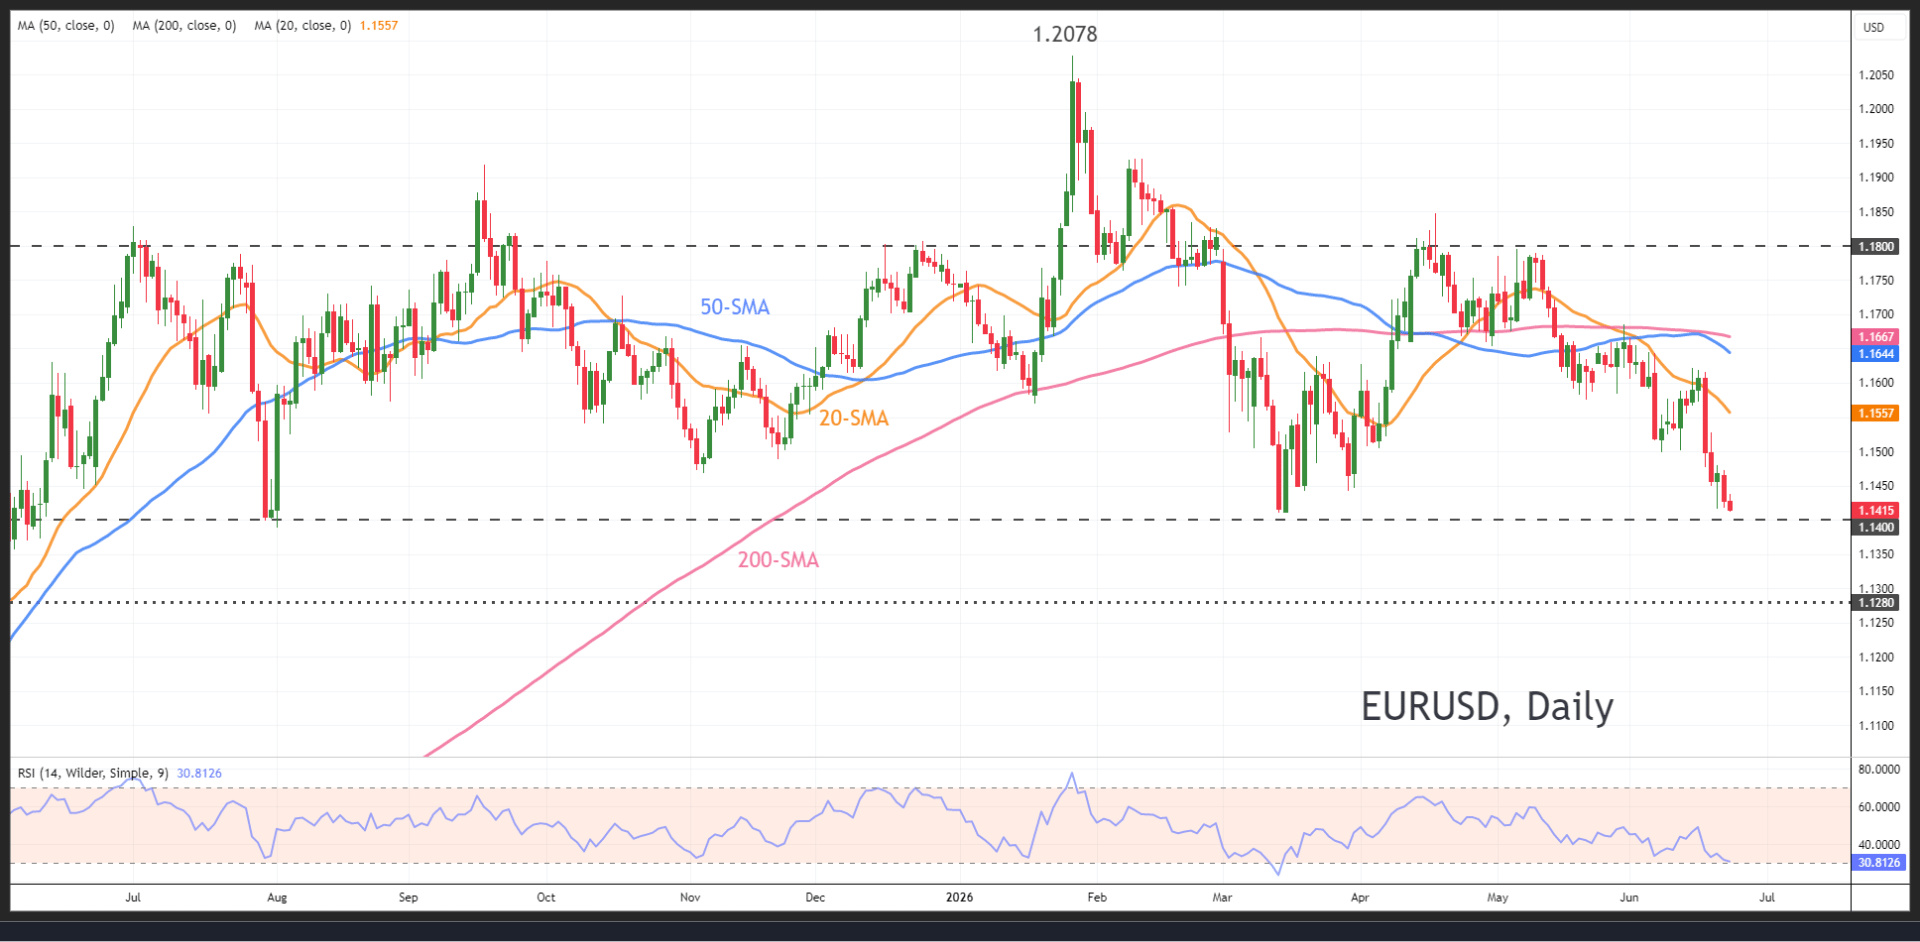
The euro is currently flirting with the $1.1400 level, with a breach looking imminent if the PCE data is strong. After that, the $1.1280 area could be the euro bears' next target.
But if core PCE rises by less than expected, the euro could rebound towards its 20-day moving average (MA) at $1.1557, with a stronger rebound potentially extending towards the 200-day MA at $1.1667.
Has Warsh really shown his true colours yet?
It's worth pointing out that sticky inflation and a resilient economy would have likely taken a rate cut off the table even without the US-Iran war. But there's also a possibility traders are getting a bit ahead of themselves with all the rate hike speculation.
Not only has Warsh kept his cards close to his chest by not revealing his own views on the economy and rate path, a further speedy reversal in oil prices could encourage the Fed to be patient on inflation. This raises the possibility of the Fed not living up to the hawkish expectations, limiting any tightening to just 25-50 basis points and keeping the dollar's revival short-lived.
EUR/USD Remains Under Sellers’ Control as the Dollar Stays Strong
The EUR/USD pair traded near 1.1430 on Tuesday. The US dollar is refreshing its highs from March 2026, supported by expectations of further monetary policy tightening by the Federal Reserve, as well as cautious optimism surrounding negotiations between the US and Iran.
An additional factor for the markets was Washington’s decision to grant Tehran a temporary 60-day licence to export oil to global markets. This move strengthened expectations of a gradual recovery in global crude supply and was seen as a sign of progress in talks between the two sides.
The Federal Reserve remains the key focus for investors. After the hawkish signals delivered at the June meeting, markets continue to price in the probability of a rate hike as early as September. Major banks, including Deutsche Bank and Bank of America, have also revised their forecasts in favour of additional monetary policy tightening.
This week’s key event will be the release of the PCE index, the Federal Reserve’s preferred inflation gauge. The report may provide fresh signals about the persistence of price pressure in the US economy and influence expectations for the future path of interest rates.
EUR/USD Technical Analysis
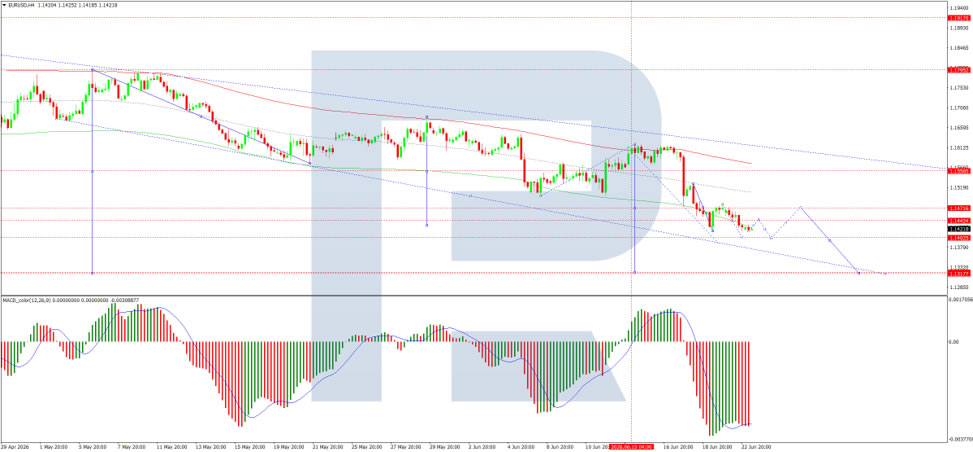
On the H4 chart of EUR/USD, the market has formed a consolidation range around 1.1444 today. At the moment, the range has expanded downwards to 1.1418 and upwards to 1.1440. If the pair breaks out of this range to the upside, a corrective wave towards 1.1470 may develop. After that, a decline towards 1.1385 is expected.
If the pair breaks directly to the downside, the potential will open for a downward wave towards 1.1315.
Technically, this scenario is confirmed by the MACD indicator: its signal line is below the zero level and is pointing firmly downwards, reflecting a persistent bearish impulse with potential for the downtrend to continue.
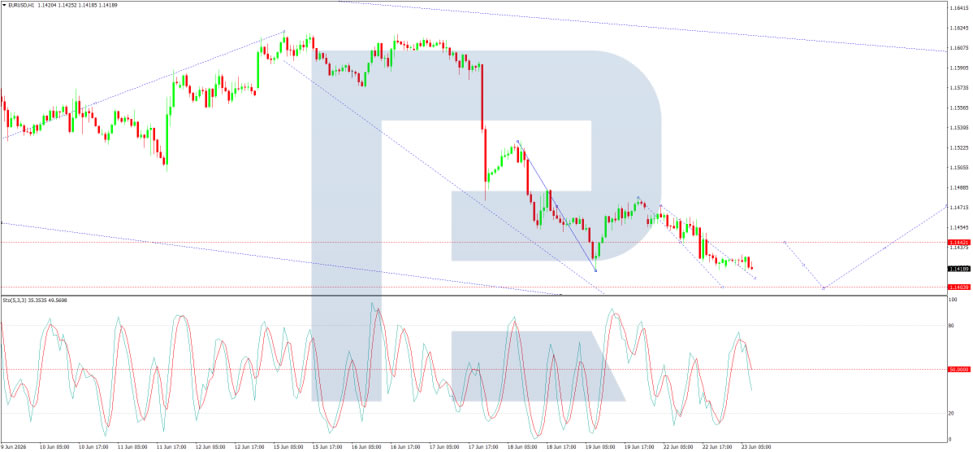
On the H1 chart, the market has completed the structure of another growth wave towards 1.1449. At the moment, a consolidation range is forming below this level. Today, the range may expand downwards to 1.1409 and upwards to 1.1444. After that, a decline towards 1.1385 is expected.
The Stochastic oscillator supports this scenario: its signal line is below 50 and is pointing firmly downwards towards 20.
Gold’s $4,000 Floor Faces Fresh Threat as Tech Rout Fuels Dollar Surge
Gold is once again approaching the level that has defined its battle with sellers for months. After falling back below 4,100, the precious metal is now drifting toward the 4,000 region, a major psychological level that has repeatedly halted deeper declines. This time, however, the pressure is coming from a source that Gold bulls may find particularly uncomfortable. The market is not reacting to war, oil, or inflation. It is reacting to a rapidly strengthening Dollar and growing fears that a technology-led selloff is spreading across global markets.
The scale of the equity damage was difficult to ignore. South Korea's KOSPI crashed -9.99% today, triggering a market-wide trading halt after panic selling accelerated during the afternoon session. Japan's Nikkei 225 lost more than -2,400 points, while semiconductor stocks plunged over -9%. By the time Europe opened, Nasdaq futures were already down around -2.5%, extending concerns that the AI-driven technology rally that dominated much of the past year may finally be facing a more serious correction.
For now, nobody knows whether this is simply quarter-end positioning or the beginning of a much larger deleveraging event. Investors often take profits and reduce risk exposure before half-year reporting periods. But there are also signs that markets are becoming increasingly nervous about valuation risks, tighter monetary policy, and the possibility that higher interest rates will eventually catch up with growth expectations. If technology investors begin reducing leverage more aggressively, the consequences could spread well beyond equities.
Adding to the pressure is the Federal Reserve. Markets are increasingly focused on whether last week's FOMC meeting marked the beginning of a shift from higher-for-longer toward higher-again. The possibility of one additional rate hike is now widely accepted. The debate is increasingly centered on whether the Fed might ultimately deliver two. With Fed officials continuing to highlight persistent services inflation, traders are reluctant to stand in front of a strengthening Dollar, especially with next week's payrolls report still ahead.
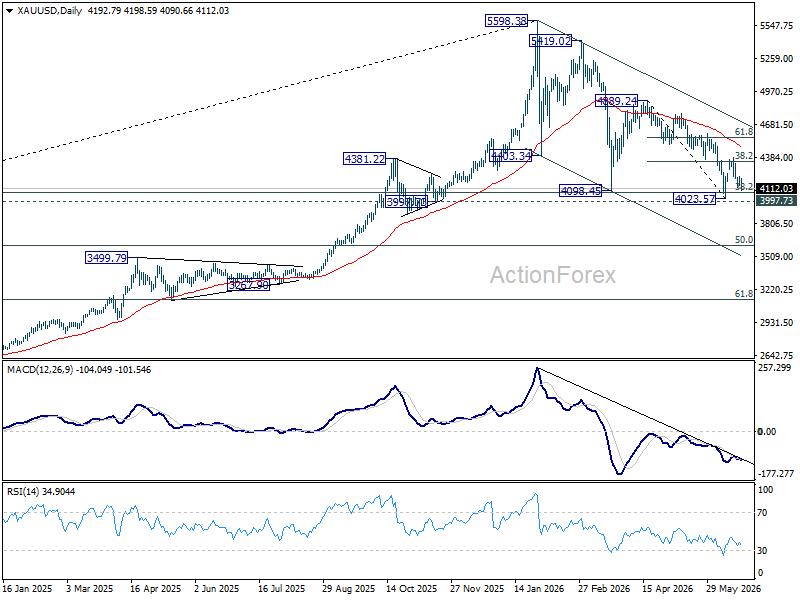
Technically, Gold is running out of room. The rebound from 4,023.57 appears corrective within the broader decline from 4,889.24. While a break above 4,220.45 could extend the consolidation phase, upside should remain capped near 4,382.84 resistance (38.2% retracement of 4,889.24 to 4,023.57 at 4,354.25). That leaves the market trapped between fading recovery attempts and growing downside risks.
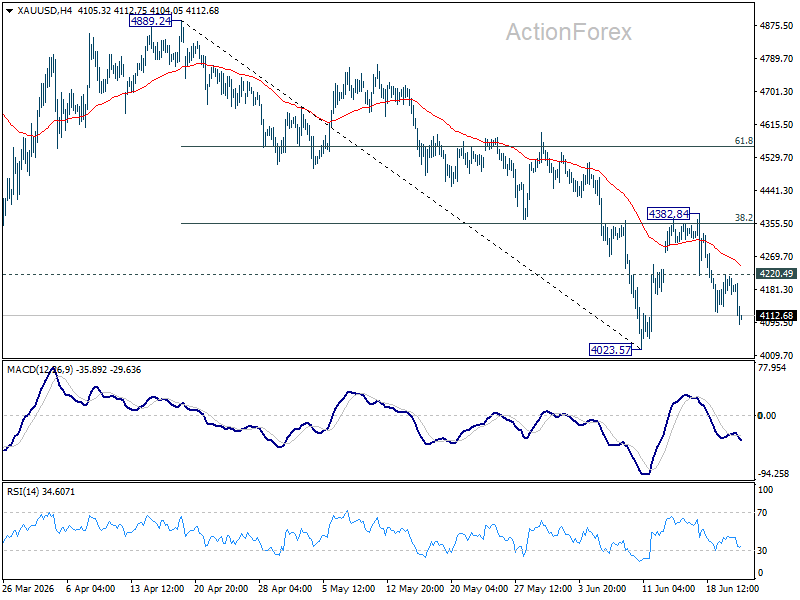
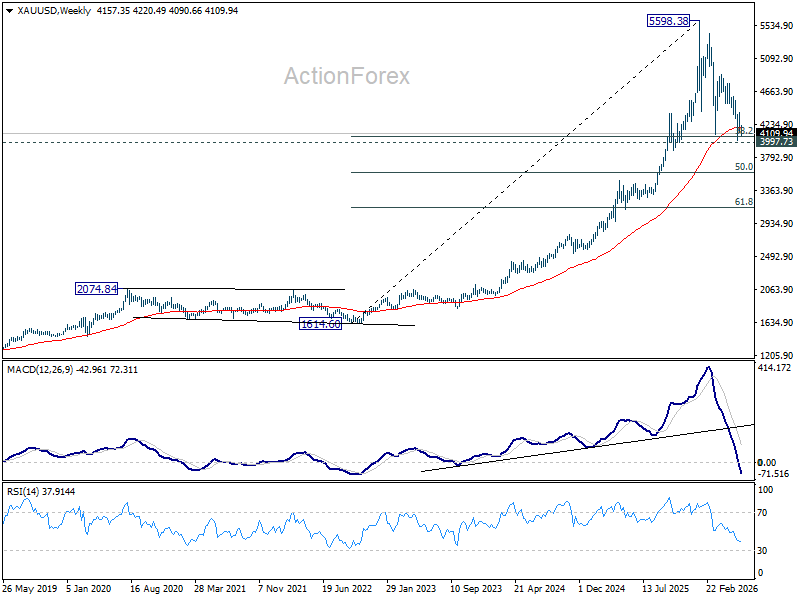
The real test lies just below current levels. A break of 4,023.57 would likely drag Gold through the 4,000 support cluster. Such a move would signal that the down trend from the record high at 5,598.38 is evolving into a much deeper bear phase. The next major target would then come into view at 50% retracement of 1,614.60 to 5,598.38 at 3,606.49. For Gold bulls, the question is whether this time the $4,000 floor finally gives way.
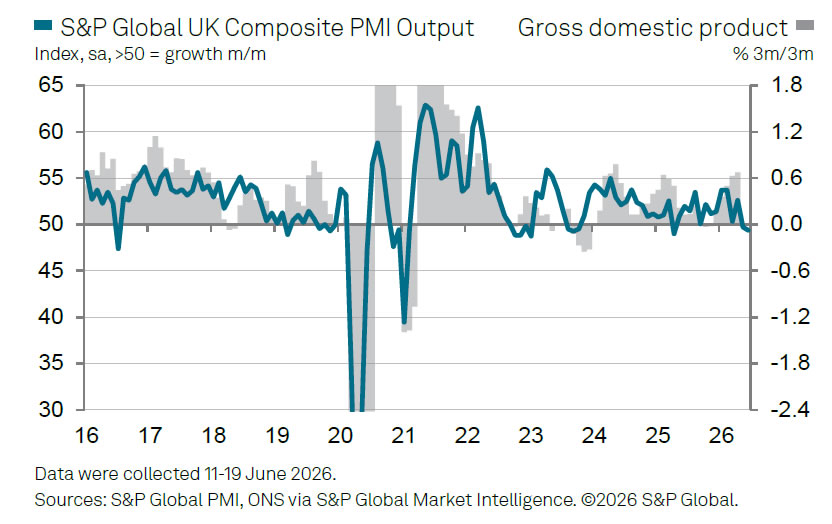
UK PMI Signals Second Month of Contraction as Services Slump Deepens
The UK economy showed little sign of regaining momentum in June, with the Flash Composite PMI Output Index falling from 49.7 to 49.4, its lowest level in 14 months. The survey signaled a second consecutive month of contraction, driven primarily by weakness in the services sector. The Services PMI Business Activity Index declined from 49.3 to 48.7, its lowest reading in 41 months, while manufacturing provided a partial offset, with the Manufacturing Output Index rising from 52.2 to 53.6, the strongest level in nearly two years.
According to S&P Global's Chris Williamson, the data point to an economy that effectively flat-lined through the second quarter. Consumer-facing services remained under pressure, while manufacturers continued to benefit from inventory building as firms sought protection against supply disruptions linked to the Middle East conflict. However, Williamson cautioned that this manufacturing strength may prove temporary, as demand is being supported by precautionary stockpiling rather than sustained improvements in underlying activity.
The survey also highlighted the difficult balance facing policymakers. Companies reported continued cost pressures from higher energy prices and supply-chain disruptions related to the conflict, alongside existing domestic policy costs. At the same time, employment continued to decline at what Williamson described as a "worryingly high rate," reflecting weak growth expectations and subdued demand. While lower energy prices have begun to ease some war-related inflation pressures, the broader outlook remains clouded by political uncertainty at home and geopolitical risks abroad. For now, the combination of stagnant growth, elevated costs, and weakening labor demand points to an economy struggling to regain traction.
| Indicator | May | June | Change |
|---|---|---|---|
| Composite PMI Output Index | 49.7 | 49.4 | ↓ 0.3 |
| Services PMI Business Activity Index | 49.3 | 48.7 | ↓ 0.6 |
| Manufacturing PMI | 53.9 | 53.1 | ↓ 0.8 |
| Manufacturing Output Index | 52.2 | 53.6 | ↑ 1.4 |
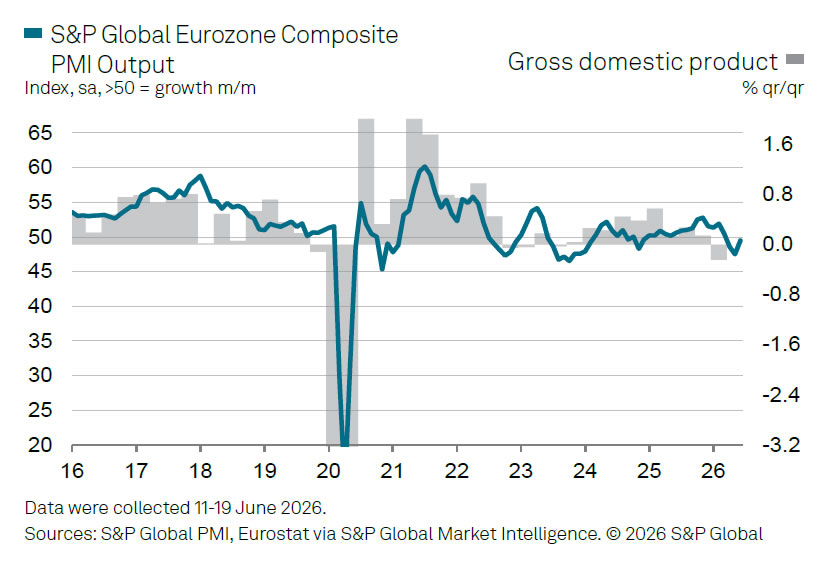
Eurozone PMI: Economy Stays Out of Recession as Services Recover
The Eurozone economy showed further signs of stabilization in June, with the Flash Composite PMI Output Index rising from 48.5 to 49.5, its highest level in three months. While the reading remained just below the 50 threshold that separates expansion from contraction, it pointed to a significant easing in the downturn. Services activity improved notably, with the Services PMI Business Activity Index climbing from 47.7 to 48.9, also a three-month high, helping offset a modest slowdown in manufacturing where the PMI slipped from 51.6 to 51.3 and output edged down from 51.3 to 51.2.
According to S&P Global's Chris Williamson, the latest survey suggests the Eurozone is "showing enough resilience to just about stay out of recession." The data are broadly consistent with flat GDP growth in the second quarter. Encouragingly, service-sector demand improved as tourism and leisure-related industries began recovering from disruptions caused by the Middle East conflict. Manufacturing activity, meanwhile, continued to benefit from inventory building as firms sought to secure supplies and guard against potential price increases linked to the war.
There were also tentative signs that inflation pressures may be easing. Williamson noted that lower energy prices are already feeding through to businesses, helping reduce both input cost and selling price inflation. While supply-chain delays continued to push costs higher and support precautionary inventory accumulation, concerns about future shortages appeared less acute than in previous months. Together, the findings suggest the Eurozone economy remains fragile but may be emerging from the worst effects of the recent energy and supply shock, with lower oil prices offering an increasingly important source of support.
| Indicator | May | June | Change |
|---|---|---|---|
| Composite PMI Output Index | 48.5 | 49.5 | ↑ 1.0 |
| Services PMI Business Activity Index | 47.7 | 48.9 | ↑ 1.2 |
| Manufacturing PMI | 51.6 | 51.3 | ↓ 0.3 |
| Manufacturing Output Index | 51.3 | 51.2 | ↓ 0.1 |
Brent: How Long Will It Take to Reach $70?
• Geopolitics has stripped the US dollar’s rivals of their key advantages.
• Oil prices may return to pre-conflict levels sooner than expected.
The US dollar is extending its lead in the forex market, driven by confidence in the Fed’s monetary tightening. Bank of America believes the Fed will raise rates three times in 2026 due to a strong economy and a more aggressive approach to tackling inflation under Kevin Warsh. At the same time, the fall in oil prices removes the main argument for monetary tightening by rival central banks, led by the ECB.
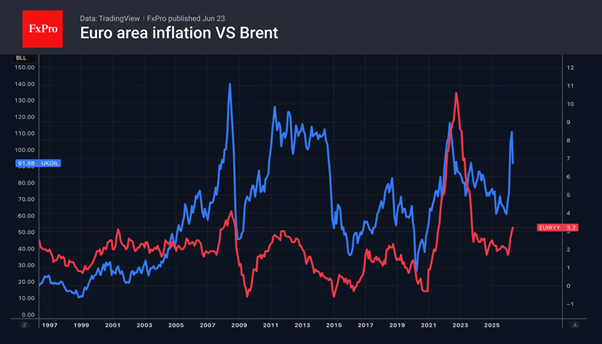
During the conflict in the Middle East, the prevailing view in the market was that Brent would not return to pre-war levels until almost the end of the year. However, as soon as the Strait of Hormuz was reopened, oil flows surged and Brent crude plummeted below $78 per barrel. According to US Central Command, traffic over the weekend alone amounted to 17 million barrels per day. Bloomberg cites a figure of 20 million barrels per day over the last three days, indicating a full restoration of flows.
Goldman Sachs believes that, over time, shipments through the Strait of Hormuz will fall to 70 per cent of the levels seen at the end of February, as countries utilise alternative routes developed during the US-Iran standoff. Coupled with a decline in demand from China, this could put long-term pressure on Brent.
There is a growing consensus in the market that China’s oil imports will not return to previous levels. In February, they stood at 12.6 million bpd, but in the second quarter, they fell by 3.3 million bpd compared with the same period in 2025. The shift away from diesel and petrol towards alternative energy sources is reducing demand, which is contributing to the fall in Brent prices.
In the short term, the peak in North Sea crude prices is the result of the US granting Iran a 60-day licence to sell its oil for dollars. This throws a lifeline to a faltering economy and offers hope for progress in negotiations on the nuclear programme. Increased production and exports from the Islamic Republic are a ‘bearish’ factor for Brent.
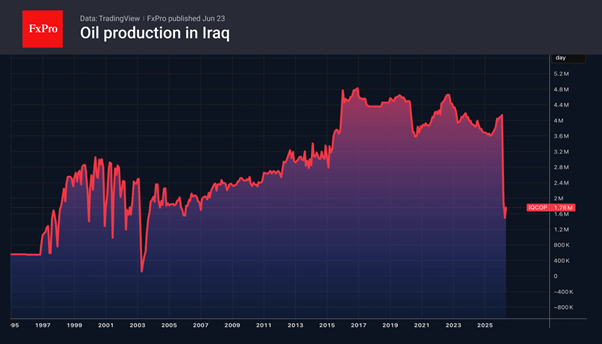
However, the market is concerned about how quickly Gulf states will restore production. Following the agreement between Washington and Tehran, Iraq’s call for companies to rapidly increase output to more than 3 million barrels per day is acting as another catalyst for selling in the oil market.
Pound at Key Levels: Markets Assess Impact of Political Uncertainty in the UK
The British pound remains under pressure following increased political uncertainty in the United Kingdom triggered by the Prime Minister’s resignation. Investors are assessing potential shifts in the political and economic policy outlook after the head of government stepped down, including implications for fiscal spending, taxation policy, and economic support measures. The uncertainty surrounding the future direction of domestic politics is weighing on demand for sterling and prompting a more cautious stance among market participants.
Today’s focus will be preliminary UK PMI data. Forecasts suggest the services PMI may rise to 50.0 from 49.3, while the composite PMI is expected to increase to 50.6 from 49.7. The manufacturing PMI is projected at 53.5, slightly down from 53.9. If the data confirms signs of economic stabilisation, the pound could see short-term support after recent declines and partially offset pressure from political uncertainty.
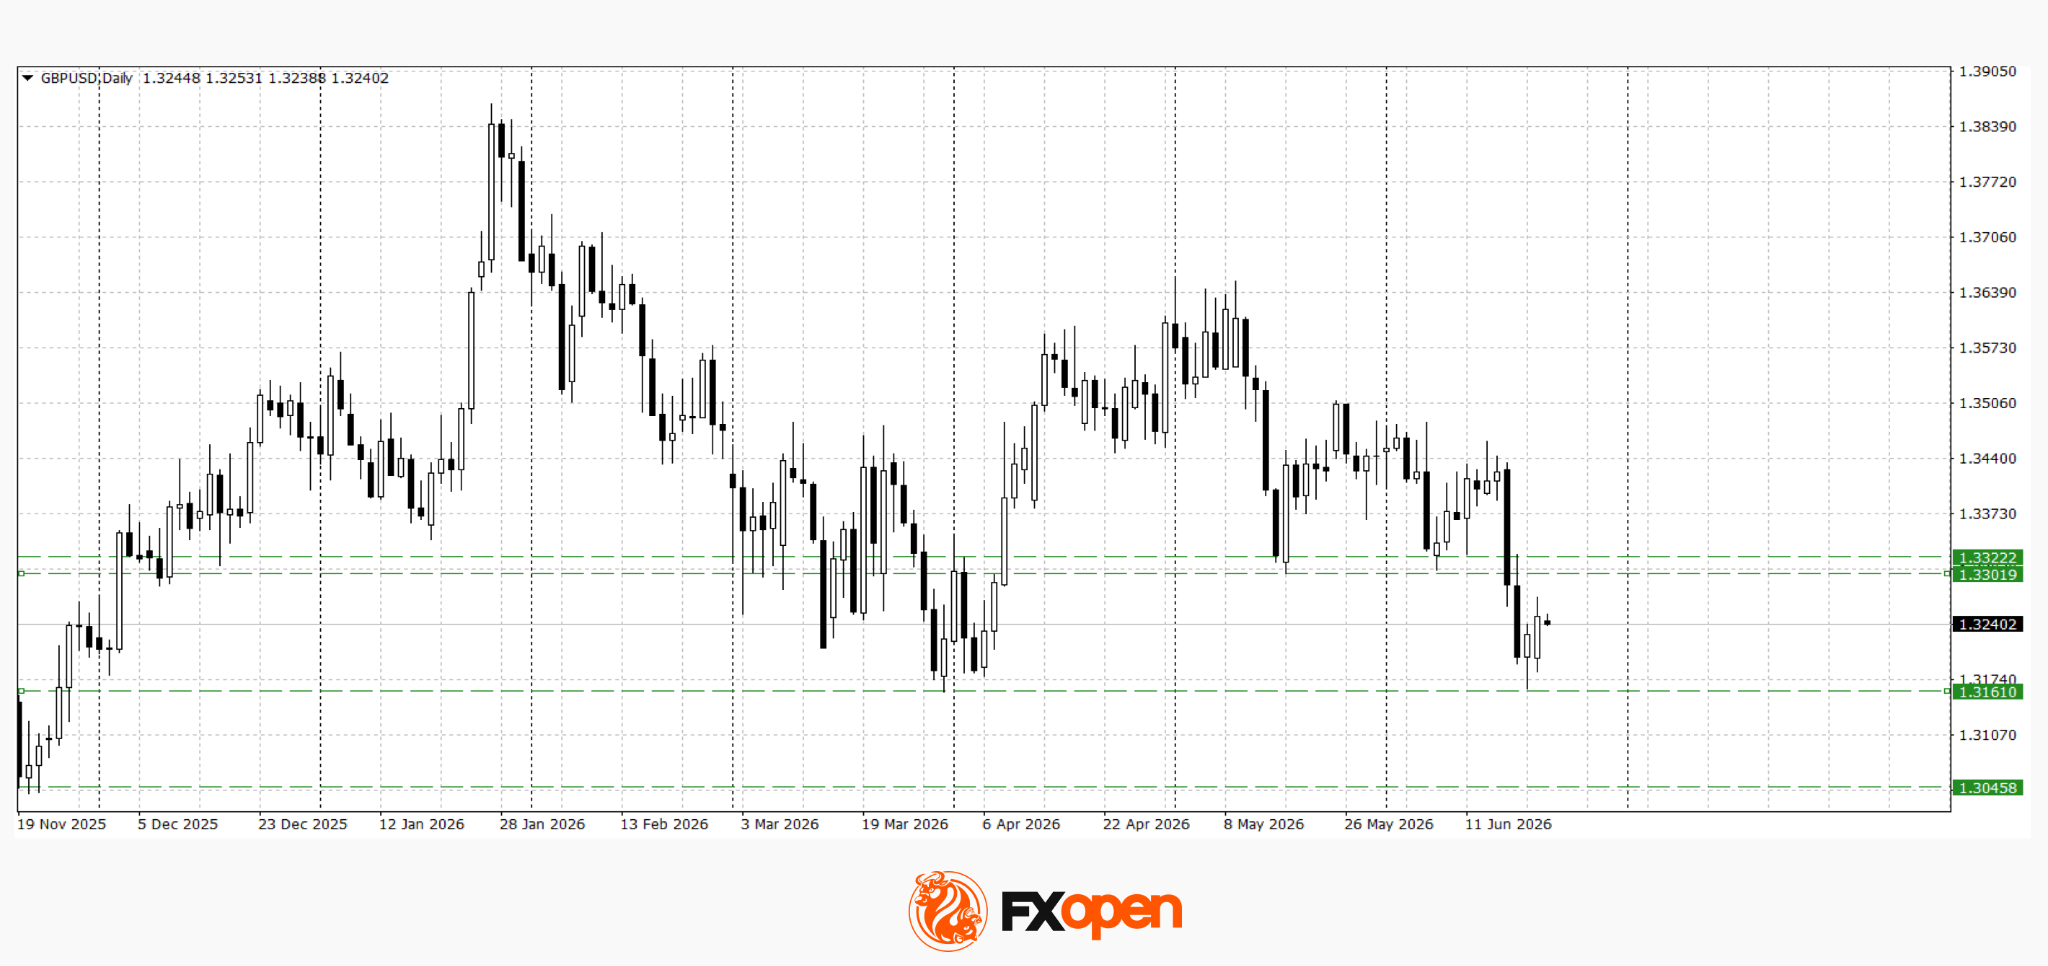
GBP/USD
Last week, following meetings of the Federal Reserve and the Bank of England, GBP/USD broke key support at 1.3300. The pair also tested this year’s low at 1.3160. It is currently consolidating in the 1.3200–1.3240 range. Technical analysis suggests a potential rebound towards the recent support level at 1.3300. A move back above this level would be the first signal of easing downside pressure. However, weak UK macroeconomic data could trigger another test of 1.3160.
Key events for GBP/USD:
- Today at 11:30 (GMT+3): UK services PMI
- Today at 11:30 (GMT+3): UK composite PMI
- Today at 11:55 (GMT+3): speech by Sarah Breeden, Bank of England Financial Policy Committee member
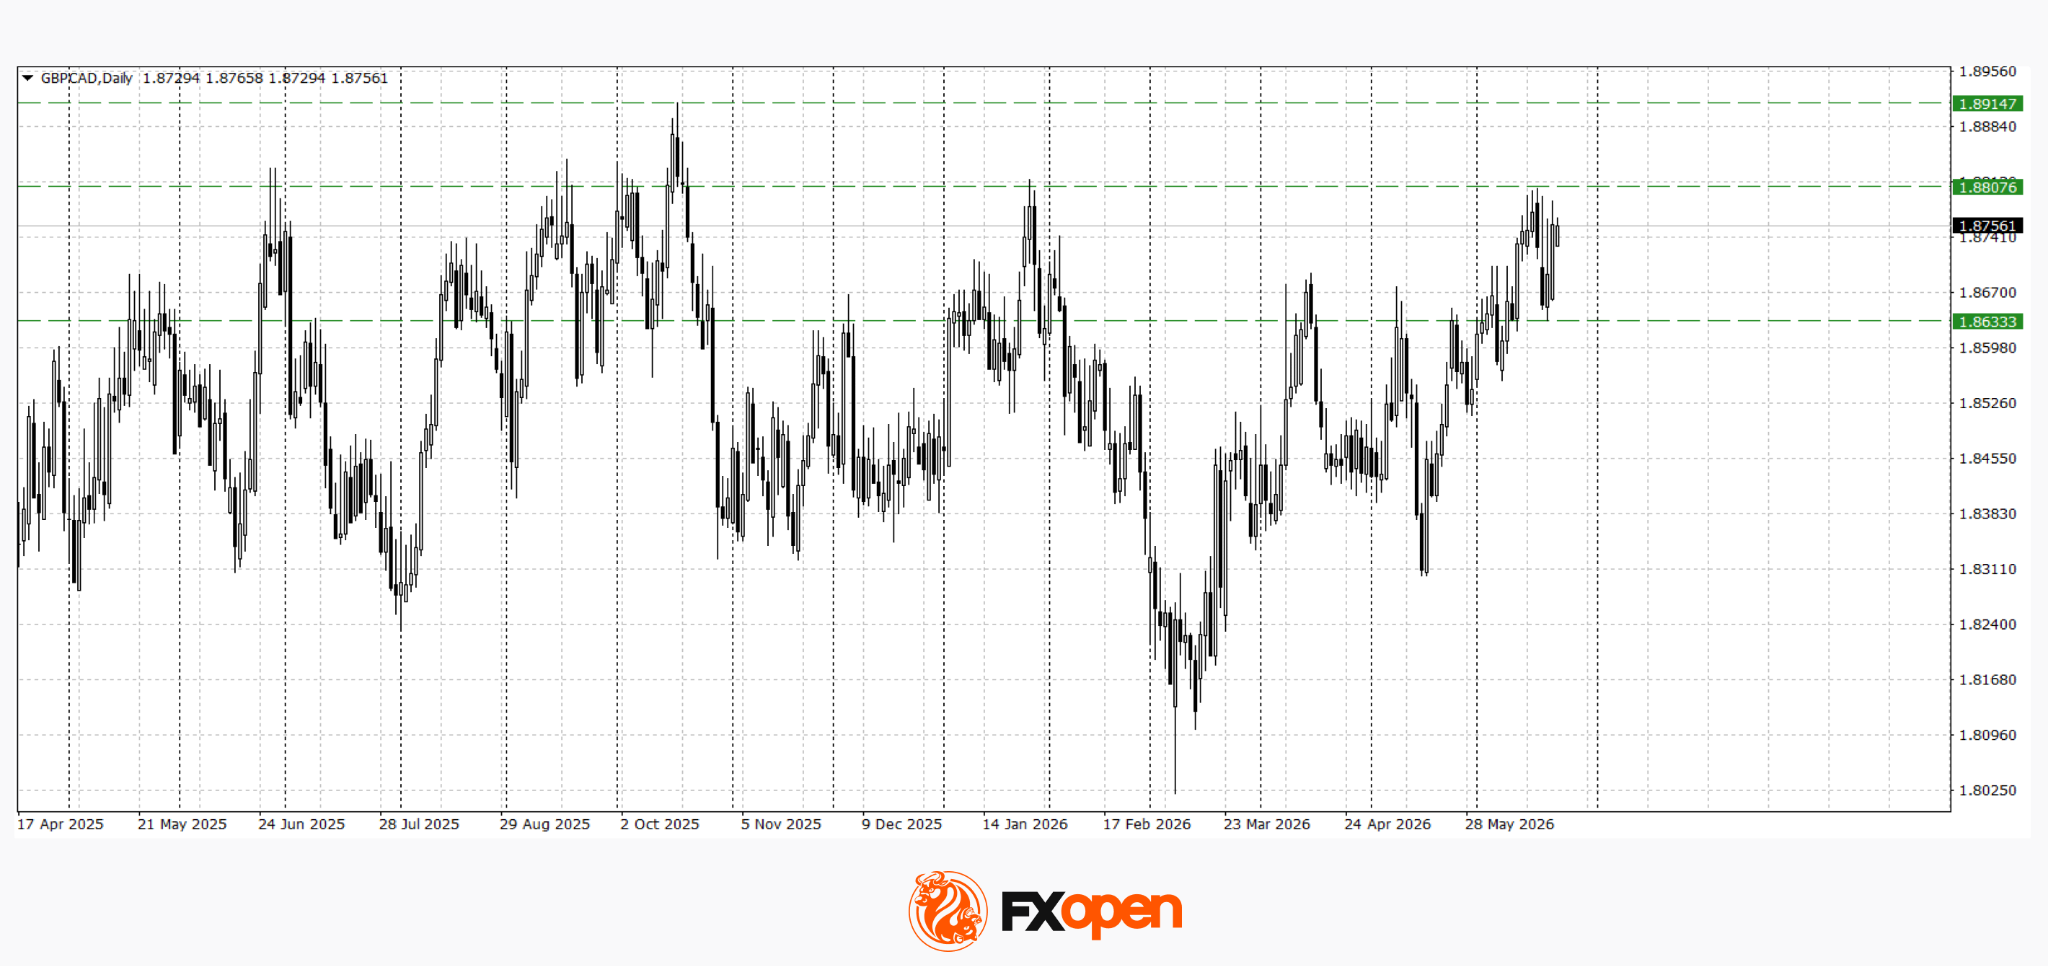
GBP/CAD
Despite pressure on sterling following the Prime Minister’s resignation, weakness in the Canadian dollar has allowed GBP/CAD to hold up better than other sterling crosses. The pair retreated from this year’s high at 1.8800 but quickly found support at 1.8630. A retest of recent highs is possible. A firm break above 1.8800 could extend gains towards 1.8900–1.8920.
Key events for GBP/CAD:
- Today at 16:00 (GMT+3): speech by Bank of Canada Governor Macklem
- Today at 20:30 (GMT+3): speech by Bank of England MPC member Swati Dhingra
- Tomorrow at 14:15 (GMT+3): speech by Bank of Canada Deputy Governor Rogers
Overall, both pairs remain influenced by multiple factors: domestic political uncertainty in the UK, the impact of recent Bank of England and Federal Reserve decisions, and expectations ahead of key macroeconomic data releases. Today’s PMI figures will help determine whether the current consolidation resolves into a sterling recovery or continued downside pressure.
Trade over 50 forex markets 24 hours a day with FXOpen. Take advantage of low commissions, deep liquidity, and spreads from 0.0 pips (additional fees may apply). Open your FXOpen account now or learn more about trading forex with FXOpen.
This article represents the opinion of the Companies operating under the FXOpen brand only. It is not to be construed as an offer, solicitation, or recommendation with respect to products and services provided by the Companies operating under the FXOpen brand, nor is it to be considered financial advice.