Sample Category Title
Tech Rout Dominates as Yen Surge Raises Risk of Dangerous Feedback Loop
Global markets were gripped by a technology-led selloff today, with investors abruptly shifting their attention away from the fading Middle East energy shock and toward mounting concerns over stretched valuations, leverage, and financial conditions. The sharp decline in Asian equities spilled into Europe and U.S. futures, driving classic risk-off positioning across currencies. Yen led gains, followed by Dollar and Swiss Franc, while Aussie, Kiwi and Euro underperformed.
The immediate catalyst appeared to come from South Korea, where the KOSPI plunged -9.99%, its steepest drop in more than three months. The selloff was severe enough to trigger a mandatory 20-minute market-wide trading halt. Unlike many sudden market declines, this move was not driven by a vague deterioration in sentiment. Instead, it followed comments from Financial Supervisory Service Governor Lee Chan-jin, who expressed deep regret over approving a large batch of highly leveraged single-stock ETFs linked to Samsung Electronics and SK Hynix. The remarks triggered a rapid unwinding of an estimated USD 9.1B retail-heavy leveraged trade, amplifying selling pressure throughout the broader market.
Japan, however, appeared to be experiencing something more than simple contagion from Korea. The Nikkei 225 fell -3.55%, while the Nikkei Semiconductor Stock Index plunged more than -9%. The scale of the losses suggested a broader liquidation of technology and AI-related positions rather than merely a reaction to events in Seoul. Weakness then spread beyond Asia, with NASDAQ futures trading more than -2.5% lower in European hours, raising concerns that investors are beginning to reassess the lofty valuations built during the AI-driven rally.
Not everyone sees the selloff as a fundamental threat to the long-term AI story. Many economists and market strategists continue to argue that artificial intelligence will drive earnings growth for years to come and justify massive capital expenditure programs. From that perspective, today's weakness could ultimately prove to be a buying opportunity rather than the beginning of a bear market. However, even the strongest secular trends are vulnerable to cyclical corrections, particularly after periods of aggressive positioning and elevated valuations.
A more immediate concern for markets is the relationship between the Yen and Japanese equities. The Nikkei reached a record high of 72,353.96 just yesterday, helped significantly by USD/JPY's rise to a multi-decade high near 161.7. A weak Yen has been a major pillar supporting Japanese exporters by boosting overseas earnings when translated back into local currency. That relationship now risks working in reverse.
If risk aversion continues to drive investors into the Yen, a stronger Japanese currency would undermine earnings expectations for exporters and place additional pressure on the Nikkei. Further declines in equities could then reinforce global risk aversion, generating additional safe-haven demand for Yen and creating a self-reinforcing cycle. Such feedback loops have played a significant role during previous global deleveraging episodes. With the Yen still close to multi-decade lows against Dollar, the potential magnitude of any reversal could be amplified.
Meanwhile, not all developments were negative. On the geopolitical front, the United States took another major step toward normalizing relations with Iran by issuing a broad 60-day exemption allowing Iranian crude oil, petroleum products and petrochemicals to be traded in U.S. dollars through August 21. The move represents the most significant rollback of U.S. oil sanctions since the 1979 Islamic Revolution and follows positive progress in Swiss negotiations aimed at securing a permanent peace agreement. Together with last week's memorandum of understanding, the measures continue to remove the energy shock premium that dominated markets earlier this year. Ironically, just as one major source of market anxiety fades, investors appear to have discovered another.
Gold's $4,000 Floor Faces Fresh Threat as Tech Rout Fuels Dollar Surge
Gold is behaving less like a safe haven and more like a casualty of a broader market selloff. As technology stocks plunge across Asia and traders raise bets on further Fed tightening, investors are rushing into the Dollar instead. The result is renewed pressure on Gold's most important support zone of 2026: 4,000. Read More.
UK PMI Signals Second Month of Contraction as Services Slump Deepens
The UK economy contracted for a second straight month in June, but the real story lies beneath the surface. Services activity fell to its weakest level in 41 months, while manufacturing surged to a near two-year high as firms built precautionary inventories amid ongoing supply concerns. The question is whether that factory strength can last. Read More.
Eurozone PMI: Economy Stays Out of Recession as Services Recover
The Eurozone may not be growing, but it is no longer slipping toward recession. June PMI data showed services activity recovering, tourism demand improving, and inflation pressures easing as lower energy prices filtered through the economy. The question now is whether that stabilization can turn into genuine growth. Read More.
Katayama-Bessent Talks Trigger Mild USD/JPY Pullback, But Intervention Fears Stay Contained
USD/JPY finally encountered a reason to pause as Finance Minister Satsuki Katayama revealed talks with U.S. Treasury Secretary Scott Bessent. Her reference to a "firm mutual understanding" on taking action if necessary sounded like a subtle reminder that intervention remains an option. Yet the market's muted reaction suggests traders still view Fed repricing as a far more powerful force than Tokyo's warnings. Read More.
Japan PMI Growth Accelerates as Manufacturing Boom Extends
Japan's economy appears to have weathered the Middle East shock better than expected. Manufacturing output is growing at one of its strongest rates in over a decade, services activity is recovering, and overall business activity accelerated in June. Yet behind the strong headline numbers, rising costs and war-related stockpiling raise questions about how sustainable the momentum really is. Read More.
Australia Composite PMI Climbs Toward Growth, But Demand Remains Weak
Australia's PMI report delivered both good news and bad news. Business activity came close to stabilizing, inflation pressures eased, and services firms resumed hiring. Yet new orders continued to fall and confidence dropped to among the weakest levels on record, leaving the economy at a crucial turning point ahead of this week's inflation and jobs data. Read More.
Fed's Goolsbee: Key Question Is Whether Inflation Stays at 3%-4%
Austan Goolsbee distilled the Fed's inflation dilemma into one question: will inflation stuck at 3%-4% eventually fall back to target, or is it becoming entrenched? While tariff and energy-related price pressures may prove temporary, the Chicago Fed President singled out services inflation as the more troubling and persistent threat. Read More.
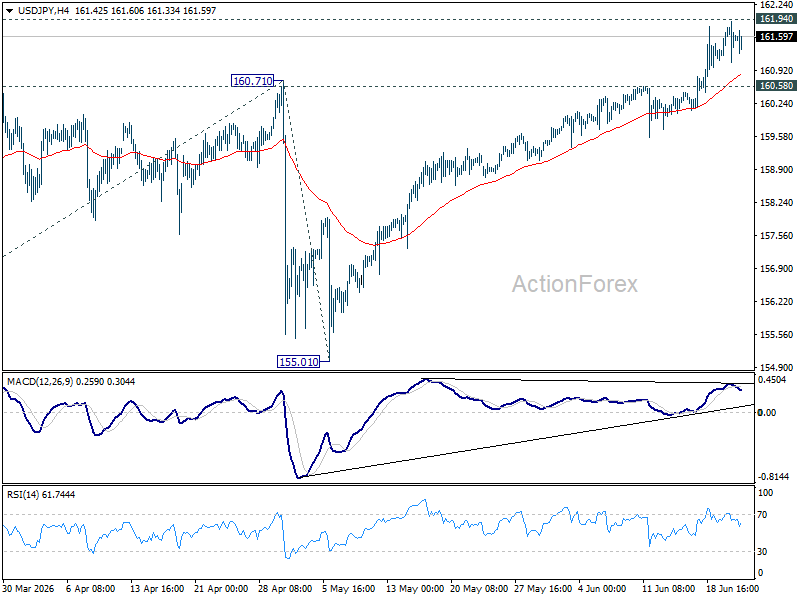
USD/JPY Daily Outlook
Intraday bias in USD/JPY stays mildly on the upside at this point. Decisive break of 161.94 high will resume the larger up trend to 100% projection of 152.25 to 160.71 from 155.01 at 163.47 next. On the downside, break of 160.58 minor support will turn bias back to the downside, and bring deeper pullback to 55 D EMA (now at 159.30).
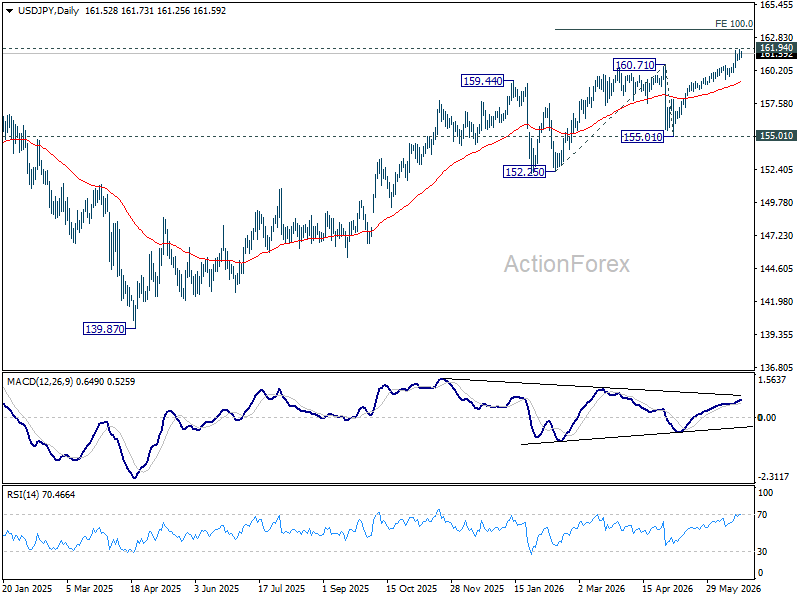
In the bigger picture, for now, corrective pattern from 161.94 (2024 high) is still seen as completed at 139.87. Rise from there is seen as resuming the long term up trend. This will remain the favored case as long as 55 W EMA (now at 155.17) holds.
EUR/USD Daily Outlook
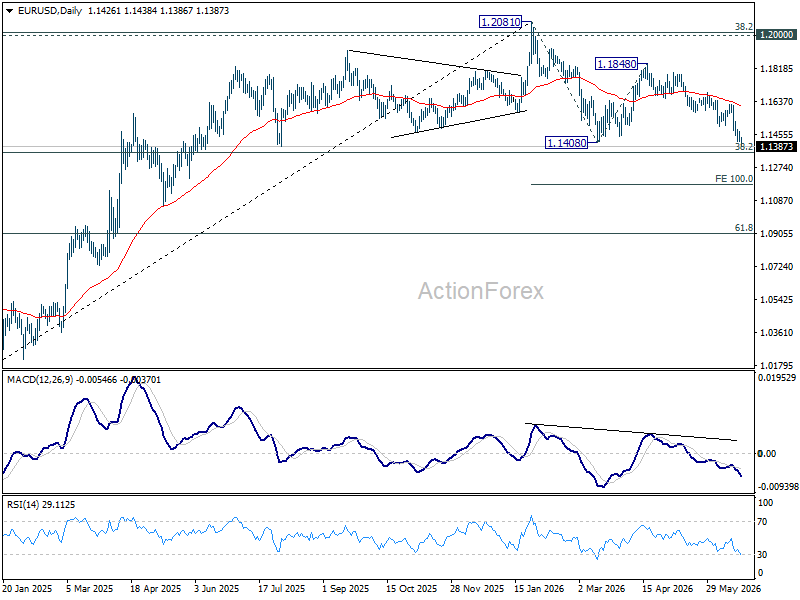
EUR/USD's fall form 1.2081 is resuming by breaking 1.1408 support. Intraday bias is back on the downside. Further decline should be seen to 100% projection of 1.2081 to 1.1408 from 1.1848 at 1.1175. On the upside, above 1.1479 minor resistance will turn intraday bias neutral again first. But risk will remain on the downside as long as 1.1621 resistance holds, in case of recovery.
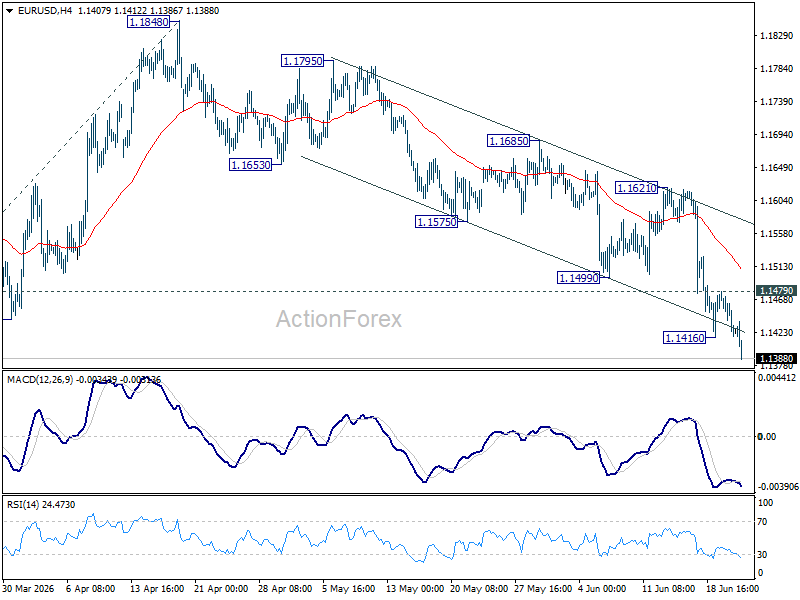
In the bigger picture, focus is back on 38.2% retracement of 1.0176 to 1.2081 at 1.1353. Decisive break there will revive the case of medium term bearish trend reversal after rejection by 1.2 key cluster resistance level. Further fall should be seen to 61.8% retracement at 1.0904. Nevertheless, strong rebound from 1.1353, followed by break of 1.1621 resistance, will retain medium term bullishness.
USD/JPY Daily Outlook
Intraday bias in USD/JPY stays mildly on the upside at this point. Decisive break of 161.94 high will resume the larger up trend to 100% projection of 152.25 to 160.71 from 155.01 at 163.47 next. On the downside, break of 160.58 minor support will turn bias back to the downside, and bring deeper pullback to 55 D EMA (now at 159.30).
In the bigger picture, for now, corrective pattern from 161.94 (2024 high) is still seen as completed at 139.87. Rise from there is seen as resuming the long term up trend. This will remain the favored case as long as 55 W EMA (now at 155.17) holds.
GBP/USD Daily Outlook
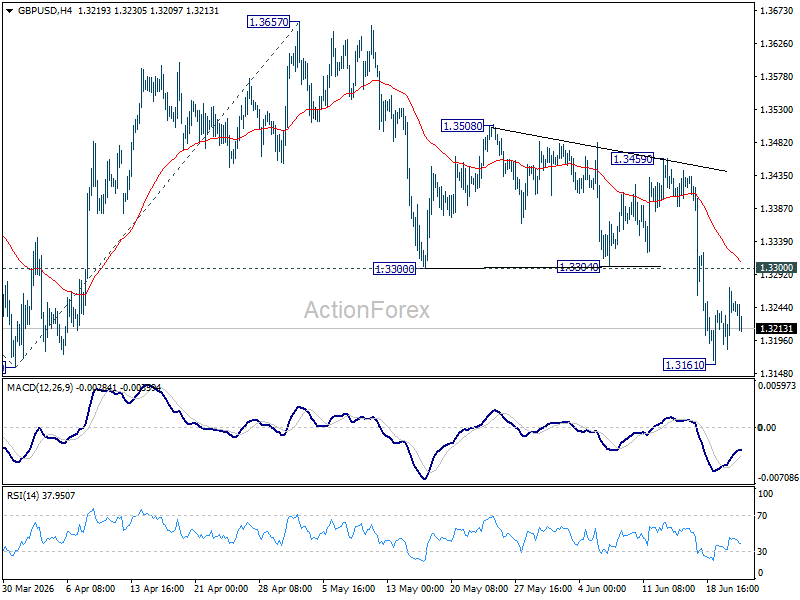
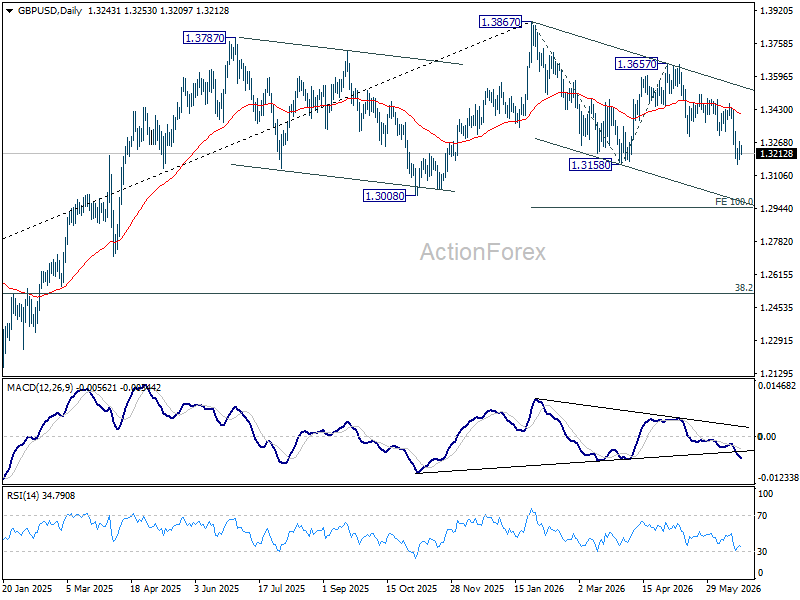
Intraday bias in GBP/USD remains neutral and more consolidations could be seen above 1.3161 temporary low. Further fall is expected as long as 1.3300 support turned resistance holds. On the downside, decisive break of 1.3158 support will resume whole fall from 1.3867 to 100% projection of 1.3867 to 1.3158 from 1.3657 at 1.2948.
In the bigger picture, price actions from 1.3867 are a corrective pattern within the broader up trend from 1.0351 (2022 low). With 1.3008 support intact, medium term bullishness is maintained and break of 1.3867 is in favor for a later stage, towards 1.4248 key resistance (2021 high). However, firm break of 1.3008 will at least bring deeper fall to 38.2% retracement of 1.0351 to 1.3867 at 1.2524, with increased risk of bearish reversal.
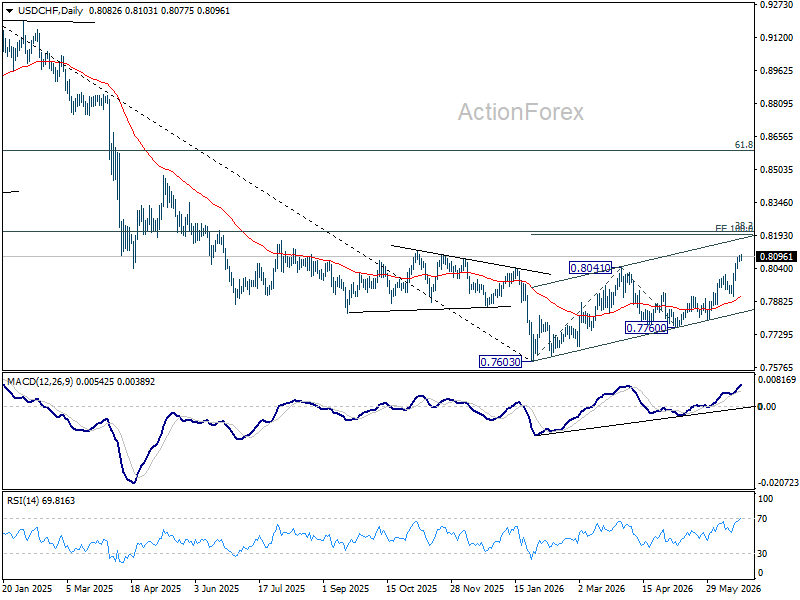
USD/CHF Daily Outlook
Intraday bias in USD/CHF remains mildly on the upside for the moment. Current rally should target 100% projection 0.7603 to 0.8041 from 0.7600 at 0.8198 next. On the downside, below 0.8053 minor support will turn intraday bias neutral and bring consolidations first before staging another rise.
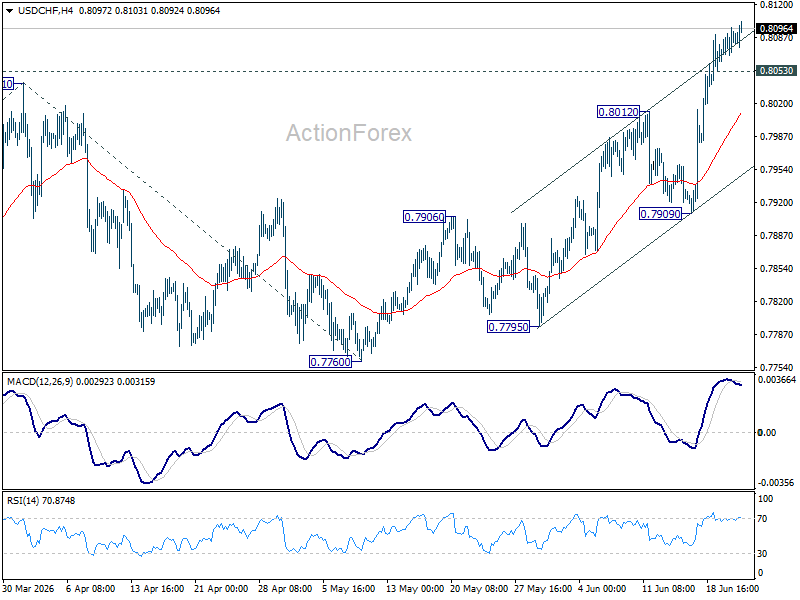
In the bigger picture, while a medium term bottom was formed at 0.7603, it's still early to call for bullish trend reversal. As long as 38.2% retracement of 0.9200 (2025 high) to 0.7603 at 0.8213 holds, the larger down trend could still continue through 0.7603 at a later stage. However, firm break of 0.7603 will argue that the trend has reversed and turn focus to 0.8332 support turned resistance (2023 low) for confirmation.
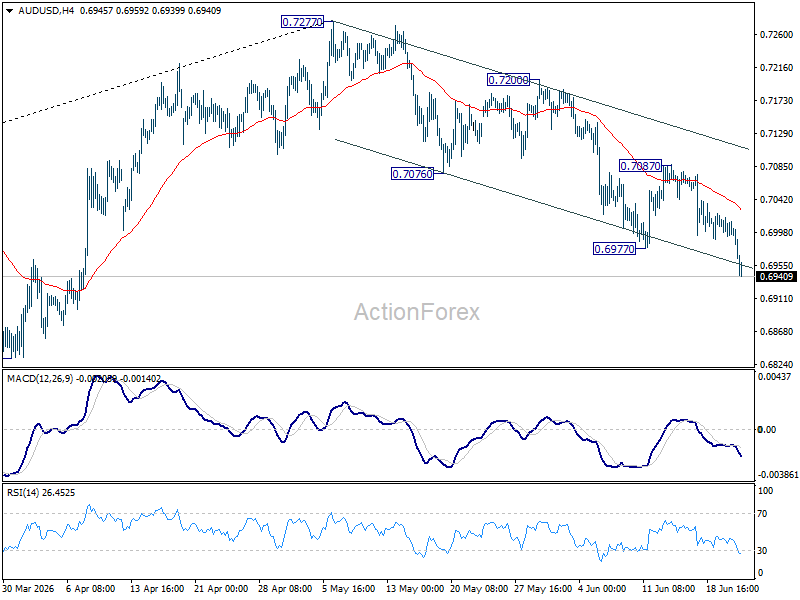
AUD/USD Daily Report
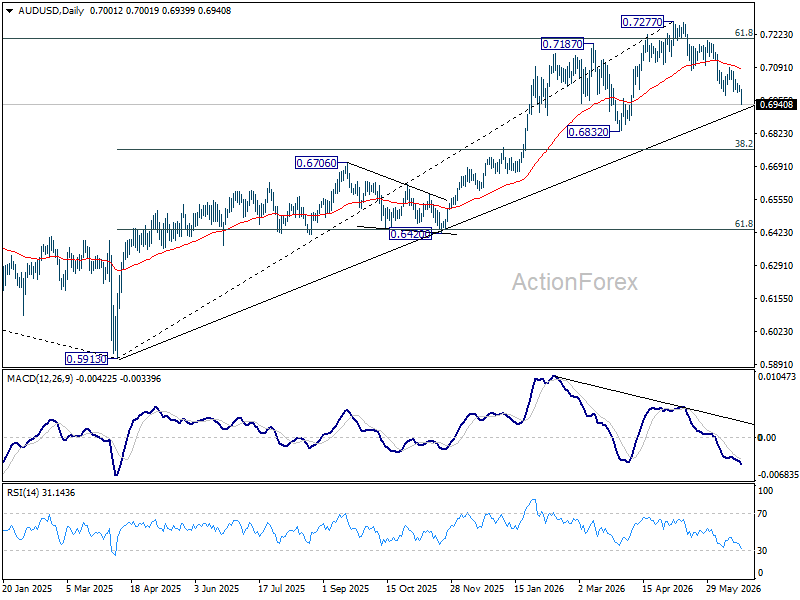
AUD/USD's fall from 0.7277 resumed by breaking through 0.6977 and intraday bias is back on the downside. Further decline should be seen to 0.6832 support next. For now, risk will stay on the downside as long as 0.7087 resistance holds, in case of recovery.
In the bigger picture, considering bearish divergence condition in D MACD, a medium term top could be formed at 0.7277 after failing to sustain above 61.8% retracement of 0.8006 (2021 high) to 0.5913 (2024 low) at 0.7206). Deeper fall could be seen to 38.2% retracement of 0.5913 to 0.7277 at 0.6756 as a correction. But strong support should be seen there to bring rebound. Consolidations would continue below 0.7277 for a while.
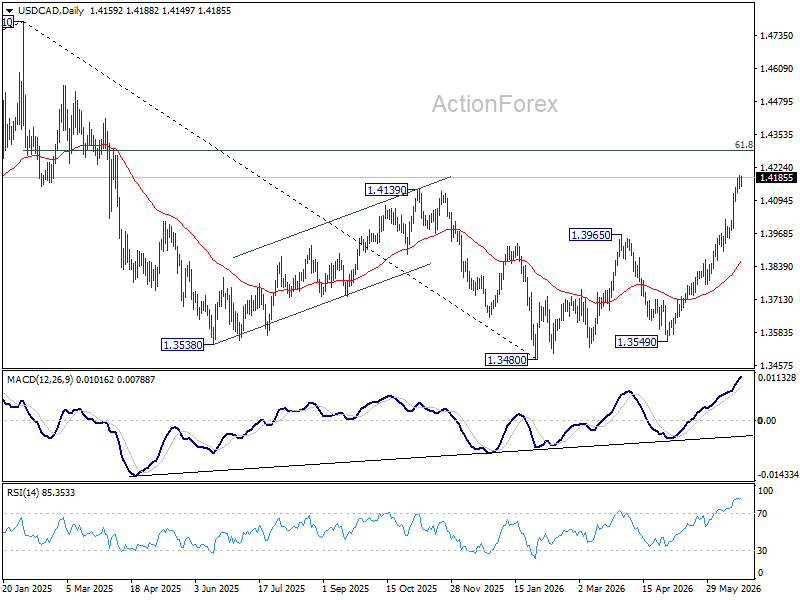
USD/CAD Daily Outlook
Intraday bias in USD/CAD remains mildly on the upside for the moment. Current rise from 1.3480 should target 61.8% retracement of 1.4791 to 1.3480 at 1.4290. On the downside, below 1.4131 minor support will turn intraday bias neutral and bring consolidations first, before staging another rally.
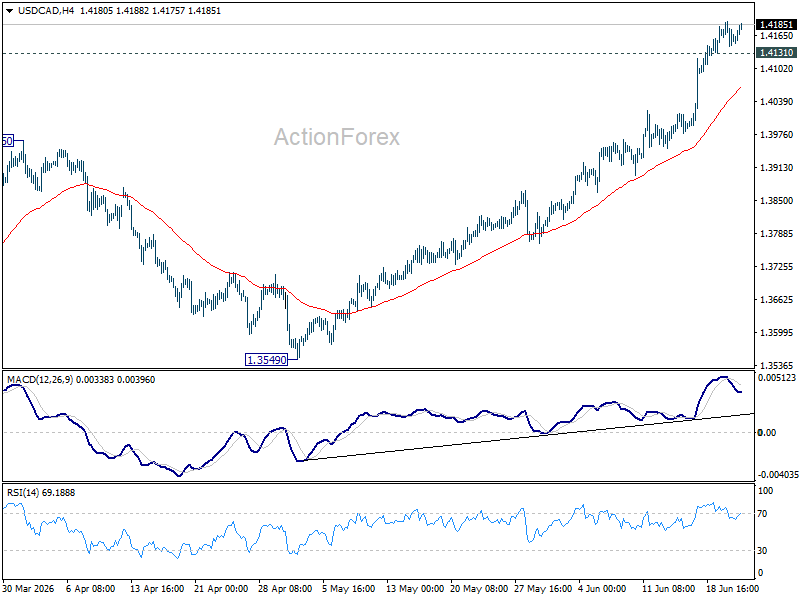
In the bigger picture, current development suggests that fall from 1.4791 has completed as a three wave correction to 1.3480. It's still early to judge if rise from there a corrective bounce, or resumption of the larger up trend from 1.2005 (2021 low). But in either case, retest of 1.4791 high should be seen next.
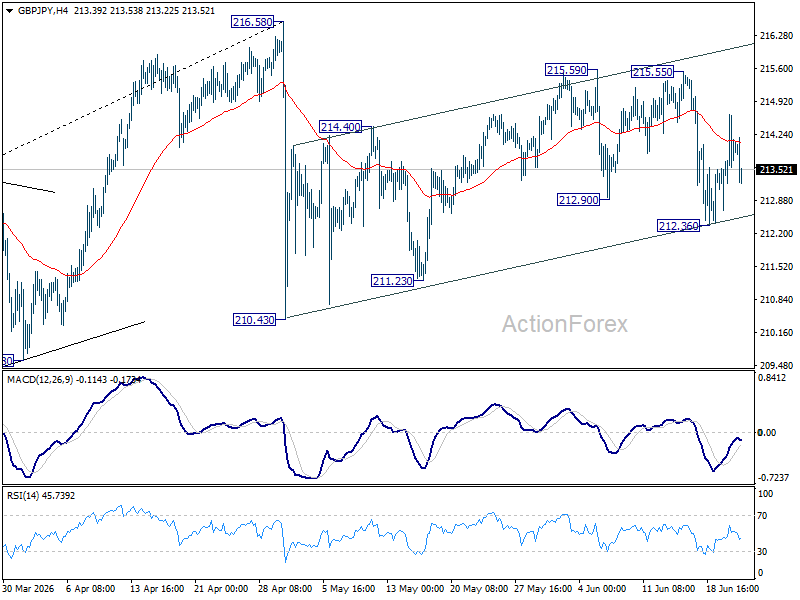
GBP/JPY Daily Outlook
Intraday bias in GBP/JPY remains neutral at this point. On the downside, below 212.36 will affirm the case that rebound form 210.43 has completed as a correction. Deeper fall would be seen to 211.23 support first. However, break of 215.59 will resume the rebound from 210.43 to retest 216.58.
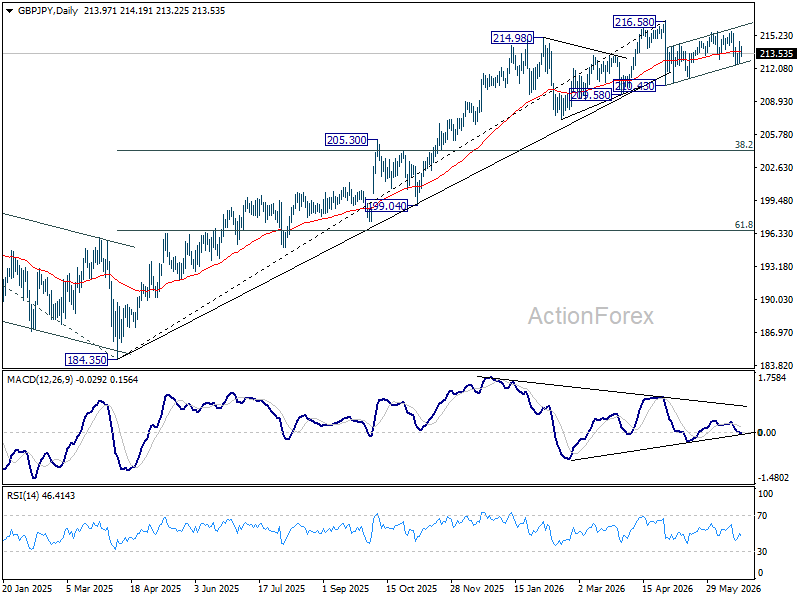
In the bigger picture, there is no clear sign of trend reversal yet. The long term up trend could still extend to 61.8% projection of 148.93 (2022 low) to 208.09 (2024 high) from 184.35 at 220.90 on resumption. However, sustained break of 55 W EMA (now at 207.11) will argue that it's already in medium term down trend for 184.35 support.
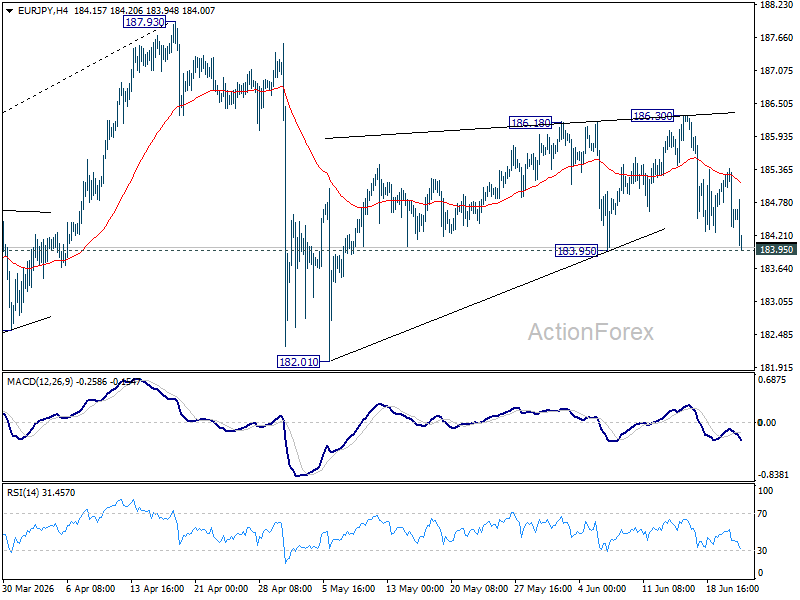
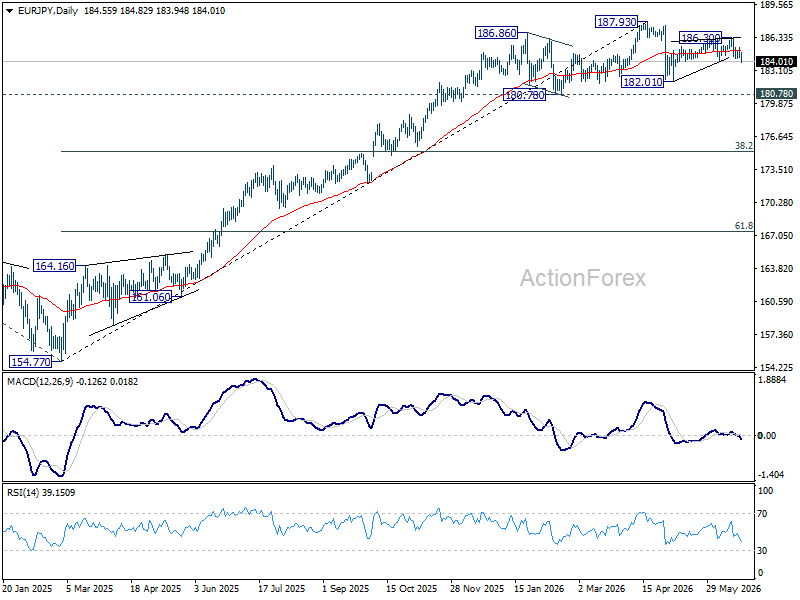
EUR/JPY Daily Outlook
Intraday bias in EUR/JPY stays neutral first. On the downside, firm break of 183.95 will argue that rebound from 182.01 has completed, and bring deeper fall back to this support. Nevertheless, break of 186.30 will resume the rise to retest 187.93 high instead.
In the bigger picture, there is no sign of reversal yet. Uptrend from 114.42 (2020 low) is still expected to resume at a later stage to 78.6% projection of 124.37 (2022 low) to 175.41 (2025 high) from 154.77 at 194.88. However, sustained break of 55 W EMA (now at 179.41) will argue that it's already in a medium term down trend to 175.41 resistance turned support and below.
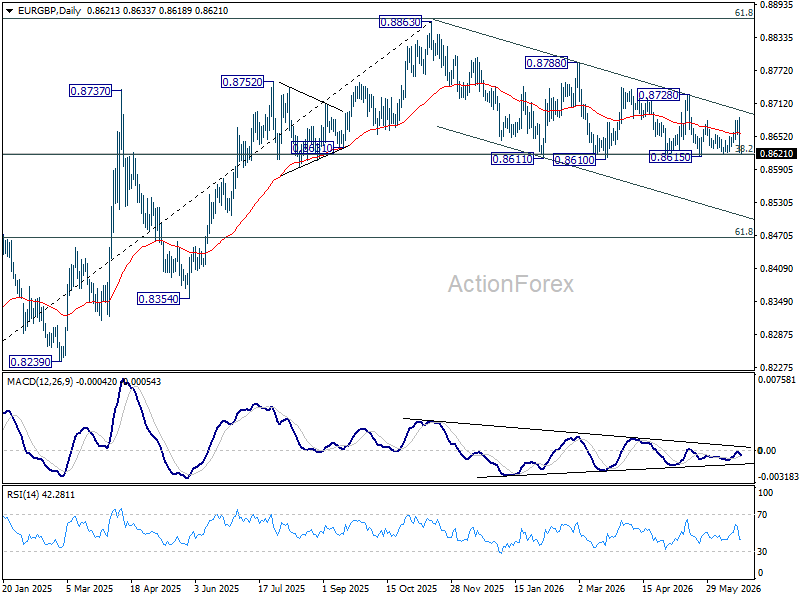
EUR/GBP Daily Outlook
EU/GBP is still holding above 0.8615 support despite current sharp fall. Intraday bias remains neutral first. On the upside, firm break of 0.8686 resistance will bring further rally back to 0.8278 resistance. Decisive break there will argue that fall from 0.8863 has completed already. On the downside, however, decisive break of 0.8610 support will revive the case of bearish trend reversal.
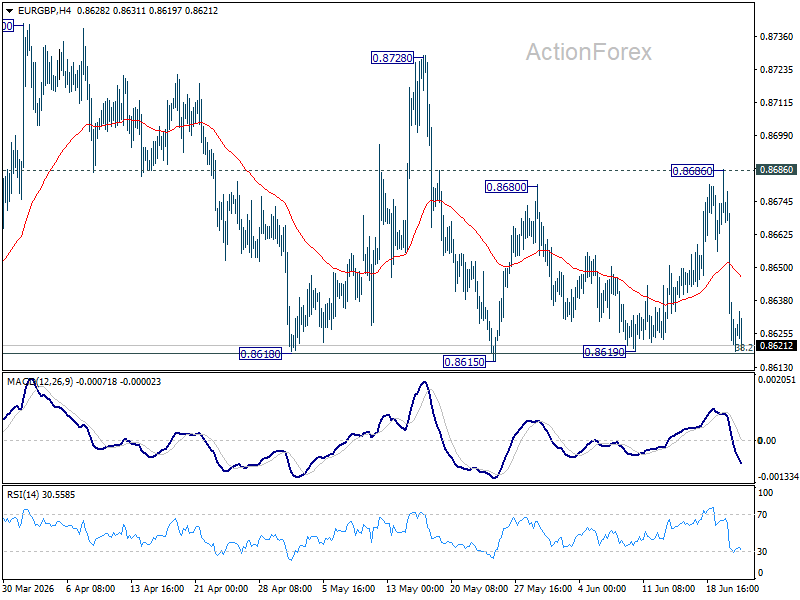
In the bigger picture, focus is staying on 38.2% retracement of 0.8221 to 0.8863 at 0.8618. Strong rebound from there will retain medium term bullishness. Rise from 0.8221 should resume through 0.8863 at a later stage. Nevertheless, sustained break of 0.8618 will confirm that whole rise from 0.8221 has completed at 0.8863. Deeper decline should then be seen to 61.8% retracement at 0.8466 at least.