
Sample Category Title
EUR/JPY Daily Outlook
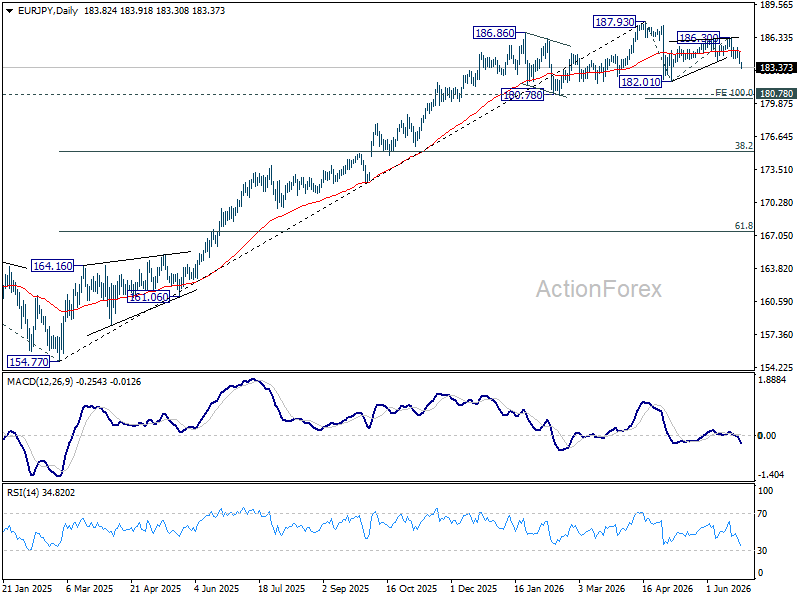
EUR/JPY's break of 183.95 suggests that rebound from 182.01 has completed as a corrective move at 186.03. Intraday bias is back on the downside for 182.01 first. Firm break there will resume the fall from 187.93 and target 100% projection of 187.93 to 182.01 from 186.30 at 180.38. On the upside, above 184.27 minor resistance will turn intraday bias neutral first.
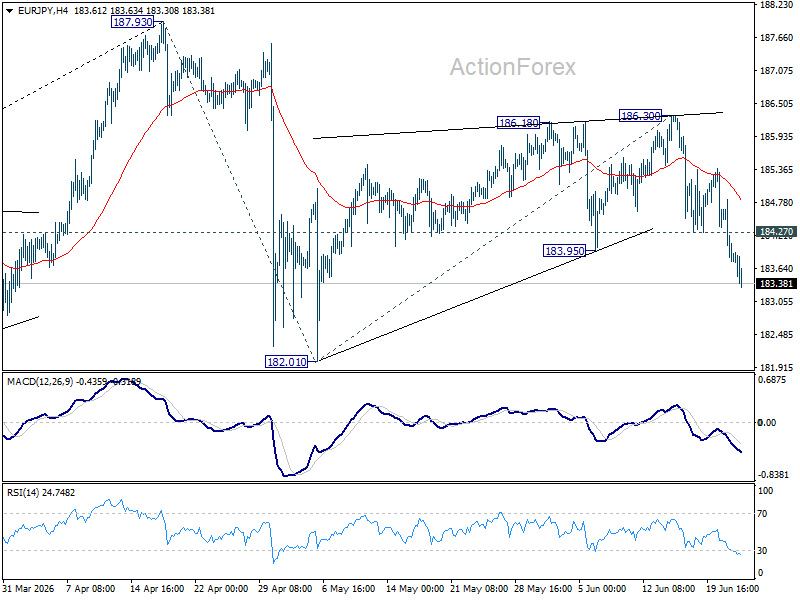
In the bigger picture, there is no sign of reversal yet. Uptrend from 114.42 (2020 low) is still expected to resume at a later stage to 78.6% projection of 124.37 (2022 low) to 175.41 (2025 high) from 154.77 at 194.88. However, sustained break of 55 W EMA (now at 179.41) will argue that it's already in a medium term down trend to 175.41 resistance turned support and below.
EUR/GBP Daily Outlook
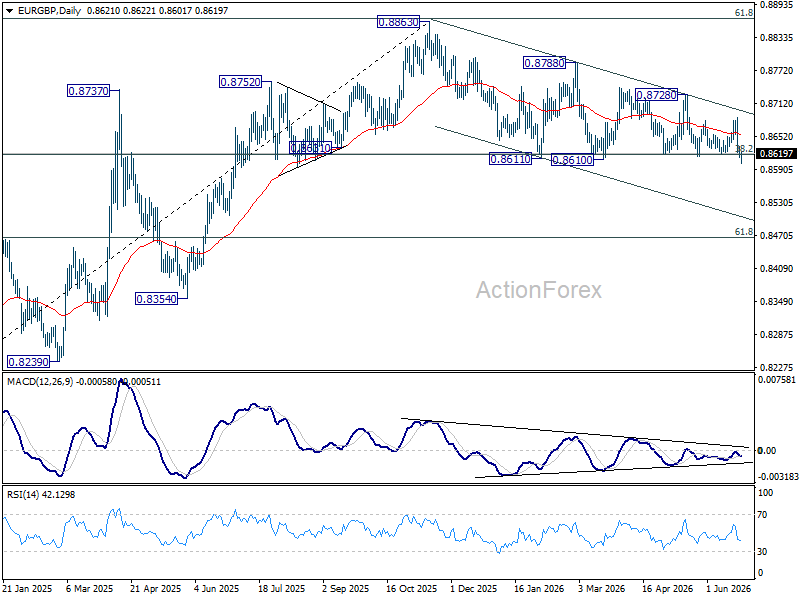
Immediate focus is now on 0.8610/8 key support zone. Decisive break there will will revive the case of bearish trend reversal, and target 0.8466 fibonacci level. Nevertheless, firm break of break of 0.8686 resistance will bring further rally back to 0.8728 resistance.
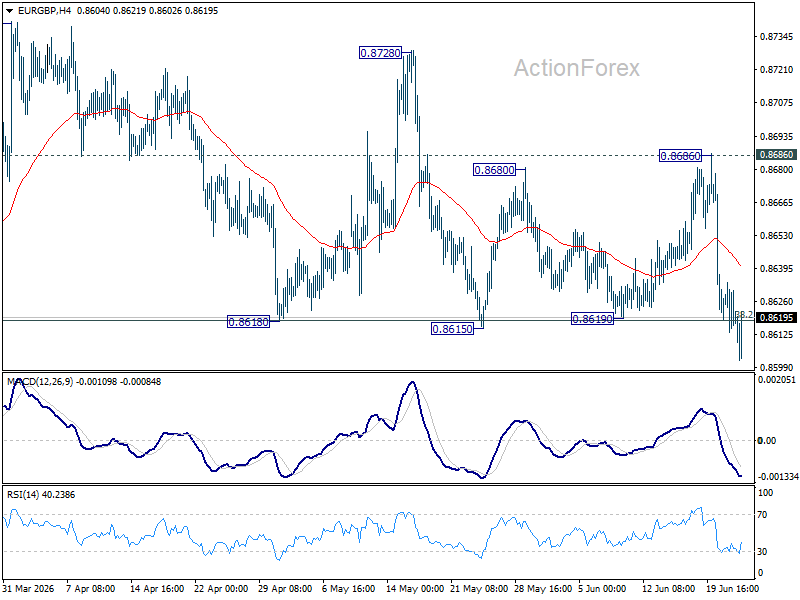
In the bigger picture, focus is staying on 38.2% retracement of 0.8221 to 0.8863 at 0.8618. Strong rebound from there will retain medium term bullishness. Rise from 0.8221 should resume through 0.8863 at a later stage. Nevertheless, sustained break of 0.8618 will confirm that whole rise from 0.8221 has completed at 0.8863. Deeper decline should then be seen to 61.8% retracement at 0.8466 at least.
EUR/AUD Daily Outlook
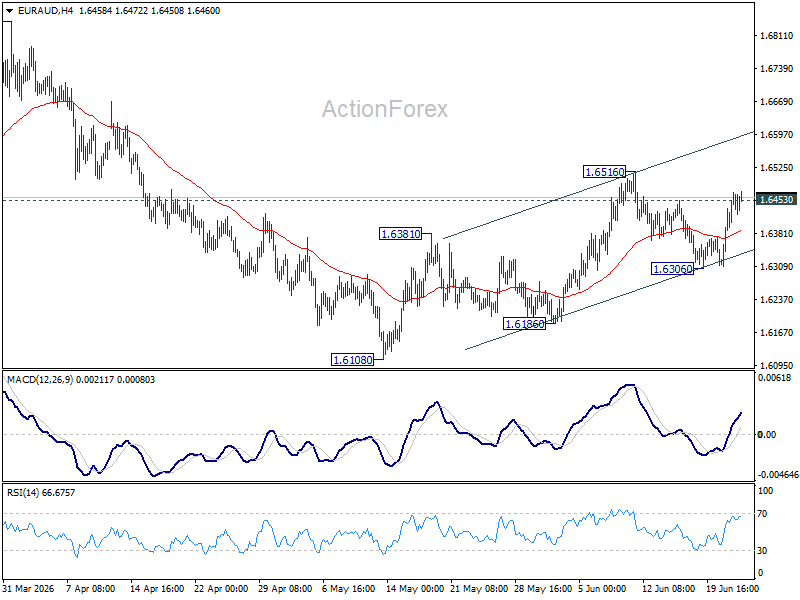
EUR/AUD's break of 1.6453 suggests that pullback from 1.6516 has completed at 1.6306. More importantly, rise from 1.6108 is still in progress. Intraday bias is back on the upside, firm break of 1.6516 will target 1.6842 resistance. For now, risk will stay mildly on the upside as long as 1.6306 support holds.
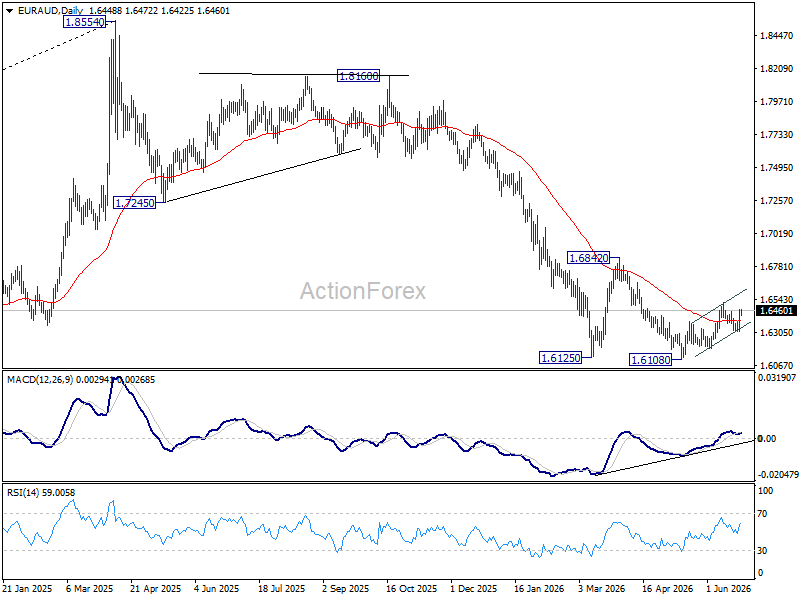
In the bigger picture, outlook will stay bearish as long as 1.6842 resistance holds. Fall from 1.8554 (2025 high) is expected to continue to 61.8% retracement of 1.4281 to 1.8554 at 1.5913. Decisive break there will pave the way back to 1.4281 (2022 low). However, firm break of 1.6842 should confirm medium term bottoming, and bring stronger rally.
EUR/CHF Daily Outlook
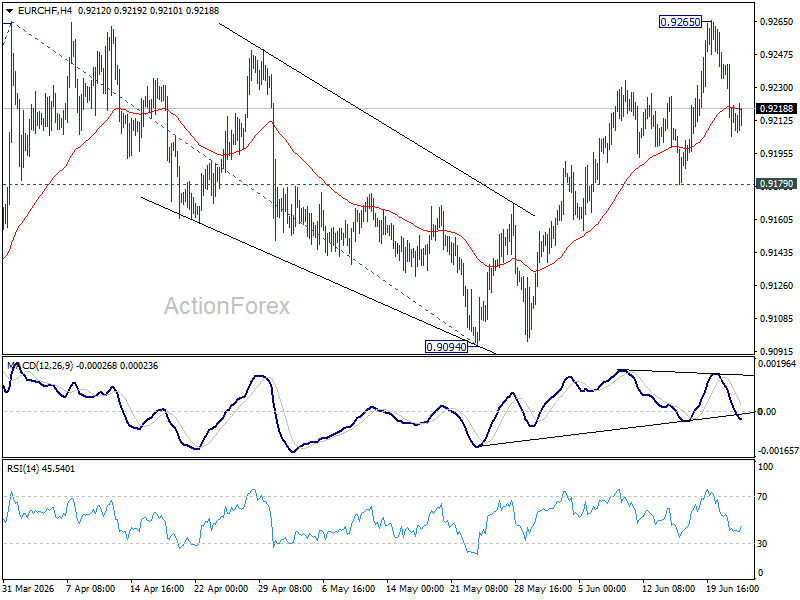
Intraday bias in EUR/CHF remains neutral and more consolidations could be seen below 0.9265. Further rise is expected as long as 0.9179 support holds. On the upside, decisive break of 0.9264 resistance will resume the rally from 0.8979 to 100% projection of 0.8979 to 0.9264 from 0.9094 at 0.9379. However, firm break of 0.9179 will turn bias back to the downside for 0.9094 support instead.
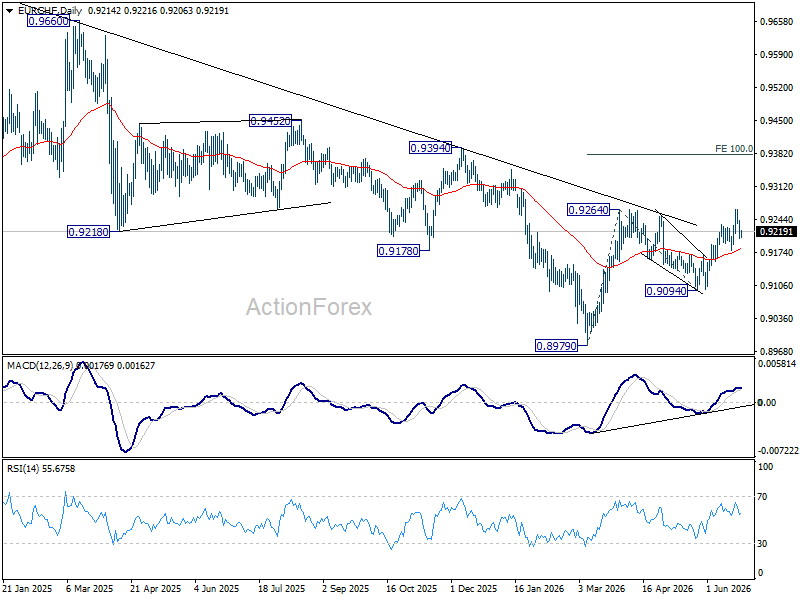
In the bigger picture, the break of medium term falling trend line resistance indicate that 0.8979 is already on medium term bottom. Considering bullish convergence condition in W MACD, rise from there should at least be reversing the fall from 0.9928, with prospect of developing into a medium term up trend. Firm break of 0.9394 resistance will add more credence to this case. For now rise will remain on the upside as long as 0.9094 support holds, in case of retreat.
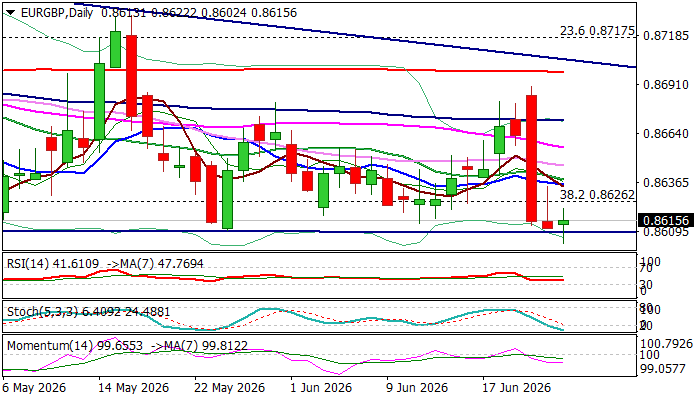
EURGBP Hits New Multi-Month Low but Very Strong Supports at 0.8600 Zone Still Hold
EURGBP hit the lowest since 15 Aug 2025 on Wednesday on probes through key supports at 0.8610 zone (multi-month higher base).
The pair remains firmly in red, following Monday’s 0.8% drop (the biggest daily drop since 25 July last year) with long upper shadow on Tuesday’s daily candle, pointing to strong offers.
Series of lower tops since mid-November 2025 define the downtrend, but formation of higher base at 0.8610 zone, where several downside attempts have so far been contained, warn that bears might be rejected here again.
Rising negative momentum and RSI showing more space to the downside on daily chart, contribute to bearish scenario in which firm break of 0.8610 base and 0.8600 (200WMA) would signal bearish continuation and expose next strong support at 0.8552 (50% retracement of 0.8239/0.8865 / 100WMA / weekly cloud base).
On the other hand, bears may pause again above 0.8600 zone, with limited upticks (ideally to be capped under 0.8640 zone) to provide better levels to re-join bearish market.
Res: 0.8626; 0.8640; 0.8656; 0.8670
Sup: 0.8600; 0.8552; 0.8507; 0.8478
Gold: Is a Fall to $4,000 on the Cards?
- Gold is falling as the US dollar strengthens.
- The S&P 500’s pullback is accelerating the precious metal’s decline.
The US dollar capitalised on the euro’s weakness and continued its advance, reaching its highest level in over a year and pushing EURUSD to near 1.1350. European business activity remains in contraction territory, below 50 on the PMI index, for the third month, whilst Christine Lagarde has made it clear that the futures market’s expectations of further ECB rate rises are overblown. According to the ECB President, there is no need to react aggressively to the consequences of the armed conflict between the US and Iran.
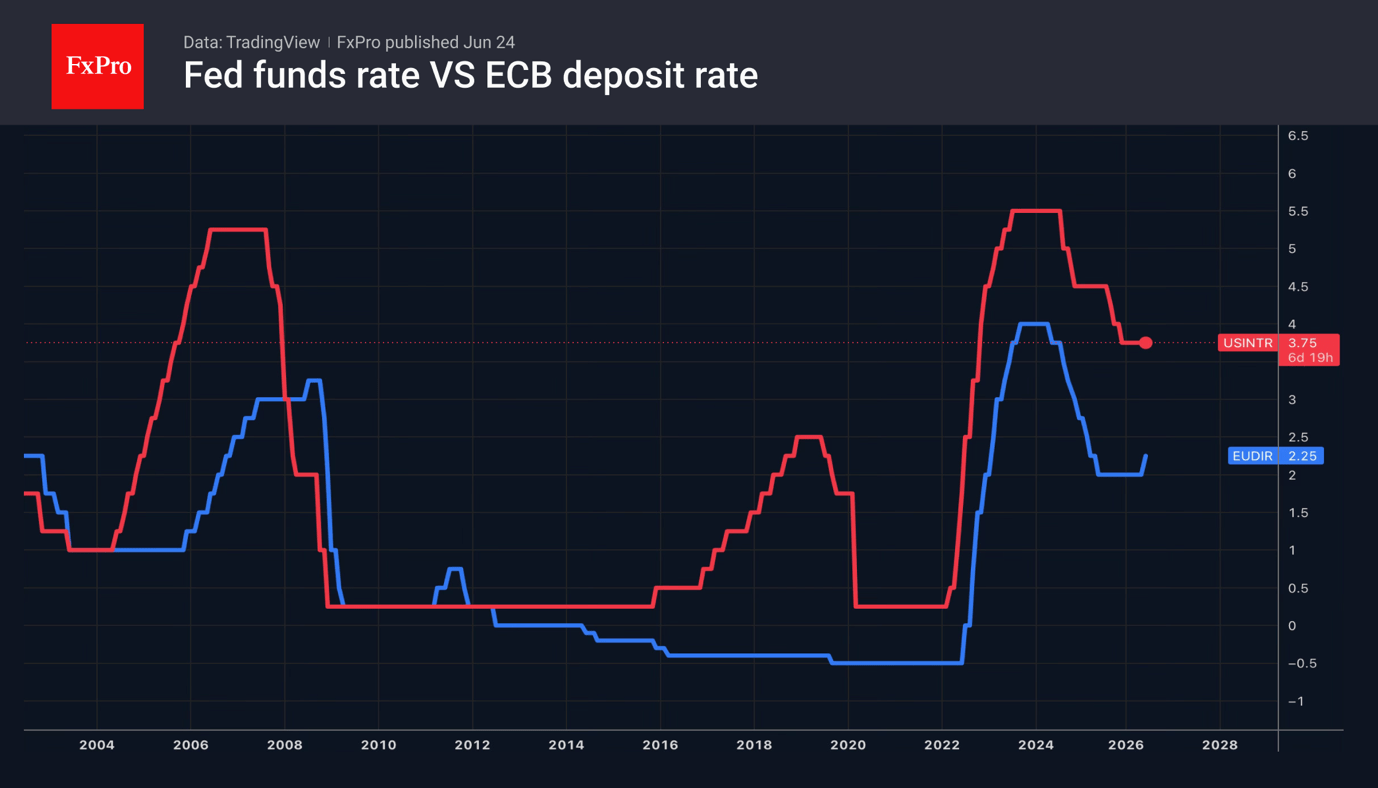
As more tankers pass through the Strait of Hormuz, Brent crude has returned to levels seen before the conflict in the Middle East. The view is gaining ground in the markets that the surge in inflation will be temporary. The ECB can afford to wait after raising rates in June, given that business activity data point to weakness in the eurozone economy. By contrast, following the Fed’s ‘hawkish’ shift, CME derivatives are pricing in two further Fed rate-tightening moves in 2026.
The weakening of the euro is fuelling a rally in the USD index, whilst yields on US Treasury bonds are rising. For two-year bonds, yields have reached their highest level since February 2025. This backdrop is extremely unfavourable for gold. XAUUSD prices have returned to the 7-month low region. Although gold is viewed as a hedge against inflation, its fate depends on the Fed’s response to price trends. Kevin Warsh’s determination to bring the PCE back to target at all costs does not bode well for gold.
Unsurprisingly, following Goldman Sachs, Deutsche Bank has also lowered its forecast for the precious metal from $4,800 to $4,300 per ounce in the fourth quarter.
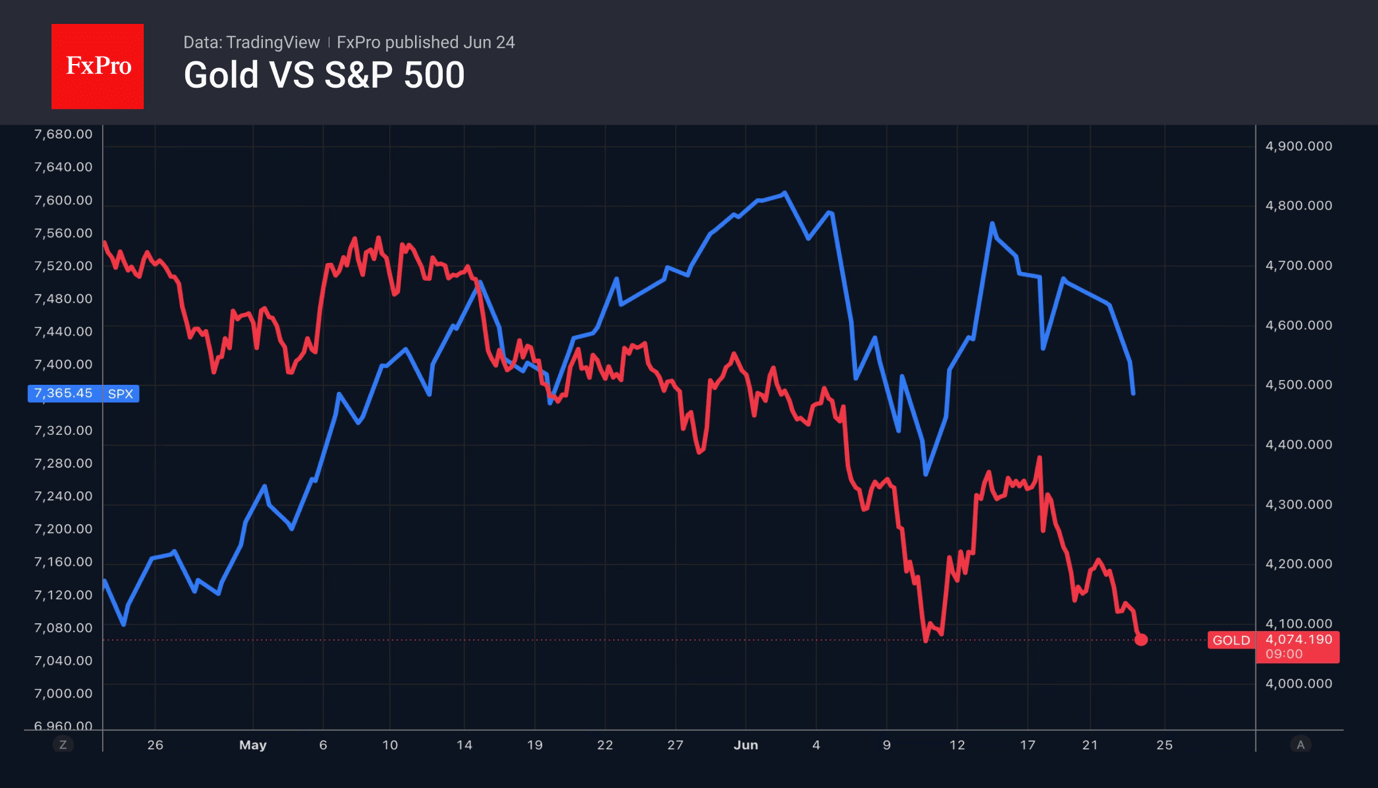
Gold is coming under pressure from selloffs in the US equity market. Expectations of a Fed rate rise as early as September, and possibly even in July, are causing panic amongst investors. So too are concerns about the inefficiency of technology companies. AI costs are colossal, whilst service prices are set to fall gradually due to competition. Gold is used as a liquidity tool. It is sold to meet margin requirements. Therefore, a fall in the S&P 500 is bad news for the precious metal.
The FxPro Analyst Team
Pound Pressured Not by Politics, but by a Strong US Dollar
The GBP/USD pair fell to 1.3193 on Wednesday. The British pound came under pressure amid a stronger US dollar and political uncertainty in the UK following the announcement of Prime Minister Keir Starmer’s resignation.
Andy Burnham is considered the main contender for the post of head of government and has already received support from several influential figures within the ruling party. Markets are generally taking the prospect of his appointment positively, as investors expect a smooth transfer of power without serious shocks to the economy or financial markets.
The appointment of a new finance minister also remains in focus. Wes Streeting is seen as the favourite for the role. Market participants view him as a more predictable and business-friendly candidate.
Weak macroeconomic data added further pressure on the pound. According to S&P Global, business activity in the UK contracted in June at the fastest pace since April 2025. The composite PMI fell below the 50-point mark, signalling a decline in economic activity. The services sector posted its weakest performance since early 2023.
Against this backdrop, the pound declined against the US dollar, while showing little change against the euro. Investors are assessing the prospects of the new political team and its ability to support the economy. Meanwhile, the UK economy remains close to stagnation.
Technical Analysis
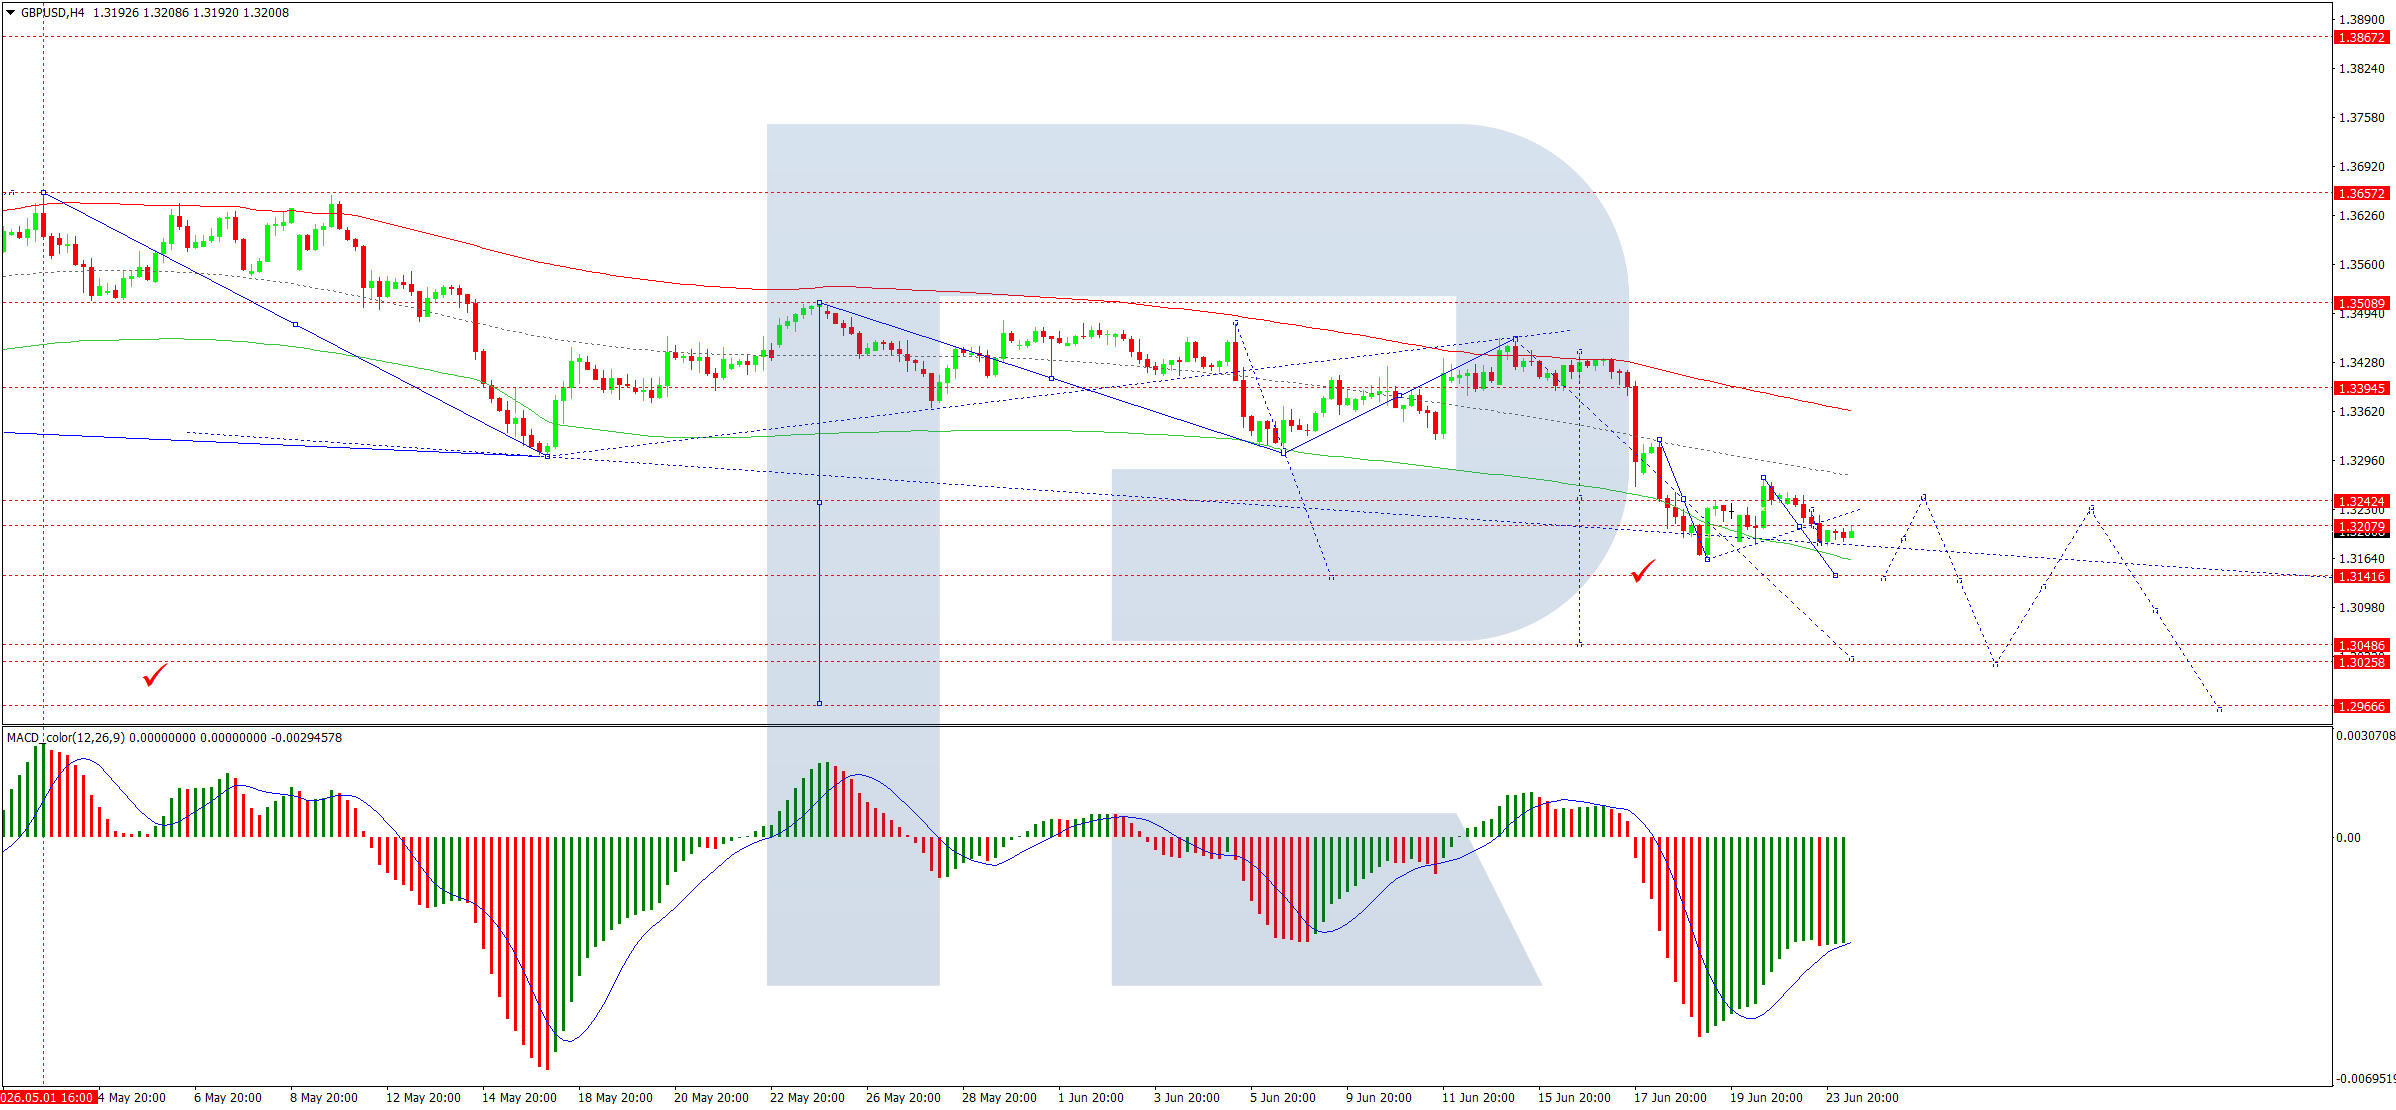
On the H4 chart of GBP/USD, the market completed a downward wave to 1.3185. We expect a growth phase towards 1.3200. In practice, a wide consolidation range is forming below this level.
If the pair breaks out of the range to the upside, the potential will open for the wave to continue towards 1.3240. If the pair breaks out to the downside, the potential will open for a continuation of the decline towards 1.3140.
Technically, this scenario is confirmed by the MACD indicator. Its signal line is below the zero mark and is pointing firmly downwards.
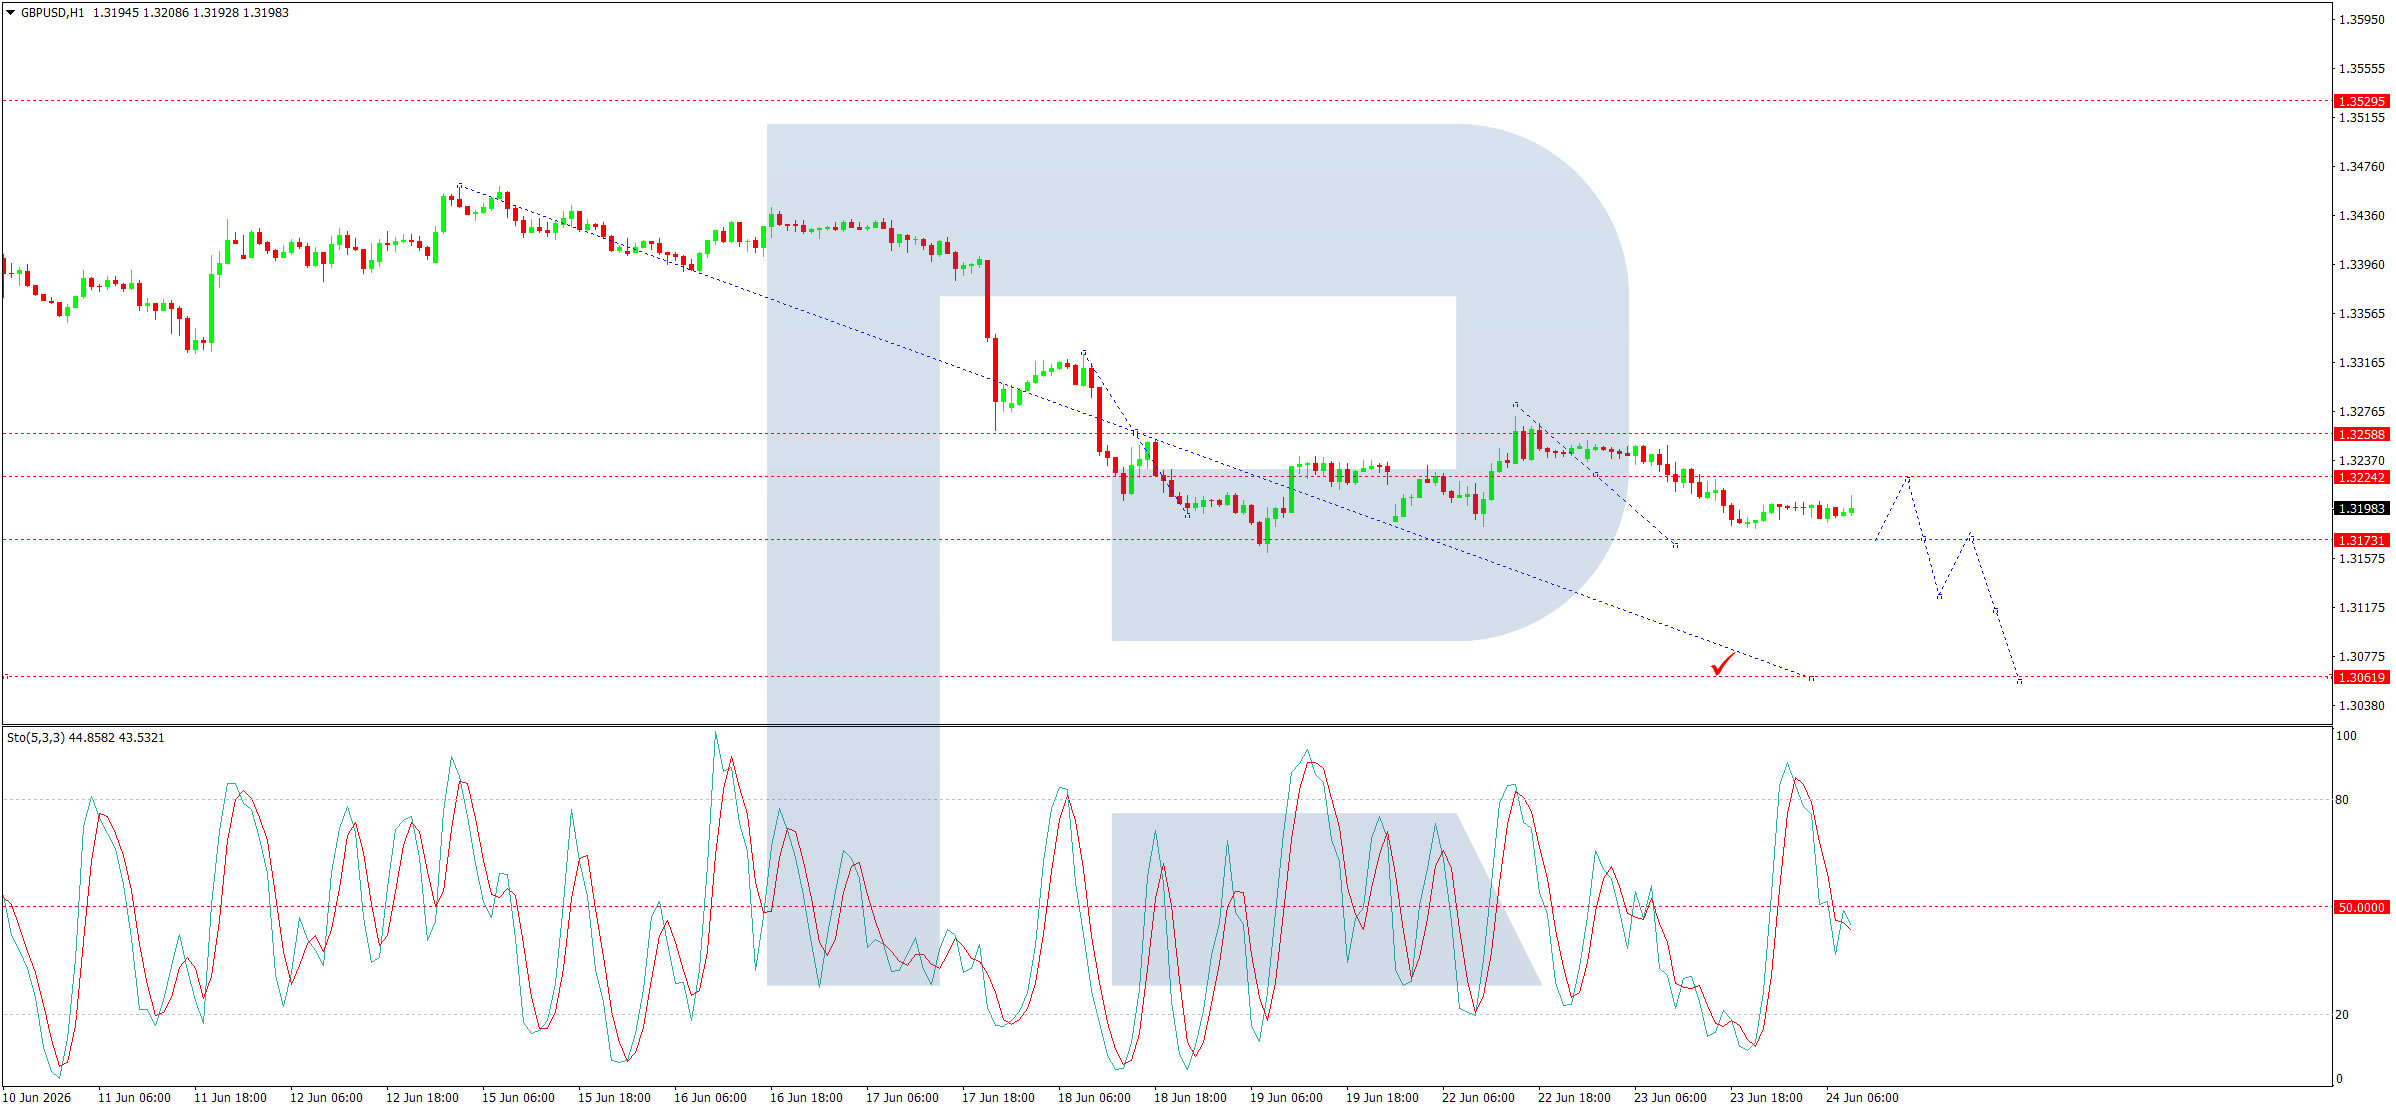
On the H1 chart, GBP/USD has formed a compact consolidation range around 1.3222. At the moment, the range has expanded downwards to 1.3185. Further growth towards 1.3200 is expected, followed by a decline to 1.3140.
The Stochastic oscillator also supports this scenario. Its signal line is below 50 and is pointing firmly downwards towards 20.
Disclaimer
Any forecasts contained herein are based on the author's particular opinion. This analysis may not be treated as trading advice. RoboForex bears no responsibility for trading results based on trading recommendations and reviews contained herein.
RBNZ Hike Bets Collapse as NZD/USD Accelerates Toward Critical 0.5580 Support
New Zealand Dollar has emerged as one of the weakest major currencies this week, with NZD/USD breaking to a multi-month low as a combination of global risk aversion, broad-based Dollar strength, and rapidly fading expectations of near-term Reserve Bank of New Zealand tightening weigh heavily on the currency. The selloff has accelerated notably in recent sessions, reflecting a sharp reversal from the narrative that supported Kiwi during April and May.
The shift begins with oil. Earlier this year, escalating tensions between the United States and Iran triggered a surge in energy prices, prompting concerns that imported inflation would become more persistent across New Zealand's economy. Markets responded by increasingly pricing in the possibility of a RBNZ rate hike, with speculation building that policymakers could move as soon as the July 8 meeting. That tightening narrative helped support NZD even as global growth concerns lingered.
The geopolitical backdrop has since changed dramatically. The US-Iran ceasefire agreement and subsequent progress toward a broader peace framework have driven oil prices sharply lower, removing much of the inflation urgency that had pushed the RBNZ toward a more hawkish stance. Instead of debating whether a July hike is likely, investors are questioning whether the central bank needs to move at all in the near term. The collapse in hike expectations has become a significant headwind for Kiwi.
Domestic economic conditions reinforce that caution. Forecasts for second-quarter GDP point to stagnation or even outright contraction, while both PMI Manufacturing and PMI Services remain stuck in contraction territory. Against that backdrop, the RBNZ faces a difficult balancing act. Policymakers remain alert to inflation risks, but tightening policy too aggressively could place additional strain on an already fragile economy.
Market pricing has adjusted accordingly. Just weeks ago, interest-rate swaps were aggressively pricing the possibility of a 25-basis-point increase in July. Those expectations have largely evaporated following the geopolitical de-escalation. Westpac recently argued that falling global fuel prices should moderate the recent inflation upswing and reduce the risk of a broader and more persistent acceleration in prices. As a result, the bank now expects the RBNZ to remain on hold until September, while warning that policymakers may become increasingly cautious about how quickly rates need to rise thereafter.
At the same time, the external environment has turned increasingly hostile for NZD. Global technology stocks have come under pressure amid a wave of deleveraging, encouraging investors to reduce exposure to risk-sensitive currencies. Meanwhile, Dollar has benefited from both safe-haven demand and growing speculation that the Federal Reserve could deliver one or even two additional rate hikes later this year. That widening policy divergence between the Fed and RBNZ has added extra pressure to NZD/USD.
Technically, the outlook has deteriorated significantly. The break below 0.5678, the April low, confirms resumption of the broader decline from the January high at 0.6092. As long as 0.5768 support turned resistance holds, further losses remain favored.
The next major target sits at the 0.5580 support cluster, including 100% projection of 0.6092 to 0.5678 from 0.5993 at 0.5579. This zone may prove decisive.
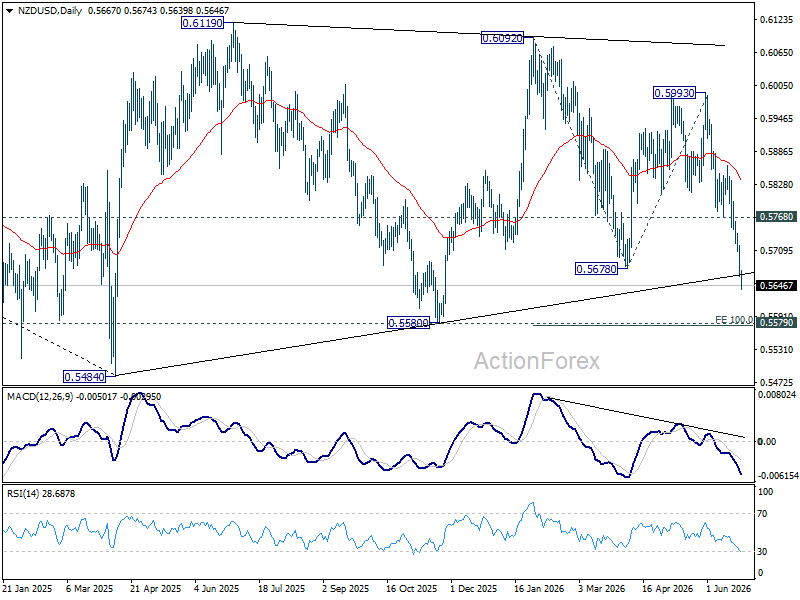
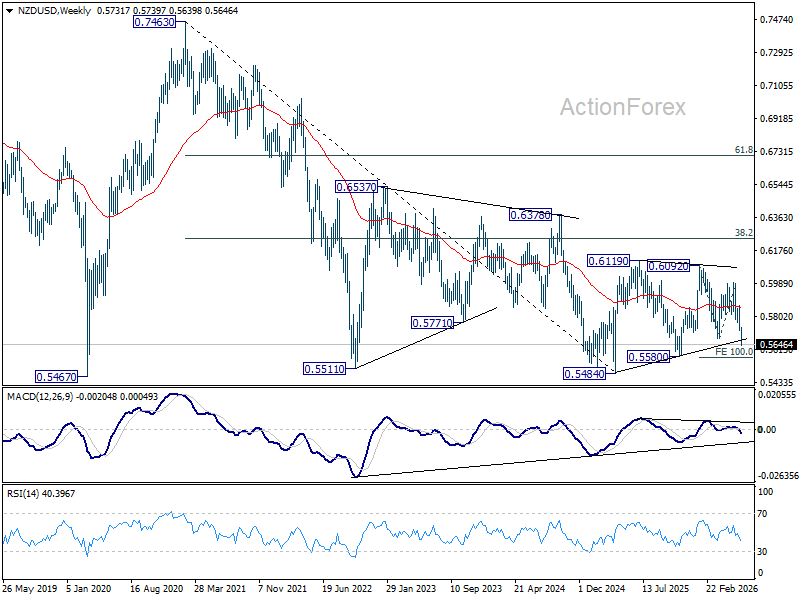
A firm break would not only signal renewed downside acceleration but also strengthen the case that the entire corrective pattern from the 2025 low at 0.5484 has completed at 0.6092. Both could reinforce each other, and indicates that long term down trend from 0.7463 (2021 high) is ready to resume through 0.5484 low.
Germany’s Ifo Business Climate Rises as Firms Hope for Geopolitical Relief
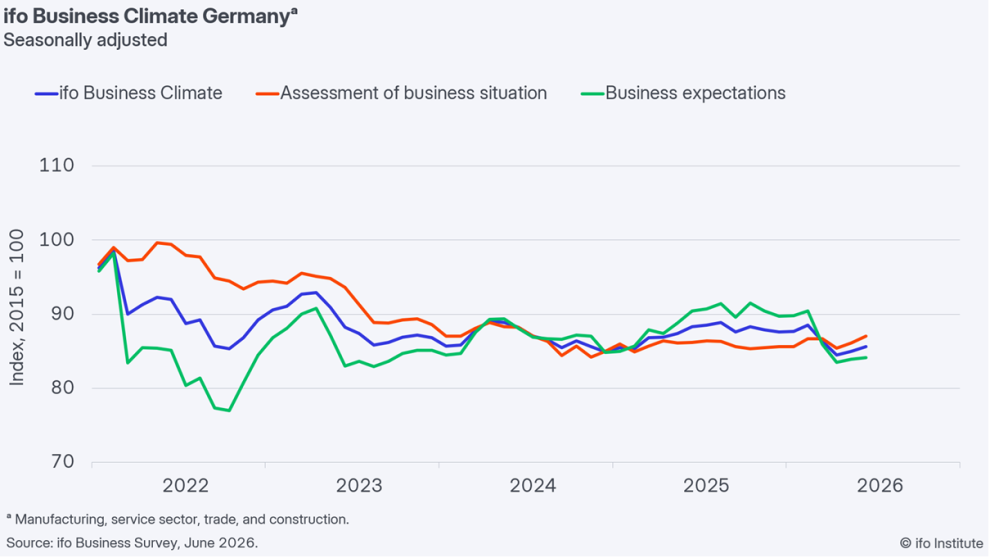
German business sentiment improved modestly in June, with the Ifo Business Climate Index rising from 84.9 to 85.6, matching expectations and extending its gradual recovery. The improvement was driven primarily by stronger assessments of current conditions, with the Current Assessment Index rising from 86.1 to 87.0, beating expectations. However, the Expectations Index edged up only slightly from 83.8 to 84.1, falling short of forecasts and suggesting that confidence about the future remains cautious.
According to Ifo, companies are becoming less concerned about uncertainty and are increasingly hoping for an easing of geopolitical tensions. Manufacturing provided some encouraging signs, with expectations improving noticeably. However, firms reported that new orders continued to decline and assessments of current conditions softened slightly. In services, business sentiment improved as companies became more satisfied with current activity levels, though expectations remained largely unchanged and skepticism persisted across much of the sector.
The recovery picture remained mixed across the broader economy. Trade companies reported improvements in both current conditions and expectations, but Ifo noted that the path back to a stronger recovery remains long. Construction sentiment also improved as firms became less pessimistic about the future, although many businesses continued to complain about weak order books.
Overall, the survey suggests that Germany's economy is stabilizing as geopolitical concerns ease, but demand remains too weak to support a stronger or more broad-based recovery.
| Indicator | May | June | Expectation |
|---|---|---|---|
| Ifo Business Climate | 84.9 | 85.6 | 85.6 |
| Current Assessment | 86.1 | 87.0 | 86.0 |
| Expectations | 83.8 | 84.1 | 85.0 |
Ueda Reinforces Hawkish BoJ Message, Says More Rate Hikes Likely
Bank of Japan Governor Kazuo Ueda reinforced the central bank's tightening bias on Wednesday, signaling that further rate hikes remain likely as inflation risks continue to build. In remarks delivered by Deputy Governor Ryozo Himino while Ueda recovers from a recent hospitalization, the governor said that "with underlying inflation moving toward 2% and financial conditions remaining accommodative, we expect to continue increasing the interest rate and adjusting the degree of monetary accommodation in response to economic activity, prices and financial conditions."
The comments closely echoed the message delivered at last week's policy meeting, where the BoJ raised its benchmark interest rate to 1.00%, the highest level since 1995. Ueda also reiterated concerns that inflation could overshoot the Bank's target, particularly after the recent surge in energy prices linked to the conflict in the Middle East. While oil prices have retreated following progress toward peace, policymakers continue to see risks that higher costs could spread more broadly through the economy.
Ueda emphasized that the timing and pace of future adjustments would depend on incoming data and external developments, including the aftermath of the Iran conflict. Nevertheless, the overall message remained firmly hawkish. His remarks come just hours after the BoJ's Summary of Opinions revealed broad support for additional tightening, with several policymakers discussing the need to move rates closer to a neutral level over time. Together, the comments reinforce market expectations that last week's hike was not the end of the normalization cycle.