Sample Category Title
AUDUSD Slides Further as Fed Rate Hike Hopes Continue to Boost Dollar
Steep bear-leg from 0.7000 zone extends into second consecutive day and hits the lowest levels since early April, as the Aussie dollar came under increased pressure from stronger dollar, driven by expectations that Fed may start tightening its monetary policy as early as September.
Fresh fall in metal prices also contributed to pair’s accelerating losses (AUDUSD was down 2.2% from Tuesday’s opening until early US session on Wednesday.
Bears eye targets at 0.6853 (200DMA) and 0.6833 (Mar 30 higher low), but may face headwinds, as daily studies are oversold.
Positioning for fresh push lower would be likely near-term scenario, with broken Fibo support at 0.6950 (38.2% of 0.6421/0.7277 rally) to cap upticks and keep larger bears intact.
Violation of 0.6833 pivot to generate initial signal of reversal and open way for deeper correction of larger 0.5914/0.7277 uptrend.
Res: 0.6950; 0.7000; 0.7056; 0.7075
Sup: 0.6853; 0.6833; 0.6800; 0.6756
Dollar Stays in Charge as Markets Await Micron and Test AI Bull Case
Dollar remained firmly in control of global markets today, extending its broad-based rally even as risk sentiment showed tentative signs of stabilization. US equity futures pointed to a modest rebound at the open following this week's sharp technology-led selloff, as investors appeared reluctant to make aggressive bets ahead of Micron's earnings report after the bell. The chipmaker has become one of the biggest beneficiaries of the AI investment boom, with its shares surging more than 260% this year as companies pour billions of dollars into AI infrastructure.
The cautious tone reflects a growing debate over whether the recent tech correction is merely a temporary bout of profit-taking or the start of a more significant reassessment of AI-related valuations. Some analysts argue that the long-term earnings story remains intact given the enormous scale of corporate spending on AI. Others point to emerging signs of fundamental pressure, including increasing price competition among AI model developers, falling rental prices for older-generation GPUs, and a broader industry shift toward lower-cost models. These developments do not necessarily undermine the long-term AI story, but they raise questions about whether the sector's most optimistic growth assumptions can continue to justify current valuations.
For now, markets appear unwilling to answer those questions ahead of fresh earnings guidance from one of the industry's key bellwethers. Even a strong Micron report may not guarantee a sustained recovery. It is not uncommon for markets to continue selling after positive earnings if investors are already focused on broader concerns about valuation, positioning, or the economic outlook. The violent selloffs seen across Asian technology stocks this week suggest sentiment remains fragile.
Another factor hanging over equities is the Federal Reserve. Markets appear to have largely absorbed the prospect of one additional rate hike this year following last week's FOMC meeting. The more difficult question is whether policymakers could ultimately deliver two. That risk has become increasingly important as inflation remains elevated and Fed officials continue emphasizing concerns about persistent services inflation. The uncertainty surrounding the policy outlook is making it harder for investors to justify paying premium valuations for growth stocks.
Meanwhile, Dollar continues to benefit from both safe-haven demand and expectations of tighter US monetary policy. The Dollar Index surged through the 38.2% retracement of the decline from 110.17 to 95.55 at 101.38 earlier this week, a development that strongly suggests the broader downtrend has already reversed. The breakout has shifted market focus from whether Dollar can rally further to how far the move can extend.
Two technical levels now stand out as particularly important confirmation signals. First, EUR/USD is approaching the 1.1300 area. A decisive break lower would reinforce the view that the pair is undergoing a medium-term bearish reversal after failing to sustain gains near the 1.2000 psychological level earlier this year. Second, Gold is threatening the key USD 4,000 psychological support zone. A decisive break there could trigger another wave of stop-loss selling and attract fresh momentum-driven shorts.
Taken together, these developments suggest that Dollar strength is becoming more deeply embedded across markets. Micron's earnings may determine whether technology stocks can stabilize in the near term. But the bigger story is whether Dollar's breakout can continue drawing confirmation from currencies, precious metals, and Fed expectations. So far, the answer appears to be yes. For the week, Dollar remains the strongest performer among major currencies, followed closely by Yen, while Kiwi and Aussie continue to sit at the bottom of the rankings.
RBNZ Hike Bets Collapse as NZD/USD Accelerates Toward Critical 0.5580 Support
Just weeks ago, markets were debating whether the RBNZ could raise rates as soon as July. Today, those bets have largely disappeared. Falling oil prices, weak domestic growth, and a stronger Dollar have combined to push NZD/USD toward a critical support zone that could determine the pair's direction for the rest of the year. Read More.
Dollar Index Breaks Key Fibonacci Barrier, Sets Stage for July's Bigger Battle
The Dollar's rally is not just a Fed story. A technology-led liquidation wave, quarter-end positioning, and growing expectations of further tightening are all pushing in the same direction. After breaking a key Fibonacci barrier, Dollar Index is heading toward what could be its most important test of 2026. Read More.
Germany's Ifo Business Climate Rises as Firms Hope for Geopolitical Relief
German companies are feeling better about the present, but they are not yet convinced about the future. June's Ifo survey showed improving business conditions and easing geopolitical concerns, yet weak orders and cautious expectations continue to hold back confidence. Read More.
Ueda Reinforces Hawkish BoJ Message, Says More Rate Hikes Likely
The key message from Kazuo Ueda was that policymakers still believe monetary conditions are accommodative even after last week's hike to 1%. That suggests the debate inside the BoJ is centered on the timing of future hikes rather than whether more tightening is needed. Read More.
BoJ Hawks Eye Path Toward 2% Neutral Rate, Summary Shows
The biggest surprise in the BoJ's June Summary of Opinions was not the support for last week's rate hike. It was the growing discussion about where rates should go next. Several policymakers argued that Japan's neutral rate may be closer to 2%, suggesting the debate has shifted from whether to tighten policy to how quickly to do it. Read More.
Australia CPI Misses Expectations at 4%, Yet Core Inflation Sends Hawkish Signal
Australia's inflation report delivered good news and bad news at the same time. Falling fuel prices pushed headline inflation lower than expected, but the RBA's preferred measure of underlying inflation accelerated. The result is a report that eases immediate inflation fears while keeping the August rate debate very much alive. Read More.
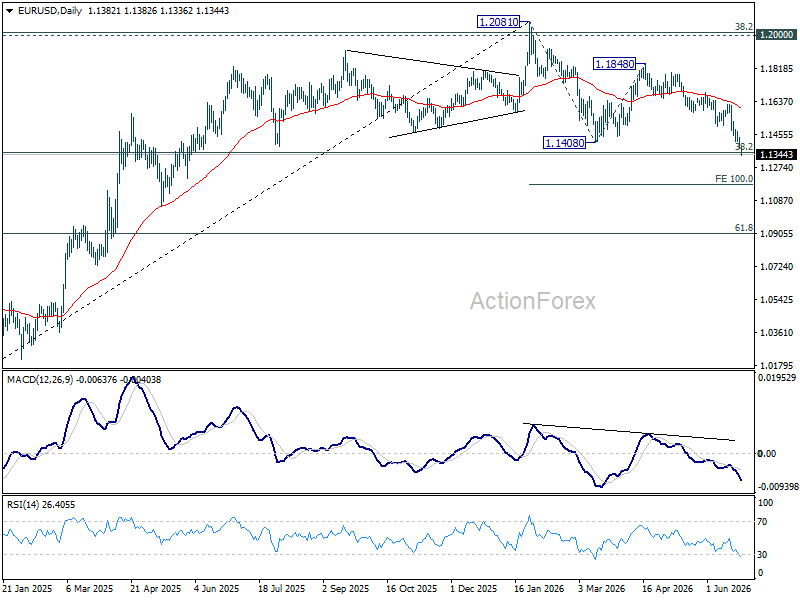
EUR/USD Daily Outlook
EUR/USD's decline continues today and intraday bias remains on the downside. Sustained break of 1.1353 fibonacci level will carry larger bearish implication. Next near term is 100% projection of 1.2081 to 1.1408 from 1.1848 at 1.1175. On the upside, above 1.1416 minor resistance will turn intraday bias neutral again first.
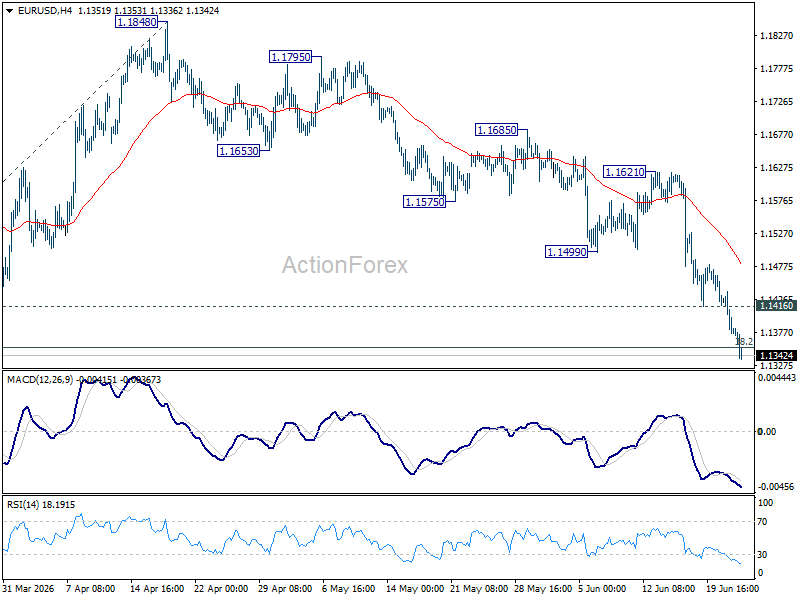
In the bigger picture, focus is back on 38.2% retracement of 1.0176 to 1.2081 at 1.1353. Decisive break there will revive the case of medium term bearish trend reversal after rejection by 1.2 key cluster resistance level. Further fall should be seen to 61.8% retracement at 1.0904. Nevertheless, strong rebound from 1.1353, followed by break of 1.1621 resistance, will retain medium term bullishness.
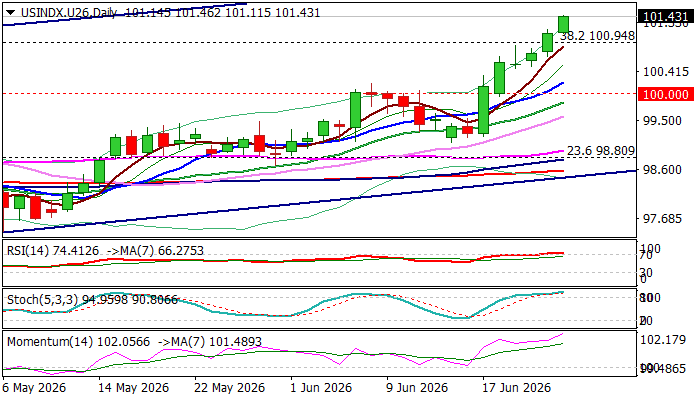
US Dollar Continues to Ride on the Wave of Optimism About Fed Rate Hike
The dollar continues to trend higher and hit highest levels in over one year on Wednesday, moving in a steep bull-leg that extends into sixth consecutive day.
Growing bets of Fed rate hike (currently at 72% for September rate hike vs 45% previous month), following recent hawkish remarks from US policymakers and economic data signaling that US economy remains strong, continue to underpin the dollar.
The price rises above psychological 100 level for the second straight week, with Tuesday’s break above 101 zone (Fibo 38.2% of 110.00/95.35 downtrend / round-figure), bringing in focus targets at 102.00 and 102.40/60 zone (bull-channel upper boundary / 50% retracement / 200WMA) and 102.91 (weekly cloud top).
Bulls continue to hold grip and so far do not react to overbought daily studies, though some corrective action should be anticipated in the near term.
Broken Fibo 38.2% (100.94) and former top (100.48) reverted to solid supports which should ideally contain potential dips.
Caution on extension below 100.00 pivot that would put bulls on hold and allow for deeper pullback.
Res: 101.80; 102.00; 102.40; 102.67
Sup: 100.94; 100.48; 100.21; 100.00
EUR/USD Daily Outlook
EUR/USD's decline continues today and intraday bias remains on the downside. Sustained break of 1.1353 fibonacci level will carry larger bearish implication. Next near term is 100% projection of 1.2081 to 1.1408 from 1.1848 at 1.1175. On the upside, above 1.1416 minor resistance will turn intraday bias neutral again first.
In the bigger picture, focus is back on 38.2% retracement of 1.0176 to 1.2081 at 1.1353. Decisive break there will revive the case of medium term bearish trend reversal after rejection by 1.2 key cluster resistance level. Further fall should be seen to 61.8% retracement at 1.0904. Nevertheless, strong rebound from 1.1353, followed by break of 1.1621 resistance, will retain medium term bullishness.
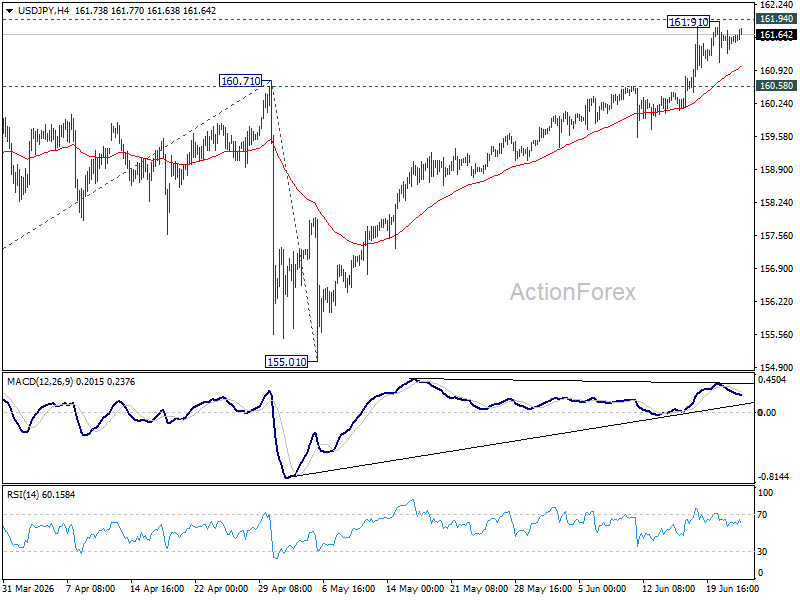
USD/JPY Daily Outlook
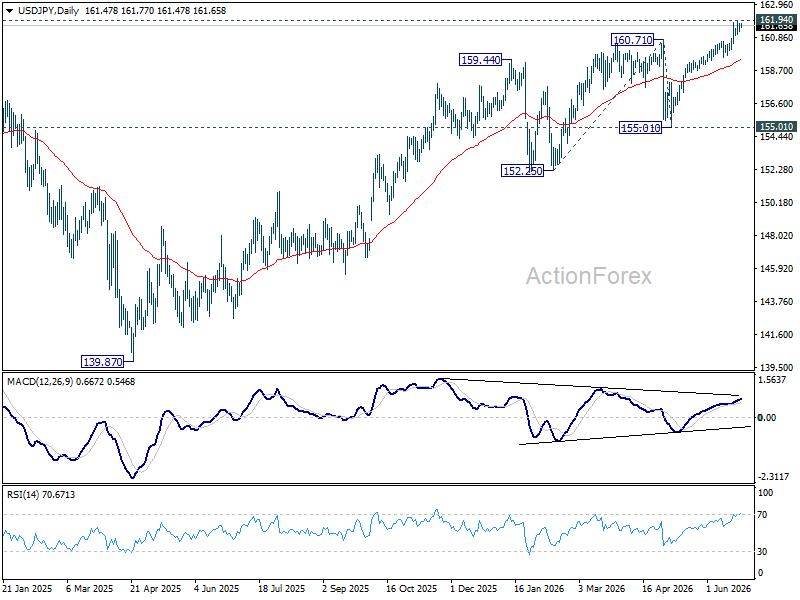
Intraday bias in USD/JPY is turned neutral with 4H MACD staying below signal line. On the downside, firm break of 160.58 support should confirm short term topping, on bearish divergence condition in 4H MACD. Deeper fall should then be seen to 55 D EMA (now at 159.46) and below. Nevertheless, decisive break of 161.94 high will resume the larger up trend to 100% projection of 152.25 to 160.71 from 155.01 at 163.47 next.
In the bigger picture, for now, corrective pattern from 161.94 (2024 high) is still seen as completed at 139.87. Rise from there is seen as resuming the long term up trend. This will remain the favored case as long as 55 W EMA (now at 155.17) holds.
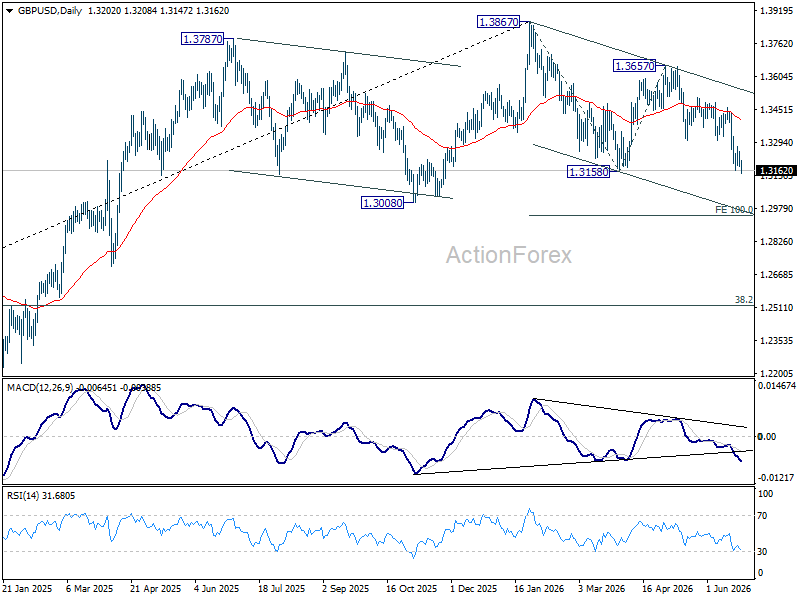
GBP/USD Daily Outlook
Intraday bias in GBP/USD is back on the downside with break of 1.3161 temporary low. Sustained trading below 1.3158 support will resume whole fall from 1.3867 to 100% projection of 1.3867 to 1.3158 from 1.3657 at 1.2948. On the upside, above 1.3272 resistance will turn intraday bias neutral again first.
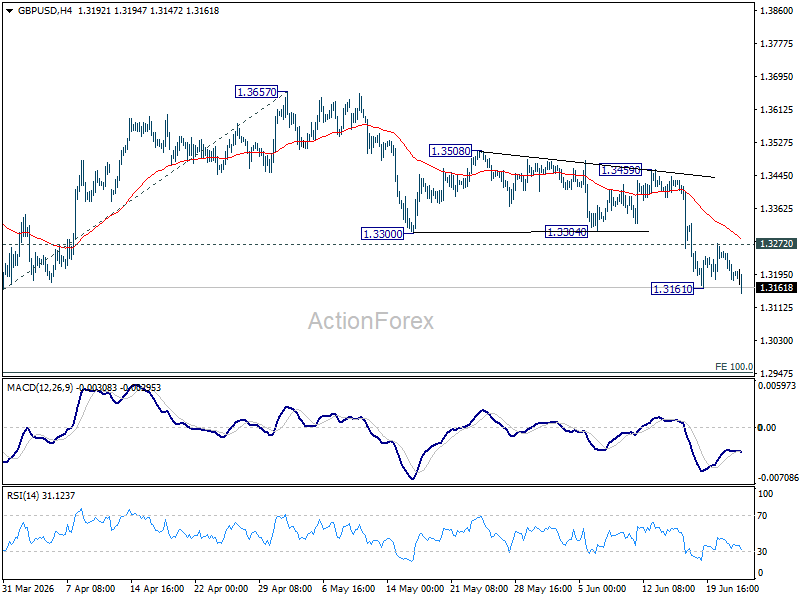
In the bigger picture, price actions from 1.3867 are a corrective pattern within the broader up trend from 1.0351 (2022 low). With 1.3008 support intact, medium term bullishness is maintained and break of 1.3867 is in favor for a later stage, towards 1.4248 key resistance (2021 high). However, firm break of 1.3008 will at least bring deeper fall to 38.2% retracement of 1.0351 to 1.3867 at 1.2524, with increased risk of bearish reversal.
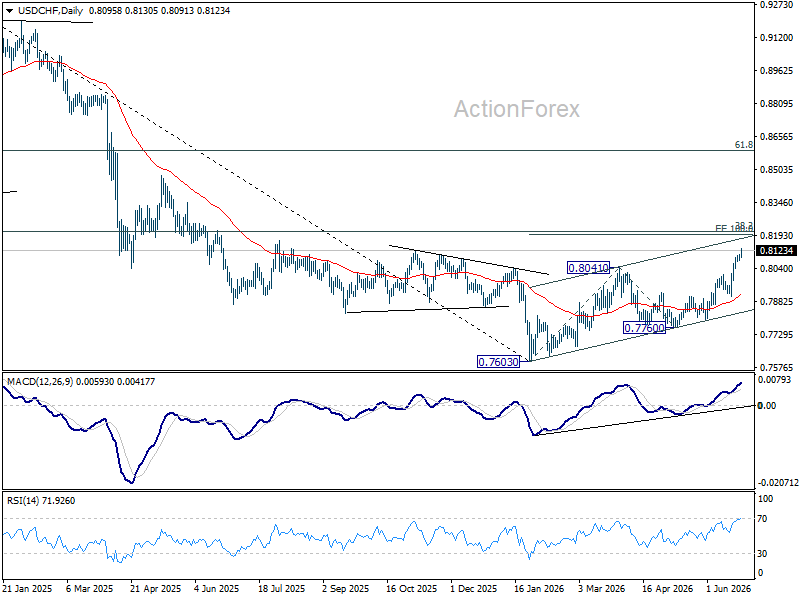
USD/CHF Daily Outlook
USD/CHF's rally continues today and intraday bias stays on the upside for 100% projection 0.7603 to 0.8041 from 0.7600 at 0.8198. On the downside, below 0.8074 minor support will turn intraday bias neutral and bring consolidations first before staging another rise.
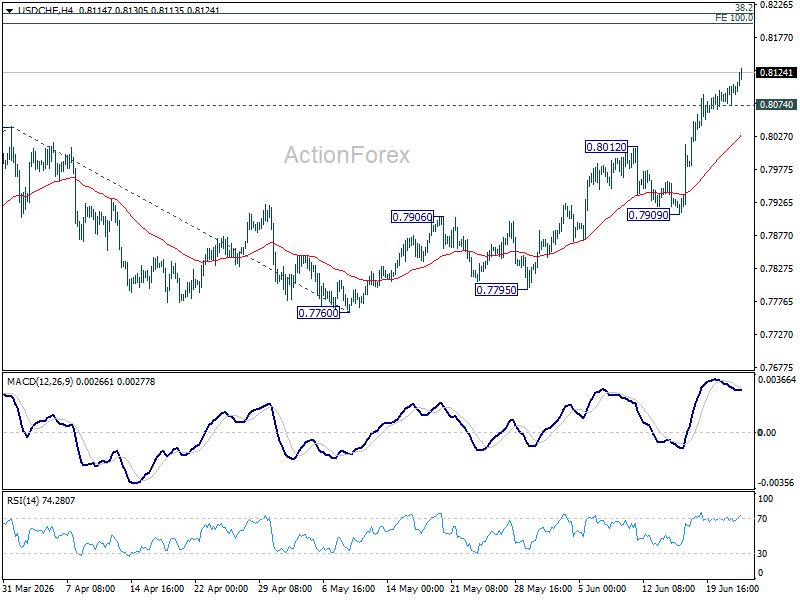
In the bigger picture, while a medium term bottom was formed at 0.7603, it's still early to call for bullish trend reversal. As long as 38.2% retracement of 0.9200 (2025 high) to 0.7603 at 0.8213 holds, the larger down trend could still continue through 0.7603 at a later stage. However, firm break of 0.7603 will argue that the trend has reversed and turn focus to 0.8332 support turned resistance (2023 low) for confirmation.
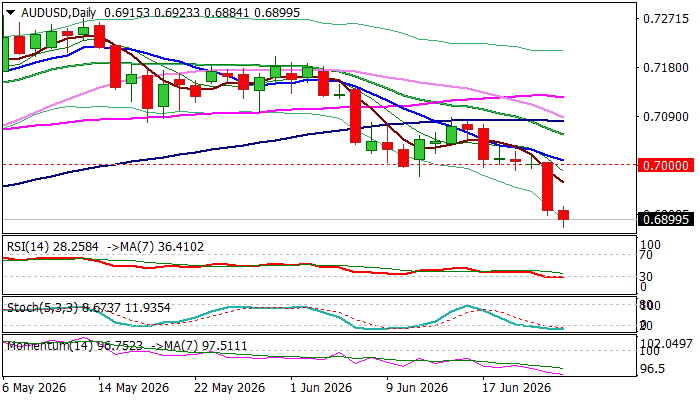
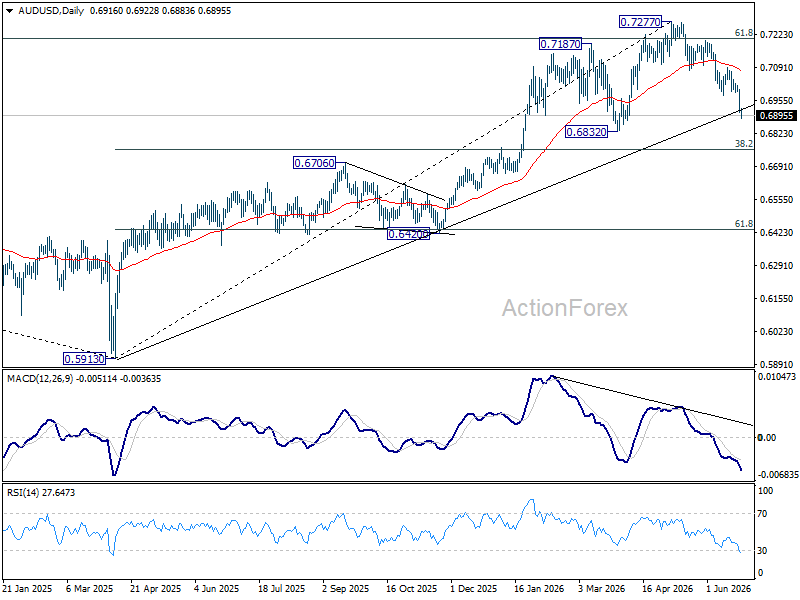
AUD/USD Daily Report
AUD/USD's fall continues today and intraday bias remains on the downside. Decline from 0.7277 should target 0.6832 support first. Firm break there will target 0.6756 fibonacci level. On the upside, above 0.6977 support turned resistance will turn intraday bias neutral again first.
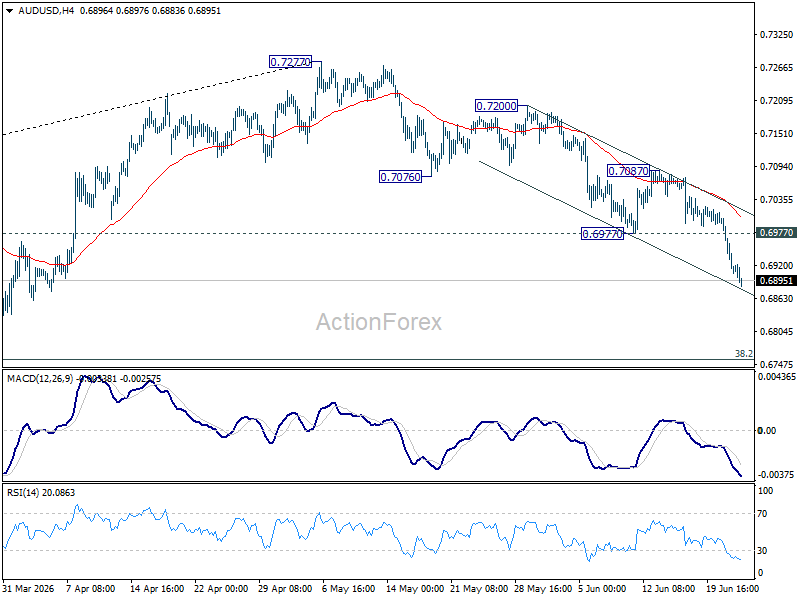
In the bigger picture, considering bearish divergence condition in D MACD, a medium term top could be formed at 0.7277 after failing to sustain above 61.8% retracement of 0.8006 (2021 high) to 0.5913 (2024 low) at 0.7206. Deeper fall could be seen to 38.2% retracement of 0.5913 to 0.7277 at 0.6756 as a correction. But strong support should be seen there to bring rebound. Consolidations would continue below 0.7277 for a while.
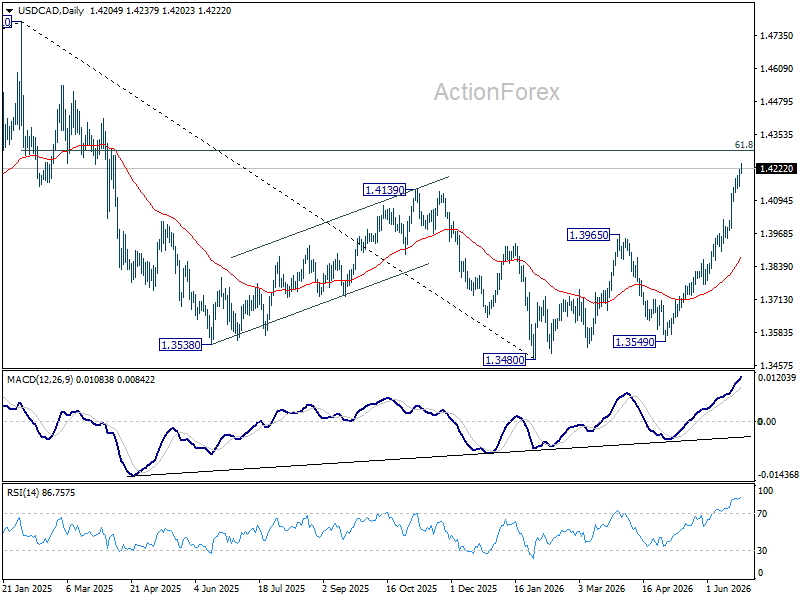
USD/CAD Daily Outlook
USD/CAD's rally continues today and intraday bias stays on the upside. Current rise from 1.3480 should target 61.8% retracement of 1.4791 to 1.3480 at 1.4290. Sustained break there will pave the way to 1.4791 high. On the downside, below 1.4140 minor support will turn intraday bias neutral and bring consolidations first, before staging another rally.
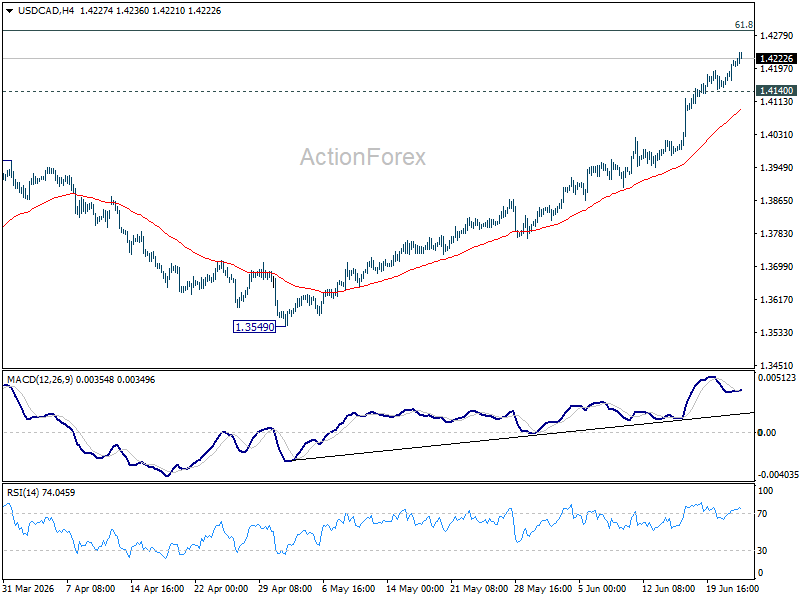
In the bigger picture, current development suggests that fall from 1.4791 has completed as a three wave correction to 1.3480. It's still early to judge if rise from there a corrective bounce, or resumption of the larger up trend from 1.2005 (2021 low). But in either case, retest of 1.4791 high should be seen next.
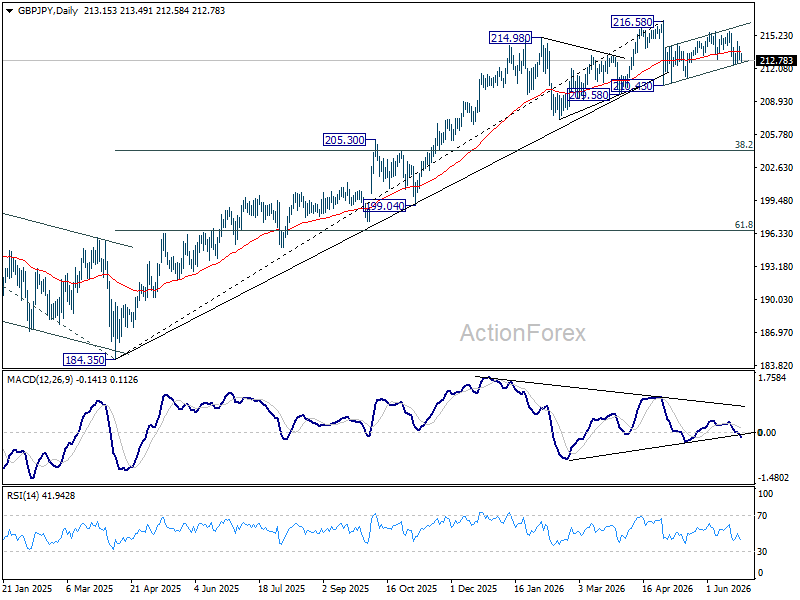
GBP/JPY Daily Outlook
Intraday bias in GBP/JPY remains neutral for the moment. On the downside, below 212.36 will affirm the case that rebound form 210.43 has completed as a correction. Deeper fall would be seen to 211.23 support first. However, break of 215.59 will resume the rebound from 210.43 to retest 216.58.
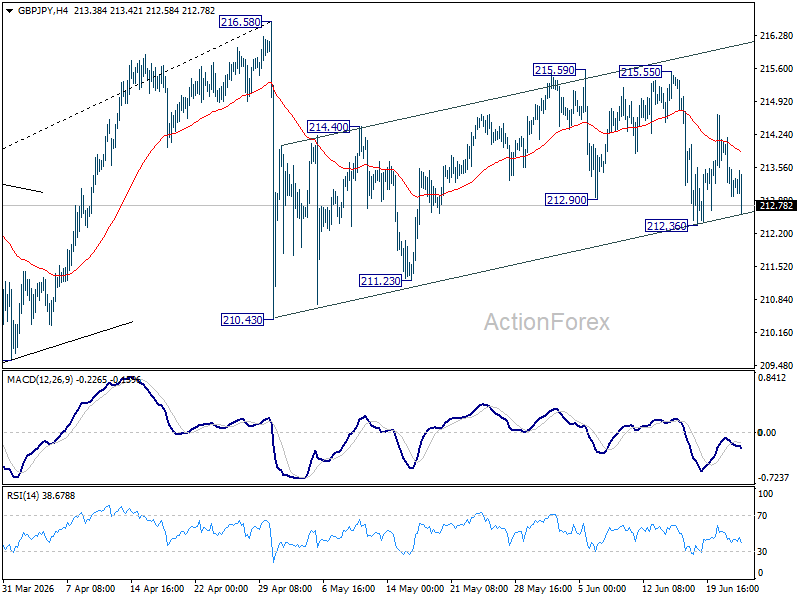
In the bigger picture, there is no clear sign of trend reversal yet. The long term up trend could still extend to 61.8% projection of 148.93 (2022 low) to 208.09 (2024 high) from 184.35 at 220.90 on resumption. However, sustained break of 55 W EMA (now at 207.11) will argue that it's already in medium term down trend for 184.35 support.