
Sample Category Title
Pound at Key Levels: Markets Assess Impact of Political Uncertainty in the UK
The British pound remains under pressure following increased political uncertainty in the United Kingdom triggered by the Prime Minister’s resignation. Investors are assessing potential shifts in the political and economic policy outlook after the head of government stepped down, including implications for fiscal spending, taxation policy, and economic support measures. The uncertainty surrounding the future direction of domestic politics is weighing on demand for sterling and prompting a more cautious stance among market participants.
Today’s focus will be preliminary UK PMI data. Forecasts suggest the services PMI may rise to 50.0 from 49.3, while the composite PMI is expected to increase to 50.6 from 49.7. The manufacturing PMI is projected at 53.5, slightly down from 53.9. If the data confirms signs of economic stabilisation, the pound could see short-term support after recent declines and partially offset pressure from political uncertainty.
GBP/USD
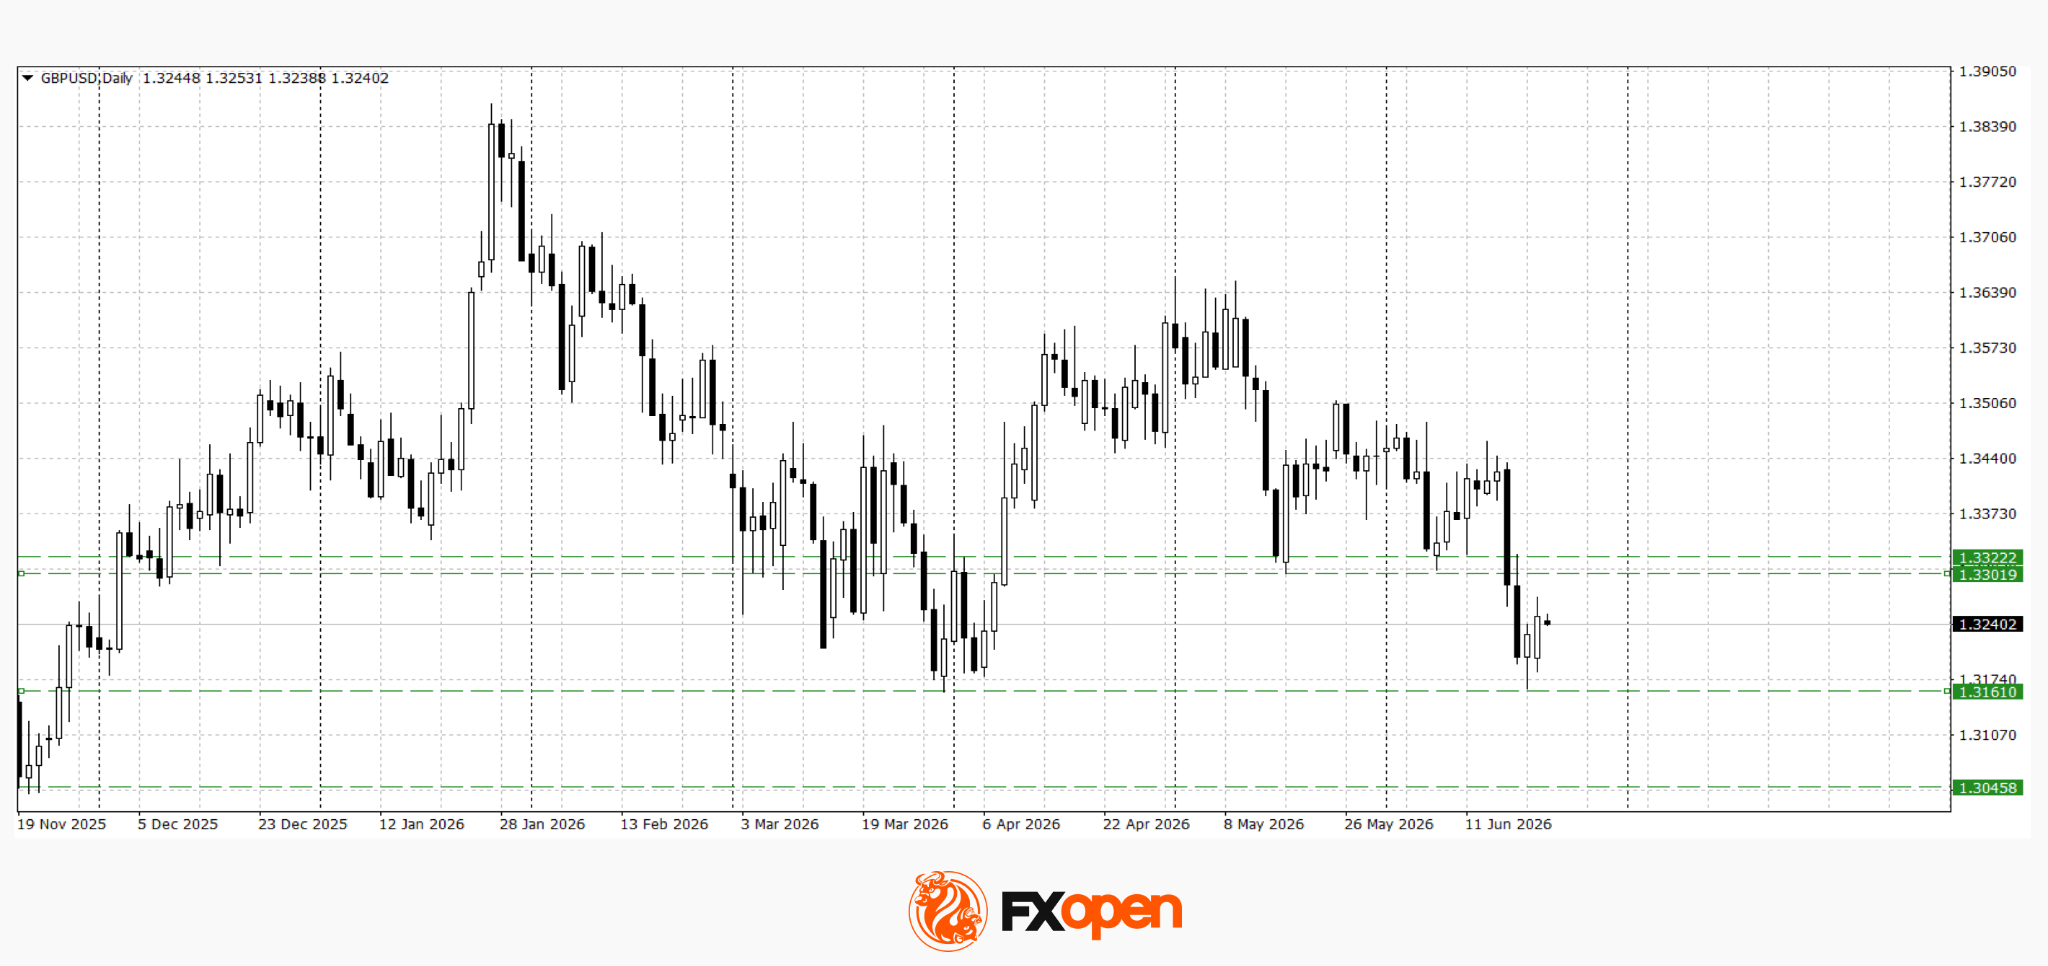
Last week, following meetings of the Federal Reserve and the Bank of England, GBP/USD broke key support at 1.3300. The pair also tested this year’s low at 1.3160. It is currently consolidating in the 1.3200–1.3240 range. Technical analysis suggests a potential rebound towards the recent support level at 1.3300. A move back above this level would be the first signal of easing downside pressure. However, weak UK macroeconomic data could trigger another test of 1.3160.
Key events for GBP/USD:
- Today at 11:30 (GMT+3): UK services PMI
- Today at 11:30 (GMT+3): UK composite PMI
- Today at 11:55 (GMT+3): speech by Sarah Breeden, Bank of England Financial Policy Committee member
GBP/CAD
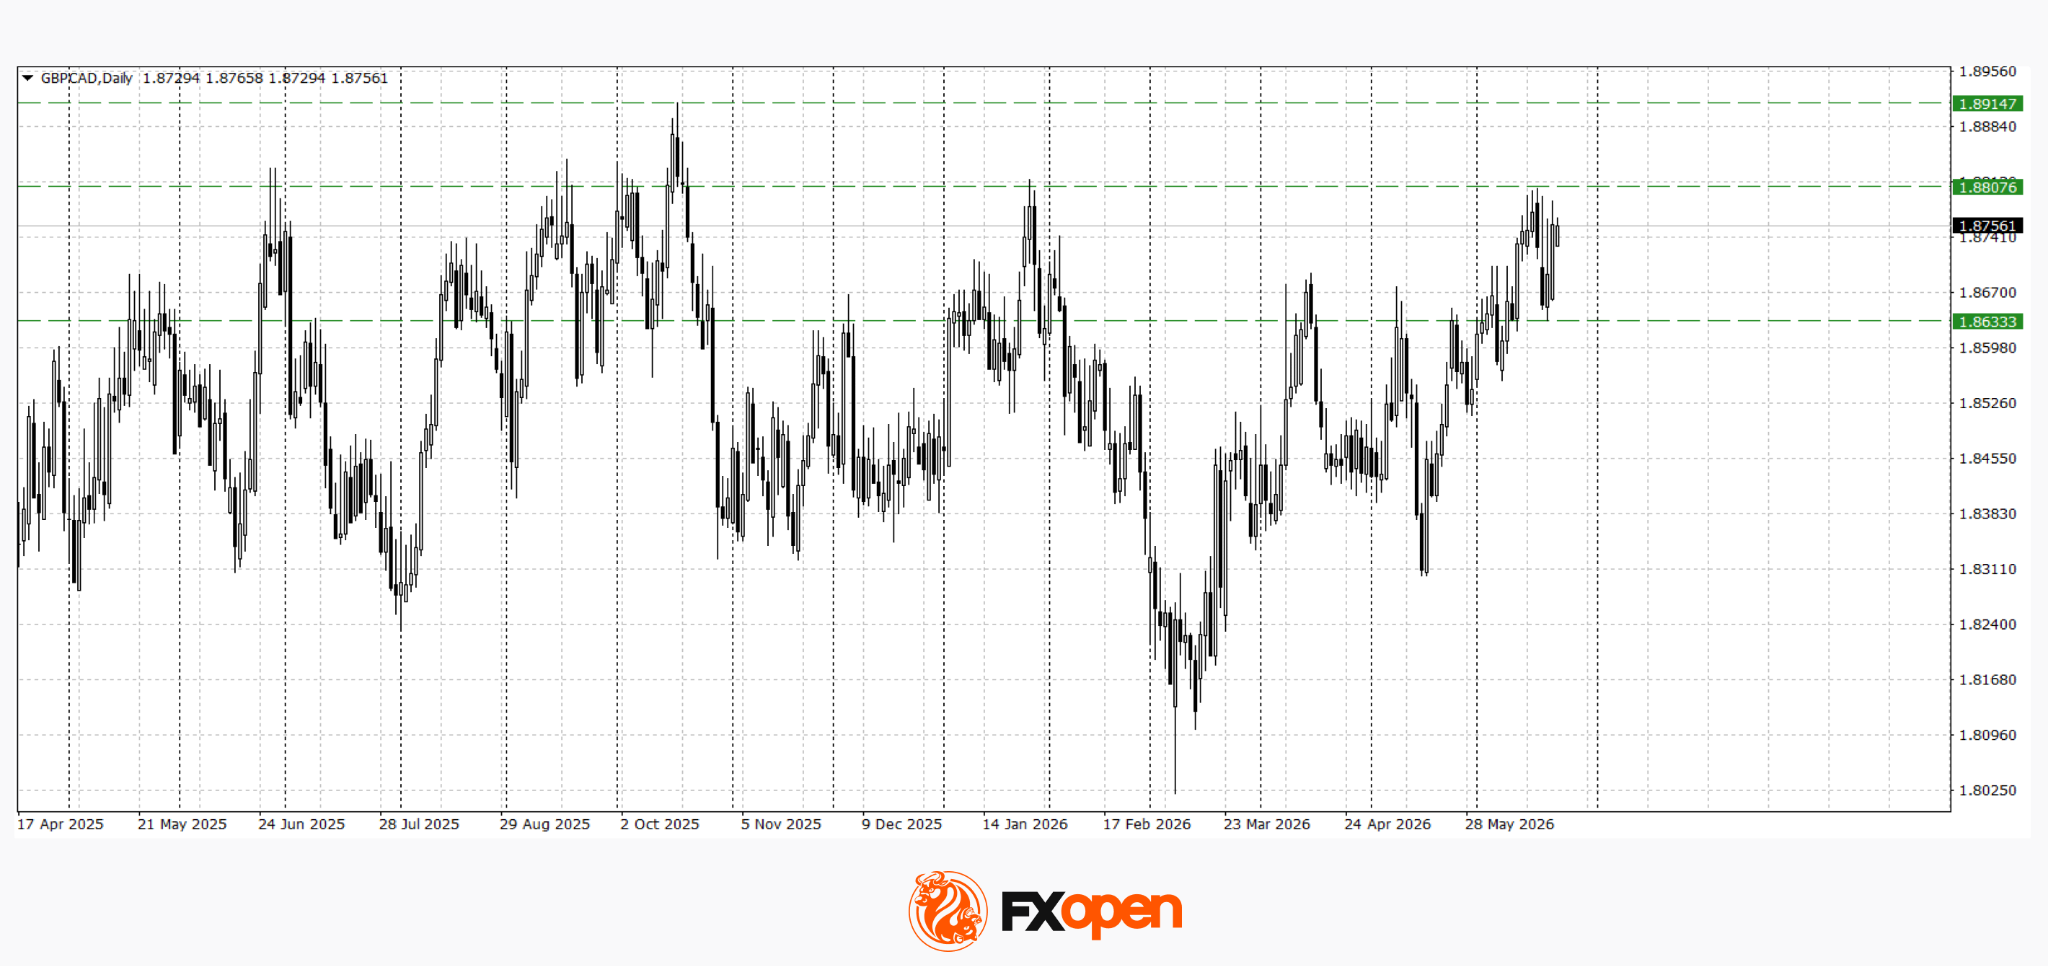
Despite pressure on sterling following the Prime Minister’s resignation, weakness in the Canadian dollar has allowed GBP/CAD to hold up better than other sterling crosses. The pair retreated from this year’s high at 1.8800 but quickly found support at 1.8630. A retest of recent highs is possible. A firm break above 1.8800 could extend gains towards 1.8900–1.8920.
Key events for GBP/CAD:
- Today at 16:00 (GMT+3): speech by Bank of Canada Governor Macklem
- Today at 20:30 (GMT+3): speech by Bank of England MPC member Swati Dhingra
- Tomorrow at 14:15 (GMT+3): speech by Bank of Canada Deputy Governor Rogers
Overall, both pairs remain influenced by multiple factors: domestic political uncertainty in the UK, the impact of recent Bank of England and Federal Reserve decisions, and expectations ahead of key macroeconomic data releases. Today’s PMI figures will help determine whether the current consolidation resolves into a sterling recovery or continued downside pressure.
Trade over 50 forex markets 24 hours a day with FXOpen. Take advantage of low commissions, deep liquidity, and spreads from 0.0 pips (additional fees may apply). Open your FXOpen account now or learn more about trading forex with FXOpen.
This article represents the opinion of the Companies operating under the FXOpen brand only. It is not to be construed as an offer, solicitation, or recommendation with respect to products and services provided by the Companies operating under the FXOpen brand, nor is it to be considered financial advice.
Silver: Fed Tightens Its Tone as Price Returns to the Volume Profile Zone
Silver came under pressure following the Federal Reserve’s June meeting, at which policymakers kept interest rates unchanged at 3.50–3.75%. Nine of the 18 committee members still see the possibility of a rate increase this year, reinforcing expectations of further monetary tightening. The prospect of rising real yields reduces the appeal of non-interest-bearing assets such as precious metals. An additional restraining factor is geopolitical uncertainty: the Fed noted that inflation remains elevated relative to its 2% target, partly due to supply-side price shocks in the energy sector stemming from the conflict in the Middle East.
Technical Picture
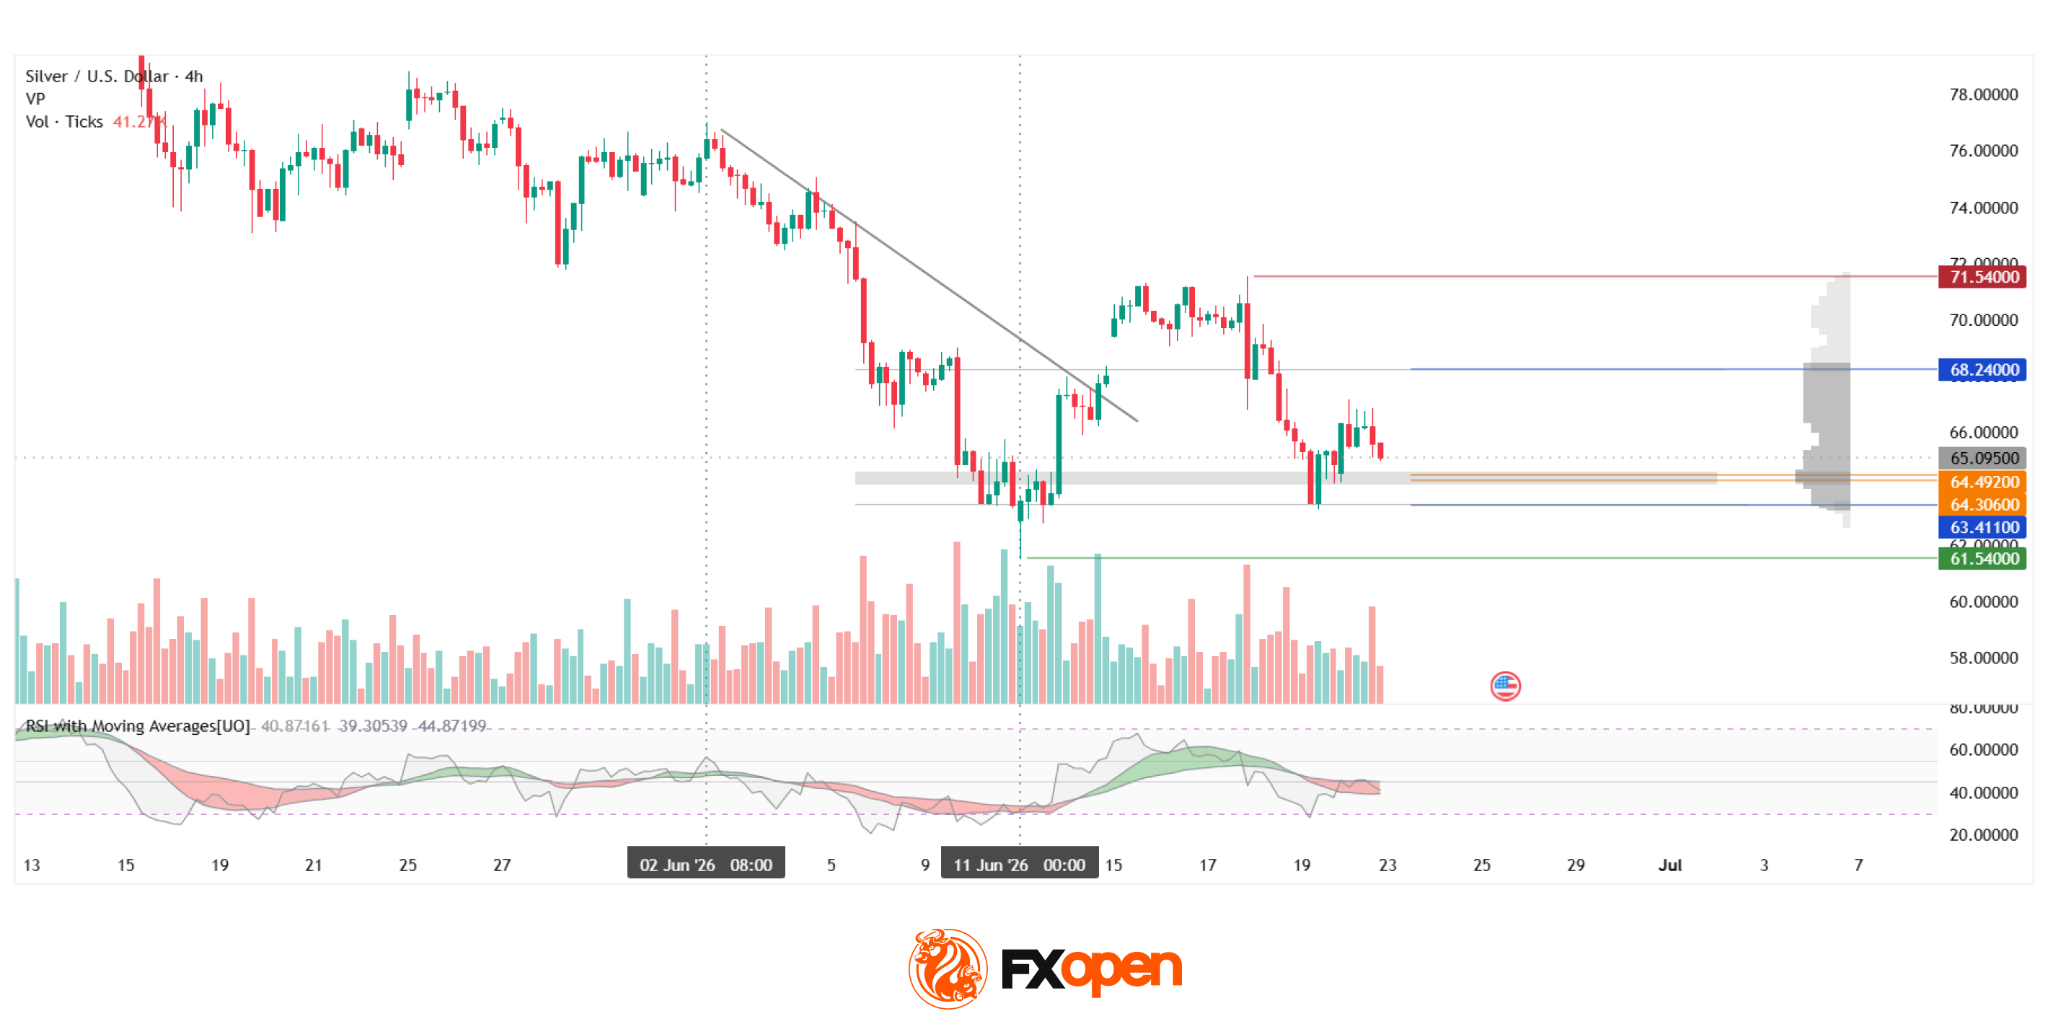
On the four-hour chart of XAGUSD, a bearish trend structure can be identified. Following an attempted breakout and a gap on 15 June, the price encountered resistance near $71.54, after which it declined into the current volume profile area.
The upper boundary of the profile at $68.24 was eventually breached following an initial reaction to the level. The price is currently testing the control zone at $64.306–$64.492 from above, an area that coincides with the consolidation range formed near the end of the previous downward move.
The lower boundary of the profile at $63.411 adds further significance to the POC area, as it lies in close proximity. Below this cluster sits support at $61.54, which could act as an obstacle should the price break lower out of the profile. Current vertical volume readings remain moderate and do not indicate clear dominance by either side of the market. RSI + MAs: 41, 39, 44 — the indicator readings remain below the neutrality zone, while its moving averages are coloured red but continue to move sideways.
Key Takeaways
The technical profile remains cautious: RSI is below the neutrality zone, while trading volume remains moderate and does not yet support a directional move. Federal Reserve rhetoric may prove to be the key driver in the short term. Any softening in the central bank’s tone regarding the future path of interest rates could alter the balance of power around current price levels.
Start trading commodity CFDs with tight spreads (additional fees may apply). Open your trading account now or learn more about trading commodity CFDs with FXOpen.
This article represents the opinion of the Companies operating under the FXOpen brand only. It is not to be construed as an offer, solicitation, or recommendation with respect to products and services provided by the Companies operating under the FXOpen brand, nor is it to be considered financial advice.
Sunrise Market Commentary
Markets
US bonds and stocks came out weakened from their long weekend. Treasury yields added 4.8-5.6 bps across the curve, catching up with Friday's spring in European yields. The new Fed under chair Warsh probably still lingered in the minds as well. Fed's Goolsbee played straight into Warsh' message. He said it's critical to determine whether temporary shocks such as energy and/or tariffs are the only elements pushing up inflation. Goolsbee is worried about the rise in services prices, which isn't related to these shocks and can often be more persistent. Wall Street rotated from tech into value and small caps. The Nasdaq shed 1.3% while the Dow Jones Index added 0.3%. Russell 2000 topped the 3k mark for the first time ever. European rates lost 3-4.5 bps. ECB chair Lagarde's appearance before European parliament helped the bull steepening which lower oil prices initiated at the start of European dealings. She sees no need for a more forceful response to the Iran war. It turned into media headlines but is in essence the exact messaging from the latest policy meeting. The "forceful response" Lagarde refers to is the monetary policy action required when "inflation to deviate significantly and persistently from target". It's the third, most extreme case Lagarde outlined during her ECB and its Watchers Conference in March and which broadly aligns with the severe scenario. The euro area economy right now sits somewhere between the milder and baseline scenario. In the milder one, headline CPI would fall short of the 2% target in 2027 and 2028 but core inflation would remain above 2% across the horizon. It is conditioned on no additional hikes. The baseline assumes three hikes in total and sees inflation at 3%-2.3%-2% and 2.5%-2.5%-2% for headline and core inflation respectively in 2026-2028. Brent oil prices fell below the 200dMA for a first <$78 per barrel close for the first time since the conflict. Sterling outperformed. EUR/GBP declined from 0.8694 to 0.8626, closing in on (strong) support just north of 0.86. We view the move as a kneejerk relief rally following PM Starmer's resignation. It seems likely that this won't trigger a protracted leadership challenge with support for Burnham strong to take over the baton. The proof of the pudding will be in the eating however. The November budget is going to be the litmus test. The US dollar held the upper hand in most other currency pairs. EUR/USD inched lower to 1.1429 with a test of key support at 1.1392 growing ever more likely. USD/JPY rose to an intraday high of 161.93, just shy of the 161.95 multidecade peak of July 2024. The pair is currently changing hands around 161.6, prompting ongoing speculation if or when Japanese officials will intervene.
June PMI's feature the economic calendar today. Japan kicked off with the Euro area, UK and US following. The May European edition began to show the economic impact of the war as frontloaded purchases/stock buying petered out while strong price pressures weighed on the services sector. The survey owner flagged 4% CPI in coming months. This compares to the >3% ECB chief economist Lane, who appears for the European parliament today, expects for the rest of the year. The June series should capture some but probably limited impact of the deal between the US and Iran. A $69bn 2-year US auction serves as a market appetite gauge for short-term bonds in a new Fed era.
News & Views
New EU car registrations increased by 4% YtD in May 2026 (+3.2% Y/Y), indicating a strong start to the year amid a backdrop of persistent geopolitical headwinds weighing on the outlook. In the first five months of 2026, 950k new battery-electric cars (BEV's) were registered, capturing 20% of the EU market (vs 15.3% YtD in May 2025). New EU hybrid-electric car (HEV's) registrations rose to 1795k, accounting for 37.8% of the total EU market (vs 35.1%). The combined share of new petrol and diesel cars declined from 38% YtD in May 2025 to 30% this year. New Belgian EU car registrations amounted to 185k YtD (down 4.1% vs same period of last year). Only new BEV registrations (+2.8% to 66k) were up. They account for 35.6% of the total market, with petrol still the dominant choice (43.3% Ytd vs 42.2% last year).
Hungarian parliament is expected to pass anti-corruption measures today. They are part of Hungarian PM Magyar's reforms targeted at re-aligning with Europe and unlocking frozen funds. Last month, the EU said that €16bn was coming Budapest's way if new legislation stays on track. A possible first disbursement could be made before year-end. Today's vote is on topics like expanding legal powers of the anti-graft watchdog (Integrity Authority) and reforming state-run media. Also today, the Hungarian central bank meets with markets widely anticipating a 25 bps rate cut from 6.25%.
Big Day of PMIs Ahead
In focus today
In the euro area, June flash PMIs are released. Most respondents will likely have answered after the US-Iran deal, yet the impact of lower oil prices is unlikely to already show up in activity data. We expect manufacturing to edge down to 50.9 (May: 51.6), while we expect services to see a modest improvement to 48.8 (May: 47.7), though still below 50 indicating contraction. The improvement in services is expected to be partially driven by French data correcting from particularly low levels.
June flash PMIs are also released in the UK. PMIs have generally held up well in recent months, but services slowed significantly in May, dropping to 49.3 from 52.7 in April. It will be interesting to see whether this slowdown in services continues.
In the US, manufacturing and services June flash PMIs are expected to remain above the 50 level, suggesting that the US economy continues to hold up well. Markets expect manufacturing to edge down slightly to 54.6 (May: 55.1), while services are expected to tick up to 51.0 (May: 50.7).
In Denmark, the June business sentiment indicator is released. May's reading saw a slight decline to 104.1 from 105.5, still above the historical average of 100. The indicator pointed to moderate growth, and companies continue to expect net hiring in the coming months, suggesting no clear signs of an energy crisis in the latest data.
The National Bank of Hungary is expected to cut rates by 25bp to 6.00%, following signals of easing at its last meeting.
Economic and market news
What happened overnight
In Japan, June flash PMIs came in with manufacturing rising to 54.9 (May: 54.5) and services rebounding to 51.8 (May: 50.0). New orders accelerated to their fastest pace in more than four years, partly driven by stock-building amid war-related supply and price concerns. Input and output prices eased slightly but remain near their highest levels since late 2022, driven by continued elevated energy, fuel and raw material costs.
What happened yesterday
In the UK, Prime Minister Keir Starmer announced his resignation. Nominations for his replacement open on 9 July, with a new leader expected to be in place before parliament returns in September, making it the seventh prime minister in a decade. Andy Burnham is the clear frontrunner to take over after his decisive by-election victory last Friday, with his succession looking near certain after his main rival, Wes Streeting, confirmed he would not contest the leadership. Should Burnham succeed, the key market focus will shift to who takes over as Chancellor of the Exchequer, the UK's finance minister. Current chancellor Rachel Reeves has been favoured by markets for her commitment to fiscal rules, and previous speculation around her departure triggered a significant rise in UK yields. Sterling and gilts were little moved on the news of Starmer's resignation, which markets had widely anticipated.
Euro area consumer confidence rose broadly as expected to -17.7 in June (cons: -18.0, prior: -19.0), though it remains well below pre-war levels and the historical average. The survey period ran from 1 to 19 June, meaning the US-Iran deal and subsequent drop in oil prices are likely not fully reflected. While weak confidence is expected to continue weighing on spending growth, the relationship between how consumers feel and how they act has been less reliable in recent years.
In Denmark, consumer confidence for June rose sharply to -14.0 (May: -19.8). The improvement was primarily driven by a more positive view of Denmark's current and future economic situation, as well as improved expectations for household finances. Inflation expectations also fell markedly for the second consecutive month, likely reflecting a significant drop in food prices of 1.3% m/m in May. Despite the recovery, consumer confidence remains low, with households continuing to save a large share of their income rather than increase spending.
Equities: Global equities rose yesterday, but the headline masked an extreme dispersion beneath the surface. The US was dragged lower by what many would instinctively call Big Tech, but the real pressure came from consumer-facing sectors and, not least, communication services, including media. The heavy media names did much of the damage. To put yesterday's US session in perspective, eight of the 11 S&P 500 sectors closed higher and small caps outperformed, illustrating just how sector-specific the rotation was.
Sentiment was also hit by the sharp fall in SpaceX, where it is remarkable to see a company of that size display this degree of volatility so early in its listed life. With SpaceX soon to enter Nasdaq indices under the new fast-entry rules, this will inevitably raise questions about index inclusion mechanics.
This morning, Asia is broadly lower, again led by what can be described as Big Tech. South Korea is down slightly more than 7% at the time of writing, which is obviously a violent move, but it must be seen in the context of the very strong prior rally and the extreme volatility in the large Korean tech names.
Looking back to Europe and the US, futures are lower, with US tech again doing most of the damage this morning.
FI and FX: EUR/USD traded on a heavy note to start the week as the spread between USD and EUR interest rates continued to push higher. Expectations in the market about a possible rate hike in the US continues to build after new Fed chair Kevin Warsh's first FOMC meeting last week, while the market further scaled back on the prospect of another ECB hike the coming months after comments from President Lagarde. USD/JPY briefly rose to 161.9 yesterday and topped the high from Friday. The broad USD appreciation and rise in US Treasury yields exert upwards pressure on the pair, which seems to have settled above the 161 level now. We expect it to trade around this level near-term. In rates space, US yields played catch-up during yesterday's session rising roughly 5bp across the curve while European yields moved lower by a similar magnitude.
US Stock Futures and Asia Pacific Equities Wobbled on a Firmer US Dollar
Key takeaways
- The unwinding of the Middle East risk premium continues to pressure energy markets. The US-Iran 60-day implementation roadmap and temporary authorisation of Iranian crude exports have accelerated the liquidation of long oil positions, pushing WTI and Brent crude toward multi-month lows despite ongoing diplomatic uncertainty.
- AI infrastructure spending remains a key pillar of market leadership. The strategic partnership between Micron and Anthropic reinforced the view that semiconductor and memory demand remains structurally strong, helping the SOX Index reach fresh record highs even as broader equity markets struggled for direction.
- A stronger US dollar and rising short-term Treasury yields are becoming the dominant macro headwind. The rise in the 2-year Treasury yield to its highest level since early 2025, coupled with persistent dollar strength, has weighed on Asia-Pacific equities and kept pressure on regional currencies, particularly the Japanese yen.
- Chart of the day: The S&P 500 is showing near-term weakness, trading below the key short-term resistance at 7,557 and back below the 20-day moving average.
Chart of the day - S&P 500 near-term weakness prevails below 20-day MA
Fig. 1: US S&P 500 CFD minor trend as of 23 Jun 2026 (Source: TradingView). The information presented is historical information, and past performance is not indicative of future performance.
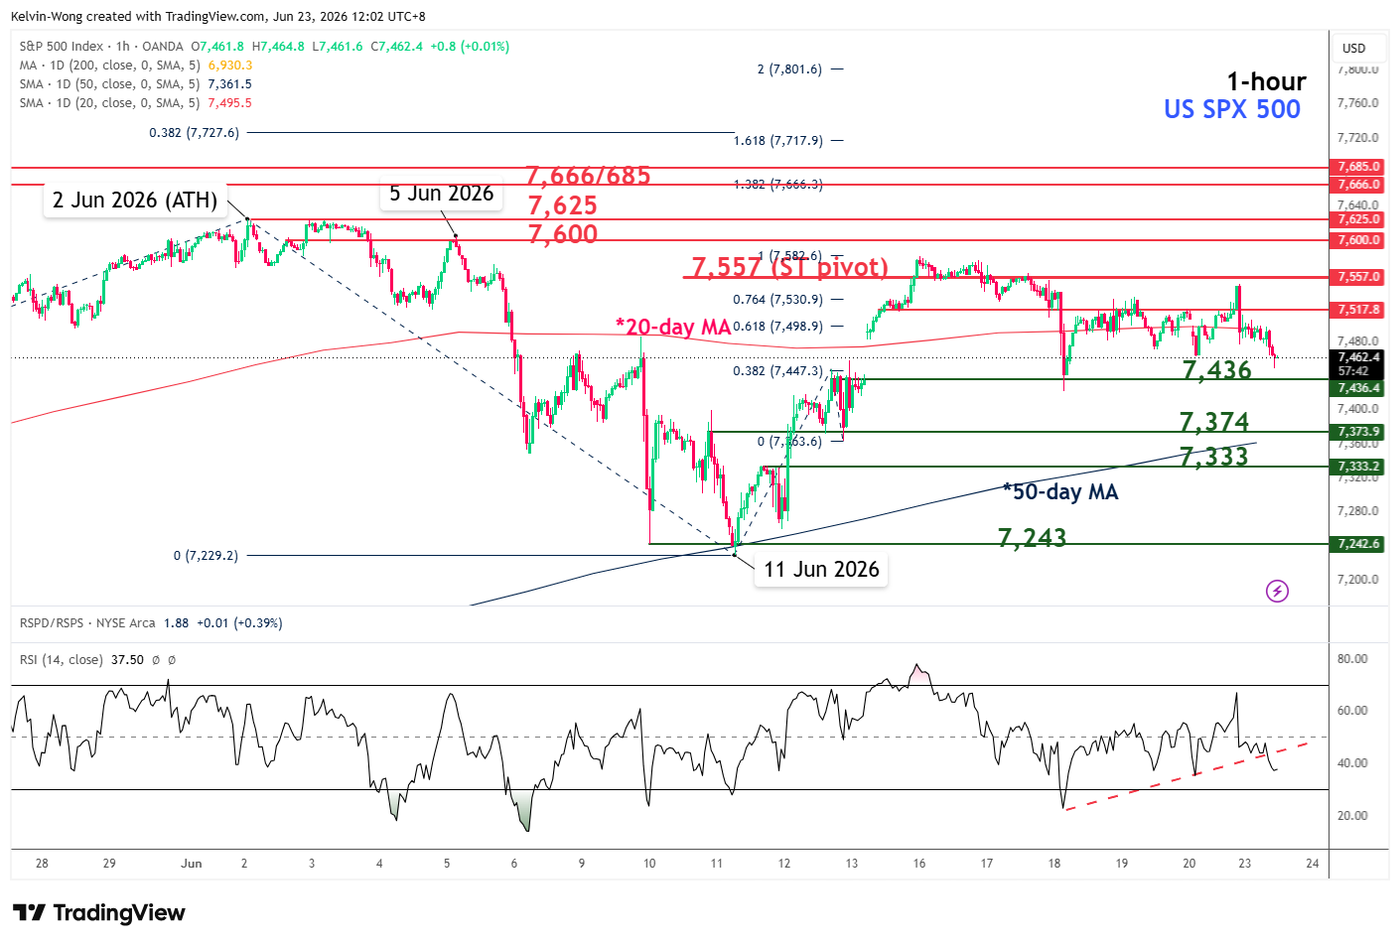
Since the ex-post FOMC sell-off last Wednesday, 17 June 2026, the price action of the US S&P 500 CFD (a proxy for the S&P 500 E-mini futures) has remained lethargic, having re-entered a range below its 20-day moving average (see Fig. 1).
In addition, the hourly RSI momentum indicator has broken below its ascending support, which suggests a revival of short-term bearish momentum.
Watch the 7,557 key short-term pivotal resistance to maintain a near-term bearish bias, and a break below 7,436 exposes the next intermediate support at 7,374 (also the 50-day moving average) in the first step.
However, a clearance with an hourly close above 7,557 invalidates the bearish tone for a squeeze up to retest 7,600 and even the current all-time high of 7,625.
Top macro headlines
- US-Iran 60-Day peace roadmap triggers aggressive crude oil sell-off: Front-month WTI and Brent crude futures plunged toward $74.08 and $78.15 per barrel, while still trading above their respective 200-day moving averages as details of the diplomatic breakthrough emerged from Switzerland. Mediated by Qatar and Pakistan, the US and Iran have established an explicit 60-day implementation roadmap. The US Treasury’s subsequent temporary authorisation for the sale and transport of Iranian petroleum has alleviated immediate fears of a structural blockade in the Strait of Hormuz, thereby reducing geopolitical risk premiums.
- AI infrastructure land grab intensifies with Micron-Anthropic alliance: Several US semiconductor shares caught a strong bid following the announcement of a multi-billion-dollar strategic hardware and capital agreement between Micron Technology and AI pioneer Anthropic. Micron will guarantee priority supply of next-generation high-bandwidth memory (HBM) to anchor Anthropic’s accelerating data centre expansions, while concurrently participating in a major Series H funding round, reinforcing intense institutional demand for physical-layer AI infrastructure.
- SpaceX shares retreat following blockbuster IPO mania and notes offering: One week after completing the largest IPO in history, shares of Elon Musk’s newly listed Space Exploration Technologies Corp. slid 3.9% to close at $154.60, breaking below its debut closing level of $160.95. The stock recorded its third consecutive daily loss as the rockets-to-AI giant announced plans for a new senior unsecured notes offering to support capital expenditures, following its final $85.7 billion IPO.
- Sovereign bond yields advance ahead of massive short-duration supply: Fixed income markets faced renewed selling pressure as global benchmark yields ticked higher. The US 2-year note auction forced short-duration yields higher as primary dealers braced for heavy supply absorption. The 2-year US Treasury yield jumped by 5 bps to close Monday’s session at 4.23%, its highest level since mid-February 2025.
Key macro themes
- Geopolitical de-escalation and energy supply shocks’ pricing: The global commodity market is undergoing a swift adjustment as the US-Iran 60-day roadmap shifts from theoretical diplomacy to actual implementation. By explicitly authorising the near-term delivery and sale of Iranian crude, the US Treasury has effectively eliminated the risk of an extended shipping blockade in the Persian Gulf. This rapid normalisation of maritime traffic through the Strait of Hormuz is prompting systematic macro funds to liquidate long energy hedges, overriding localised supply constraints and fundamentally lowering the baseline for global input cost inflation.
- The secular insulation of AI capital expenditure: Despite broader macroeconomic uncertainty and elevated global borrowing costs, the physical layer of the artificial intelligence ecosystem remains highly insulated from cyclical contraction. The strategic alliance between Micron and Anthropic underscores an ongoing “land grab” for specialised silicon and high-bandwidth memory. Because tier-one AI developers are prioritising infrastructure security over near-term capital conservation, corporate expenditure in the semiconductor supply chain is acting as a primary structural backstop for equity markets, decoupling tech benchmarks from underlying fixed-income volatility.
- Post-IPO valuation rebalancing of trillion-dollar mega-caps: The post-listing turbulence in SpaceX highlights the complex fundamental math facing newly public mega-caps. While retail and options mania propelled the combined rocket-and-AI entity past a $2.2 trillion valuation last week, its high capital expenditure profile, exceeding fiscal 2025 revenue, and the announcement of a new debt offering have brought fundamental discipline back into focus. At 118 times fiscal 2025 sales, the market’s willingness to look past immediate net losses to fund Starlink and Starship infrastructure serves as a major indicator of long-duration growth risk appetite across global asset classes.
Global markets impact (last 24 hours)
Equities: The broader equity landscape closed flat to mixed, but semiconductor stocks significantly outperformed, with the SOX rallying 2% to a new all-time high. Micron Technology climbed 7% on news of its strategic deal with Anthropic, providing strong upward momentum that lifted hardware and semiconductor names. Conversely, SpaceX (SPCX) slipped 3.94% to $154.60 as profit-taking, and its upcoming debt offering weighed on early momentum.
FX: The US Dollar Index (DXY) inched higher by 0.2% to close Monday’s session at 110.00 after last week’s bullish breakout from its prior major range resistance of 100.54. The Swiss franc (CHF) underperformed notably across major currency pairs, extending its losses against the greenback to a 7-month low of 0.8097, pressured by the Swiss National Bank’s sustained dovish structural policy stance relative to peers. Meanwhile, the ongoing weakness in the Japanese yen tested a key intervention level of 161.95 per US dollar on Monday. USD/JPY printed an intraday high of 161.93 before trading slightly lower to close at 161.60 in the US session.
Fixed income: Sovereign bonds faced moderate selling pressure. Euro area yields edged higher, led by Spanish debt following an upgraded regional inflation forecast. US Treasury curves shifted upward as market participants braced for heavy short-duration supply absorption later in the week.
Commodities: Front-month international energy contracts suffered sharp liquidations. Brent crude plunged 2.8% to close at $78.15/bbll as the US Treasury’s 60-day waiver on Iranian petroleum exports neutralised the structural war premium, while spot gold remained soft to end Monday’s US session at $4,192/oz, holding below its 20-day moving average at $4,320/oz on the backdrop of firmer US Treasury yields.
Asia Pacific impact
- APAC technology ecosystems capture hardware tailwinds but US dollar strength capped gains: The multi-billion-dollar infrastructure commitments across the US technology complex triggered immediate positive spillover effects for Asian semiconductor hubs. But a firmer US dollar has triggered a bout of selling pressure in most Asia-Pacific bourses at the start of today’s Asian session. Japan’s Nikkei 225 (-0.9%), South Korea’s KOSPI (-4.1%), Taiwan’s TAIEX (-0.3%), Hong Kong’s Hang Seng Index (-0.6%), China’s CSI 300 (-1%), with the exception of Australia’s ASX 200 (unchanged), and Singapore’s STI (+0.3%).
- Regional importers benefit from Persian Gulf supply normalisation: The sudden de-escalation in the Strait of Hormuz is providing a meaningful structural cushion for energy-dependent Asian economies. Major regional refiners, particularly across China and India, are projecting lower near-term crude import bills, offering localised support to current account balances.
Top 4 events to watch today (Next 24 Hours)
- Eurozone S&P Global Manufacturing & Services PMI Flash (Jun) - 4:00 pm SGT Impact: EUR/USD, EUR crosses, DAX
- UK S&P Global Manufacturing & Services PMI Flash (Jun) - 4:30 pm SGT Impact: GBP/USD, GBP crosses, FTSE 100
- US S&P Global Manufacturing & Services PMI Flash (Jun) - 9:45 pm SGT Impact: USD, US stock indices
- SpaceX Starfall Demo Mission Liftoff Impact: SPCX Shares, Aerospace & Defence ETFs, Nasdaq 100 Index
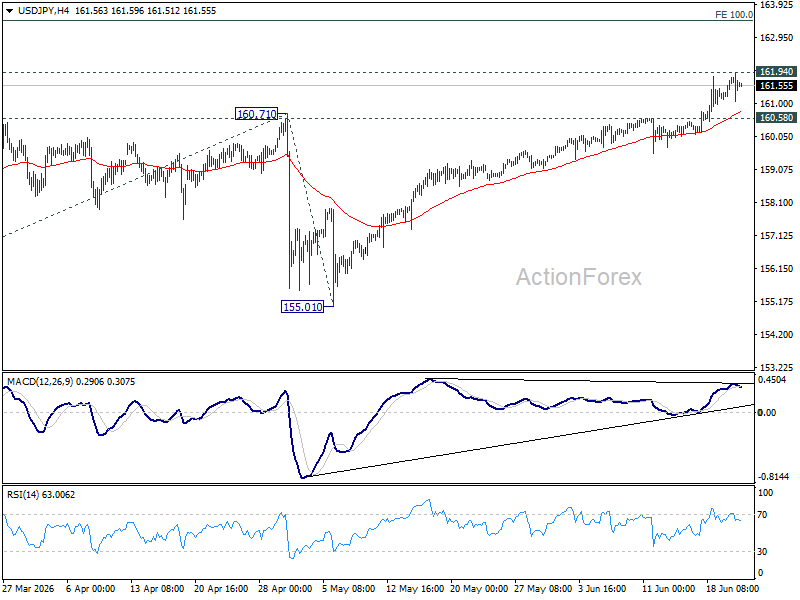
Katayama-Bessent Talks Trigger Mild USD/JPY Pullback, But Intervention Fears Stay Contained
As USD/JPY marched crept closer to 2024's 38-year highs, traders knew they were entering territory where Tokyo becomes increasingly uncomfortable. That sensitivity was evident when Japan's Finance Minister Satsuki Katayama revealed she had held talks with U.S. Treasury Secretary Scott Bessent. The pair dipped briefly on the news, but the move quickly lost momentum. The market's verdict was clear: intervention risk is rising, but not enough to overpower the Dollar story.
On the surface, the meeting appeared routine. Katayama said the two officials discussed developments in global financial markets, including risks surrounding the Strait of Hormuz and their potential impact on the world economy. She also stressed that the meeting was not convened on an emergency basis but served as a follow-up to conversations held during the G7 summit in France.
Yet it was her carefully chosen language afterward that caught traders' attention. While stopping short of confirming whether currency intervention was discussed, Katayama said Japan and the United States share a "firm mutual understanding that decisive action will be taken if necessary." She added that their views remain "very closely aligned." For seasoned FX traders, that is about as close to an intervention warning as Japanese officials are willing to deliver publicly.
The challenge for Tokyo is that intervention threats are competing with an increasingly powerful Dollar narrative. Traders are reluctant to fight a currency rally driven by expectations of further Fed tightening, especially with June non-farm payrolls due next week. That data could determine whether markets continue to build bets on another Fed hike. Until then, intervention fears may slow USD/JPY's ascent, but they are unlikely to reverse it.
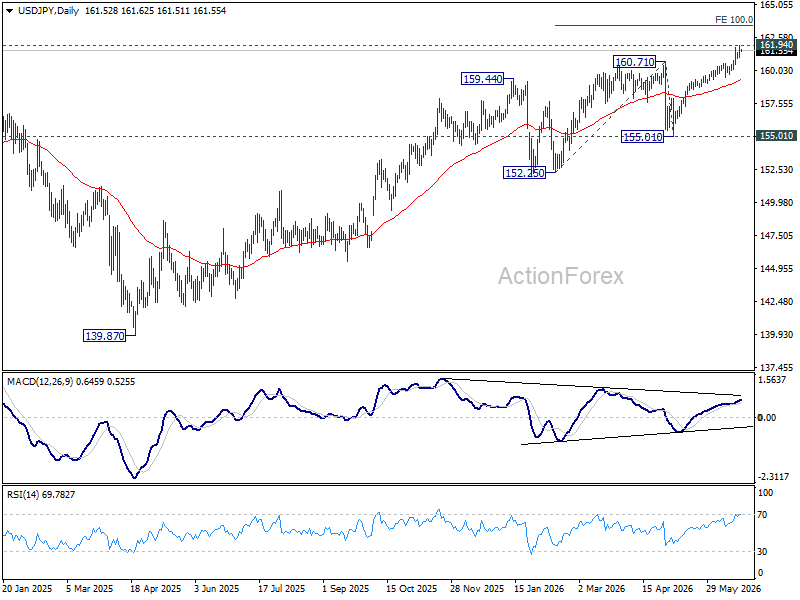
Technically, the pair remains bullish while 160.58 support holds. A break above 161.94 (2024 high) would clear the way toward 100% projection of 152.25 to 160.71 from 155.01 at 163.47 next. However, the higher USD/JPY climbs, the more uncomfortable the trade becomes. However, break of 160.58 will now be a sign of short term topping, and could bring deeper pullback to 55 D EMA (now at 159.38).
Gold Advance Looks Vulnerable as Market Sentiment Shifts
Key Highlights
- Gold started a fresh decline below the $4,265 support.
- A major bearish trend line is forming with resistance at $4,350 on the 4-hour chart.
- WTI Crude Oil extended losses and traded below $78.
- EUR/USD might continue to move down if it drops below 1.1400.
Gold Price Technical Analysis
Gold failed to surpass $4,380 and started a fresh decline against the US Dollar. The price dipped below $4,320 and $4,265 to enter a bearish zone.
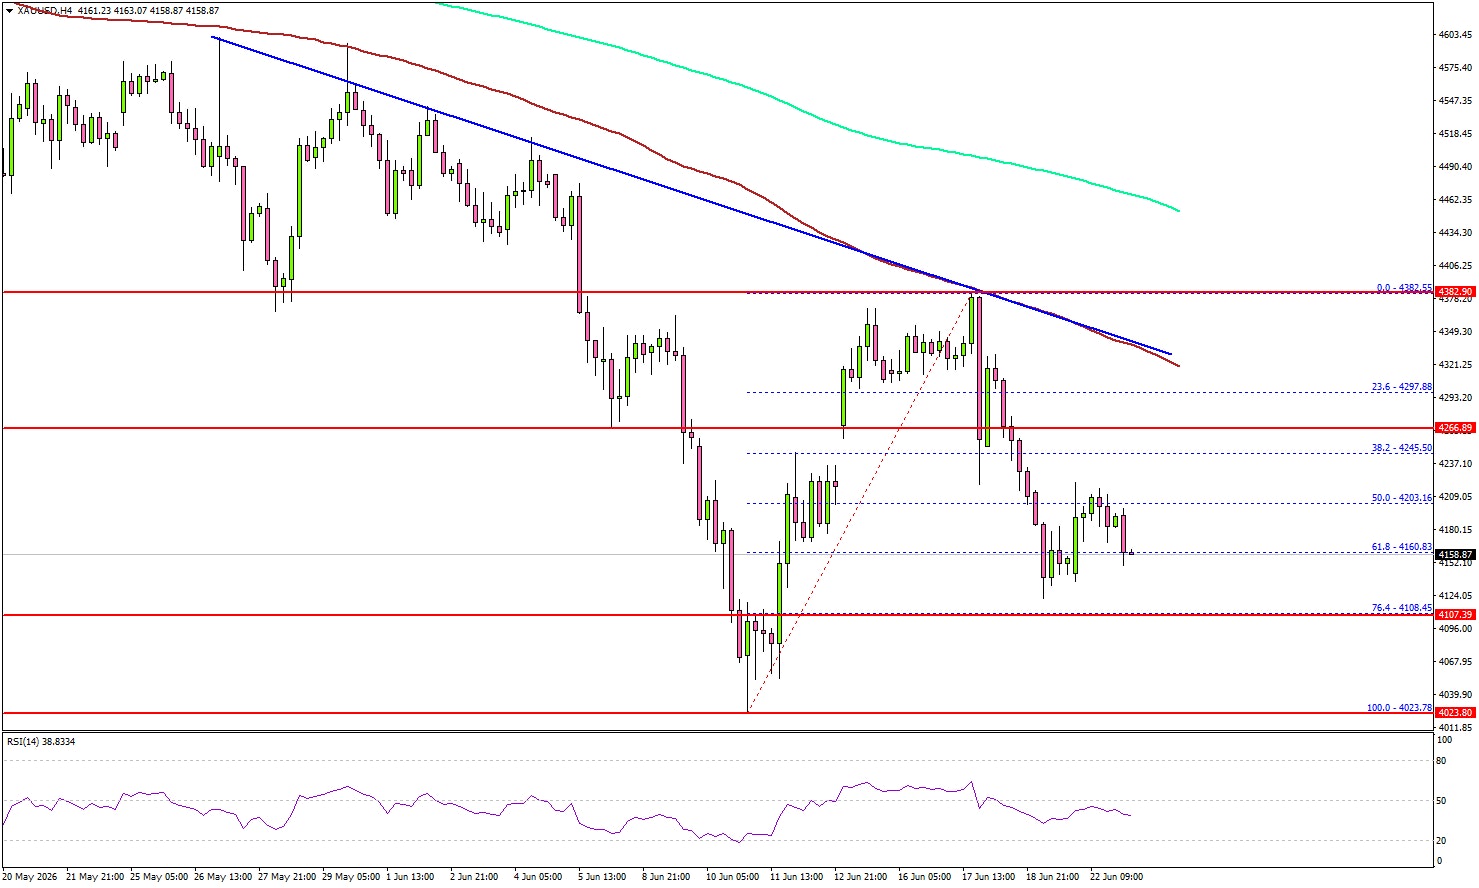
The 4-hour chart of XAU/USD indicates that the price settled below $4,300, the 100 Simple Moving Average (red, 4 hours), and the 200 Simple Moving Average (green, 4 hours). The bears pushed the price below the 61.8% Fib retracement level of the upward move from the $4,023 swing low to the $4,382 high.
If the bears remain in action, the price could revisit the $4,100 support. The first major support sits at $4,050. The next support could be $4,020, below which the price might slide to $3,880.
The main support sits at $3,500. Any more losses might call for a test of $3,320 or even $3,240 in the coming days. On the upside, immediate resistance could be $4,265. The next major resistance might be near a trend line at $4,350.
A clear move above $4,350 could open the doors for more upside. In the stated case, the bulls could aim for a move toward $4,380 or even $4,420. Any more gains might open the doors for a move toward the $4,650 level.
Looking at WTI Crude Oil, the price started a fresh decline, and there are chances of more losses below the $72 zone.
Economic Releases to Watch Today
- Euro Zone Manufacturing PMI for June 2026 (Preliminary) – Forecast 51.2, versus 51.6 previous.
- Euro Zone Services PMI for June 2026 (Preliminary) – Forecast 48.1, versus 47.7 previous.
- US S&P Global Manufacturing PMI for June 2026 (Preliminary) – Forecast 54.7, versus 55.1 previous.
- US S&P Global Services PMI for June 2026 (Preliminary) – Forecast 51.0, versus 50.7 previous.
Japan PMI Growth Accelerates as Manufacturing Boom Extends
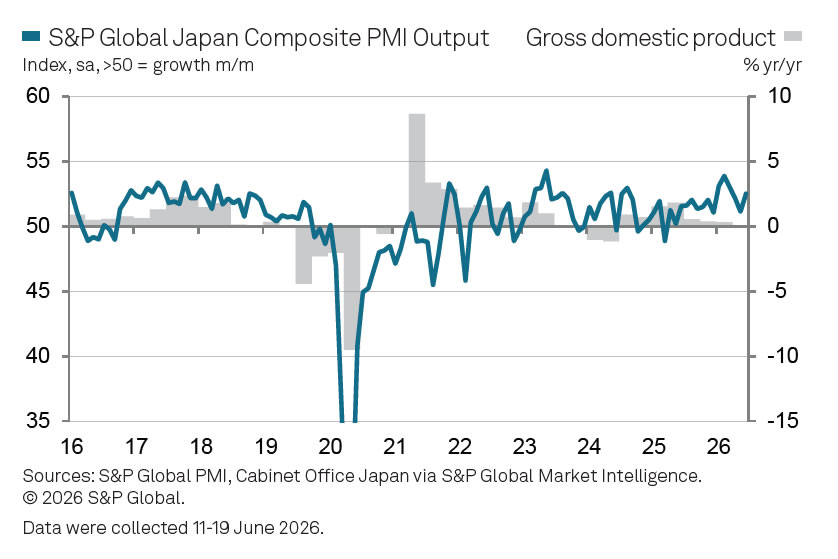
Japan's private sector gained momentum in June, with the Flash Composite PMI Output Index rising from 51.1 to 52.5, the strongest reading since the outbreak of conflict in the Middle East. Growth was broad-based, with the Services PMI Business Activity Index improving from 50.0 to 51.8. Manufacturing remained firmly in expansion territory as the Manufacturing PMI rose from 54.5 to 54.9. Manufacturing output also strengthened from 54.0 to 54.3, underscoring the sector's continued resilience.
According to S&P Global's Annabel Fiddes, manufacturers continued to drive overall growth, recording one of the strongest increases in output seen in more than a decade. At the same time, services activity returned to growth as demand conditions improved across both sectors. The survey points to a strong overall performance in the second quarter and suggests the Japanese economy has thus far weathered the external shocks caused by the Middle East conflict better than many had anticipated.
However, the strength in activity comes with an important caveat. Fiddes noted that part of the recent growth appears to be linked to stockpiling efforts as businesses seek to protect themselves against supply disruptions and higher costs stemming from the conflict. The survey also showed the sharpest increase in input costs in nearly four years, while firms continued to pass those higher expenses on to customers. These inflation pressures helped prompt the Bank of Japan's latest rate hike to 1.00%, the highest level since 1995. As a result, developments in the Middle East will remain a key factor shaping Japan's growth, inflation and policy outlook in the months ahead.
| Indicator | May | June | Change |
|---|---|---|---|
| Composite PMI Output Index | 51.1 | 52.5 | ↑ 1.4 |
| Services PMI Business Activity Index | 50.0 | 51.8 | ↑ 1.8 |
| Manufacturing PMI | 54.5 | 54.9 | ↑ 0.4 |
| Manufacturing PMI Output Index | 54.0 | 54.3 | ↑ 0.3 |
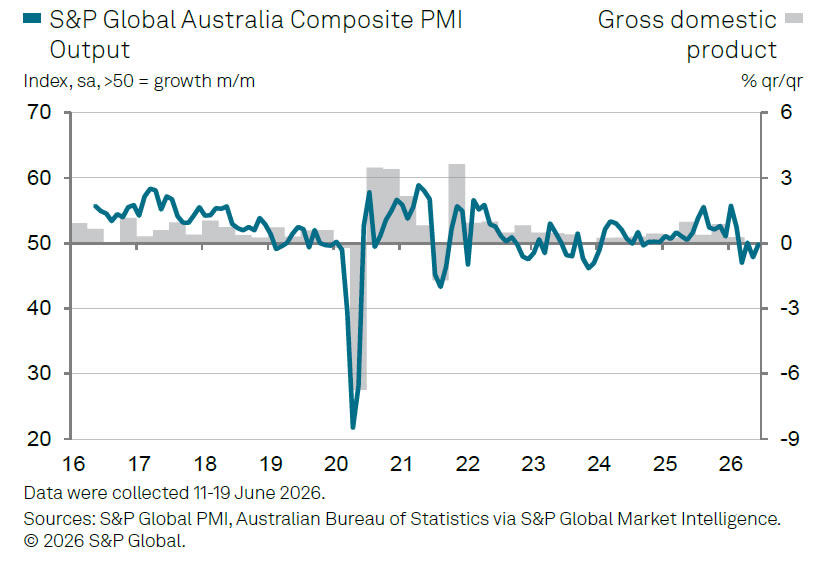
Australia Composite PMI Climbs Toward Growth, But Demand Remains Weak
Australia's private sector showed tentative signs of stabilization in June, with the S&P Global Flash Composite PMI Output Index rising from 48.7 to 49.8. The improvement was driven primarily by services, where the Business Activity Index increased from 48.7 to 49.9. Manufacturing PMI edged up from 50.7 to 51.2. However, manufacturing output remained subdued, slipping slightly from 49.0 to 48.9, highlighting the uneven nature of the recovery.
According to S&P Global's Andrew Harker, the latest survey paints "a mixed picture of fortunes among the country's businesses at a time of international turbulence and uncertainty." Encouragingly, business activity moved closer to stabilization and service providers resumed hiring, helping improve operating capacity. Inflation pressures also showed signs of moderating, even though they remained elevated. Harker noted that lower oil prices following the US-Iran memorandum of understanding could further ease cost pressures, while improved shipping flows through the Strait of Hormuz may help alleviate supply-chain disruptions that have weighed on manufacturers.
However, the survey also revealed persistent weakness beneath the headline improvement. New orders declined again, reflecting ongoing market uncertainty, while business confidence fell to among the lowest levels on record. The findings suggest Australia's private sector has yet to establish a clear growth trajectory. With activity stabilizing but demand remaining fragile, upcoming inflation and labor market data may prove crucial in determining whether the economy regains momentum or slips back into contraction.
| Indicator | May | June | Change |
|---|---|---|---|
| Composite PMI Output Index | 48.7 | 49.8 | ↑ 1.1 |
| Services PMI Business Activity Index | 48.7 | 49.9 | ↑ 1.2 |
| Manufacturing PMI | 50.7 | 51.2 | ↑ 0.5 |
| Manufacturing PMI Output Index | 49.0 | 48.9 | ↓ 0.1 |
Fed’s Goolsbee: Key Question Is Whether Inflation Stays at 3%-4%
Chicago Fed President Austan Goolsbee said the Federal Reserve's primary challenge is determining whether inflation currently running well above target will gradually recede or remain stuck at elevated levels. Speaking on the Marketplace radio program, Goolsbee noted that policymakers are grappling with "an inflation problem that's well above the target and has been going the wrong way." He added that the key issue is finding evidence that inflation pressures are temporary and that the economy is "going to get back on path to 2%, which is what we've promised."
Goolsbee highlighted inflation persistence as the crucial question facing policymakers. "The critical through line that we must determine is, in a situation in which the left of the decimal place number is a three or a four, how concerned are we that it's going to remain a three or a four," he said. While acknowledging that some inflation may reflect temporary factors such as tariffs and geopolitical disruptions, he stressed that the Fed must determine whether those pressures will naturally fade or become embedded in the broader economy.
Particularly concerning for Goolsbee is services inflation, which he described as "a little more disturbing." Unlike higher oil prices linked to the Iran conflict or tariff-related increases in goods prices, services inflation has historically proven more persistent. While he noted that tariff effects are "supposed to be one and done" and that a resolution in the Middle East could help reduce inflationary pressures, the continued strength in services prices suggests the Fed cannot yet assume inflation will return smoothly to target. His remarks reinforce the growing focus within the Fed on inflation persistence rather than simply the current inflation rate itself.