Sample Category Title
USD/JPY Creeping Higher
USD/JPY continues to move edge higher and is up 1.6% this week. In the European session, USD/JPY is trading at 147.67, up 0.25%.
The Japanese yen is once again on a downswing, after hugging the key 145 line. The dramatic intervention by Japan’s Ministry of Finance (MoF) in September stemmed the yen’s bleeding, but this move by Tokyo appears to have had a very short shelf-life, as the yen fall to new 24-year lows.
Intervention anyone?
The burning question is with the yen currently lower than when the MOF stepped in, will it again intervene to prop up the Japanese currency? The first intervention clearly didn’t achieve its desired effect of stabilizing the yen below 145 and Japan’s foreign reserves fell by a record amount in September, around 2.8 trillion yen. The game of cat-and-mouse between the MOF and speculators betting against the yen continues, and another currency intervention could be in the works, but it would likely have to be much larger than the first intervention.
The MOF could try to send a stronger warning to the markets, but it’s questionable whether unilateral action by Japan will be enough to change the yen’s downtrend. The Bank of Japan has no intention of capping JGB yields and with the Fed likely to deliver another oversize rate hike in November, the US/Japan rate differential will continue to widen and likely weigh on the Japanese yen.
The US posted another hot inflation report for September. Headline inflation ticked lower to 8.2%, down from 8.3% but above the consensus of 8.1%. Core inflation rose to 6.6%, up from 6.3% and higher than the forecast of 6.5%. Inflation clearly is yet to peak despite monetary policy becoming restrictive, and the inflation data cements expectations for a 75 basis point hike at the November meeting.
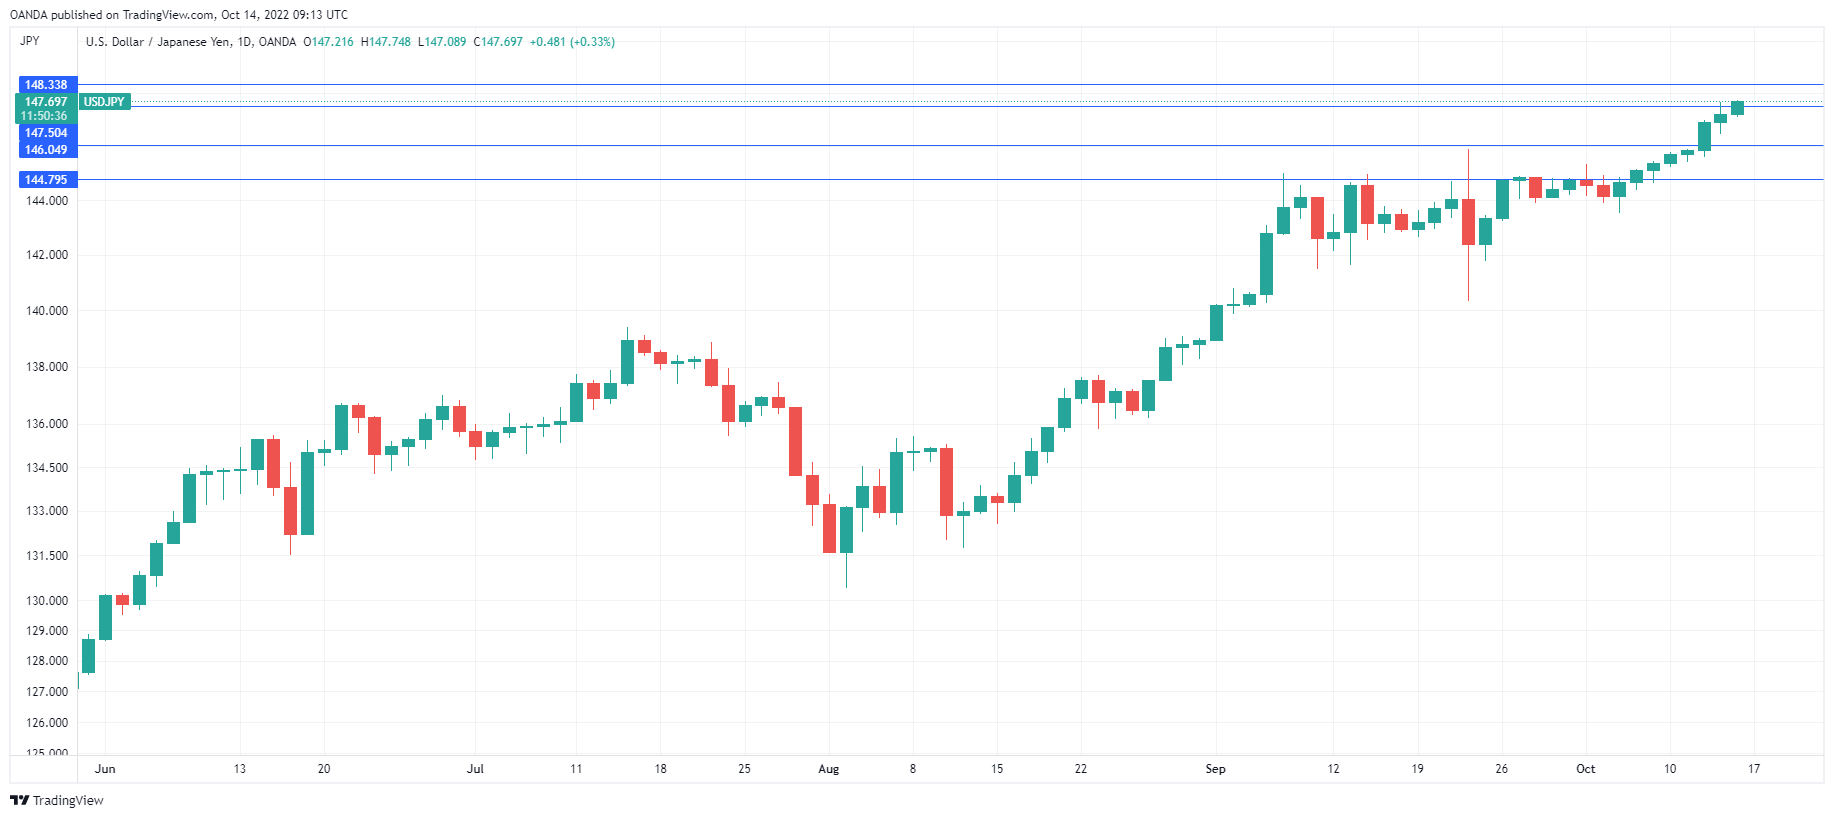
USD/JPY Technical
- USD/JPY is testing resistance at 147.50. Above, there is resistance at 148.32
- There is support at 147.50 and 146.04
Eurozone exports rose 24.0% yoy in Aug, imports rose 53.6% yoy
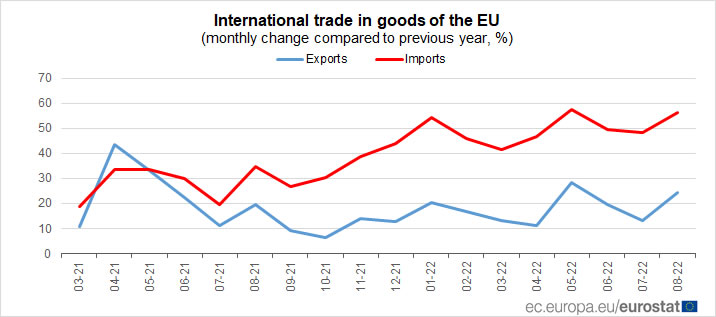
Eurozone exports of goods rose 24.0% yoy to EUR 231.1B in August. Imports rose 53.6% yoy to EUR 282.1B. Trade deficit came in at EUR -50.9B. Intra-Eurozone trade rose 34.8% yoy to EUR 210.5B.
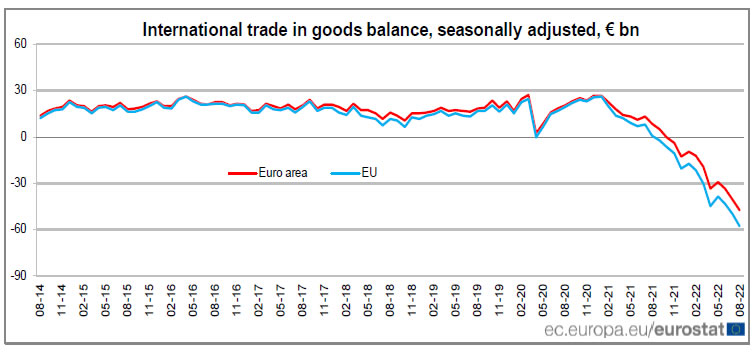
In seasonally adjusted term, exports rose 3.5% mom to EUR 245.5B. Imports rose 5.5% mom to EUR 292.8B. Trade deficit widened from EUR -40.5B to EUR -47.3B, much larger than expectation of EUR -40.0B. Intra-Eurozone trade rose from EUR 230.9B to EUR 239.2B.
USDCAD Retraces after Hitting Fresh 29-Month High
USDCAD has been in a steep uptrend since mid-September when the price managed to forcefully cross above the 1.3222 region. Although the pair spiked higher to a fresh 29-month high in the previous daily session, it quickly corrected lower and closed the day with losses, hinting that the rally could be overstretched.
The momentum indicators currently suggest that bullish forces are waning. Specifically, the stochastic oscillator is sloping downwards after posting a bearish cross, while the MACD histogram has retreated beneath its red signal line but remains in the positive territory.
Should the negative momentum strengthen, the pair could extend its recent retreat and encounter initial resistance at the 1.3675 region. Sliding beneath that floor, the bulls might aim for the recent low of 1.3500 before the attention shifts to the July peak of 1.3222. Even lower, the 1.3074 barrier could prove to be a tough one for the price to overcome.
Alternatively, if buyers re-emerge and push the price higher, the 1.3840 hurdle may act as the first line of defence. Crossing above the latter, the 29-month high of 1.3876 could provide further upside protection. Should that barricade fail, the price could ascend to form multi-year peaks, where the May 2020 resistance of 1.4140 may curb any advances.
Overall, even though bullish pressures appear to be subsiding, USDCAD’s steep uptrend remains intact. Nevertheless, a dive beneath the 1.3500 floor could be the starting point of a moderate downside correction.
GBP/JPY Daily Outlook
Daily Pivots: (S1) 163.67; (P) 165.48; (R1) 168.63; More...
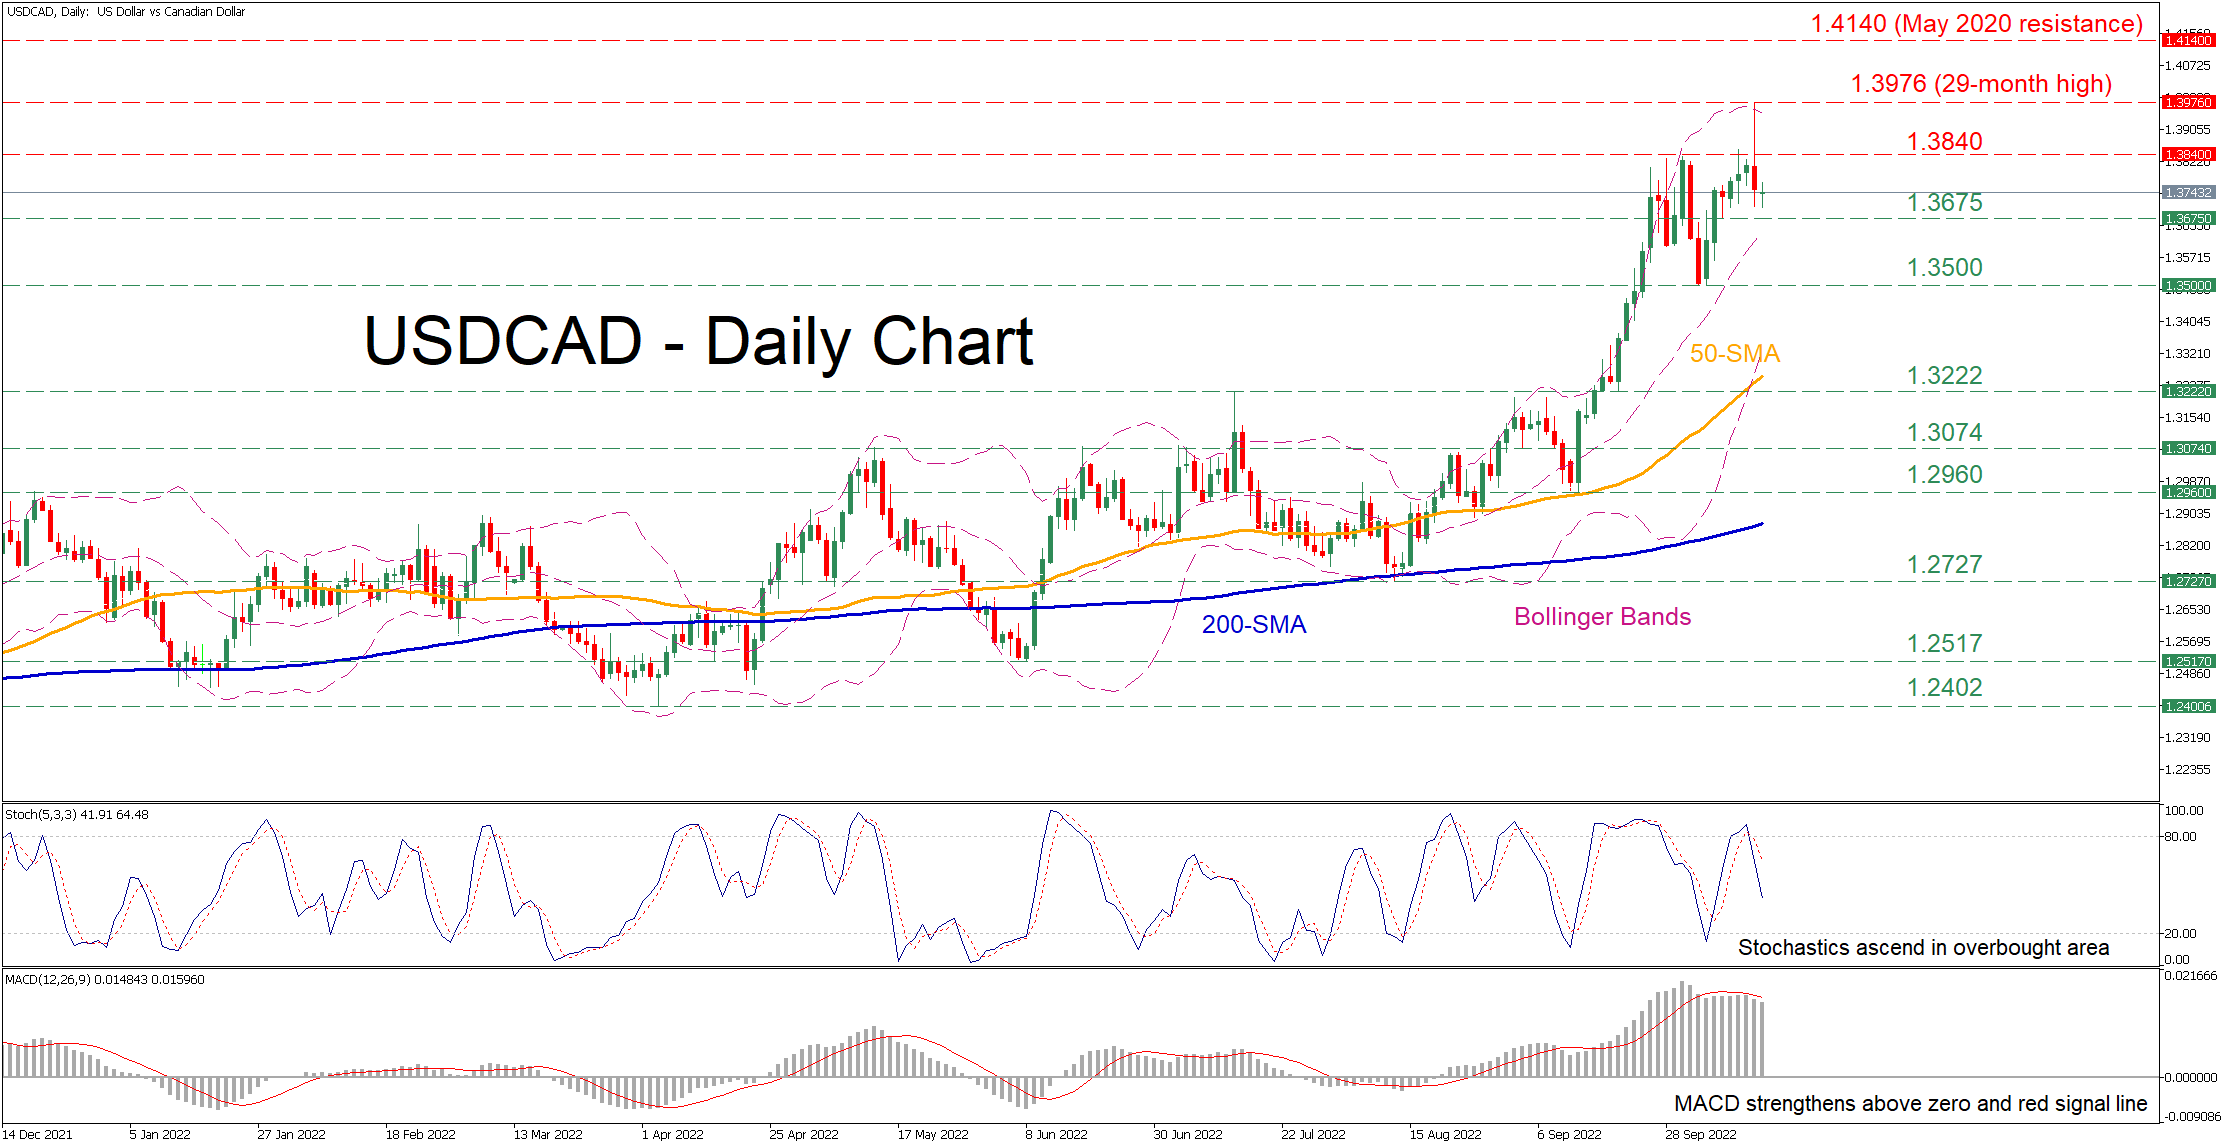
GBP/JPY's rise from 148.93 resumed by breaking through 165.69 resistance. Intraday bias is back on the upside for 169.10 high. Decisive break there will confirm larger up trend resumption. For now, further rally will remain in favor as long as 159.71 support holds, in case of retreat.
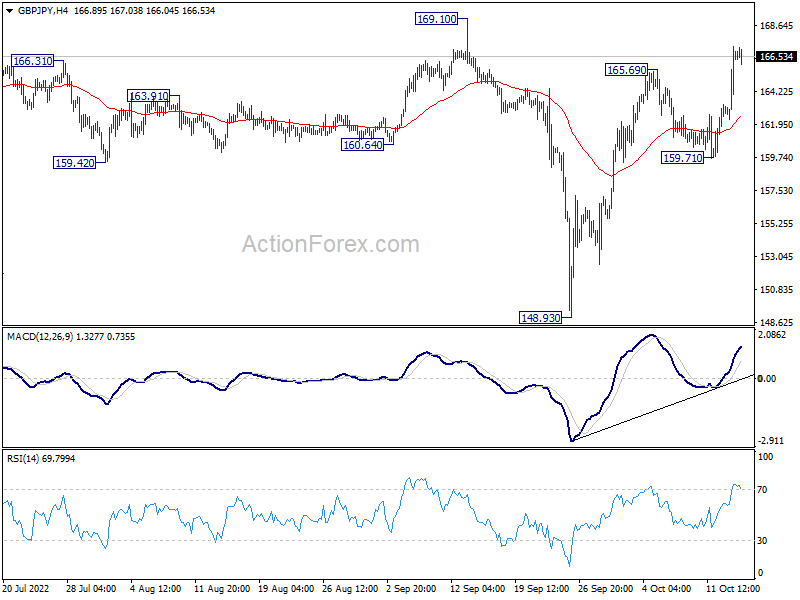
In the bigger picture, strong support from 38.2% retracement of 123.94 to 169.10 at 151.84 suggests that price actions from 169.10 are developing into a corrective pattern only. That is, rise from 123.94 (2020 low) should resume at a later stage. This will now remain the favored case as long as 148.93 support holds.
EUR/JPY Daily Outlook
Daily Pivots: (S1) 142.44; (P) 143.26; (R1) 144.77; More....
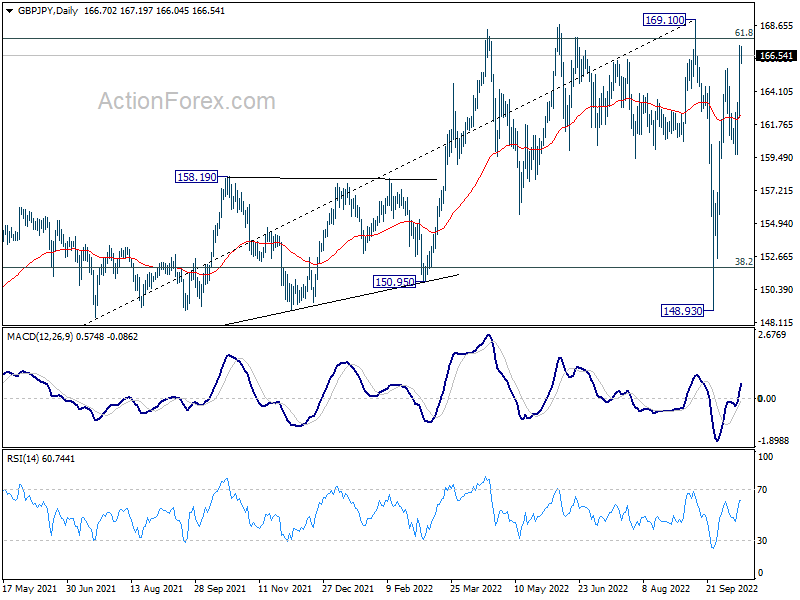
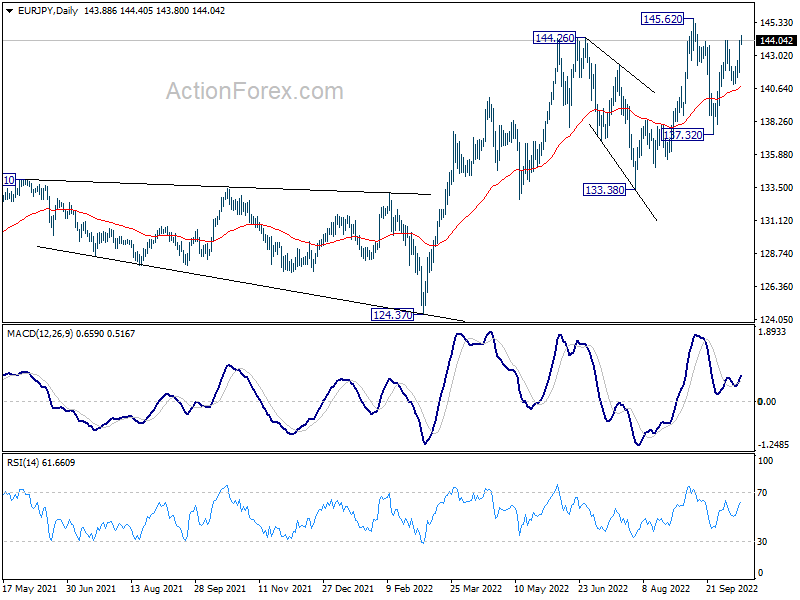
EUR/JPY's rebound from 132.32 resumed by breaking 144.06 resistance. Intraday bias is back on the upside for retesting 145.62 high. Decisive break there will resume larger up trend. For now, further rally will remain in favor as long as 140.88 support intact, in case of retreat.
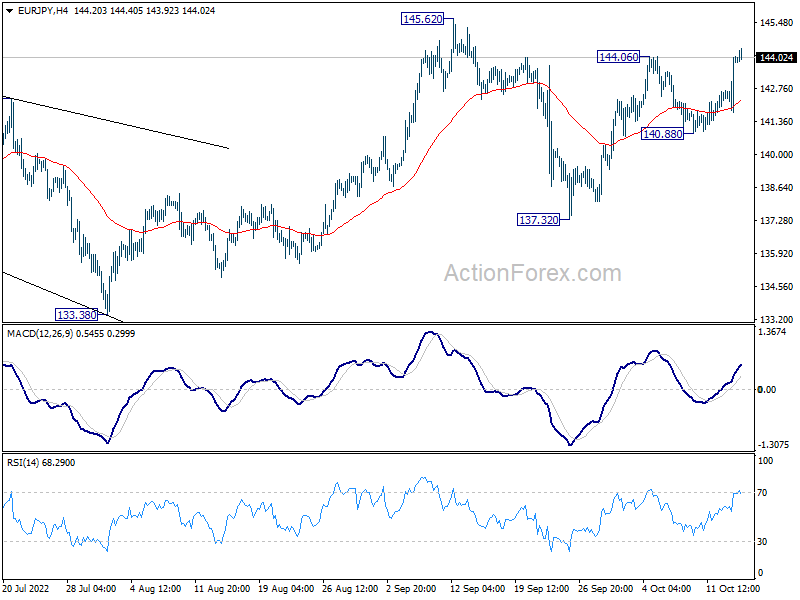
In the bigger picture, as long as 133.38 support holds, the up trend from 114.42 (2020 low) could still extend through 145.62 high. In that case, next target is 149.76 (2015 high). However, sustained break of 133.38 will be a sign of medium term bearish reversal and bring deeper fall to 124.37 support first.
EUR/GBP Daily Outlook
Daily Pivots: (S1) 0.8570; (P) 0.8668; (R1) 0.8728; More...
Intraday bias in EUR/GBP remains on the downside for the moment. Current fall from 0.9267 should target 61.8% projection of 0.9267 to 0.8647 from 0.8869 at 0.8486. Such decline is seen as part of a long term range pattern. Deeper fall is now in favor as long as 0.8869 holds, in case of recovery.
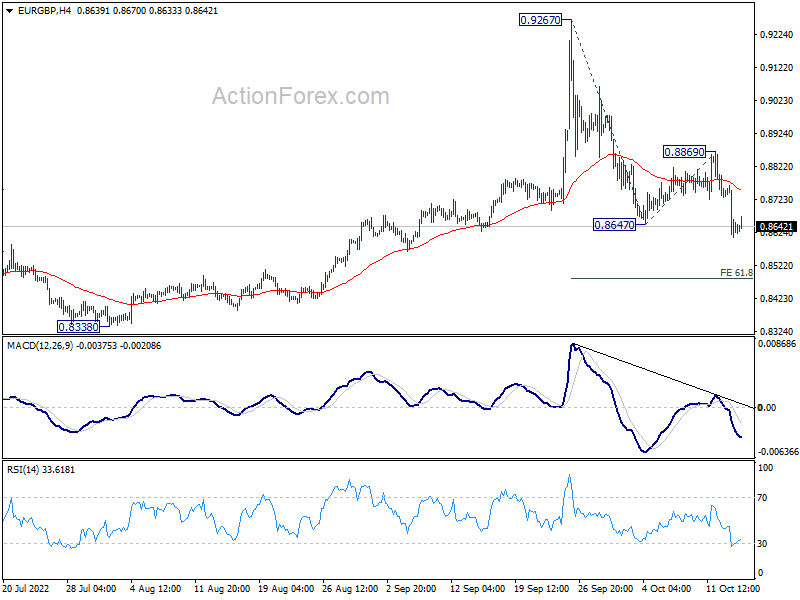
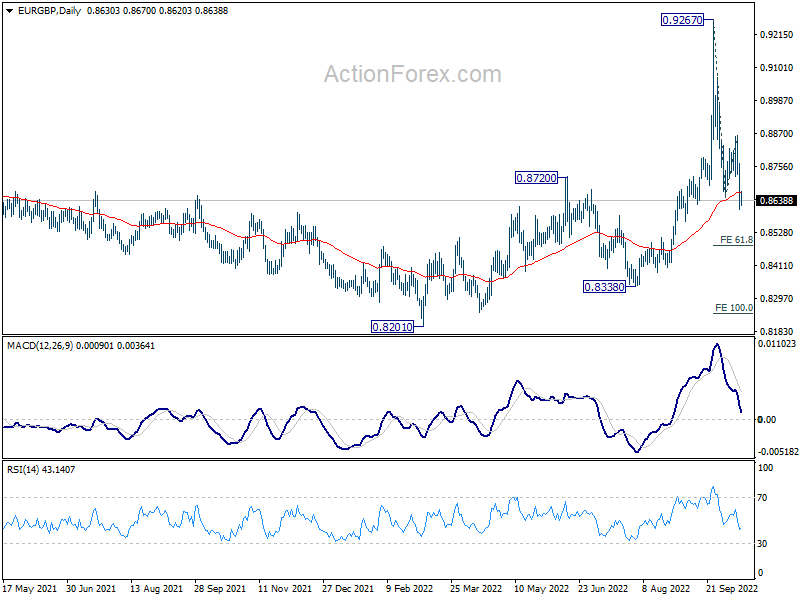
In the bigger picture, as long as 0.8720 resistance turned support holds, rise from 0.8201 is seen as resuming larger up trend from 0.6935 (2015 low). Break of 0.9499 (2020 high) should be seen at a later stage. However, firm break of 0.8720 will argue that sideway pattern from 0.9499 is extending with another falling leg instead.
EUR/AUD Daily Outlook
Daily Pivots: (S1) 1.5415; (P) 1.5477; (R1) 1.5526; More...
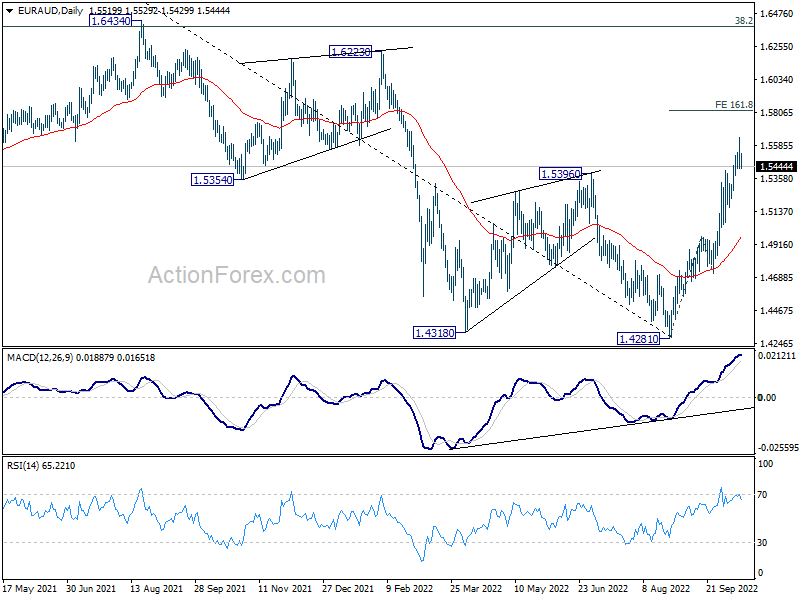
EUR/AUD retreated again after hitting 1.5638 and intraday bias is turned neutral. For now, further rally will remain in favor as long as 4 hour 55 EMA (now at 1.5347) holds. Above 1.5638 will target 161.8% projection of 1.4281 to 1.4965 from 1.4716 at 1.5823. Nevertheless, firm break of 4 hour 55 EMA will confirm short term topping and bring deeper pull back.

In the bigger picture, a medium term bottom should be in place at 1.4281, on bullish convergence condition in daily MACD. Further rise would be seen back to 1.6434 key resistance next. Break of 1.4965 resistance turned support is needed to indicate reversal. Otherwise, further rally will remain in favor.
EUR/CHF Daily Outlook
Daily Pivots: (S1) 0.9713; (P) 0.9752; (R1) 0.9828; More....
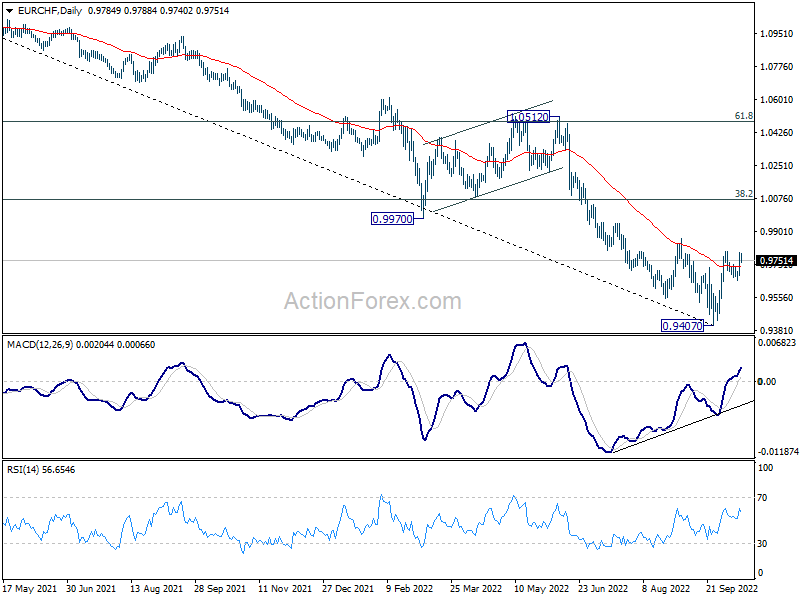
EUR/CHF rebounded notably but stays below 0.9798 resistance. Intraday bias remains neutral first. On the upside, above 0.9798 will resume the rebound to 0.9864 resistance. Firm break there will solidify the case of medium term bottoming at 0.9407, and target 38.2% retracement of 1.1149 to 0.9407 at 1.0072. On the downside, below 0.9641 minor support will turn bias back to the downside for retesting 0.9407 low instead.
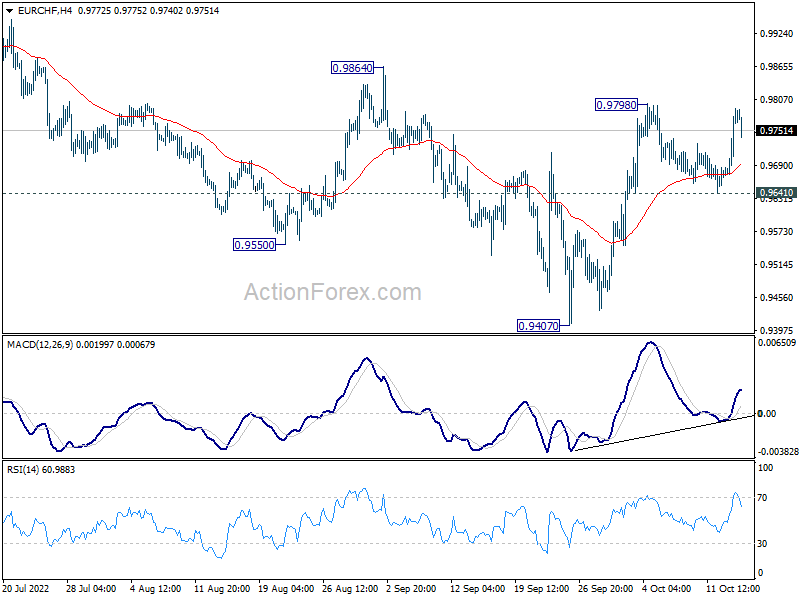
In the bigger picture, as long as 0.9864 resistance holds, long term down trend from 1.2004 (2008 high) is expected to continue. Next target is 138.2% projection of 1.2004 to 1.0505 to 1.1149 at 0.9033. However, firm break of 0.9864 will confirm medium term bottoming, on bullish convergence condition in daily MACD. Stronger rally would then be seen back to 55 week EMA (now at 1.0152), even as a corrective rebound.
A Remarkable Reversal of Bitcoin
Market picture
Bitcoin added a modest 1.2% on Thursday, but this subtle result hides the real roller coaster. Bitcoin was losing 5% intraday, coming close to $18K, but following the stock market, it not only recouped its initial losses but also showed impressive gains. At the time of writing, the price is stomping around $19.8K.
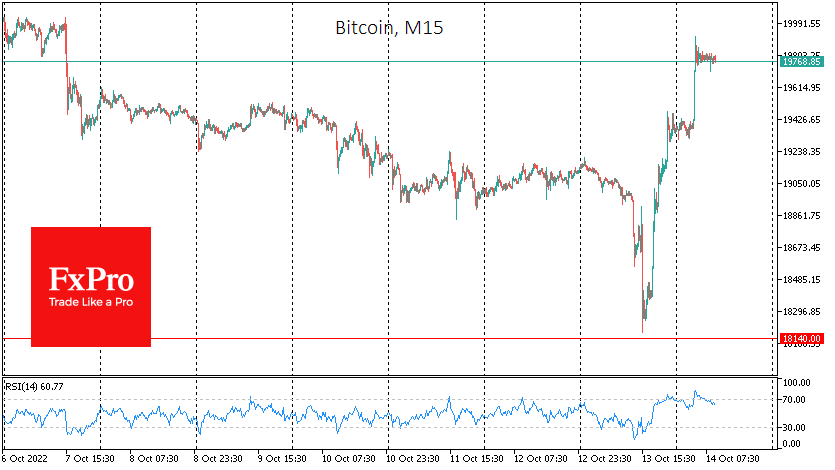
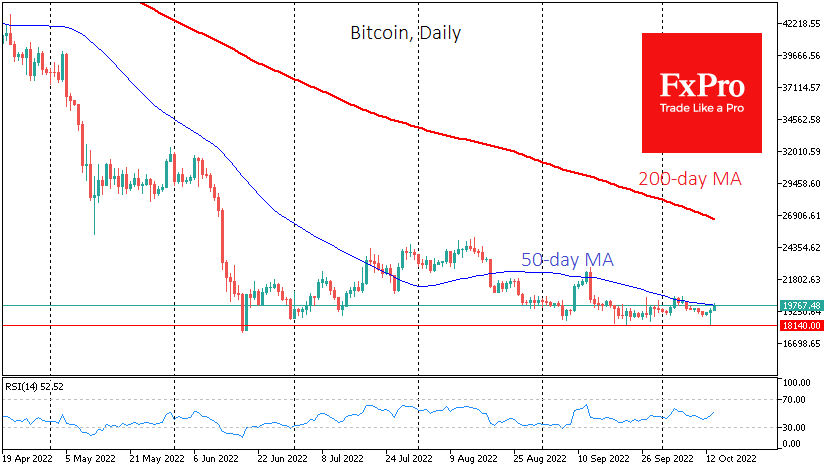
This way, the bulls managed to defend the lower boundary of the trading range. Moreover, this intraday reversal pattern is often the harbinger of a global reversal in the trend. In our case, it could change from a bear market to a sideways market or a moderate rise. Talking about the start of FOMO does not make sense yet.
The closest confirmation of a downtrend reversal would be a fixation above the $20K level – above the psychologically crucial round level and the 50-day moving average.
News background
Devere Group CEO Nigel Green expects bitcoin to decline for the rest of the year amid rising inflation in the global economy. However, long-term investors can benefit by buying crypto assets “on the cheap” from panicked traders.
The head of cryptocurrency investment firm Galaxy Digital, Mike Novogratz, said the bearish trend could last another two to six months. He said sellers are highly depleted, and most investors who needed fiat have already sold their assets. But to reverse the trend, a change in the Fed’s monetary policy is required.
Tim Rice, CEO of analyst firm CoinMetrics, said that more companies from traditional finance have started to emerge in the cryptocurrency industry. However, big banks are still waiting for more transparent crypto industry regulation to reduce their risks.
According to the People’s Bank of China, the volume of transactions using the digital yuan has exceeded 100 billion yuan (about $13.9 billion) due to its full-scale deployment in China.
GBPJPY Continues the Upside Momentum above 200-day SMA
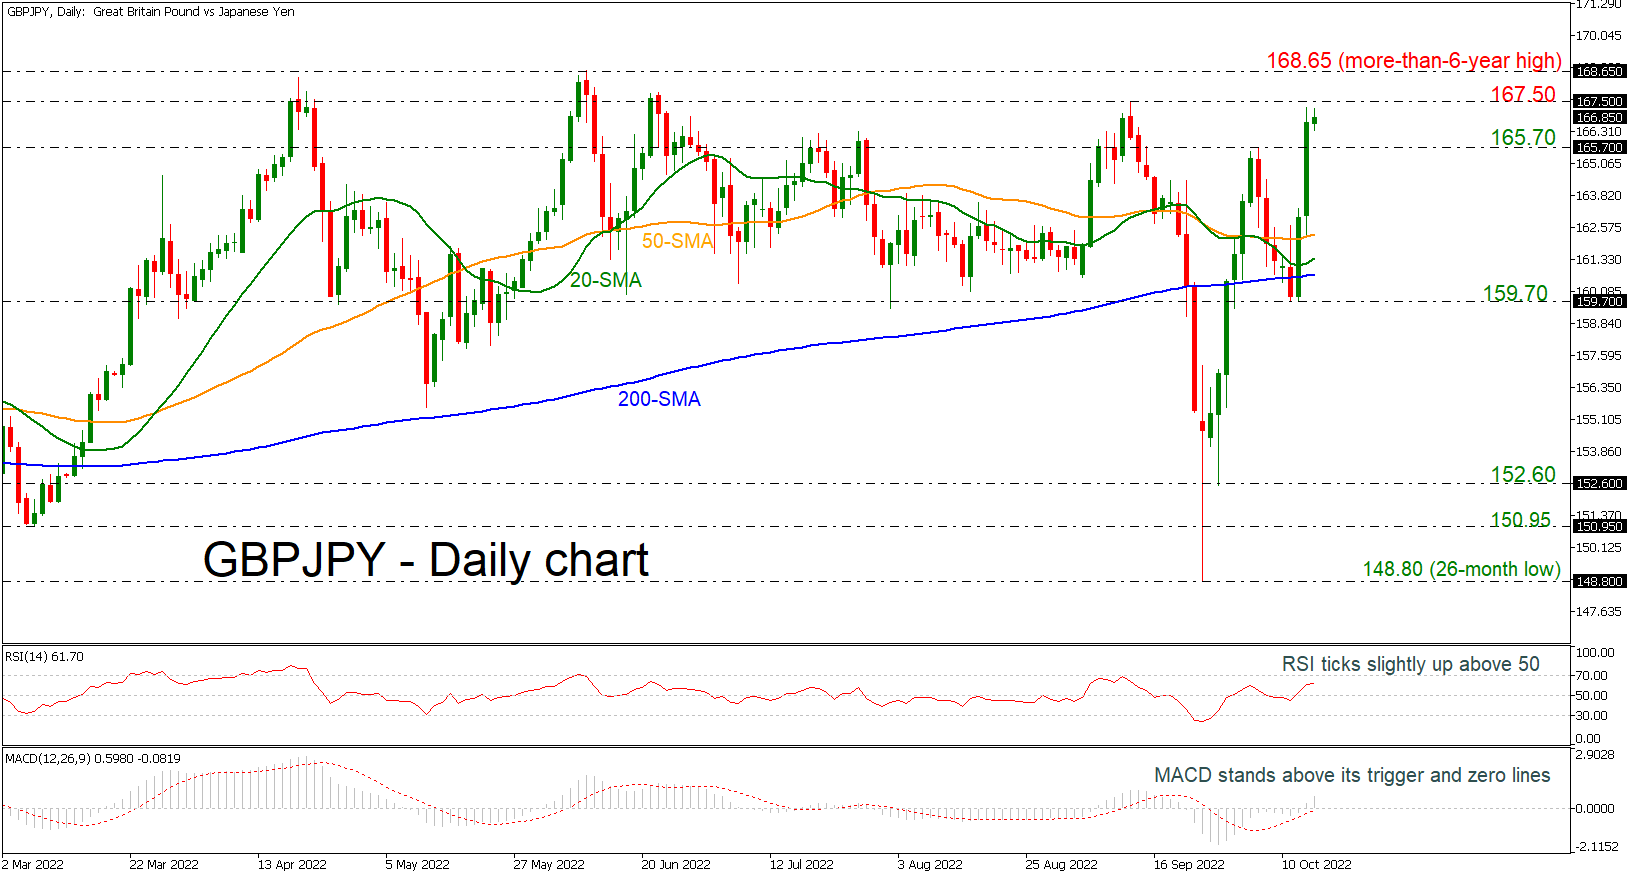
GBPJPY posted a bullish rally over the last couple of days, rebounding off the 159.70 barrier and surpassing the SMAs as well. The pair is flirting with the 167.00 round number with the technical oscillators confirming the recent bullish bias. The RSI is ticking slightly higher in the positive region, while the MACD is extending its movement above its trigger and zero lines.
More upside pressures could open the way for the next immediate resistance at 167.50 before resting near the more-than-six-year high of 168.65. If the market manages to jump higher, the April 2015 peak of 175.00 may halt the bullish actions.
On the other hand, a dive beneath the 165.70 support could take the market towards the 50- and 20-day simple moving averages (SMAs) at 162.30 and 161.30 respectively ahead of the 200-day SMA at 160.70. Steeper losses could meet the 159.70 obstacle and the 152.60 hurdle.
To sum up, GBPJPY is bullish in the very short-term and any advances beyond the more-than-six-year high could endorse a long-term positive outlook.