Sample Category Title
What Are You Doing, Bailey?
We are only Wednesday, and the Bank of England (BoE) already intervened twice this week, to cool down the unbearable negative pressure on the British sovereign bonds.
Monday, the BoE announced it would buy more bonds until the end of this week in an attempt to give a boost to the market before it stopped purchases. But the latter didn’t prevent inflation-linked papers from recording a historic dive in the UK.
So, Tuesday, the BoE announced to buy inflation-linked sovereign bonds, as well. For a while, it looked like the latest measures helped pouring water on the burning hot British sovereign space.
But then… the BoE Governor said that UK bond investors should finish winding up positions that they can’t maintain as the BoE will halt its operations by the end of this week.
And puff.
All the BoE efforts have gone up in smoke. What Bailey did was certainly one of the biggest communication mistakes that a central banker could make. And it really came at an unfortunate time.
The gilt yields remain at alarming high levels, the UK’s gilt market remains extremely slippery, the BoE says it will just leave the mess as it is, by the end of next week and sterling is in a bad shape, because Cable slipped below 1.10 following Bailey’s comments.
Investors clearly brace for a deeper dive in UK sovereigns and the pound. But the FTSE 100 could benefit from falling sterling, as it has a high exposure to energy and mining stocks, and the crumbling sterling makes the profitable British oil companies, for example, more affordable for international investors. This is certainly why the FTSE remained more resilient compared to the S&P500. The FTSE 100 is down by less than 8% since the start of this year, whereas the S&P500 lost more than 25% since the January peak.
FOMC minutes and US inflation data
All eyes are on FOMC minutes and the US inflation data.
Today, the minutes from the FOMC’s latest meeting will reveal if some Federal Reserve (Fed) members are concerned about going ‘too fast’ in terms of rate hikes. But we will certainly not hear anything more dovish than ‘the Fed will continue monitoring economic data, especially inflation’.
Also, today, US will also reveal the latest producer price index for the month of September. The US factory-gate prices are expected to have slowed from 8.7% to around 8.4%.
Then tomorrow, we will have a better insight about the situation in consumer prices. The headline CPI is expected to have slowed from 8.3% to 8.1%, but core inflation may have spiked higher, which is bad news for those praying for the Fed to slow down the pace of its rate tightening.
One important ingredient in Fed’s decision making is the inflation expectations. Unfortunately, after two months of sharp drop in inflation expectations, we had a mixed picture at yesterday’s release. The one-year inflation expectations kept falling, which is good news, but the three-year expectations ticked higher. And both are still above the Fed’s 2% policy target.
Investors, and the world, desperately want a soft US inflation data to convince the Fed to soften its tone. Otherwise, the markets will continue being battered, jobs being lost, and economy being squeezed.
IMF cuts global growth forecast
The IMF cut its global growth forecast for next year to 2.7%, from 2.9% in July, and from 3.8% in January, and said that there’s 25% probability that growth will slow to less than 2%. In the euro area, the GDP could rise just 0.5% next year.
The EURUSD remains under a decent pressure of the strong dollar, and only a soft inflation data from the US could help the euro bears take a pause.
In Japan, things are not necessarily better. The USDJPY spiked above the 146 level for the first time in 24 years. Not only that the effect of the Bank of Japan’s (BoJ) direct intervention in the FX markets didn’t last long, but Japan’s sovereign market is also going through a historic time, because investors could no longer trade the 10-year JGBs for three days, because the BoJ broke the system by buying just too much of the 10-year bonds to conduct a yield curve control strategy.
Swap traders are now betting that the BoJ can’t carry on with abnormally low interest rates for so long, and will be forced to hike its rates at some point. Otherwise, the yen will continue losing value and even direct interventions won’t stop the bleeding in yen.
Bank of England Continues to Rattle the Market
Market movers today
This morning we get euro area industrial production for August. After a big drop in July of 2.3% m/m it is expected to recover somewhat in the August reading.
US PPI for September may grab some attention ahead of the important US CPI release tomorrow. Import prices have declined for the past four months, which puts downward pressure on PPI. High wage growth works in the other direction, though. Consensus is for a rise in core PPI of 0.3% m/m down from 0.4% m/m in August.
FOMC minutes tonight will give some insights to the thinking behind the Fed raising the dot plot to a peak of around 4.6% (in line with current market pricing).
In the Nordics, we get Swedish Prospera Inflation expectations.
Developments in the Russia/Ukraine war will also continue to be in focus.
The 60 second overview
The temporary QE from Bank of England continues to rattle markets. Yesterday, BoE Governor Baily urged investors to unwind any positions that are not sustainable when the temporary QE ends on Friday. However, a lobby group that represents UK pension funds has urged the BoE to continue the QE as investors need more time to unwind positions. Hence, the uncertainty/volatility remains in the UK market and with the possible spill-over effects to other markets as we have seen so far.
Yesterday, at their biannual meeting the IMF cut its growth forecast for the world economy in 2022-23 to the weakest level since 2001 (if we exclude the global financial crisis). The main drivers of the growth downgrade are the headwinds from the energy crisis and global financial tightening amid the sharp upward move in central bank rates across the world. At the same time, the IMF sees a risk that the outlook will turn worse before it turns better. The institution downgraded the economic outlook mainly for western economies, notably the euro area with Germany and Italy seeing the biggest growth downgrades. In general, despite the downward growth revisions, the IMF is still slightly more upbeat than us, especially on the US outlook in 2023.
However, the Fed's Mester continues to argue for more tightening of US monetary policy despite the risk of a recession, and we saw a test of the 4% level for 10Y US government bond yields before the it fell back and is trading at 3.92% this morning in Asian trade.
Germany and the Netherlands are expected to put forward a proposal to bring down EU energy costs as EU energy ministers will meet in Prague today. They are also expected to keep open the proposal of capping gas prices used to generate electricity. We have more speakers from both Federal Reserve and ECB today.
Equities: Equities lower yesterday for the fifth day in a row but yesterday with the group of defensive industries doing better and ending the day higher. This also means indices were dragged lower by cyclicals and over the last five days, cyclicals have underperformed defensives by 3%. VIX continued higher yesterday, closing shy of 34. We very often see vol spiking due to one single event but the elevated VIX level right now tells a story of combined uncertainty ranging from macro to monetary policy, politics and geopolitics that investors are struggling with at the moment. In US yesterday Dow +0.1%, S&P 500 -0.7%, Nasdaq -1.1% and Russell 2000 +0.1%. Asian markets are mixed this morning. European futures are lower while US futures are showing some solid gains this morning.
FI: 10Y US Treasuries tested the 4%-level yesterday ahead of the US CPI data later this week as well as the comments from Federal Reserve's Mester that the Federal Reserve cannot be complacent regarding inflation and need to keep tightening monetary policy. However, US government bond yields ended a bit lower.
Bank of England is going to end their temporary QE on Friday and urged investors to unwind positions before BoE ends QE. However, today the BoE added UK linkers to the QE and yields declined on both nominal and inflation-linked UK government bonds.
In the European market, there was plenty of long-end supply from Germany and EU. The 30Y German syndicated deal was weak with a modest bid-to-cover as well as a large retention from the German Debt Agency, while the bid-to-cover at the EU dual tranche, where they sold 7Y and 20Y benchmarks was solid. However, there was also a solid new issue premium in the 20Y deal.
FX: USD roughly unchanged on the day. SEK continues to weaken whereas NOK has found some support in higher short-end rates. Big swings in GBP related to policy remarks, where the near-term fate of GBP is tightly connected to BoE's intervention plans in the Gilt market.
Credit: The negative sentiment in the credit market reversed at the last hours of trading yesterday. ITraxx Main tightened 0.5bp to 134bp and Xover tightened 5.9bp to 642bp. The primary markets continue to show life-signs with Vattenfall being able to print a multi-tranche EUR benchmark deal yesterday.
Nordic macro
In Sweden, the October money market inflation expectations are due in the coming week. Over the past couple of months CPIF expectations (which excludes the inflationary impact from Riksbank pushing mortgage rates higher) have turned lower on all horizons. We expect to see another leg down this month.
UK GDP contracted -0.3% mom in Aug, driven by production
UK GDP contracted -0.3% mom in August, worst than expectation of 0.1% mom expansion. In the three months to August, compared with the three months, GDP contracted by -0.3%, with -1.5% fall in production, -0.1% fall in services and flat growth in construction.
Production fell by -1.8% mom, and was the main contributor to the decline in GDP. Growth was negative in three of the four sectors. Services dropped -0.1% mom. Construction rose 0.4% mom.
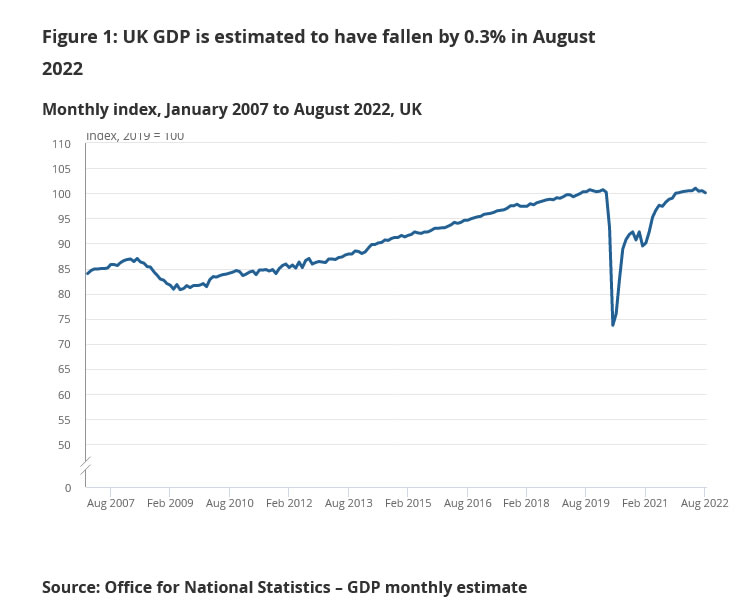
Also released, industrial production came in at -1.8% mom, -5.2% yoy, versus expectation of -0.2% mom, 0.6% yoy. Manufacturing production came in at -1.6% mom, -6.7% yoy, versus expectation of 0.0% mom, 0.7% yoy. Goods trade deficit widened to GBP -19.3B, but smaller than expectation of GBP -20.5B.
GBP/JPY Daily Outlook
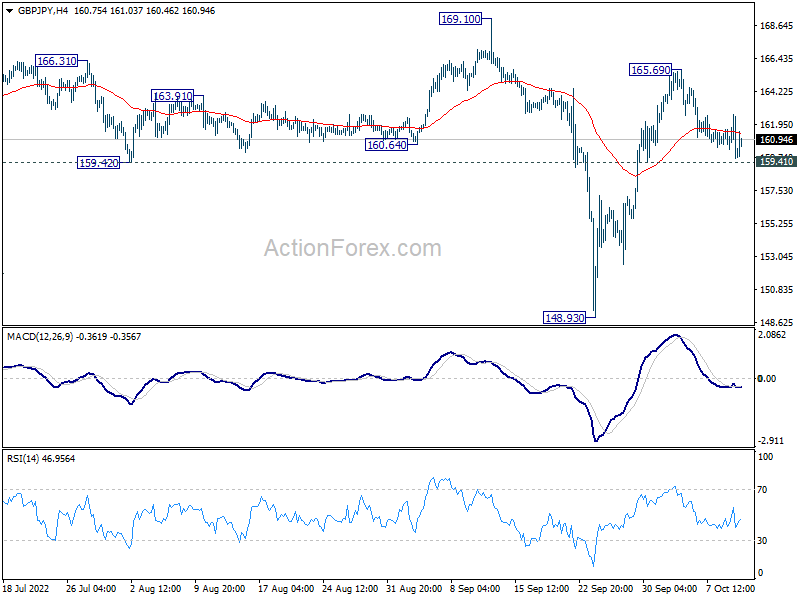
Daily Pivots: (S1) 158.96; (P) 160.82; (R1) 161.90; More...
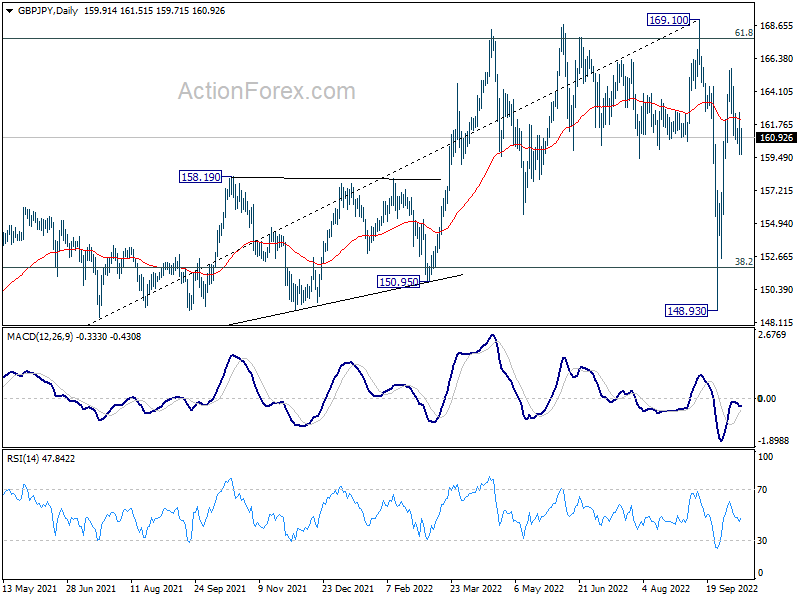
Intraday bias in GBP/JPY remains neutral and outlook is unchanged. On the downside, below 159.41 minor support will turn bias back to the downside for 148.93 again. However, firm break of 169.10 will confirm resumption of larger up trend. Also, while further rise could be seen, strong resistance might be seen from 169.10 high to limit upside, at least on first attempt.
In the bigger picture, strong support from 38.2% retracement of 123.94 to 169.10 at 151.84 suggests that price actions from 169.10 are developing into a corrective pattern only. That is, rise from 123.94 (2020 low) should resume at a later stage. This will now remain the favored case as long as 148.93 support holds.
EUR/JPY Daily Outlook
Daily Pivots: (S1) 140.95; (P) 141.58; (R1) 142.14; More....
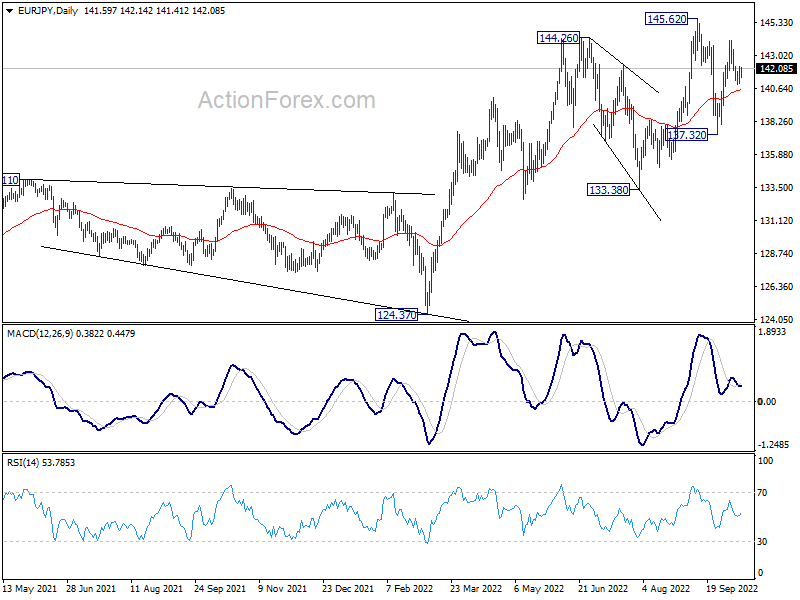
Intraday bias in EUR/JPY remains neutral and outlook is unchanged. On the downside, break of 140.77 minor support will turn bias back to the downside, to extend the corrective pattern from 145.62 with another falling leg towards 137.32 support. On the upside, above 144.06 will bring retest of 145.62 high.
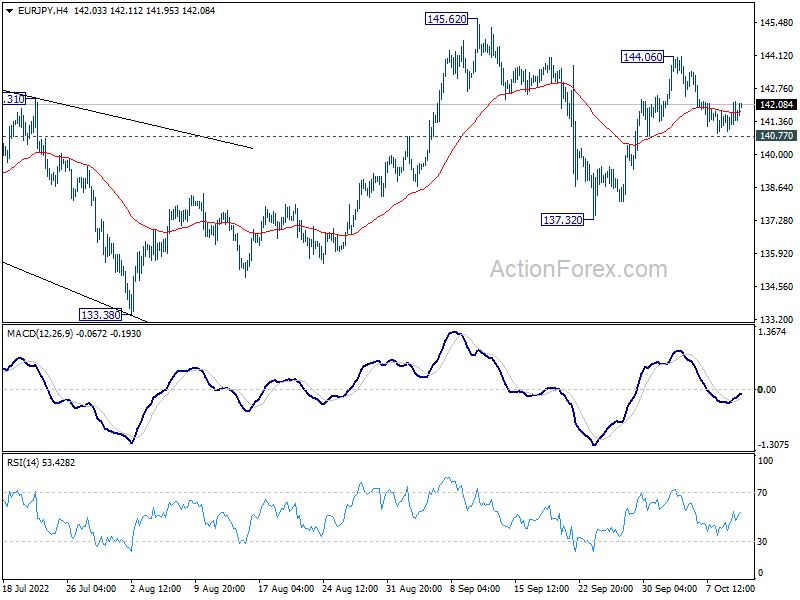
In the bigger picture, as long as 133.38 support holds, the up trend from 114.42 (2020 low) could still extend through 145.62 high. In that case, next target is 149.76 (2015 high). However, sustained break of 133.38 will be a sign of medium term bearish reversal and bring deeper fall to 124.37 support first.
EUR/GBP Daily Outlook
Daily Pivots: (S1) 0.8758; (P) 0.8809; (R1) 0.8894; More...
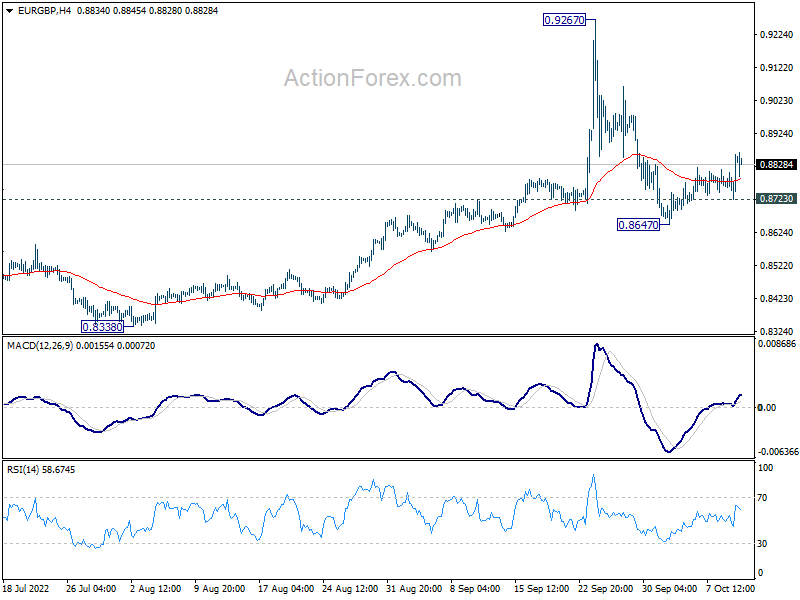
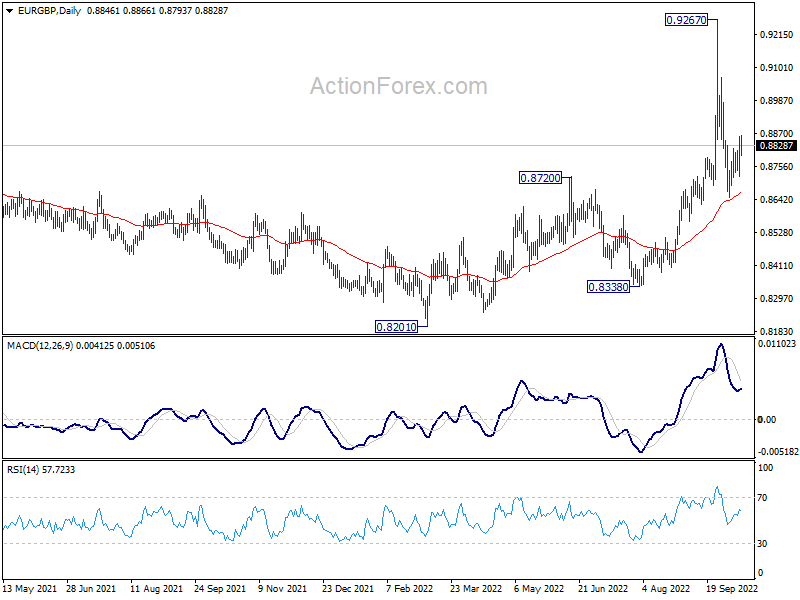
EUR/GBP's breach of 0.8848 minor resistance argues that pull back from 0.9267 might have completed at 0.8647 already, supported above 55 day EMA. Intraday bias is mildly on the upside for retesting 0.9267 high. Nevertheless, break of 0.8723 minor support will turn bias back to the downside for resuming the fall from 0.9267 through 0.8647.
In the bigger picture, as long as 0.8720 resistance turned support holds, rise from 0.8201 is seen as resuming larger up trend from 0.6935 (2015 low). Break of 0.9499 (2020 high) should be seen at a later stage. However, firm break of 0.8720 will argue that sideway pattern from 0.9499 is extending with another falling leg instead.
EUR/AUD Daily Outlook
Daily Pivots: (S1) 1.5403; (P) 1.5461; (R1) 1.5525; More...
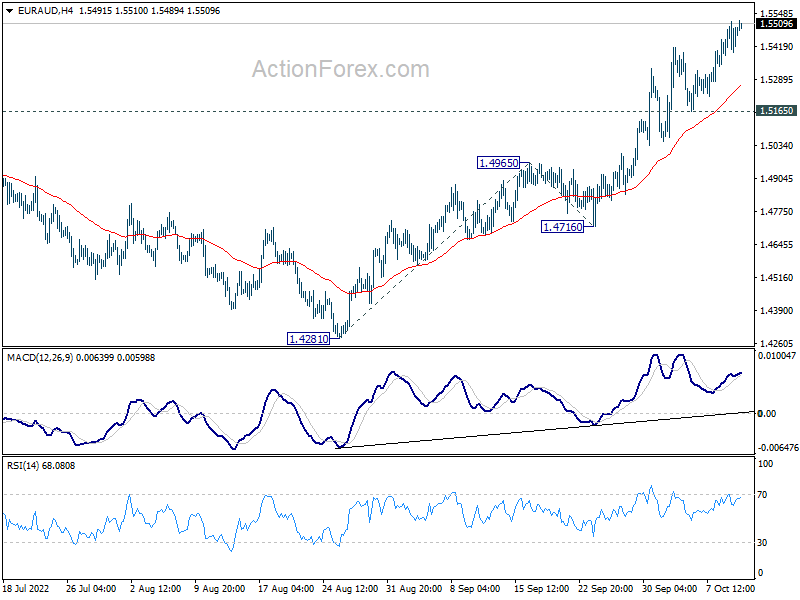
Intraday bias in EUR/AUD remains on the upside at this point. Current rally from 1.4281 should target 161.8% projection of 1.4281 to 1.4965 from 1.4716 at 1.5823. For now, outlook will remain bullish as long as 1.5165 support holds, in case of retreat.
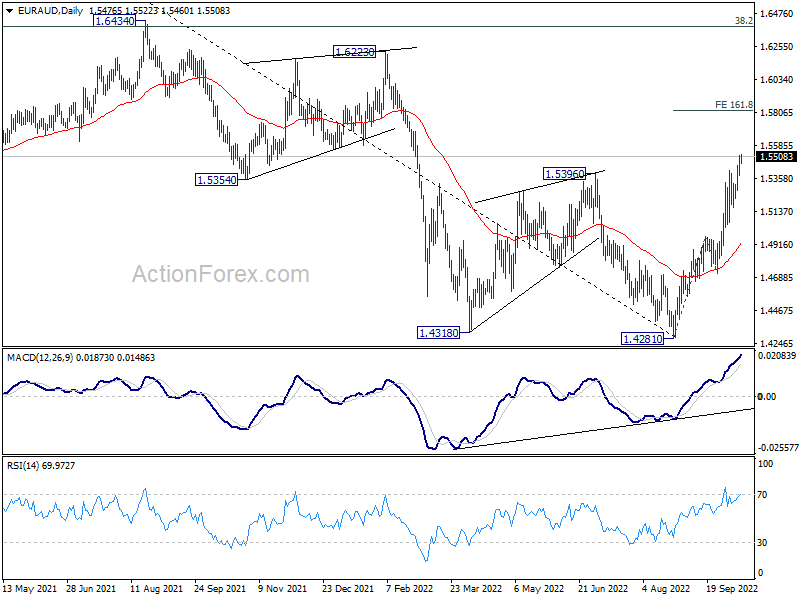
In the bigger picture, a medium term bottom should be in place at 1.4281, on bullish convergence condition in daily MACD. Further rise would be seen back to 1.6434 key resistance next. Break of 1.4965 resistance turned support is needed to indicate reversal. Otherwise, further rally will remain in favor.
EUR/CHF Daily Outlook
Daily Pivots: (S1) 0.9656; (P) 0.9686; (R1) 0.9703; More....
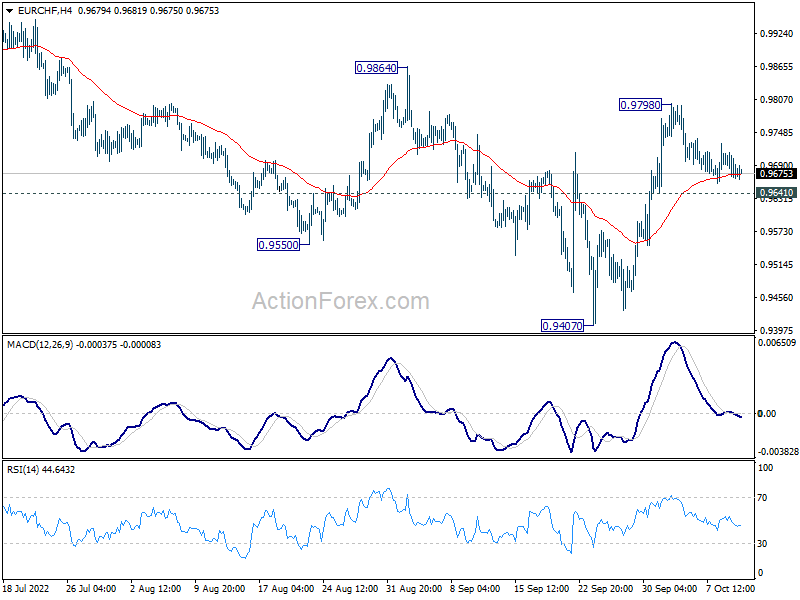
Intraday bias in EUR/CHF remains neutral at this point. On the upside, above 0.9798 will resume the rebound to 0.9864 resistance. Firm break there will solidify the case of medium term bottoming at 0.9407, and target 38.2% retracement of 1.1149 to 0.9407 at 1.0072. On the downside, below 0.9641 minor support will turn bias back to the downside for retesting 0.9407 low instead.
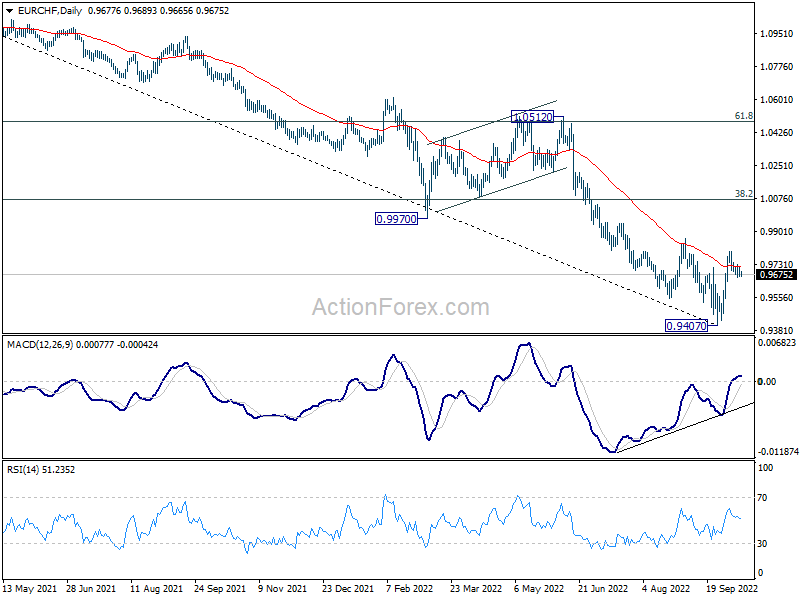
In the bigger picture, as long as 0.9864 resistance holds, long term down trend from 1.2004 (2008 high) is expected to continue. Next target is 138.2% projection of 1.2004 to 1.0505 to 1.1149 at 0.9033. However, firm break of 0.9864 will confirm medium term bottoming, on bullish convergence condition in daily MACD. Stronger rally would then be seen back to 55 week EMA (now at 1.0152), even as a corrective rebound.
Technical Outlook and Review
USD/JPY:
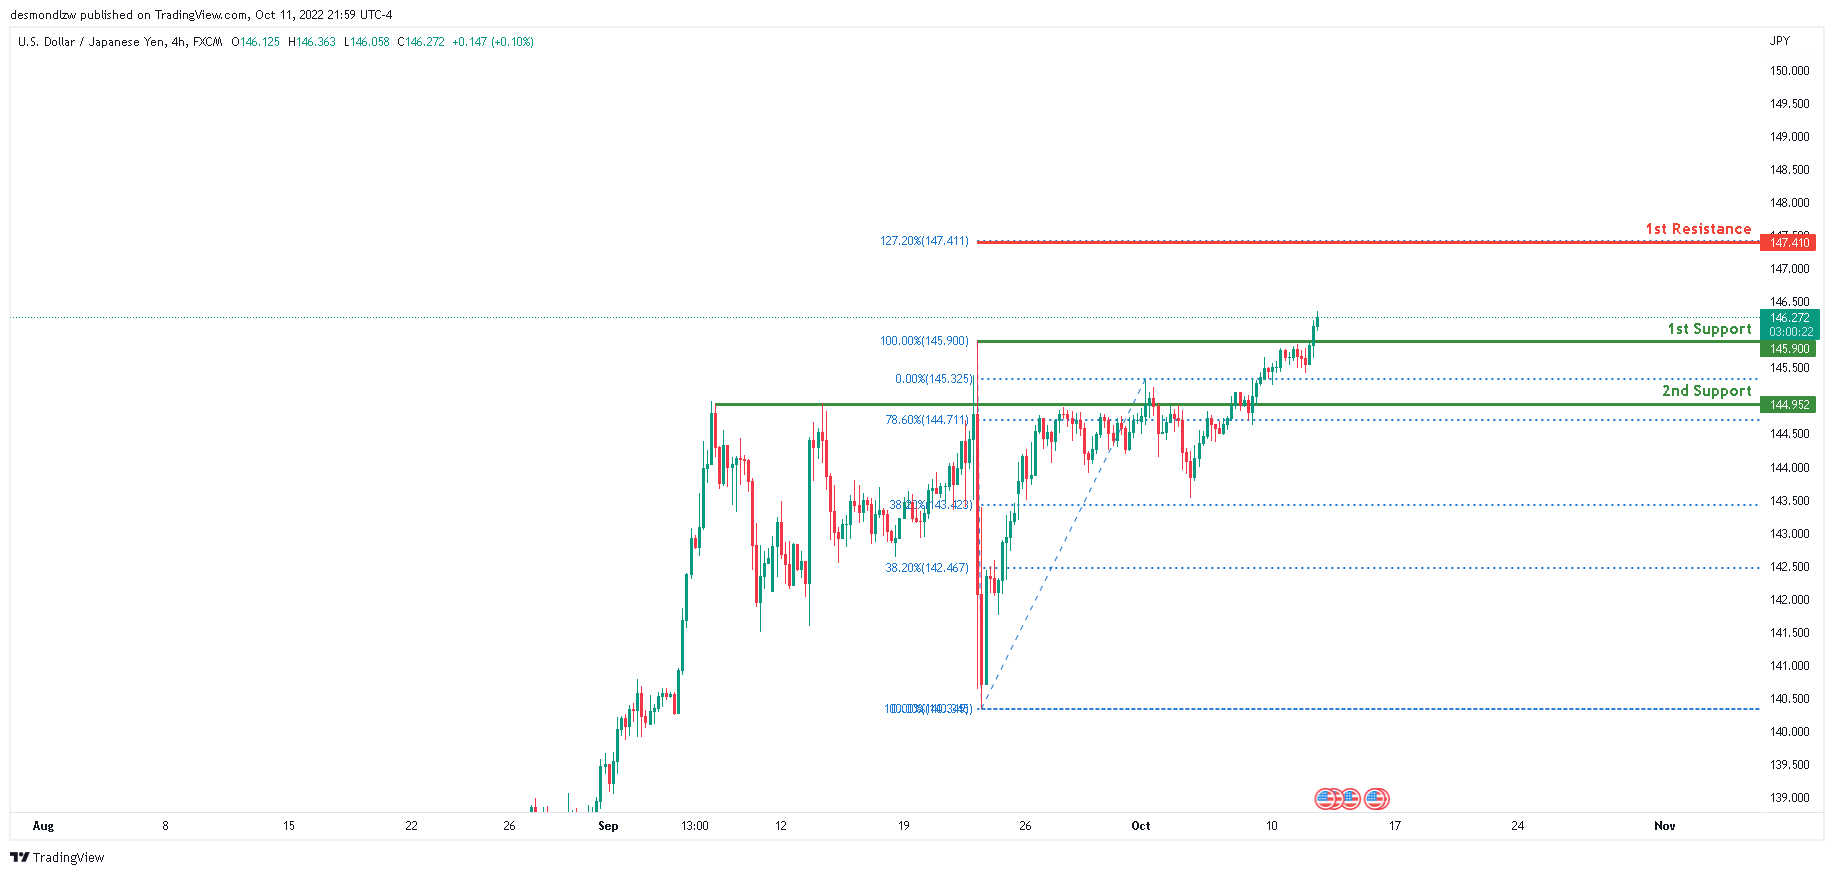
Looking at the H4 chart, the current overall bias for USDJPY is bullish . To add confluence to this bias, the price is currently above the Ichimoku cloud which indicates a bullish market. Overnight, the price has continued it’s bullish momentum upwards and closed above the 1st support line at 145.900 where the 100% Fibonacci line is located. If the bullish momentum continues, expect price to possibly head towards the 1st resistance line at 147.410, where the 127.2% Fibonaaci extension line is located.
Areas of consideration:
- H4 time frame, 1st resistance at 147.410
- H4 time frame, 1st support at 145.900
DXY:
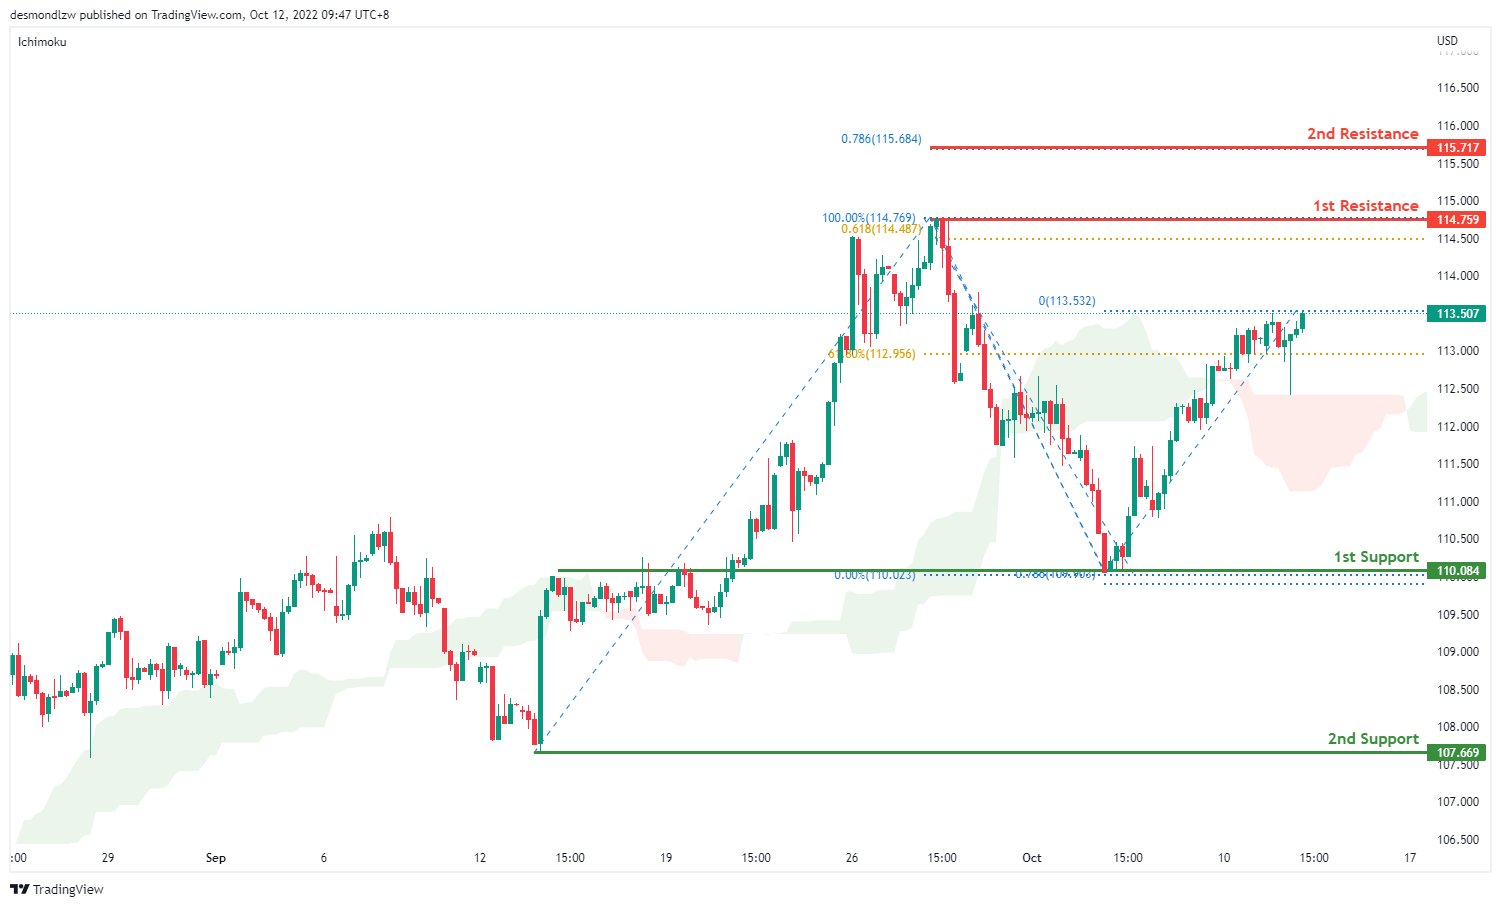
On the H4 chart, prices are moving in an ascending trend signalling slight bullish momentum. It is currently moving towards the first resistance at 114.759 where the previous swing high sits. If bullish momentum continues it will bring price to 115.717 where the 78.6% projection. Alternatively, prices could test the first support at 110.084 where the swing low sits. if it breaks this level, bearish momentum will bring price to second support at 107.669
Areas of consideration:
- H4 time frame, 1st resistance at 114.759
- H4 time frame, 1st support at 110.084
EUR/USD:
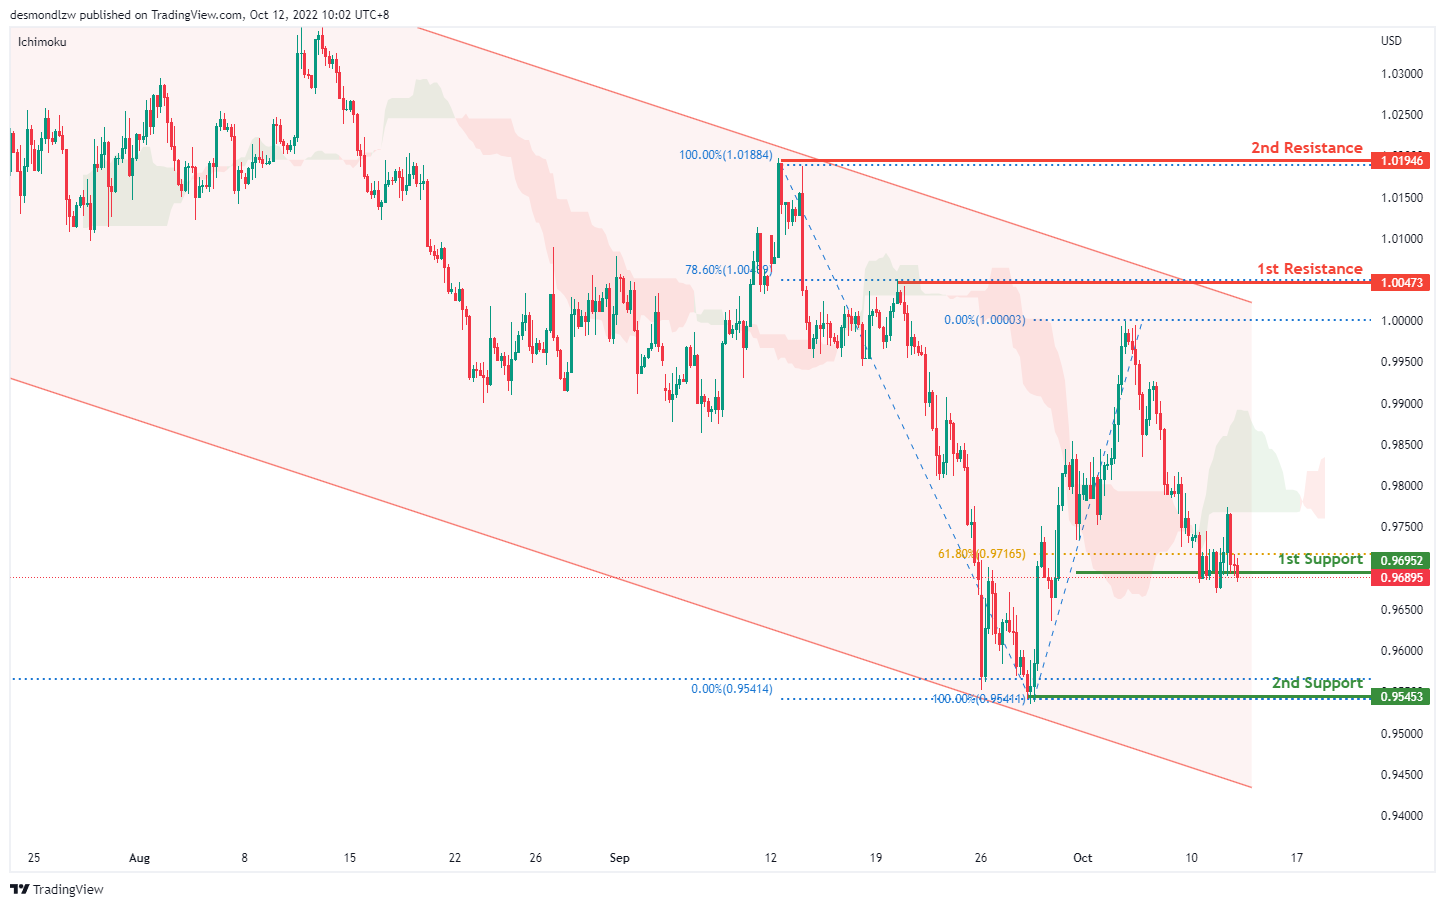
On the H4, price is moving within the descending trendline in a descending manner, with the price moving below ichimoku cloud- we are bearish biassed. Price is testing the first support at 0.9695 where the 61.8% retracement sits. If it breaks this level, bearish momentum will bring price to the second support at 0.9545 where the swing low and 161.8% extension sit. Alternatively, price may test the first resistance at 1.0047 where the 78.6% retracement sits. If price breaks this level, it may test the second resistance at 1.0194, where the previous swing high sits
Areas of consideration :
- H4 1st resistance at 1.0047
- H4 2nd resistance at 1.0194
GBP/USD:
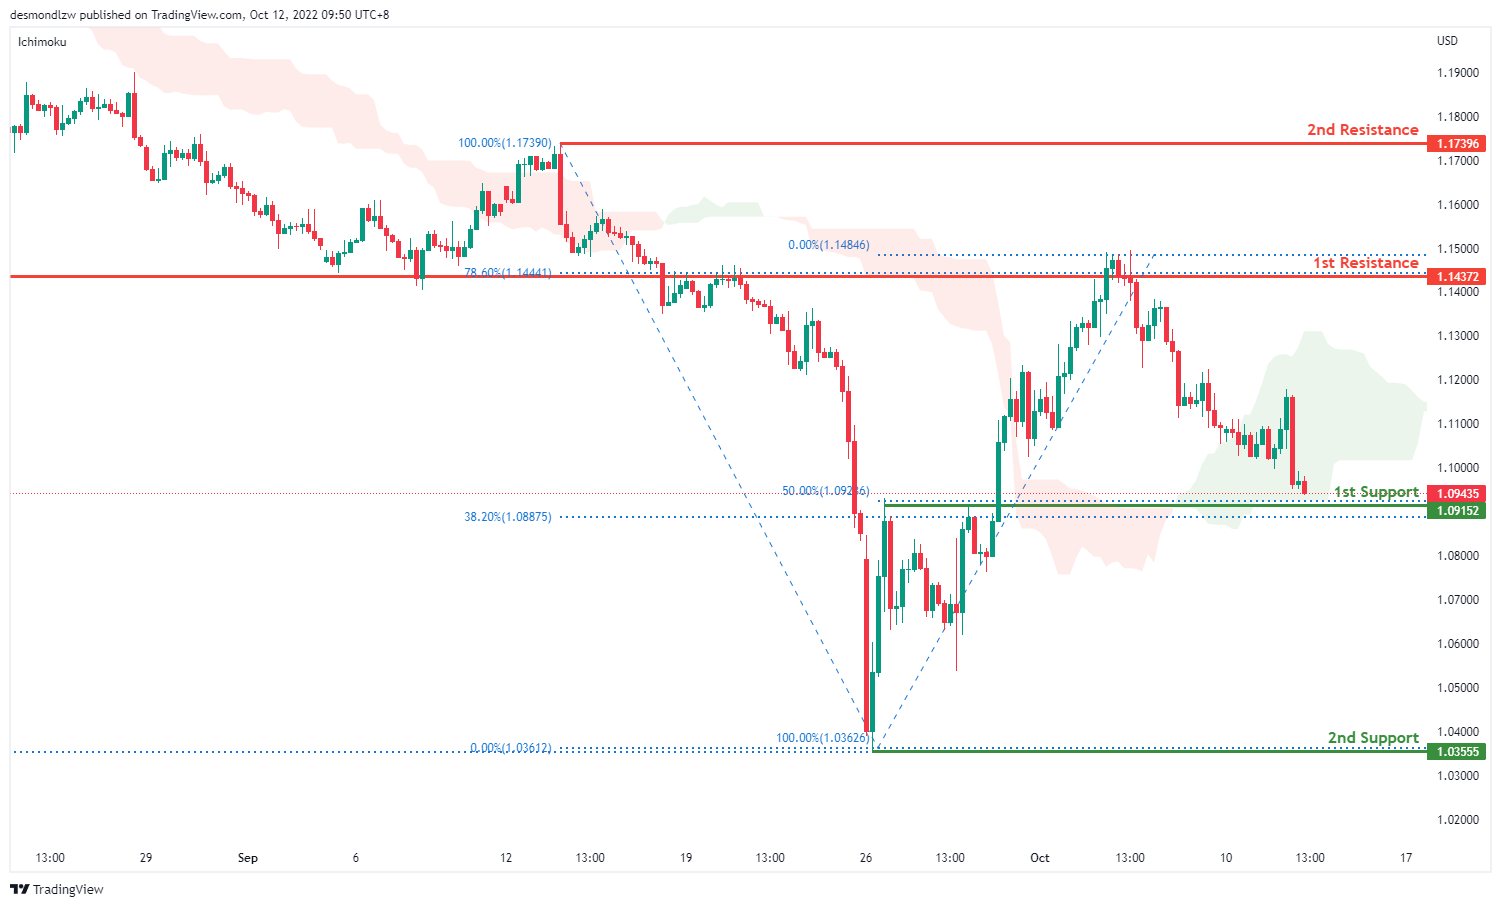
On the H4, price has rejected the first resistance and is moving in a descending trend hence we are bearish bias- price might break the ichimoku to test the first support at 1.0915 where the 50% retracement sits. If it breaks this level, bearish momentum will bring price to the second support at 1.0355 where the previous swing low sits. Alternatively price can test the first resistance at 1.1437 where the 78.6% retracement and overlap resistance sit. Subsequently the second resistance at 1.1739
Areas of consideration:
- H4 1st support at 1.0915
- H4 1st resistance at 1.1437
USD/CHF:
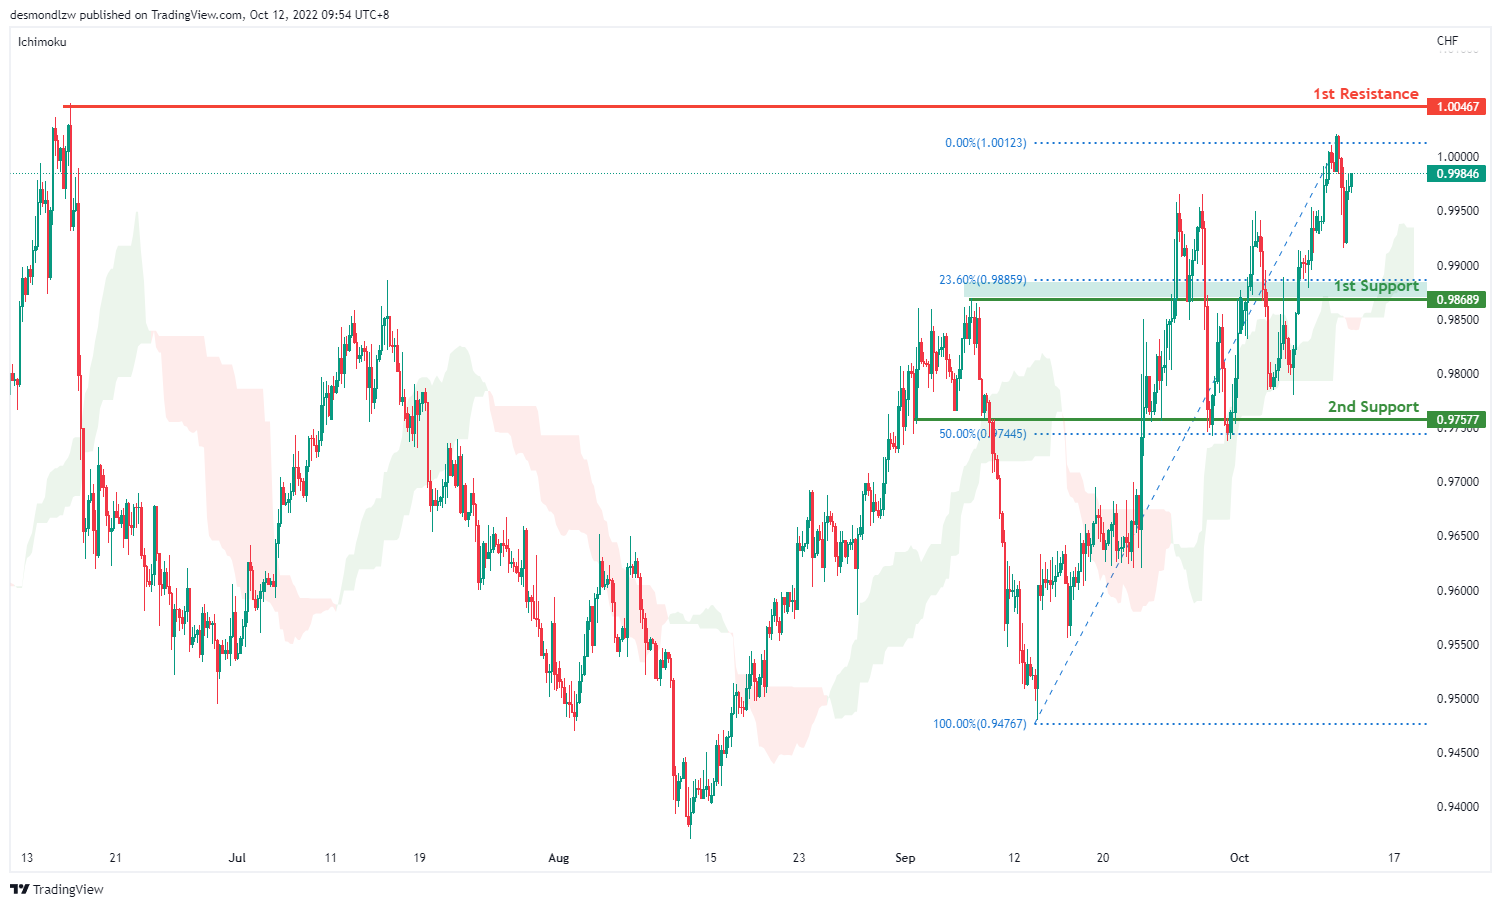
USDCHF is in a strong bullish trend on the H4 chart. Price is trading above the Ichimoku cloud signalling a bullish trend. Price looks like it’s moving toward the first resistance 1.0046 where the previous swing high sits. Alternatively price can test the first support at 0.9868 where the overlap support and 23.6% retracement sits then the second support at 0.9757 where the 50% retracement sits
Areas of consideration
- H4 1st support at 0.9868
- H4 1st resistance at 1.0046
XAU/USD (GOLD):
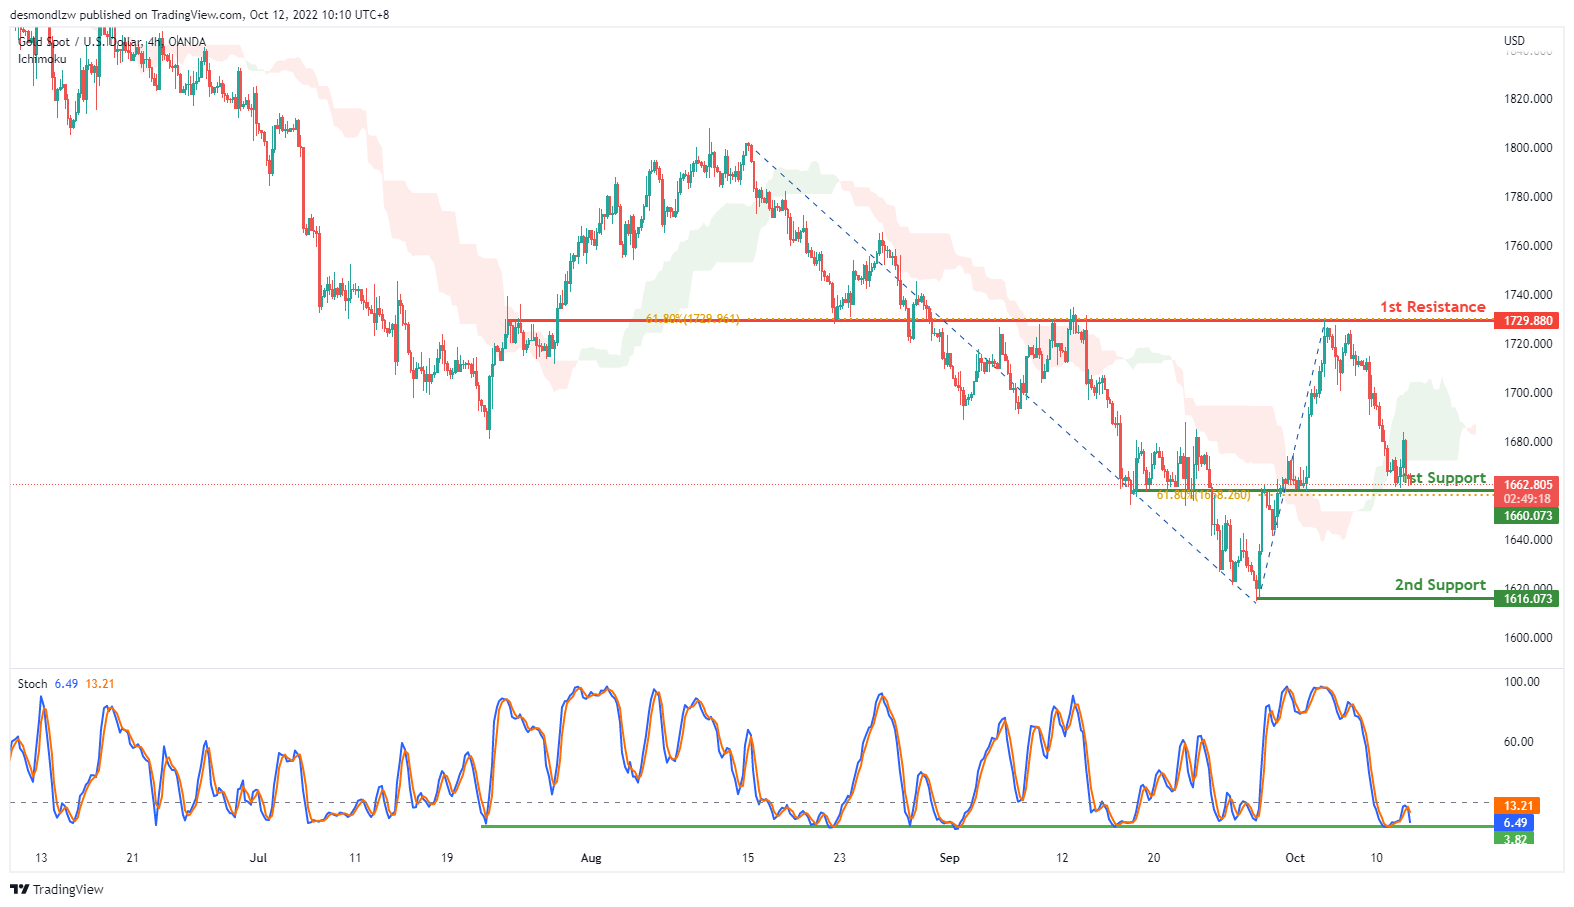
On the H4, price is dropping to test the 1st support at 1662.925, which is in line with the 61.8% fibonacci retracement and overlap support, as the price is above ichimoku cloud and stoch is reaching support level , we can expect the price bounce off from 1st support and rise to the 1st resistance at 1729.880, where the 61.8% fibonacci retracement and previous swing high is. Alternatively, the price may break the 1st support and drop to the 2nd support at 1616.073, where the swing low is.
Areas of consideration:
- H4 time frame, 1st support at 1662.925
- H4 time frame,1st resistance at 1729.880
AUD/USD:
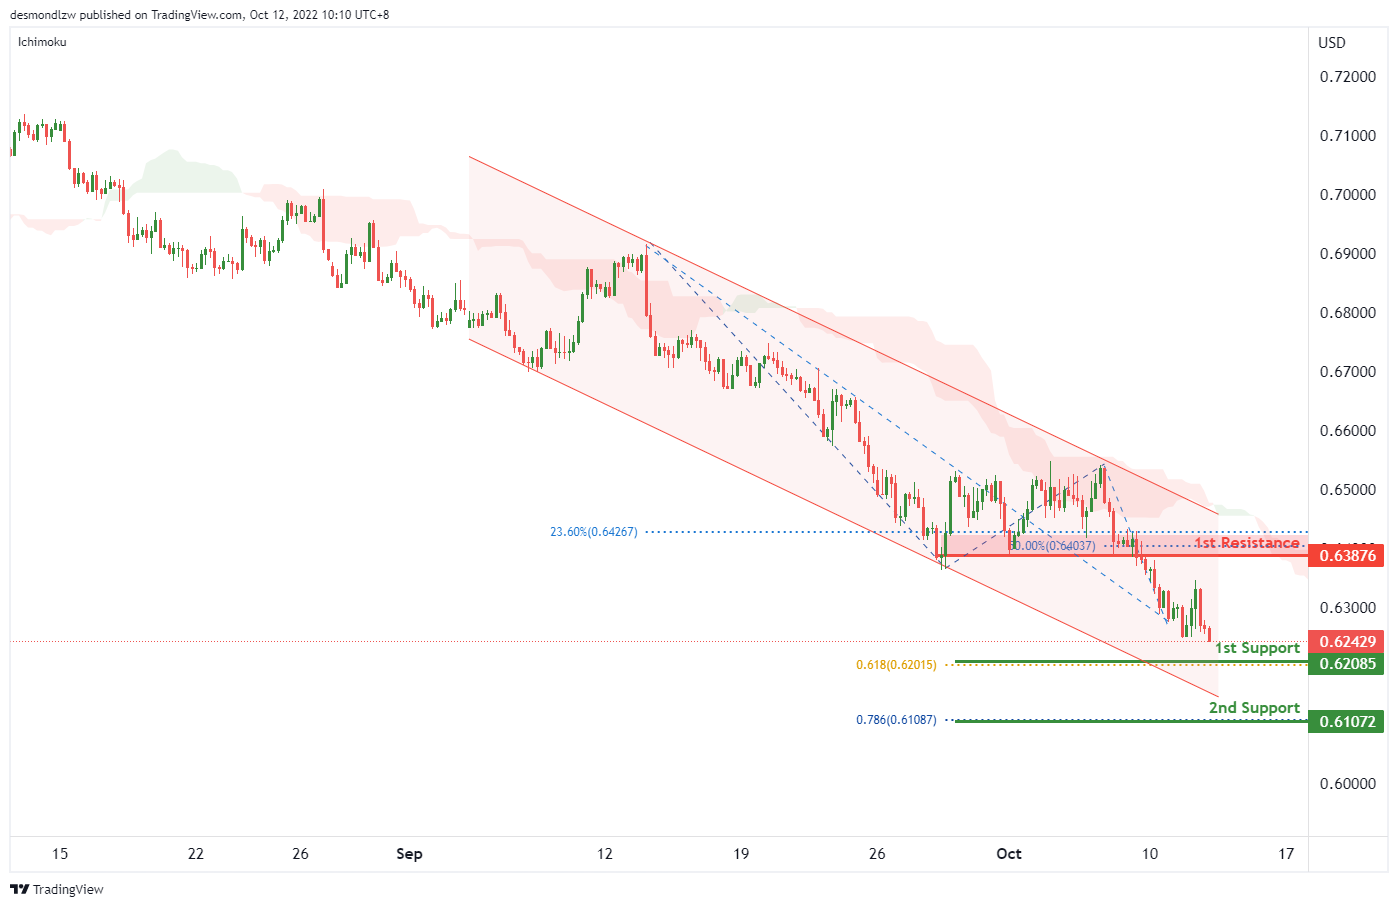
On the H4, the price is moving within the descending channel and below ichimoku cloud, we have a bearish bias that the price may drop to the 1st support at 0.62085, which is in line with the 61.8% fibonacci projection. If the 1st support is broken, the 2nd support could be at 0.61072, where the 78.6% fibonacci projection is. Alternatively, the price may rise to the 1st resistance at 0.63876, which is in line with the 23.6% fibonacci retracement and 50% fibonacci retracement.
Areas of consideration
- H4, 1st support at 0.63509,
- H4, 2nd support at 0.61072
NZD/USD:
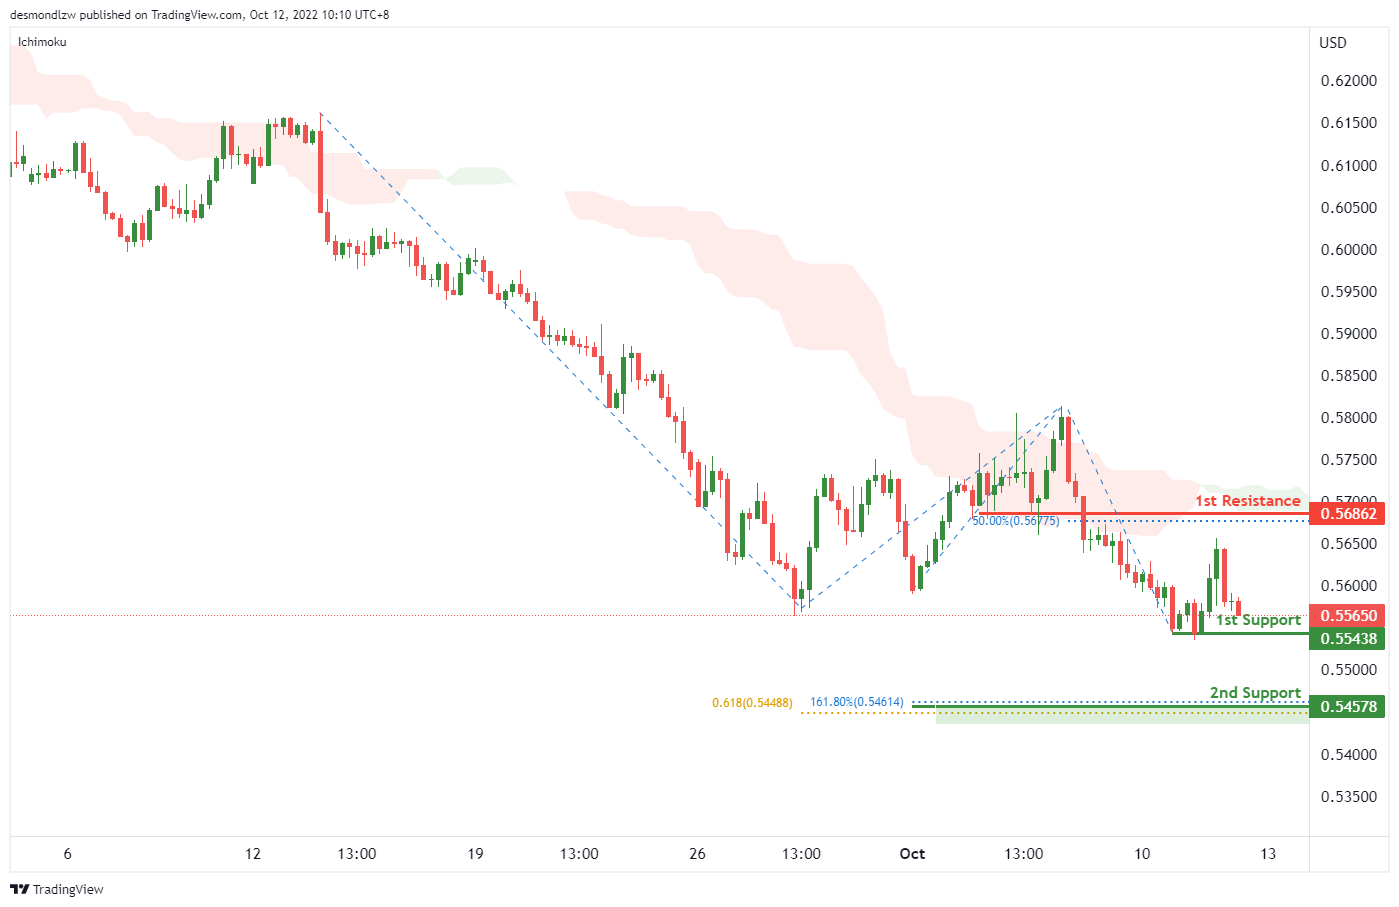
On the H4, the price is below ichimoku cloud and testing the 1st support at 0.55438, which is in line with the swing low, if the 1st support is broken, the price may drop to the 2nd support at 0.54578, which is in line with the 161.8% fibonacci extension and 61.8% fibonacci projection. ALternatively, the price may bounce off from the 1st support and rise to the 1st resistance at 0.56862, where the 50% fibonacci retracement is.
Areas of consideration:
- H4 time frame, 1st support at 0.55438
- H4 time frame, 2nd support at 0.54578
USD/CAD:
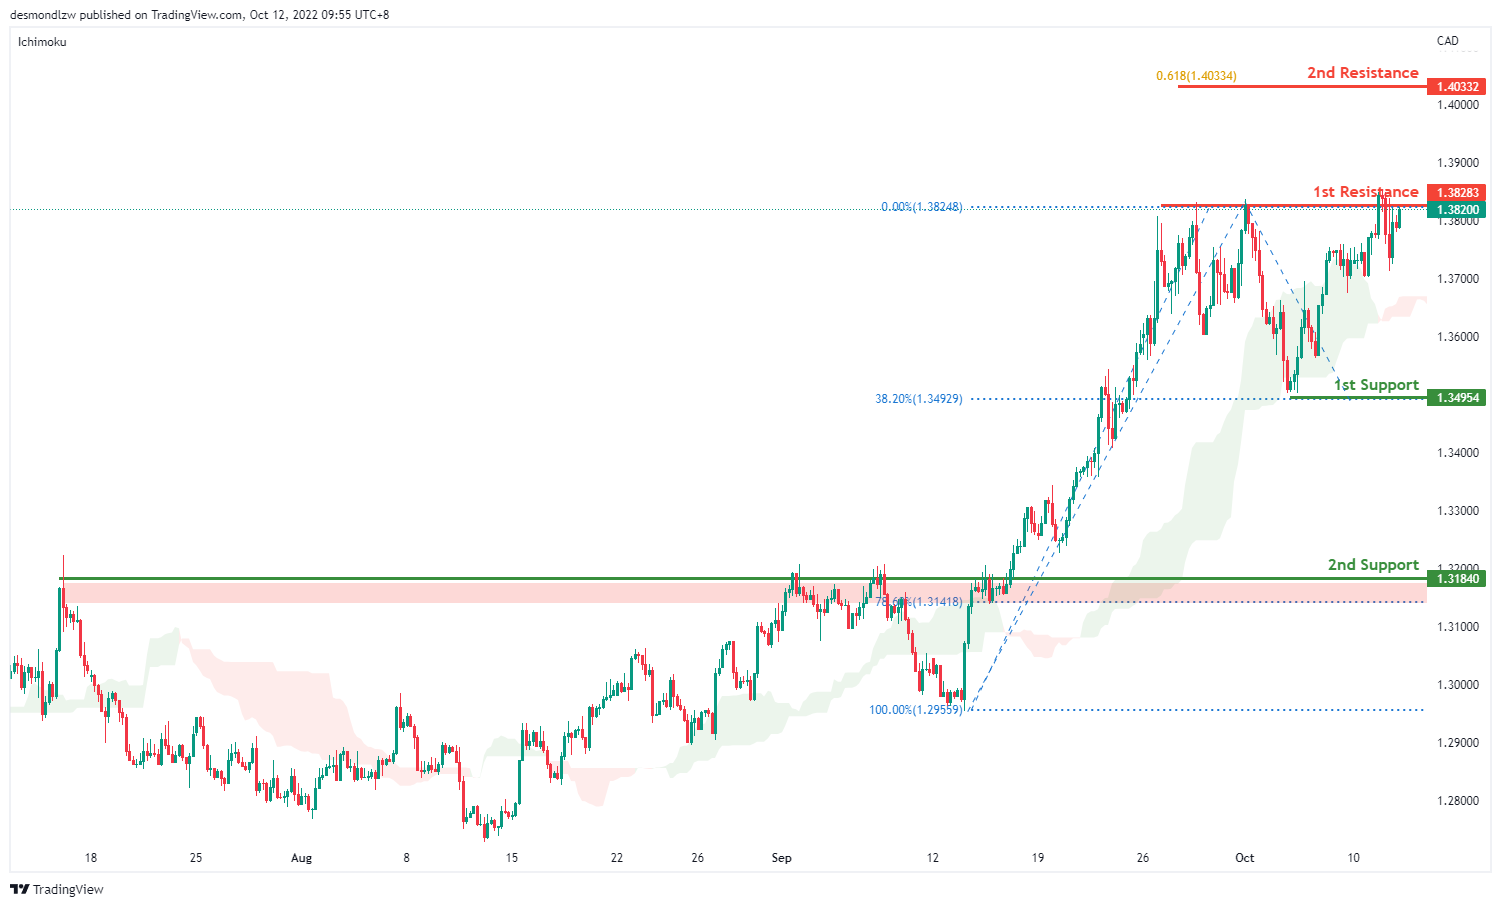
On the H4, the price trades higher near the 1st resistance of 1.3832 which is the previous swing high level. With the price trading above the ichimoku cloud, we have a short term bullish bias. The price could break the first resistance to test the second resistance at 1.4033 where the 61.8% projection sits. Alternatively it could fall to the 1st support at 1.3495 which is in line with the 38.2% retracement level and the previous swing low subsequently the second support at 1.3184 where the overlap support sits
Areas of consideration:
- H4 time frame, 1st resistance at 1.3828
- H4 time frame, 1st support at 1.3495
OIL:
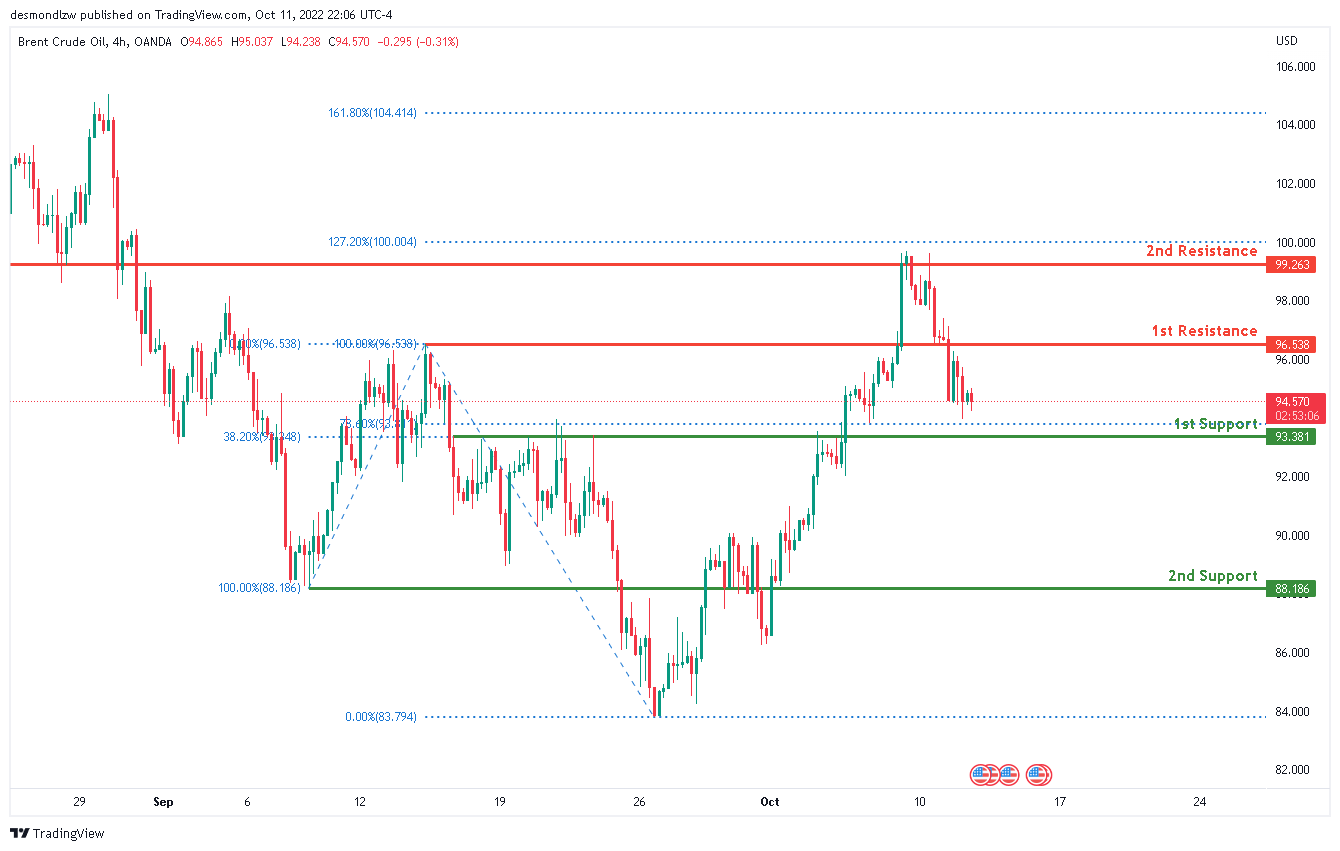
Looking at the H4 chart, the current overall bias for Oil is bullish . To add confluence to this bias, the price is currently above the Ichimoku cloud which indicates a bullish market. Overnight, price has continued it’s bearish retraced backdownards.. If the bearish momentum continues, expect price to possibly head towards the 1st support line at 93.381, where the 78.6% Fibonaaci line and 38.2% Fibonaaci line is located.
Areas of consideration:
- H4 time frame, 1st resistance at 96.538
- H4 time frame, 1st support at 93.381
Dow Jones Industrial Average:
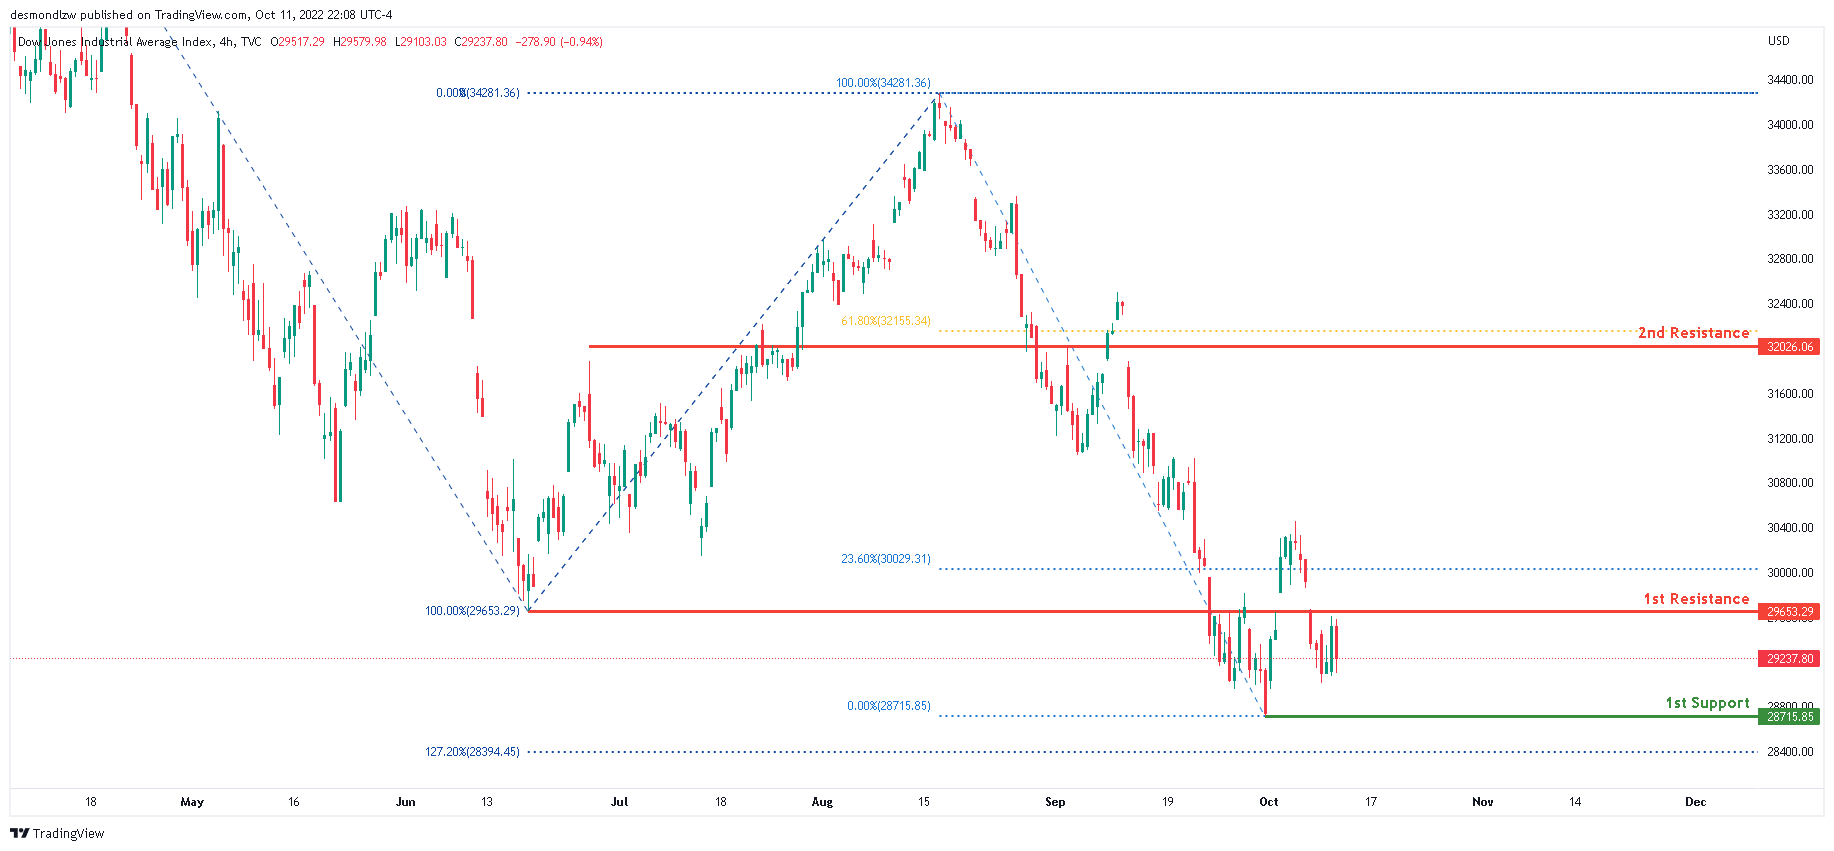
Looking at the H4 chart, the current overall bias for DJI is bearish. To add confluence to this bias, the price is currently below the Ichimoku cloud which indicates a bearish market. Overnight, price has continued to consolidate between the 1st support and 1st resistance. If the bearish momentum continues, expect price to possibly head towards the 1st support line at 28715.85, where the 0% Fibonacci line and 127.2% Fibonacci extension line is located.
Areas of consideration:
- H4 time frame, 1st support at 28715.85
- H4 time frame, 1st resistance at 29653.29
DAX:
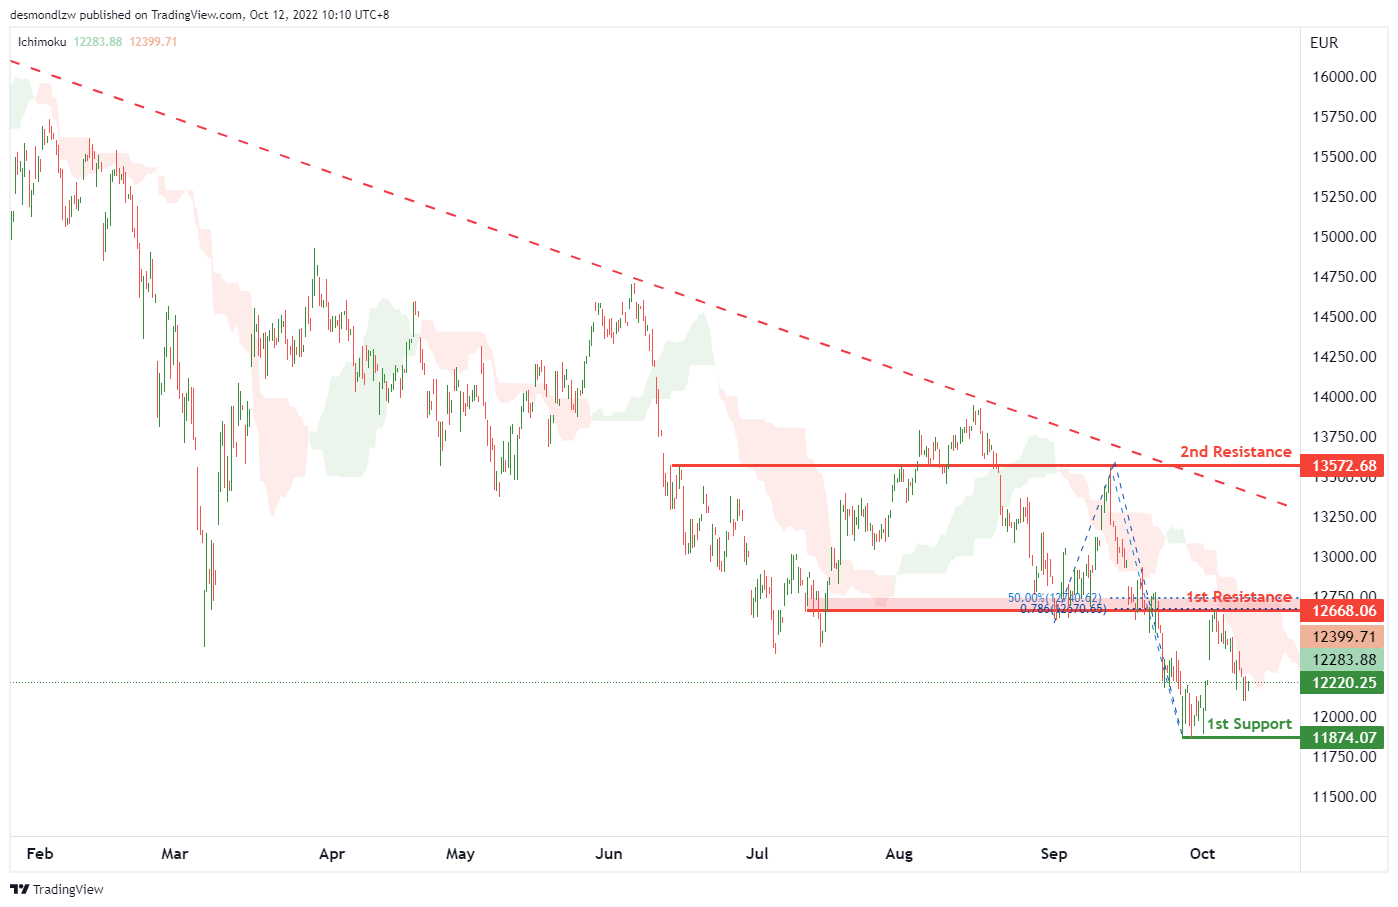
On the H4, with the price moving below ichimoku cloud and long term descending trendline, we have a bearish bias that the price may drop to the 1st support at 11874.07, which is in line with the swing low. Alternatively, the price may rise to the 1st resistance at 12668.06, which is in line with the 50% fibonacci retracement, 78.6% fibonacci projection and overlap resistance, if the 1st resistance is broken, the 2nd resistance could be at 13572.68, where the previous swing high is.
Areas of consideration:
- H4 time frame, current price
- H4 time frame, 1st support at 11874.07
ETHUSD:
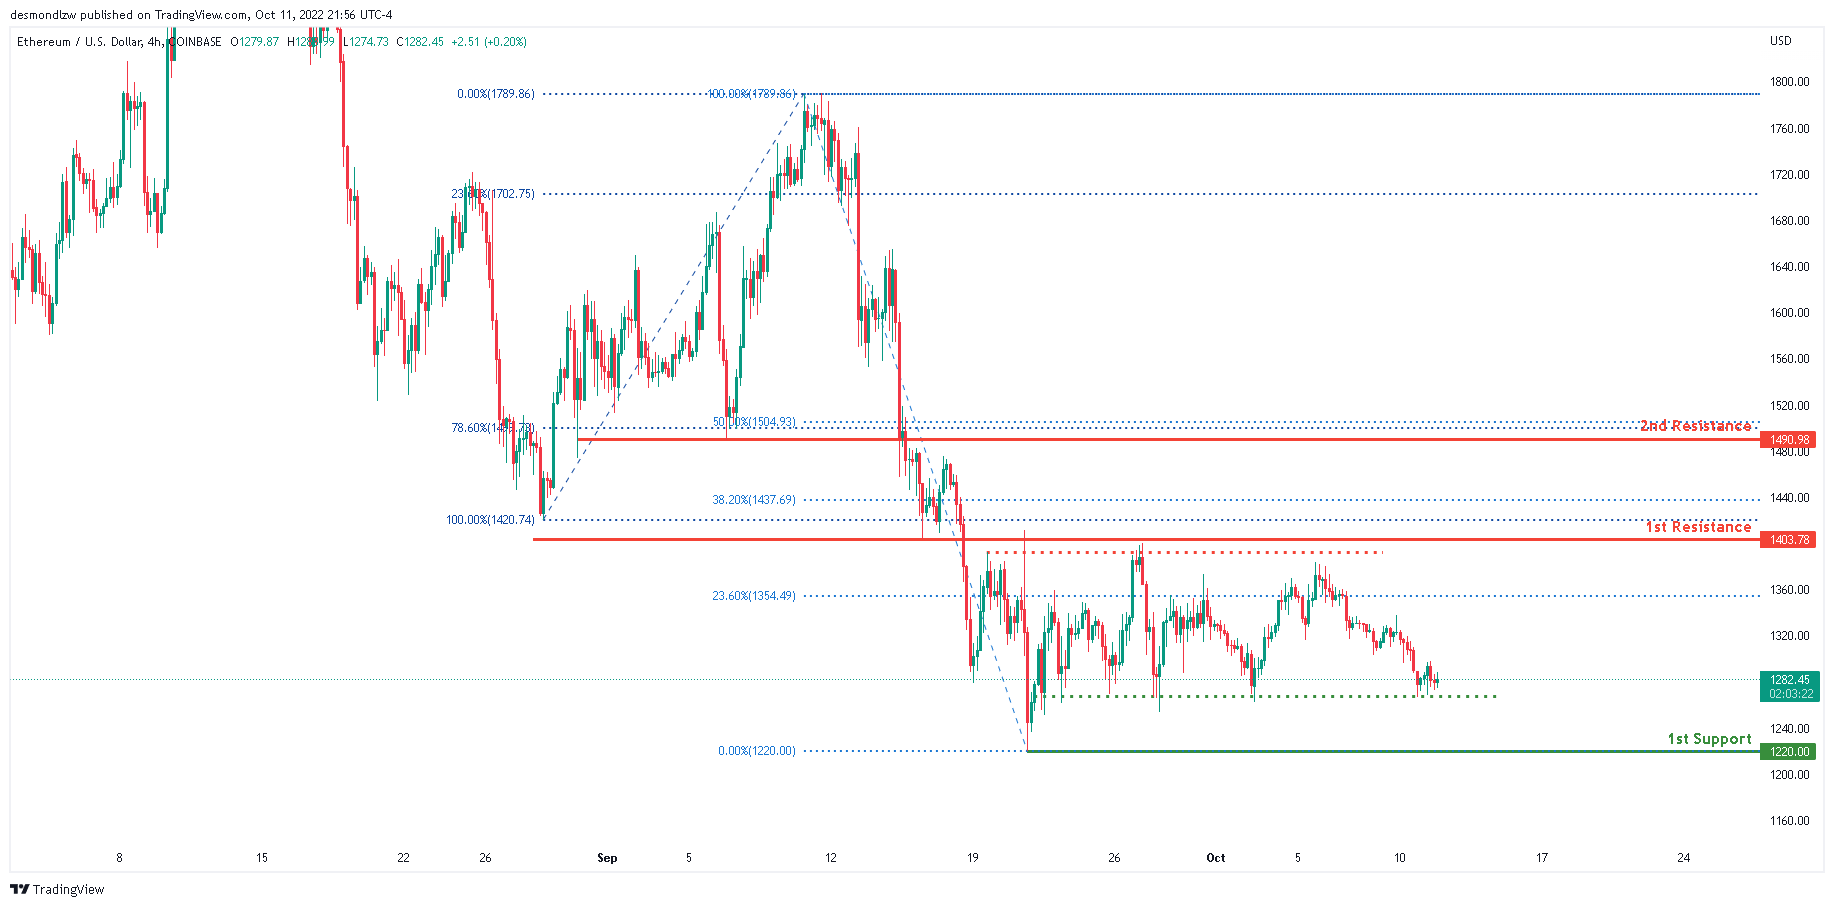
Looking at the H4 chart, the current overall bias for ETHUSD is bearish. To add confluence to this bias, the price is currently under the Ichimoku cloud which indicates a bearish market. Overnight, the price has continued it’s bearish momentum downwards. Price has been consolidating between the 1403 and 1220 area for the past 3 weeks. If the bearish momentum continues, expect price to possibly head towards the 1st support line at 1220.00, where the 0% Fibonaaci line is located.
Areas of consideration:
- H4 time frame, 1st resistance of 1420.74
- H4 time frame, 1st support at 1220.00
BTCUSD:
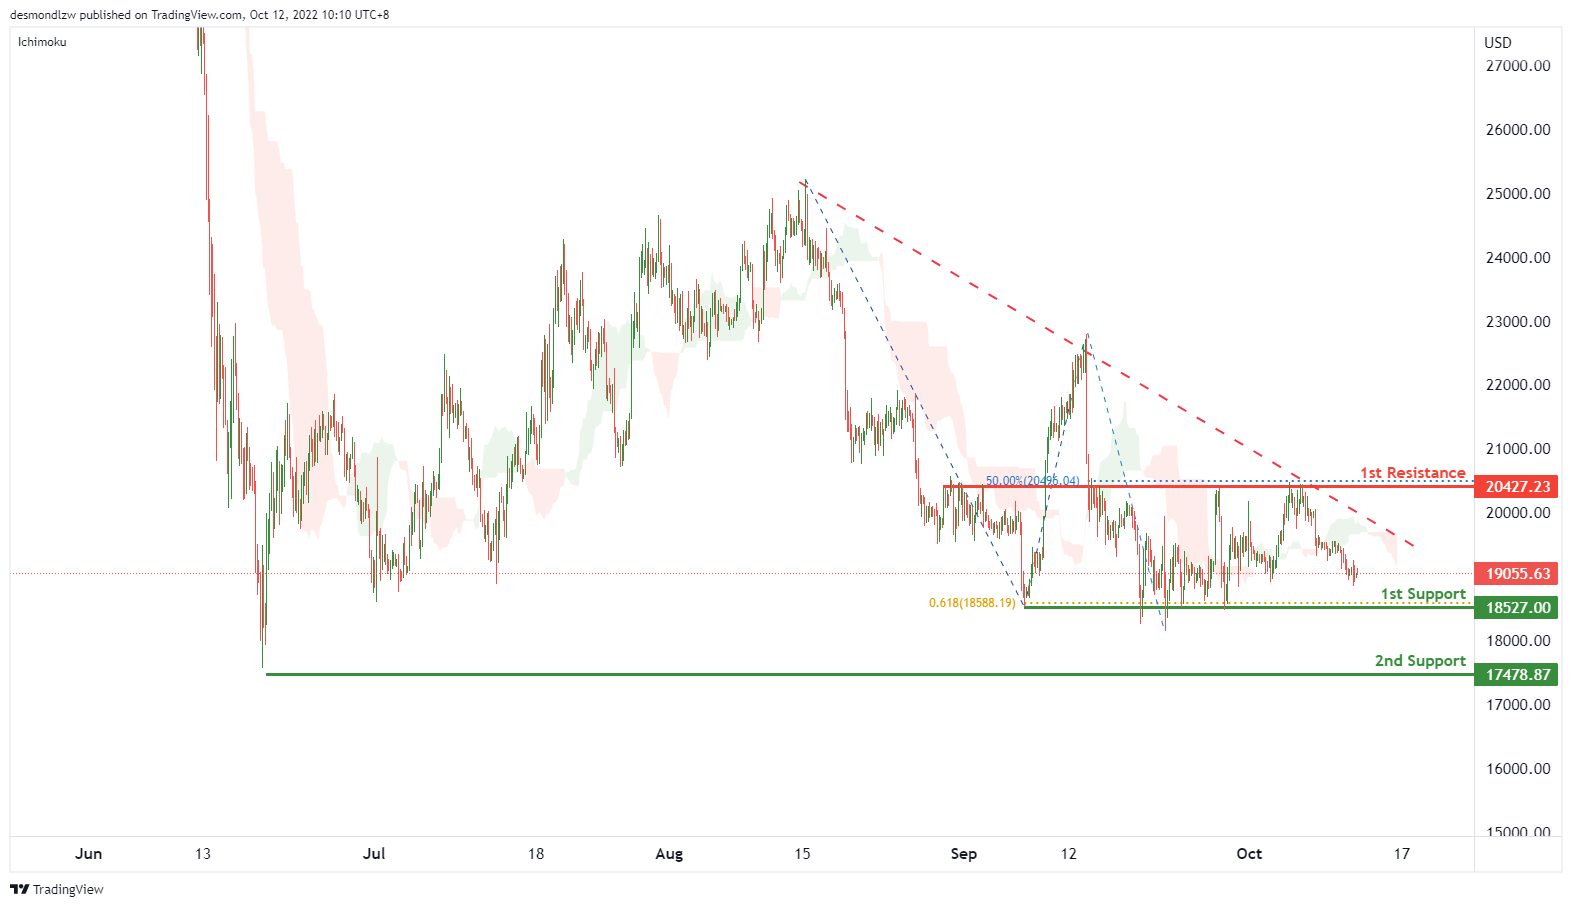
On the H4, price is showing a descending trendline and below the ichimoku cloud, we can expect the price drop to test the 1st support at 18527.00, which is in line with the swing lows and 61.8% fibonacci projection. If the 1st support is broken, we can expect the price to drop to the 2nd support at 17478.87, where the previous swing low is. Alternatively, the price may rise to the 1st resistance at 20427.23, where the overlap resistance and 50% fibonacci retracement are.
Areas of consideration:
- H4 time frame, 1st support at 18527.00
- H4 time frame, 2nd support at 17478.87
S&P 500:
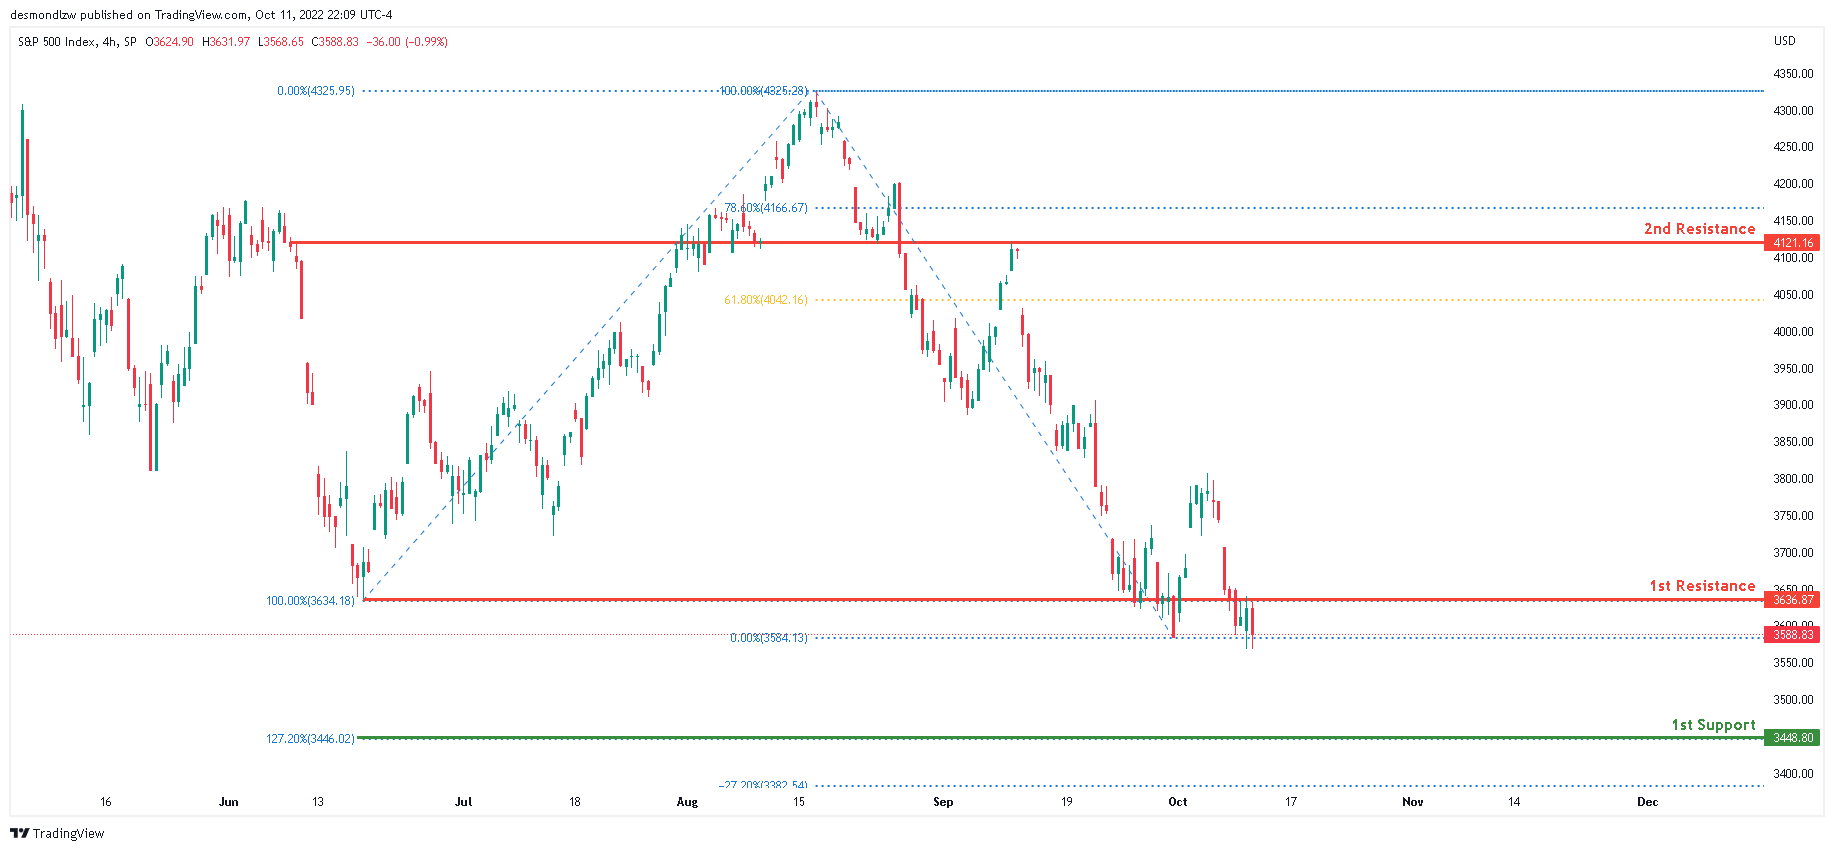
Looking at the H4 chart, the current overall bias for S&P500 is bearish. To add confluence to this bias, the price is currently under the Ichimoku cloud which indicates a bearish market. Overnight, the price has continued to consolidate under the 1st resistance line at 3636.87, where the 100% Fibonacci line and previous swing low is located. If the bearish momentum continues, expect price to possibly head towards the 1st support line at 3448.80, where the 127.2% Fibonaaci line is located.
Areas of consideration:
- H4 time frame, 1st support at 3448.80
- H4 time frame, 1st resistance at 3636.87
USD/CAD Daily Outlook
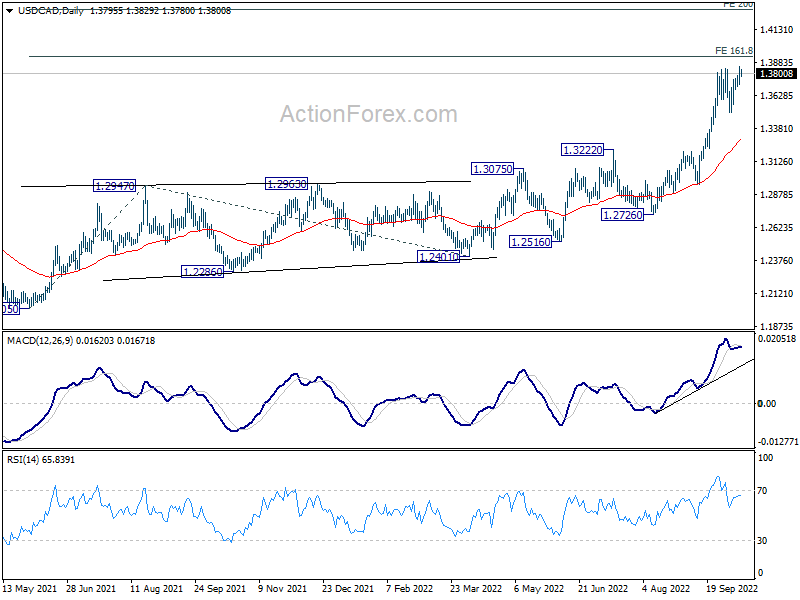
Daily Pivots: (S1) 1.3722; (P) 1.3788; (R1) 1.3862; More...
Intraday bias in USD/CAD stays on the upside with 1.3701 minor support intact. Current up trend should target 161.8% projection of 1.2005 to 1.2947 from 1.2401 at 1.3925. Decisive break there will target 200% projection at 1.4285. On the downside,e below 1.3701 minor support will turn intraday bias neutral first. but outlook will stays bullish as long as 1.3501 support holds, in case of retreat.
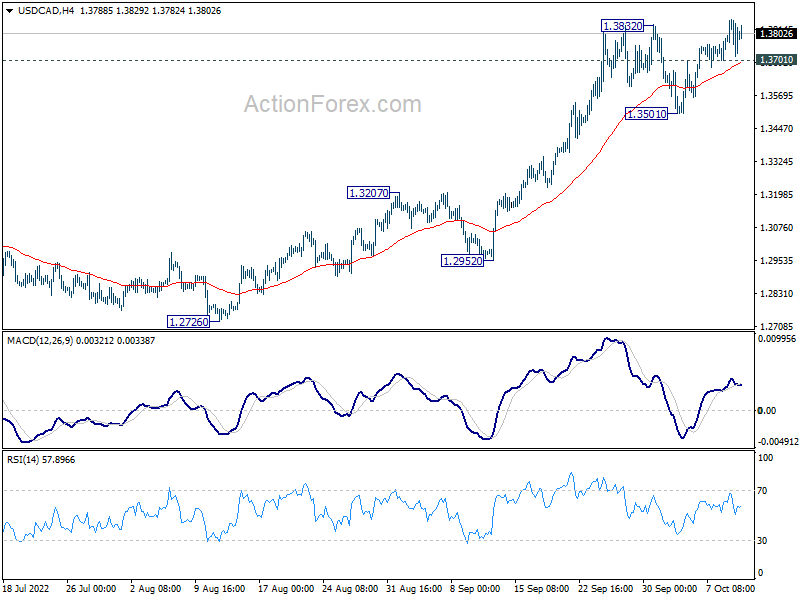
In the bigger picture, up trend from 1.2005 (2021 low) is still in progress. Based on current impulsive momentum, it could be resuming long term up trend from 0.9056 (2007 low). Whether it is or it isn't, retest of 1.4689 (2016 high) should be seen next. This will now remain the favored case as long as 1.3222 resistance turned support holds.