

Sample Category Title
USDJPY Fails Several Times to Jump Above 145.00
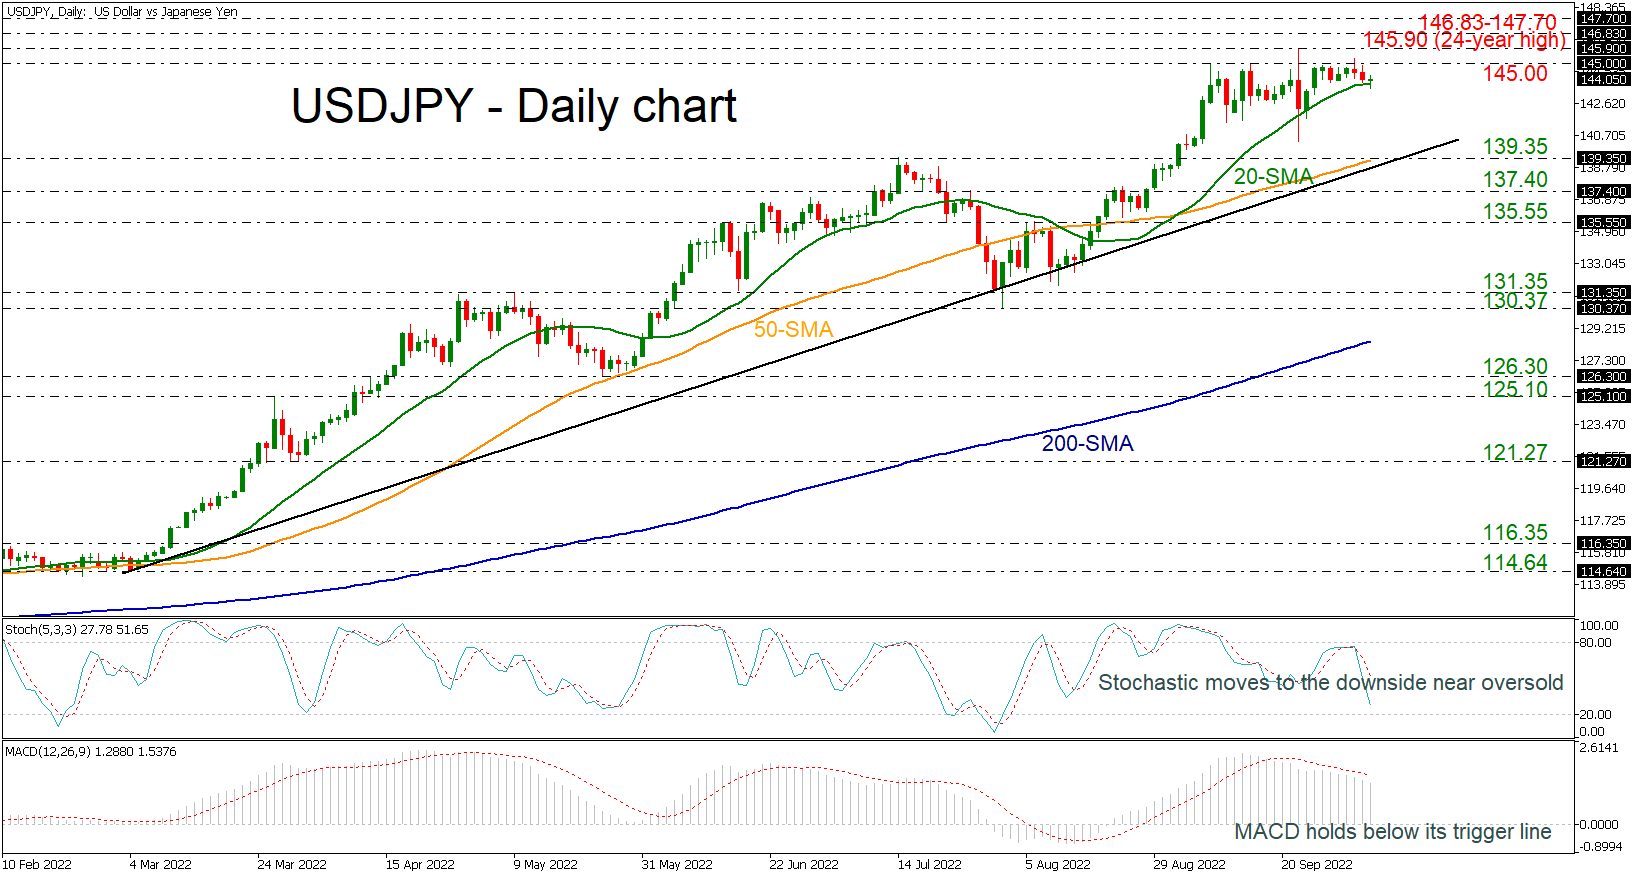
USDJPY is struggling to surpass the 145.00 psychological mark and have a closing day above it, switching the short-term picture from bullish to neutral.
The technical oscillators are suggesting a bearish move as the stochastic is moving towards the oversold zone, while the MACD is standing beneath its trigger line. The 20-day simple moving average (SMA) is acting as a strong support level and any bearish movements may push the market towards the long-term ascending trend line.
More declines may challenge the 50-day SMA near the 139.35 barrier and a break beneath these lines could open the way for the 137.40 and 135.55 barrier, changing the outlook to negative.
On the other hand, a successful climb above the 145.00 round number could add to the optimism for a retest of the previous peak of 145.90, which is a 24-year high. If buying interest intensifies then the pair may move towards the 146.83-147.70 restrictive zone.
All in all, USDJPY has been in a consolidation area since September 7; however, the broader outlook remains strongly bullish.
Nasdaq 100 Breaks Resistance
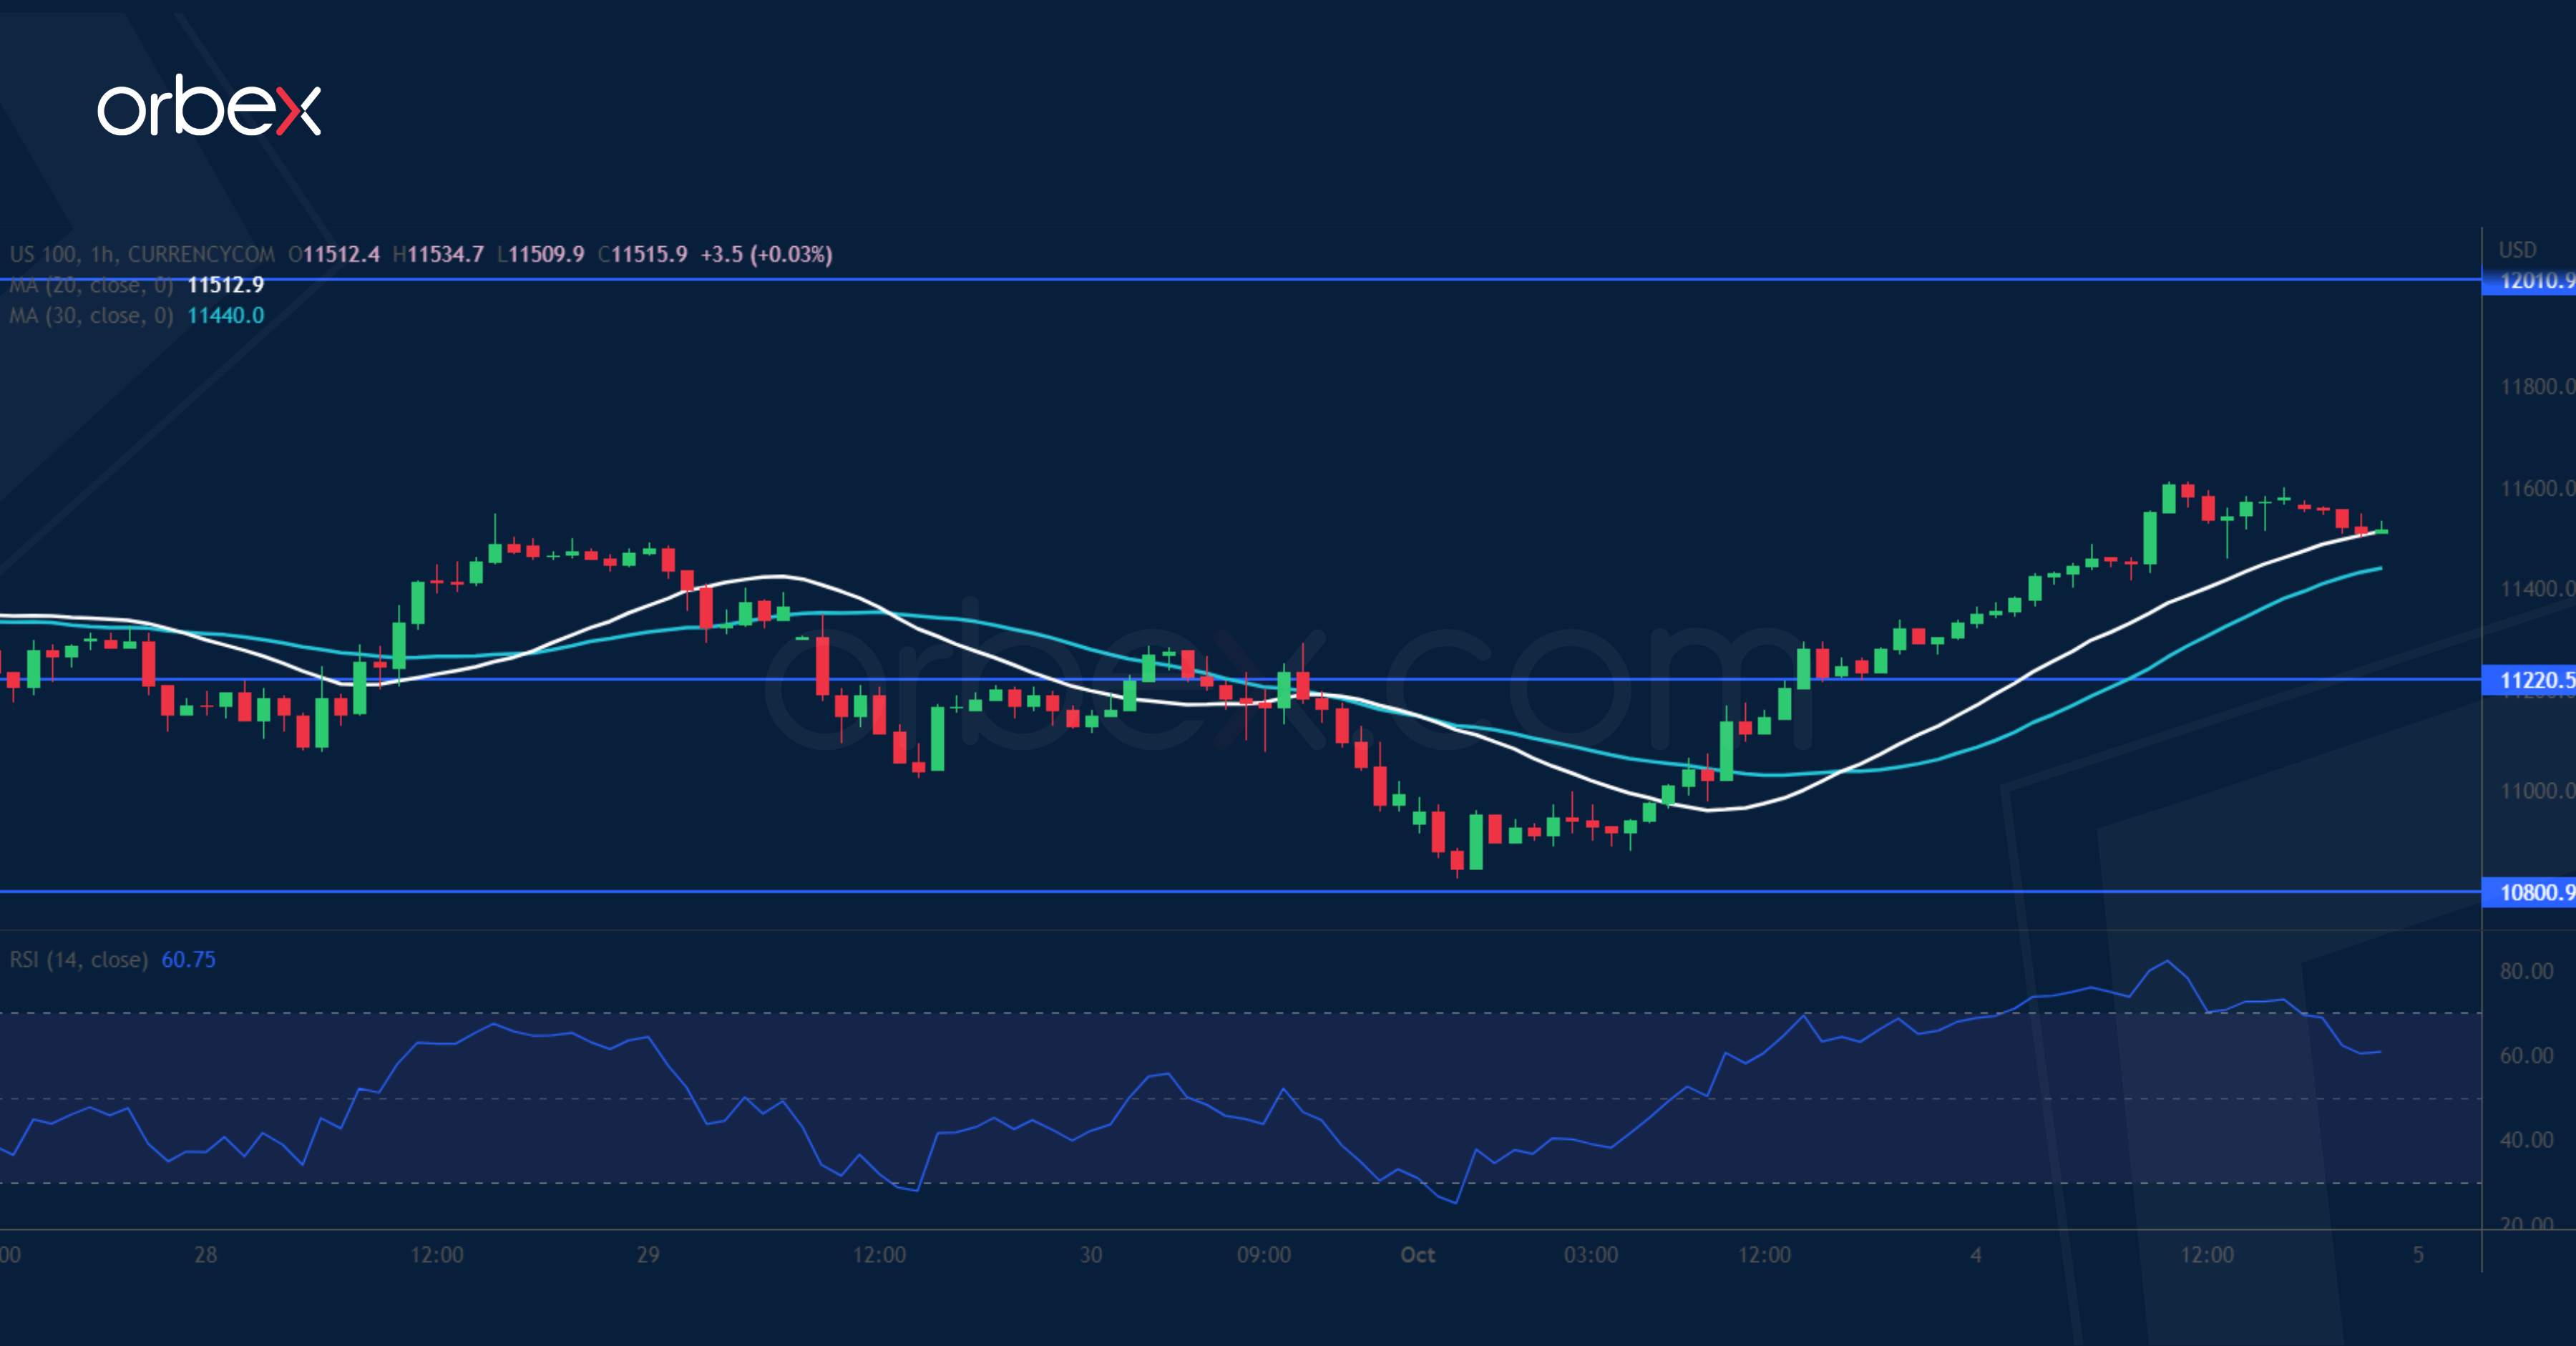
The Nasdaq 100 climbed after a decline in US job openings in August. The index bounced off a two-year low (10800) and a close above 11300 prompted short-term sellers to cover their positions. A rally above 11500 would further squeeze the short side and amplify the volatility. The support-turned-resistance 12010 near the 30-day moving average is a major congestion area where stiff selling could be expected. A failure to break free would indicate that the path of least resistance is still down with 11220 as a fresh support.
NZD/USD Finds Support
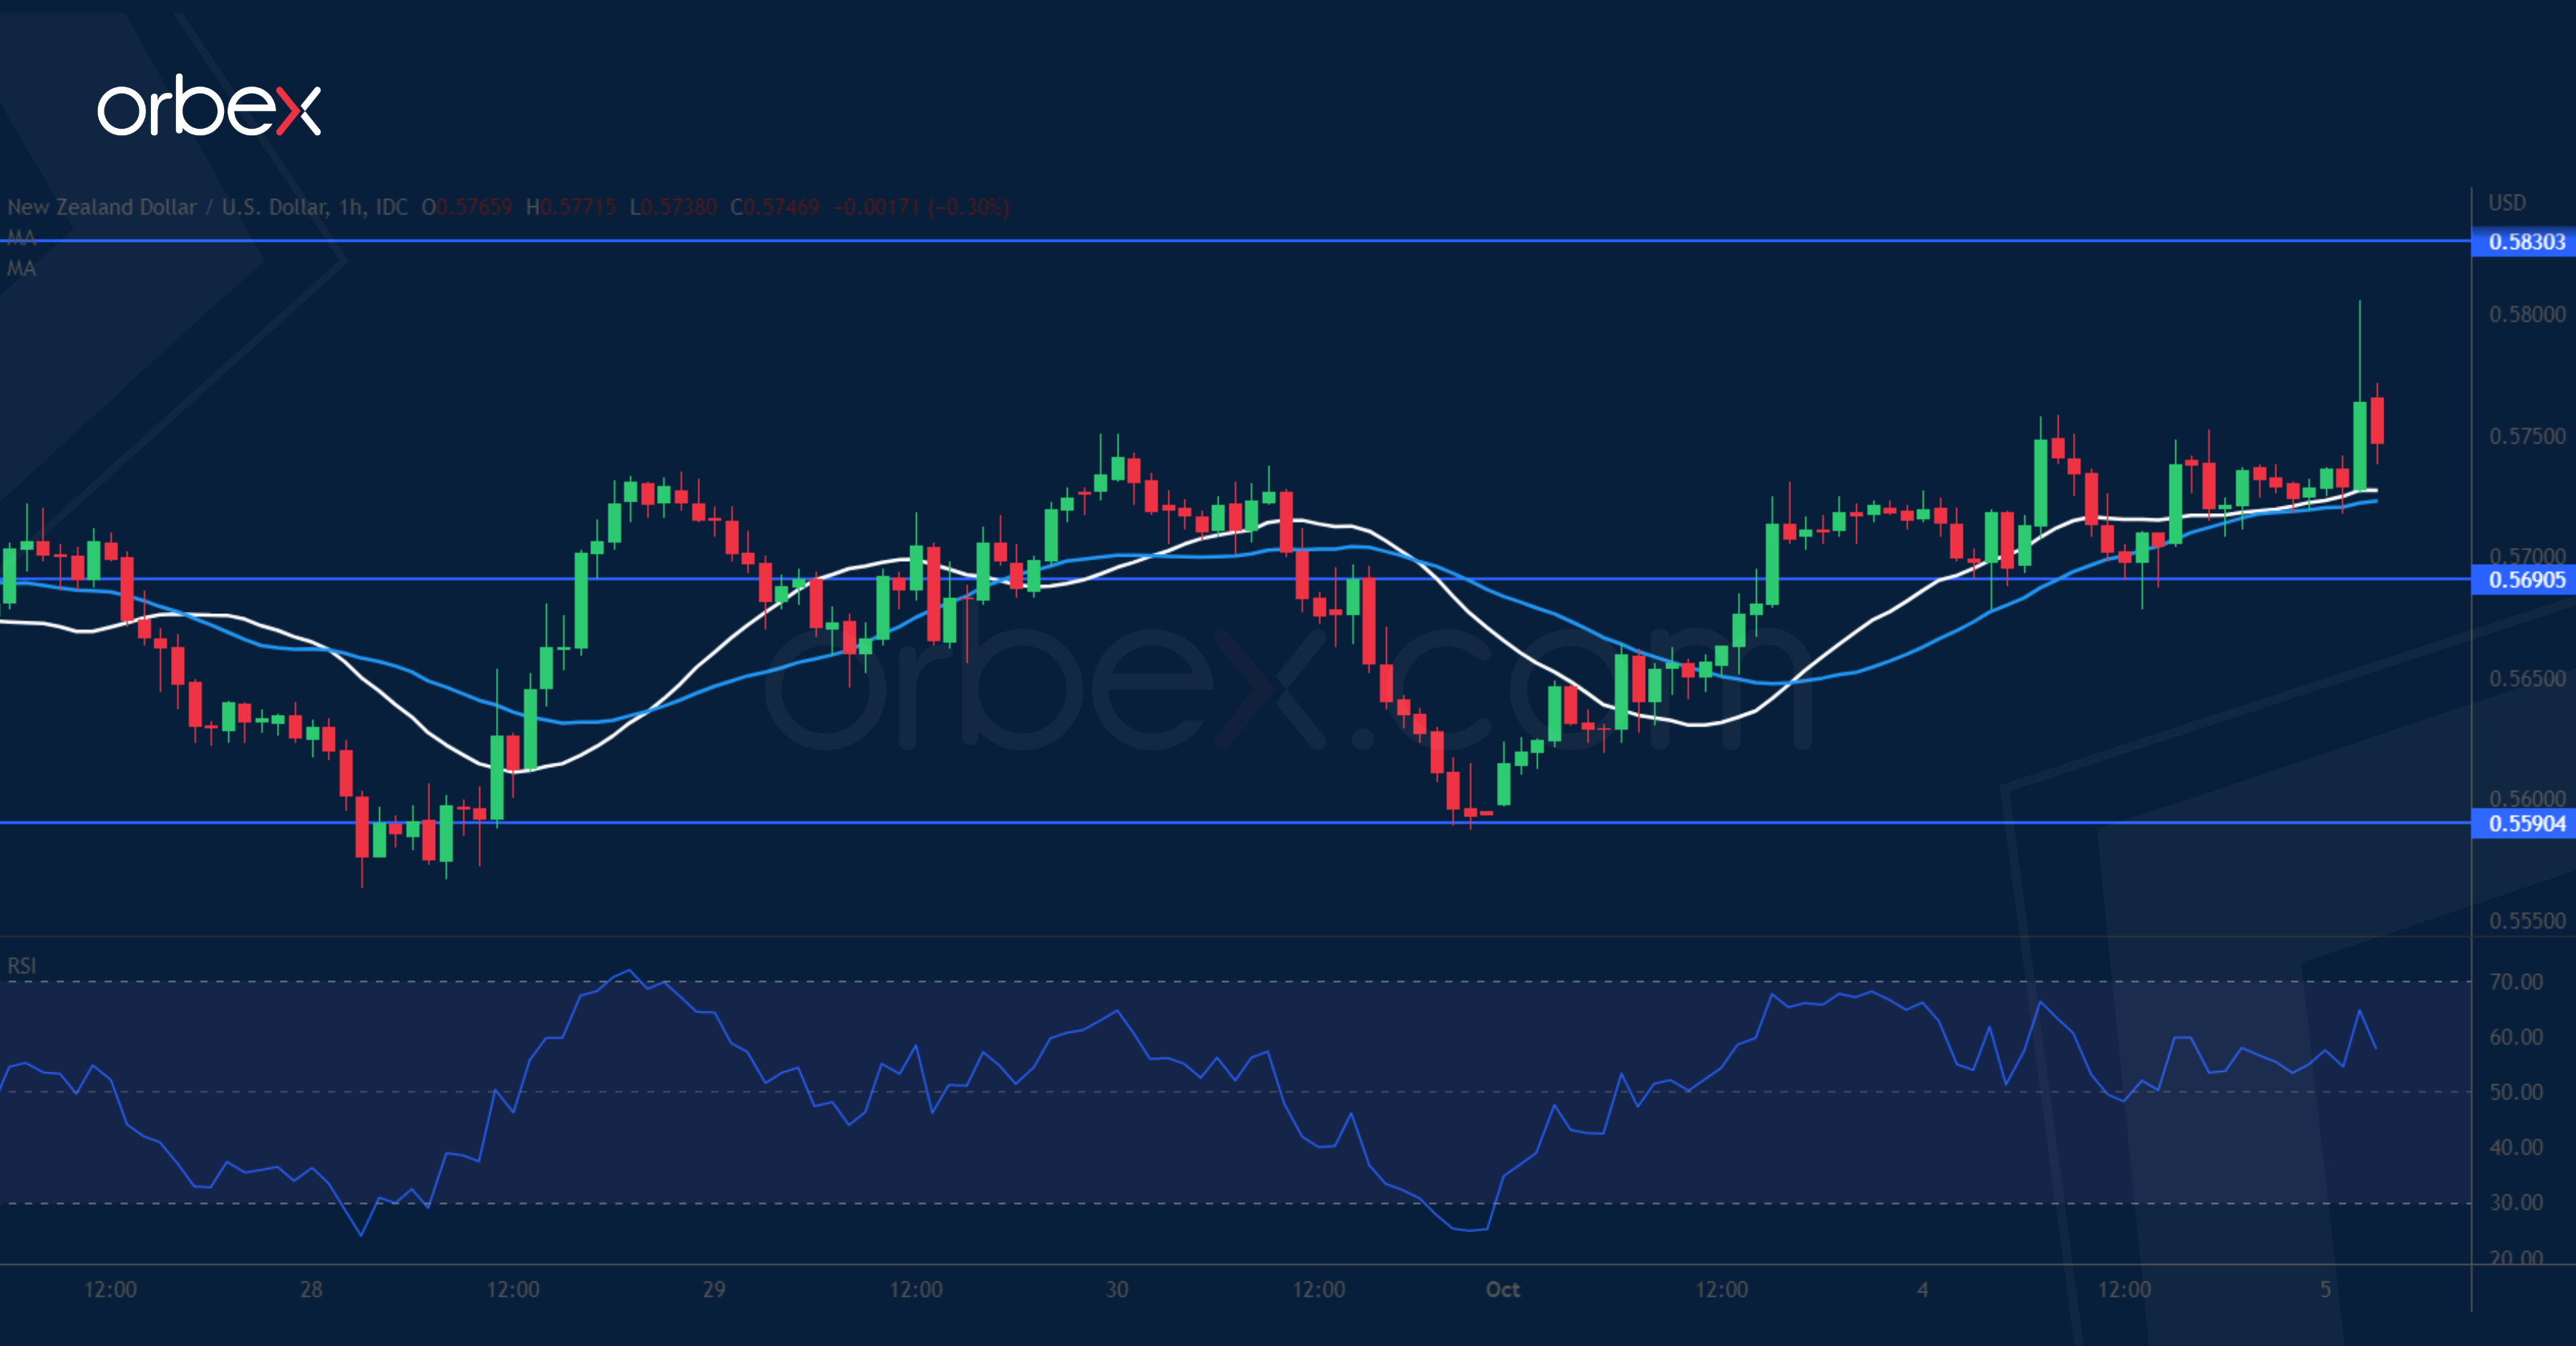
The New Zealand dollar rallied as the RBNZ raised its cash rate by 50bp. As the pair hovers above March 2020’s lows around 0.5500, the RSI’s oversold condition triggered a ‘buy-the-dips’ behaviour. Recent highs are a sign of waning selling pressure as the bears start to take profit. 0.5830 on the 20-day moving average is the resistance and its breach may put the psychological level of 0.6000 in sight. The recovery could gain traction from higher lows with the closest one being 0.5690, or a revisit of 0.5590 would reveal weakness.
AUD/USD Bounces Back
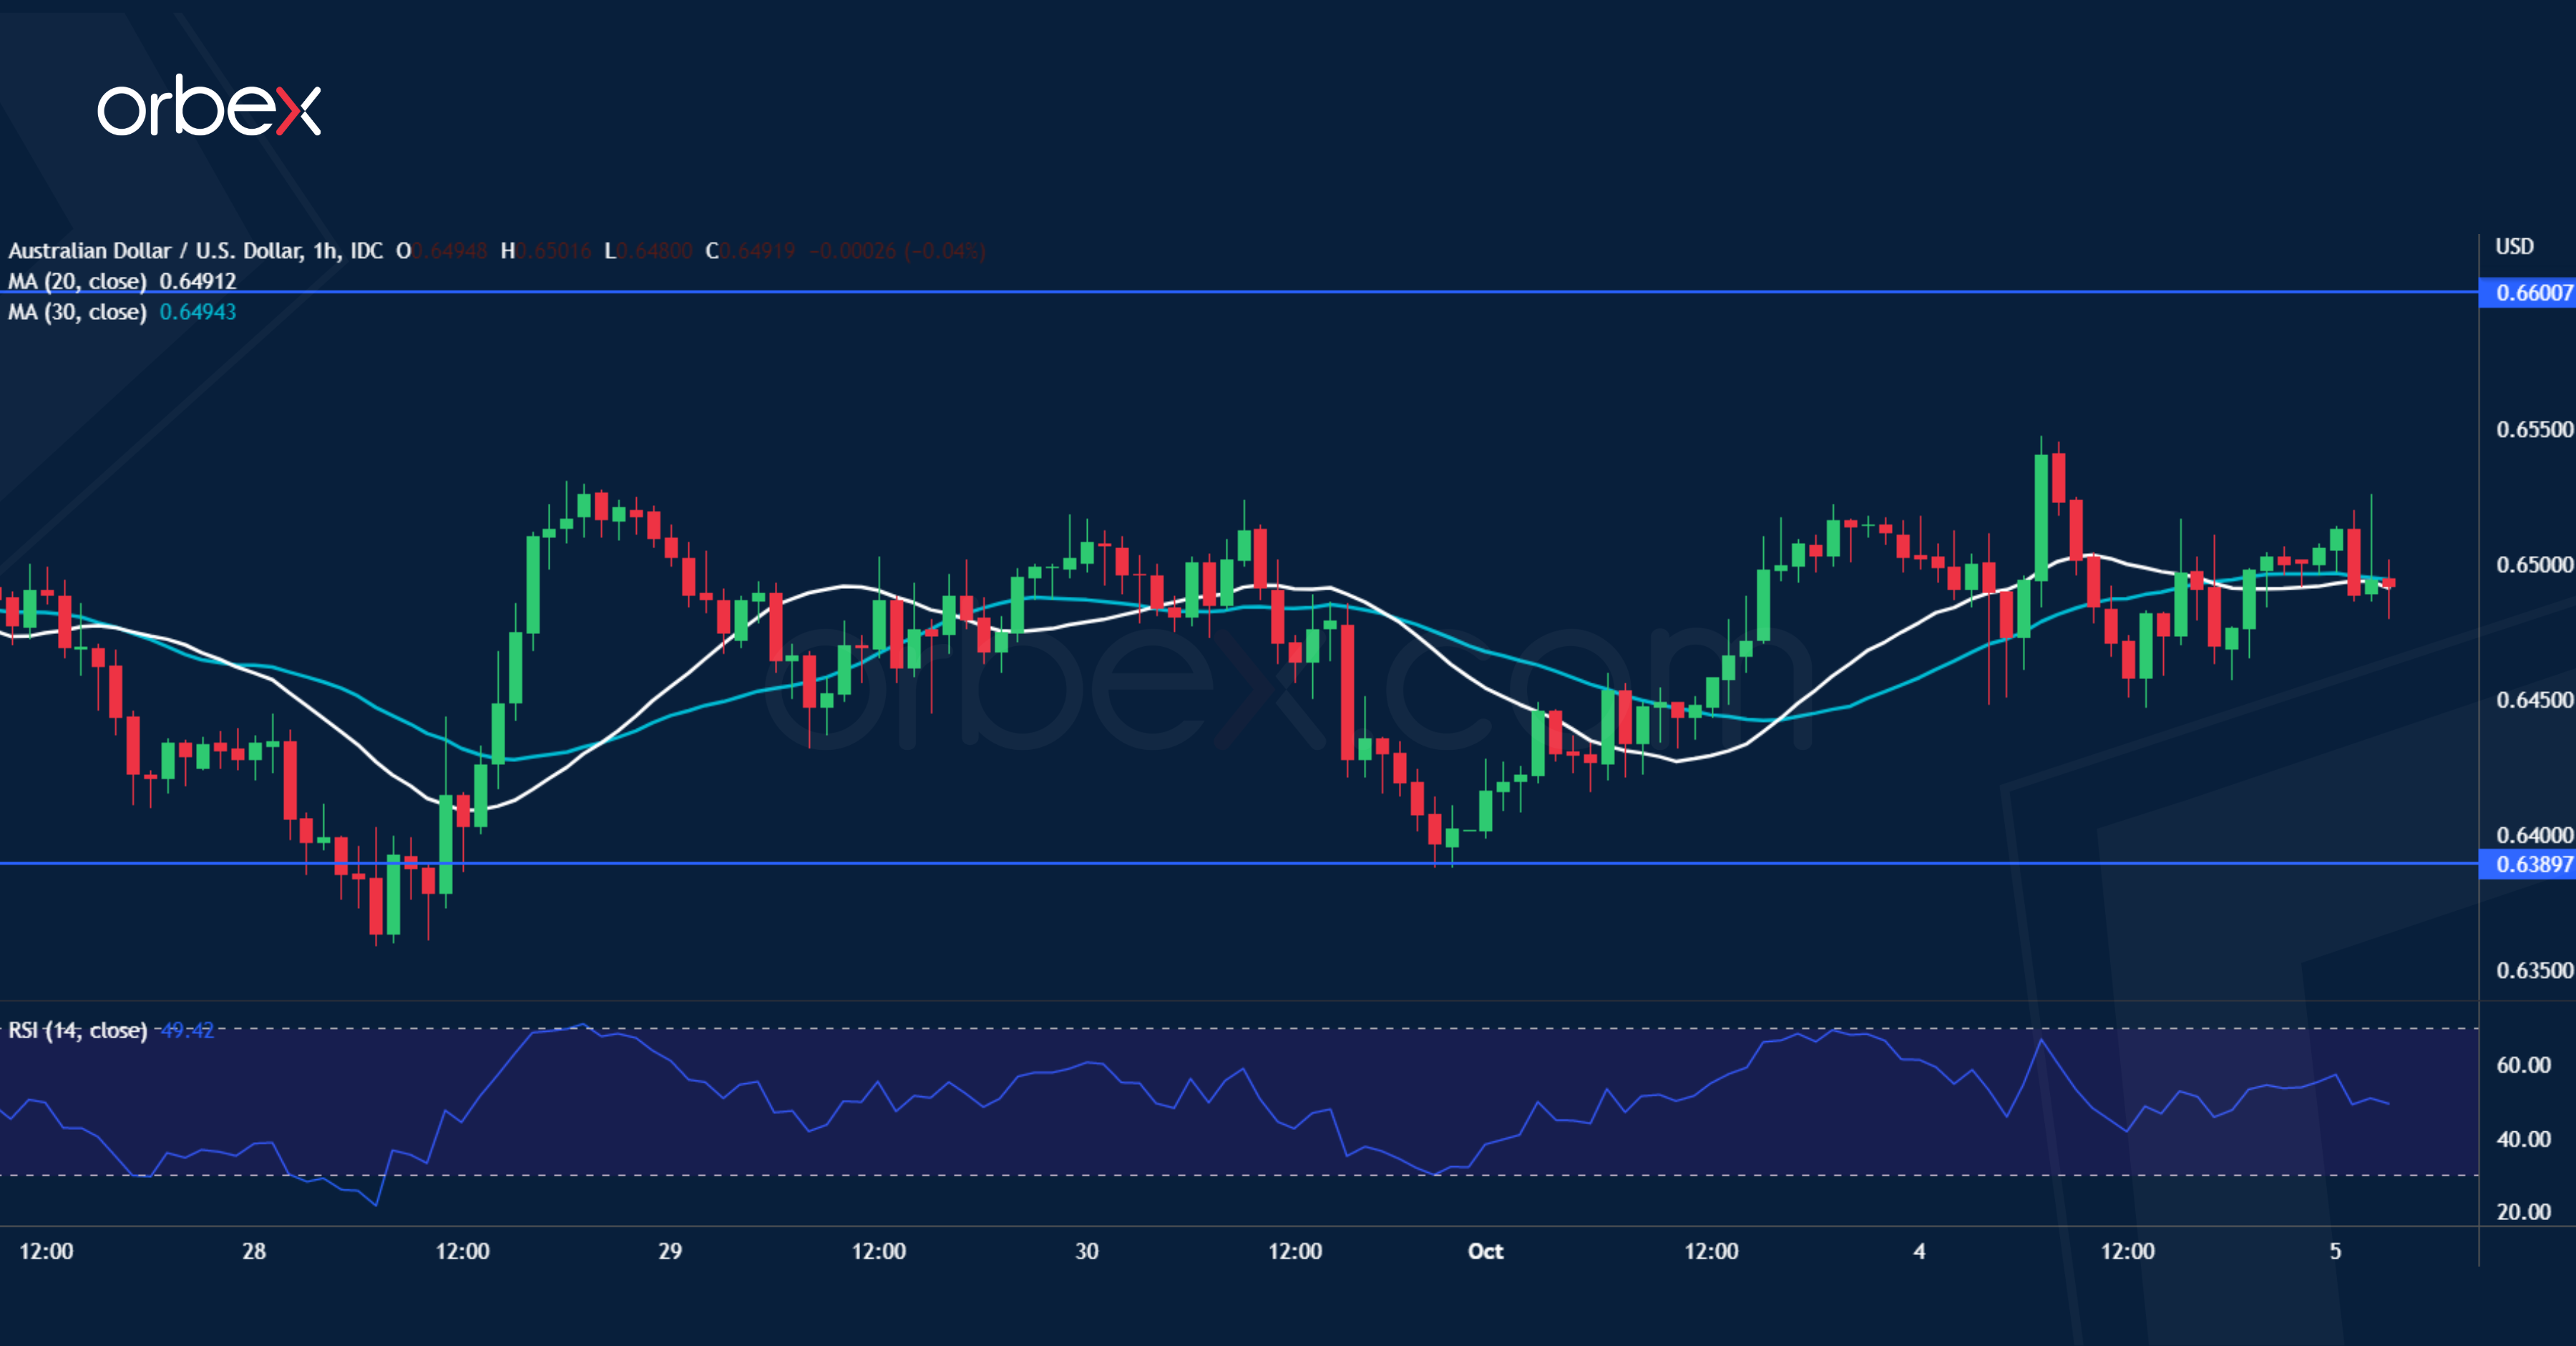
The Australian dollar struggled as the RBA slowed the pace of tightening with a mere 25bp hike. A previous break above 0.6500 flushed out some selling interests and gave the aussie a little breathing room. The price action has since secured a footing over 0.6390. The current consolidation may lift offers to 0.6600 next to the 20-day moving average. But sentiment remains cautious and trend followers may look to sell into strength. However, a bullish breakout could open the door for an extended recovery towards 0.6800.
Markets Again in Some Kind of ‘Bad News is Good News’ Modus
Markets
Monday’s strong corrective rally on core bond markets initially continued as the RBA slowed down its tightening pace from 50 bps to 25 bps as downside economic risks grab more attention. It polished global central bank expectations though this morning’s RNBZ verdict (see below) shows that this probably is premature. The (US) eco calendar seemed to be irrelevant in between ISM releases, but August JOLTS job openings drew attention. Job vacancies dropped at the second sharpest pace in two decades (1.12mn), with only the height of the pandemic lockdowns (April 2020) recording a bigger plunge. It’s a first sign of a potential cooling of a red-hot US labour market. Today’s ADP employment report and Friday’s payrolls will be looked at with JOLTS in the back of investors’ minds. This week’s disappointing US eco numbers don’t hold back the hawkish Fed rhetoric for the moment with new Fed governor Jefferson stressing that reducing inflation is the number one priority and SF Fed Daly vowing for continued action in the inflation battle. The intraday rally in core bonds was at least partially stopped by rallying oil prices ($89/b to $92/b) on rumours that OPEC+ will consider a reduction its production limit of 2m barrels/day. Daily changes on the US yield curve ranged between -2 bps (2-yr) and +1.6 bps (30-yr). The German yield curve bull steepened with yields falling 1.5 bps (30-yr) to 6.6 bps (4-yr). The corrective trend reversal at the beginning of this week remained visible on stock and on FX markets. The big difference is that Monday’s action centered around bond moves, while yesterday’s outsized action took place in equity and the dollar. Main European indices rallied by around 4% with the big three US indices closing around 3% higher. The dollar extended its correction lower with the trade-weighted index (DXY) losing almost two big figures to 110 in a steady move south. EUR/USD rallied from an open at 0.9826 to nearly parity. The topside of the long-standing downward trend channel kicks in at around 1.0050 and is important resistance. EUR/GBP finally found its footing following the UK government/BoE-induced volatility since mid-last month. The pair currently trades around the previous YTD high at 0.8721. From this point onwards, sterling might be up for a more gently weakening path again. US ADP employment and services ISM feature today’s agenda. We don’t think that corrective market action is over yet with markets again in some kind of ‘bad news is good news’ modus as a worsening economic situation could tilt central bank tightening plans.
News Headlines
The Reserve Bank of New Zealand hiked by 50 bps this morning. The policy rate now stands at 3.5%. In contrast with the RBA yesterday, which raised rates by an amount smaller than expected (25 bps), the RBNZ even considered going full force with a 75 bps move. More tightening is underway, the central bank signaled, citing too high inflation (7.3% in Q2), resilient household balance sheets and consumption and a very tight labour market. The kiwi dollar has weakened in recent months. If sustained, it poses further upside risks to inflation, the RBNZ added. Despite the RBNZ’s clear message, government bond yields tumble 17-19 bps across the curve. It is testament of (broader) markets consolidating. New Zealand money markets currently price in a terminal rate of 4.5% compared to the 4% penciled in by the RBNZ in its August forecasts. The currency strengthened following the decision to NZD/USD 0.58 but pared gains soon enough.
South Korean headline inflation slightly eased from 5.7% y/y to 5.6% in September thanks to declining energy prices. Core inflation on the other hand ticked higher to 4.5%, highlighting the strength of underlying price pressures. The Bank of Korea said CPI growth is likely to hold in a 5-6% range for a considerable time. It raised the policy rate since August last year to 2.5%. Unlike many others and with the July meeting as the sole exception, it stuck to a gradual 25 bps hiking pace. Today’s inflation print combined with the weakening won raises pressure on the BoK to pick up the tempo again Friday next week. USD/KRW gapped lower this morning to trade at 1418.8. That’s still near the strongest (weakest for the won) level since 2009.
Big Cut from OPEC Could Backfire
Global equities, bonds, commodities and currencies rallied, as the US dollar eased further yesterday. Soft US JOLTS data, and softer-than-expected Reserve Bank of Australia (RBA) hike sent a wave of optimism across the global markets. But the downside risks persist with further US jobs data due today, and OPEC – which may announce a big cut in oil production.
First, the rally
The S&P500 rallied more than 3% and recorded its best two-day rally since the beginning of 2020 and jumped above a minor Fibonacci retracement of 23.6% on the latest selloff. Nasdaq gained 3.34% to finish a touch below the minor 23.6% Fibonacci level, as well.
A part of the rally was due to a short squeeze, as the most-shorted stocks were among the best performers of yesterday’s trading session. They rallied more than 5%.
Apple gained more than 2.50%, as Tesla recovered nearly 3% even though Elon Musk threw the towel in and announced that he would finally buy Twitter for the price he originally proposed, meaning for $54.20 a share.
It’s needless to say that Twitter was one of the best performers of yesterday trading. The stock jumped to $52 a share, just $2 below the bid price, as the Twitter saga is finally over! It is said that Elon Musk’s lawyers understood that the judges won’t rule in favour of them, so they just wanted to cut short, and avoid the heavy trial costs. That’s 1 for Twitter, 0 for Elon!
Winds of optimism
The US dollar index slid to 110 mark, the EURUSD advanced to parity, where it met the 50-DMA which has been acting as a solid resistance since more than a year now, and Cable advanced to 1.1490. The USDCAD fell to the 1.35 on the back of softer US dollar and firmer oil.
In commodities, gold tested the 50-DMA to the upside ($1730 per ounce,) while Bitcoin consolidated above the $20K mark.
The winds of optimism were triggered by a set of favourable factors.
First, the softer than expected RBA rate hike has been taken as a sign that the central banks may be slowing the pace of their rate hikes, to avoid sending the world economy into a deep recession without even being able to tame inflation as fast as they wish. (But Reserve Bank of New Zealand didn’t sing the same song, it hiked by 50bp as expected).
Second, the US JOLTS data smelled like a first victory for the Federal Reserve (Fed). US job openings plunged by 1 million in August, the largest drop since April 2020, the peak of pandemic lockdowns.
However, unfortunately for the Fed, not many people quit their jobs, or were laid off.
Hopefully for the Fed’, Amazon also announced to freeze corporate hiring, after Facebook’s Meta, Apple, Tesla, Ford, Google, and many other names in the last few months.
So, it is possible that the US jobs market cools down in the next few months. It’s yet to be seen how fast the job losses could help tame inflation in the US. We hope, fast enough!
Today, the ADP report is expected to print 200’000 new private job additions in the US. A soft figure is what every investor is secretly praying for. If the soft jobs data is what could stop the Fed from battering the world, well, then, soft data is what people want.
Further rally?
Soft US jobs data is good, strong US jobs data is bad.
Any strong figure could easily hammer the early optimism and send the stocks back to where they were … to the year lows.
Also, we shouldn’t forget that the big gains, like the ones we saw yesterday, aren’t stable, simply because they are ‘too big to be stable’.
In fact, a 3% jump in the S&P500 is almost as disquieting as a 3% fall, because it is sign of high volatility. And high volatility is a characteristic of bear market. The good news is, the VIX index eased below 30 yesterday. The bad news is, it’s still very close to the 30 level.
OPEC & Russia vs. the West
According to the latest reports, OPEC could announce cutting oil output by 2 million barrels today.
Oil gained more than 3.50% toward the $87, and consolidates near $86 per barrel this morning.
A big decline in OPEC supplies may not necessarily trigger a price rally, as no one is happy to see energy prices spike again.
Higher energy prices are bad for the central bank expectations as they fuel the inflation expectations.
The higher the energy prices, the sharper the central banks must kill demand to pull the prices lower.
Therefore, a big cut in OPEC production could well backfire, and trigger profit taking and fall in oil prices today.
OPEC+ Plans Larger Output Cuts
Market movers today
Today, we get the final September service PMIs globally and the ISM service index in the US. Earlier in the week, the US ISM manufacturing index disappointed by falling to 50.9 vs. 52.0 expected. However, the service sector momentum remains strong with the index deep in expansionary territory sending no signals of a recession.
Swedish September Services PMI looks set to take a further step down from the relatively high 59.4 print in August.
The OPEC+ meeting in Vienna is expected to agree on output cuts.
Also, the US ADP employment report is published today ahead of the non-farm payrolls on Friday.
Poland's central bank is expected to raise its policy rate by 25bp to 7% amid high inflation which creeped up to 17% in September compared with a year ago, while the economy is clearly slowing.
The 60 second overview
First sign of the US labour market cooling? Yesterday's weak US JOLTs report sparked speculation of an earlier end to the Fed hiking cycle than previously anticipated. Job openings fell broadly across sectors to 10.1 million, the lowest since June 2021. The overall level still remains above pre-covid trend, and Fed's Daly commented yesterday that there is still 'a lot of room' for demand to cool in order to ease the current inflation. In any case, together with the ISM manufacturing new orders now below 50, the figures send a clear signal that the economy is moving in the right direction for the Fed. In addition, the recent rise in real yields and declining inflation expectations suggest that the hawkish post-Jackson Hole narrative has worked as intended. However, with oil prices recovering, we think it is still too early for the Fed to signal a 'pivot', and continue to look for further hikes in the last two meetings of the year. Friday's jobs report will gather a lot of attention as it will be the last one before the November meeting, a combination of modest employment growth, easing wage inflation and recovering labour force participation would be the optimal mix for the Fed and the risk markets.
OPEC+ plans larger output cuts: Brent rebounded above USD90/bbl ahead of today's OPEC+ meeting, where a large production cut of potentially 2mb/d could be in the cards. An output cut of 1-2mb/d should lead the market to rally further and Brent to eye the USD100/bbl mark, but it depends on the details, e.g. what is the baseline output level for the cut, what is the time horizon for implementation, is it contingent on market development etc. After the OPEC announcement we will watch out for reaction from US, e.g. will US accelerate selling of strategic reserves ahead of mid-term elections, speed up revival of Iran nuclear deal and reconsider lifting sanctions on Venezuela. Regardless, it looks like OPEC+ aims to floor oil prices around current levels, which supports our view that Brent trades close to USD100/bbl in Q4.
New Zealand central bank hikes rate as expected: This morning the Reserve Bank of New Zealand (RBNZ) hiked the official cash rate by 50bp to 3.50% overnight as widely expected. RBNZ continues to see domestic core inflation pressures elevated, as the local economic outlook still remains modestly positive despite the global recession fears. While the statement itself stuck to the hawkish narrative seen in the past meetings, recent comments by the RBNZ governor Adrian Orr suggest that the hiking cycle is nearing its end.
Equities: After a strong session yesterday where US and European equity markets surged, US futures are pointing lower this morning. Hence, it does not look like a sustained rally in risk.
FI: Global bond yields rallied on the back of a softer than expected Australian central bank that raised rates by "only" 50bp rather than the 75bp expected. Furthermore, US economic data was also softer than expected combined with bond buying from BoE. All contributed to lower yields. We expect that the major central banks will try to dampen the volatility in the market as they tighten monetary policy in order to bring down inflation.
FX: EUR/USD has risen close to 5 figures in little over a week and equally, many other asset classes have shown 'momentum reversal' e.g., Brent is back above USD90/barrel and equities have seen quite the lift over a few sessions. Overall, we view these as short-term and continue to see a strong outlook for the USD into next year. Today's focus turns to the OPEC+ meeting, where a large production cut of potentially 2mb/d could be in the cards. In our view, downwards pressure on EUR/DKK is of persistent nature and warrants a wider spread between DN and ECB policy rates. We now expect DN to hike 10bp less than ECB.
Credit: Credit saw a very strong session yesterday, with iTraxx Xover and Main tightening a massive 37bp and 9bp, respectively.
Nordic macro
Swedish September Services PMI looks set to take a further step down from the relatively high 59.4 print in August. This is evident looking at Swedish Manufacturing PMI, Eurozone flash services PMI and Swedish NIER private services sector confidence indicators. This should signal a move closer to recession in coming quarters. The Debt Office issues 1061 and 1065 Govies, SEK 1bn each. Kommuninvest (munis) potentially issues bonds in 2024-2029 maturities.
In Denmark, Danmarks Nationalbank (DN) resumed FX intervention selling of DKK in September to floor EUR/DKK. DN intervened for DKK 23bn. Given that the EUR/DKK continues to hover at the lower end of the FX target band, we now expect DN to hike 10bp less than ECB on 3M, i.e. hike the key policy rate to 1.80% by the end of the year and 2.30% in February next year.
Technical Outlook and Review
USD/JPY:
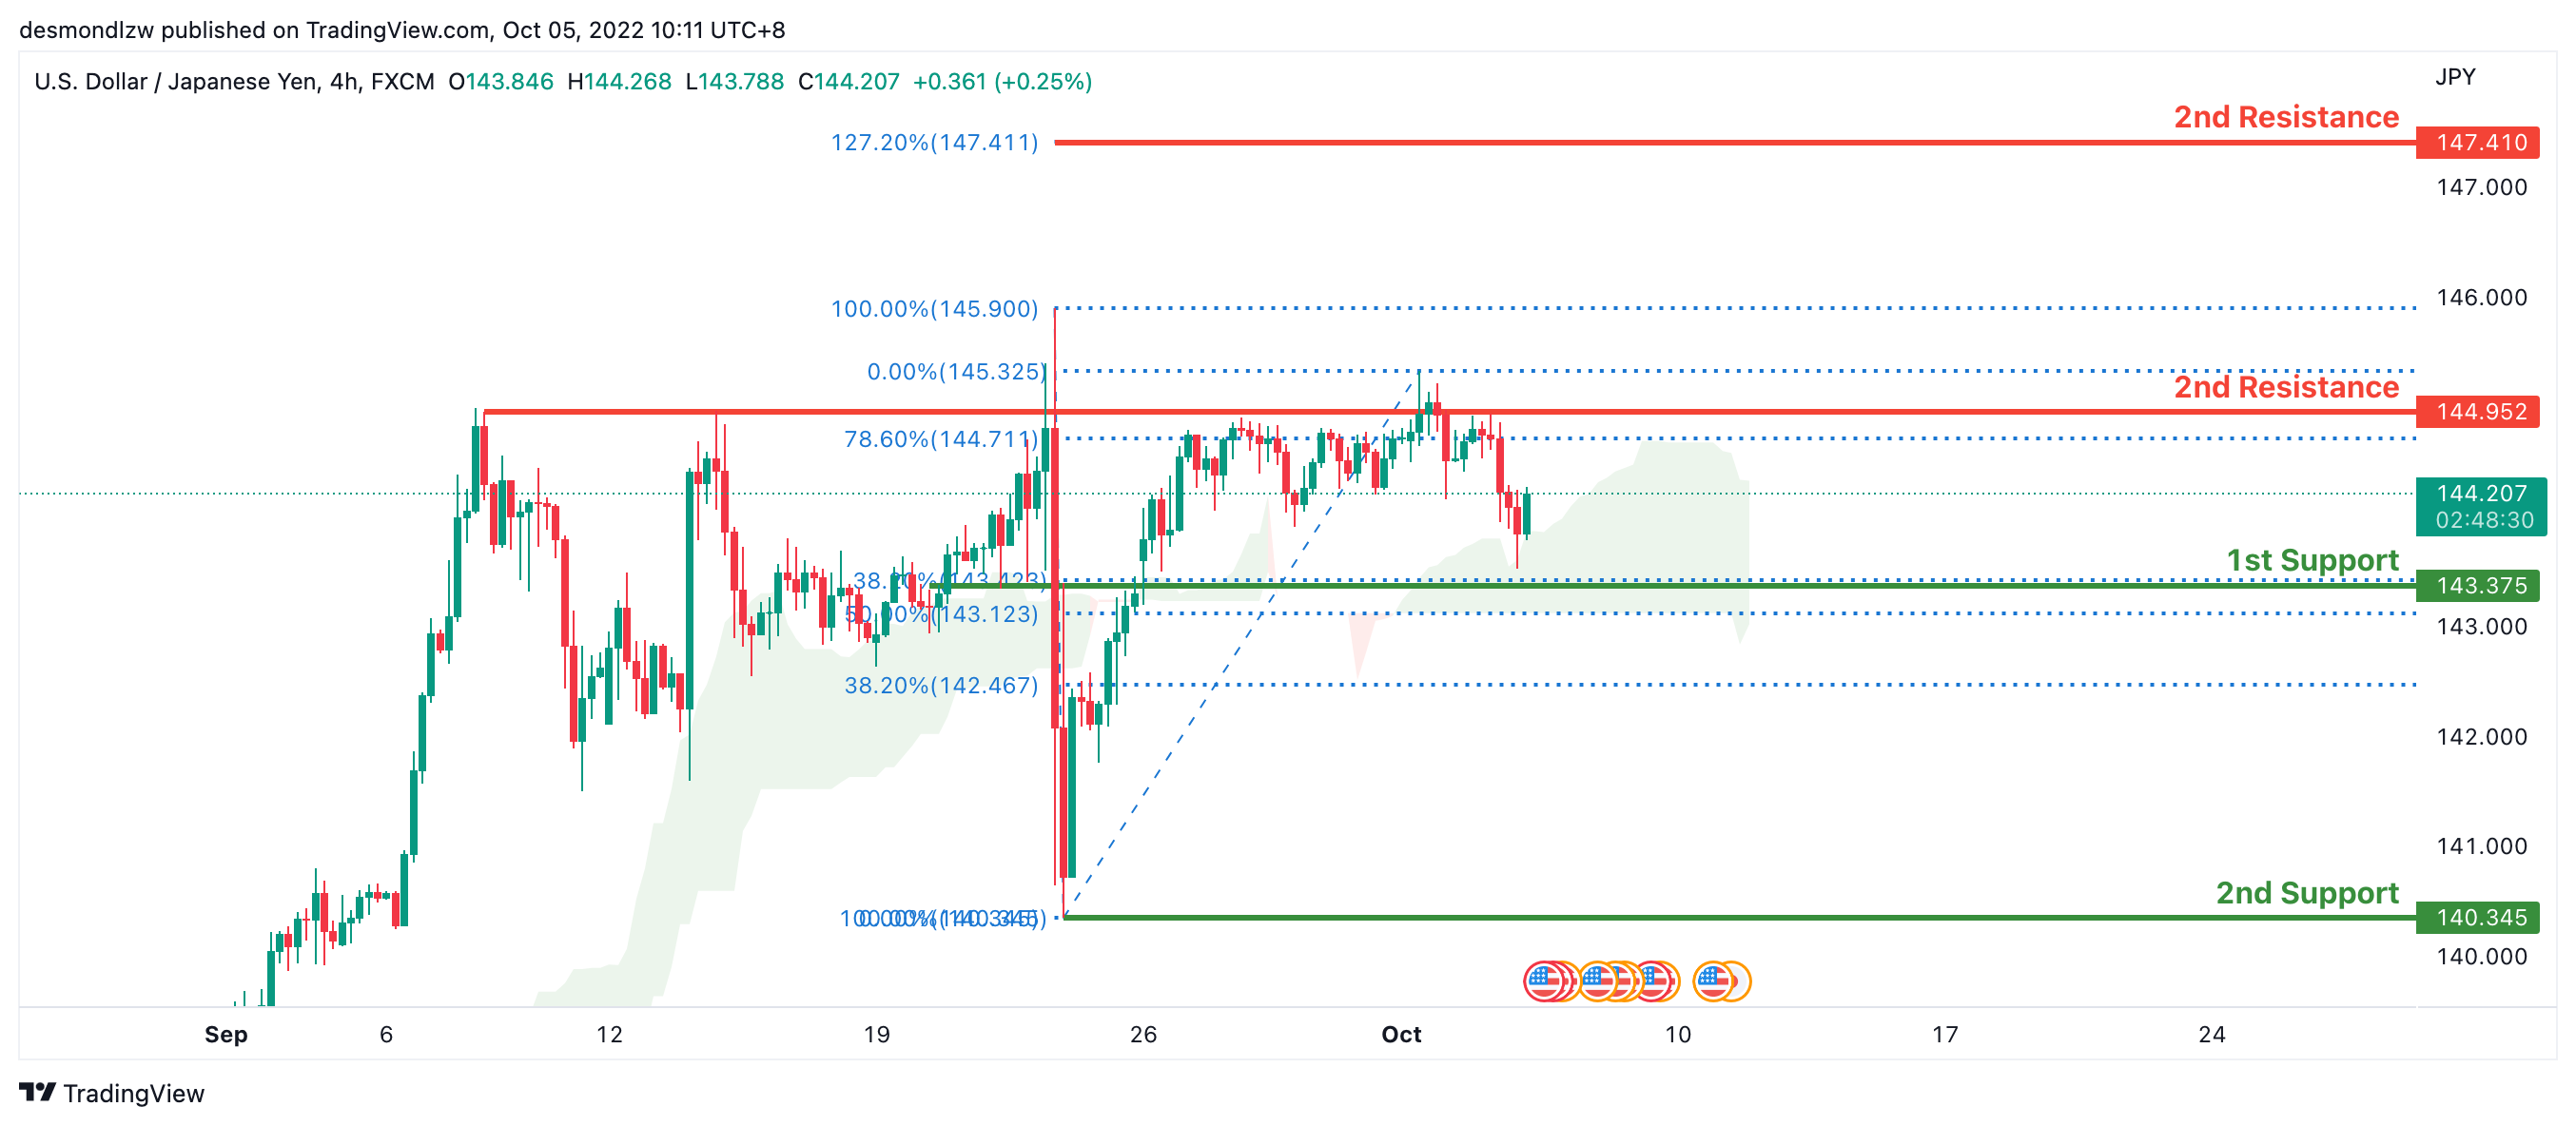
The price is moving in a clear bullish trend on the H4 chart. In addition, the price is above the ichimoku cloud, a bullish market indicator. Overnight, the price responded lower off of the 145 level with a frail bearish momentum. Price is anticipated to move towards the first support level at 143.375, which contains the 38.2% and 50% Fibonacci lines.
Areas of consideration:
- H4 time frame, 1st resistance at 144.952
- H4 time frame, 1st support at 143.474
DXY:
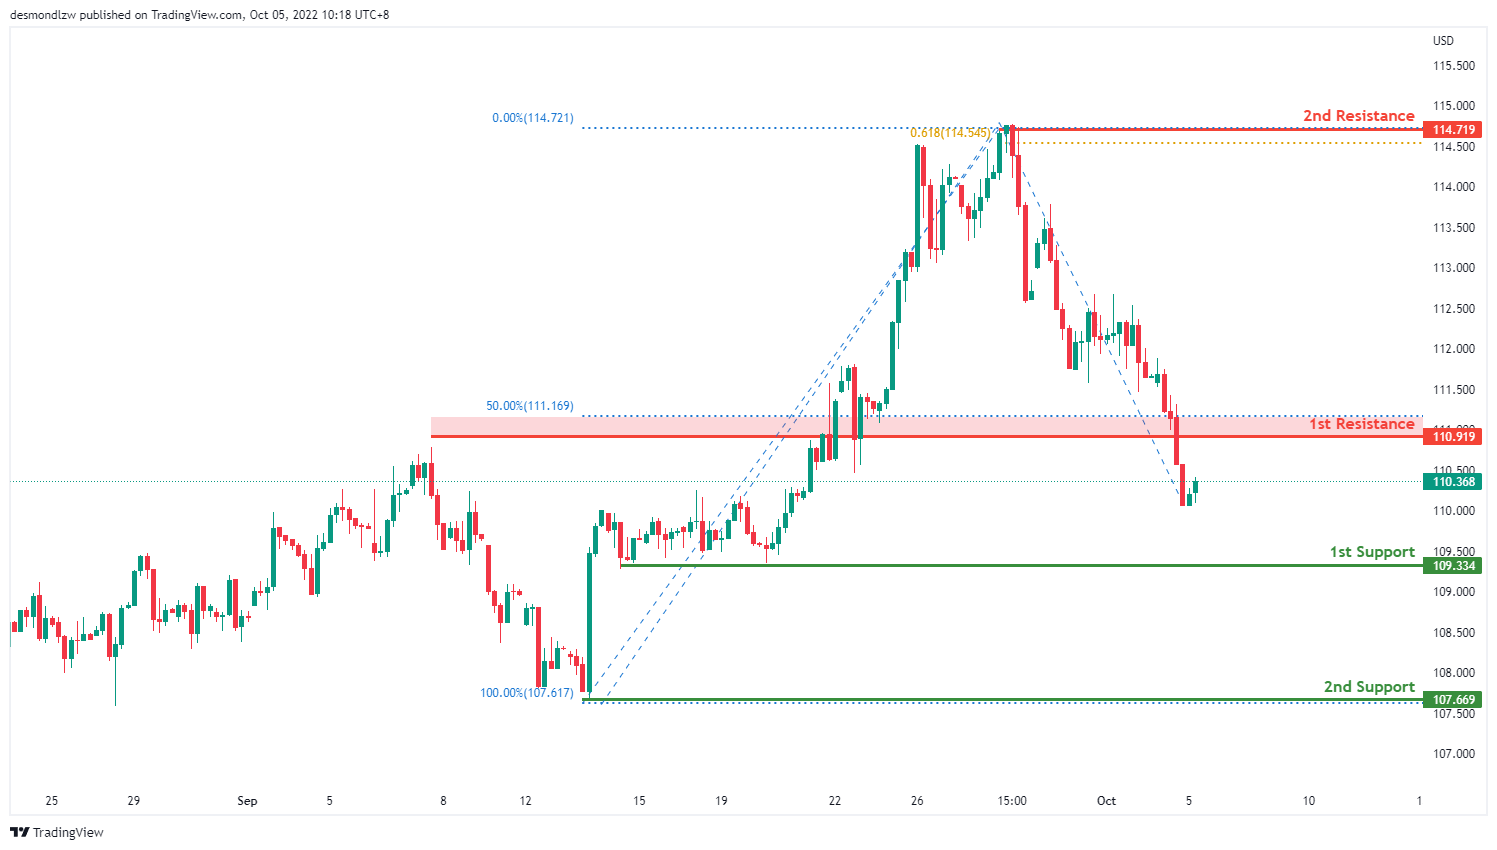
On the H4, price has broken lower from the ichimoku cloud and is moving in a descending manner hence we are bearish bias. It has broken the resistance and is moving toward the first support at 109.334 where my swing low sits. If bearish momentum continues, it will bring price to my second support at 107.669 where my second support and previous swing low sits. Alternatively price could bounce back to test the first resistance at 110.919 where my 50% retracement sits then the second resistance at 114.719 where the 61.8% projection and previous swing high sits
Areas of consideration:
- H4 time frame, 1st resistance at 110.919
- H4 time frame, 1st support at 109.334
EUR/USD:
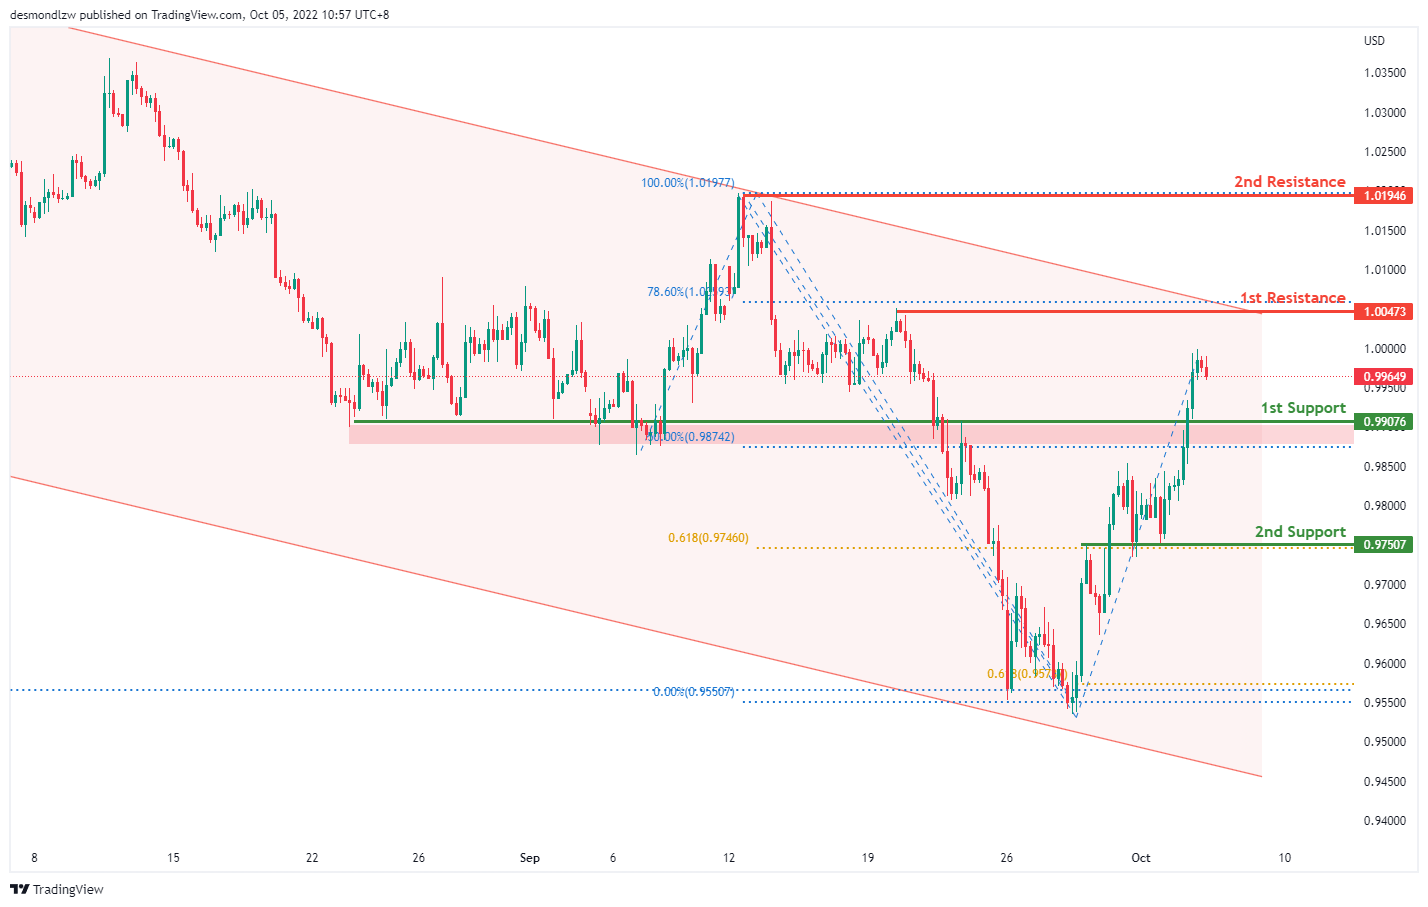
On the H4, price is moving within the descending trendline but in an ascending manner, with the price above ichimoku cloud- we are slightly bullish biased. Price has bounced off the first support and is moving toward the first resistance at 1.00473 where the 78.6% projection sits. If price breaks this level, it will test the second resistance at 1.0194, where the previous swing high sits. Alternatively, the overall bearish momentum could bring price back to test the first support at 0.9907 where the previous swing low and 50% retracement sits. If it breaks this level, we have a strong bearish confirmation to bring price down to 0.9750 where the swing low and 61.8% projection sits
Areas of consideration :
- H4 1st resistance at 1.0047
- H4 1st support at 0.9907
GBP/USD:
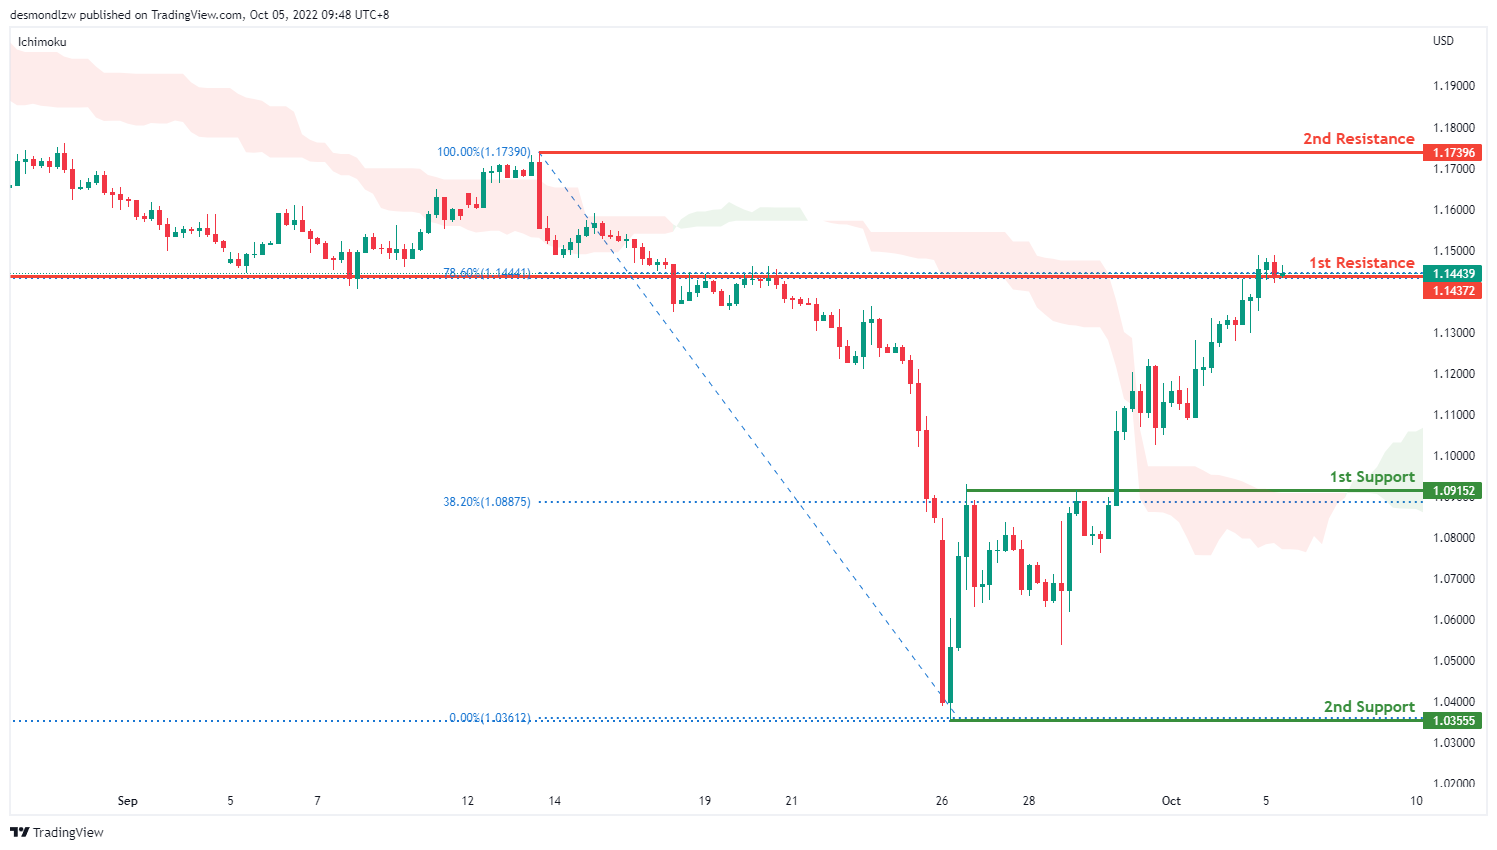
On the H4 time frame, prices have bounced off the support level and are moving in an ascending manner, we are slightly bullish. Price is moving toward the first resistance at 1.1443, where the 78.6% retracement and overlap resistance sits. If it breaks this level, its bullish momentum will bring price to second resistance at 1.1739 where the previous swing high sits. Alternatively, price could pull back to test the first support at 1.0915, where the 38.2% retracement sits then the second support at 1.0355 where the 138.2% extension sits
Areas of consideration:
- H4 1st resistance at 1.1443
- H4 1st support at 1.10915
USD/CHF:
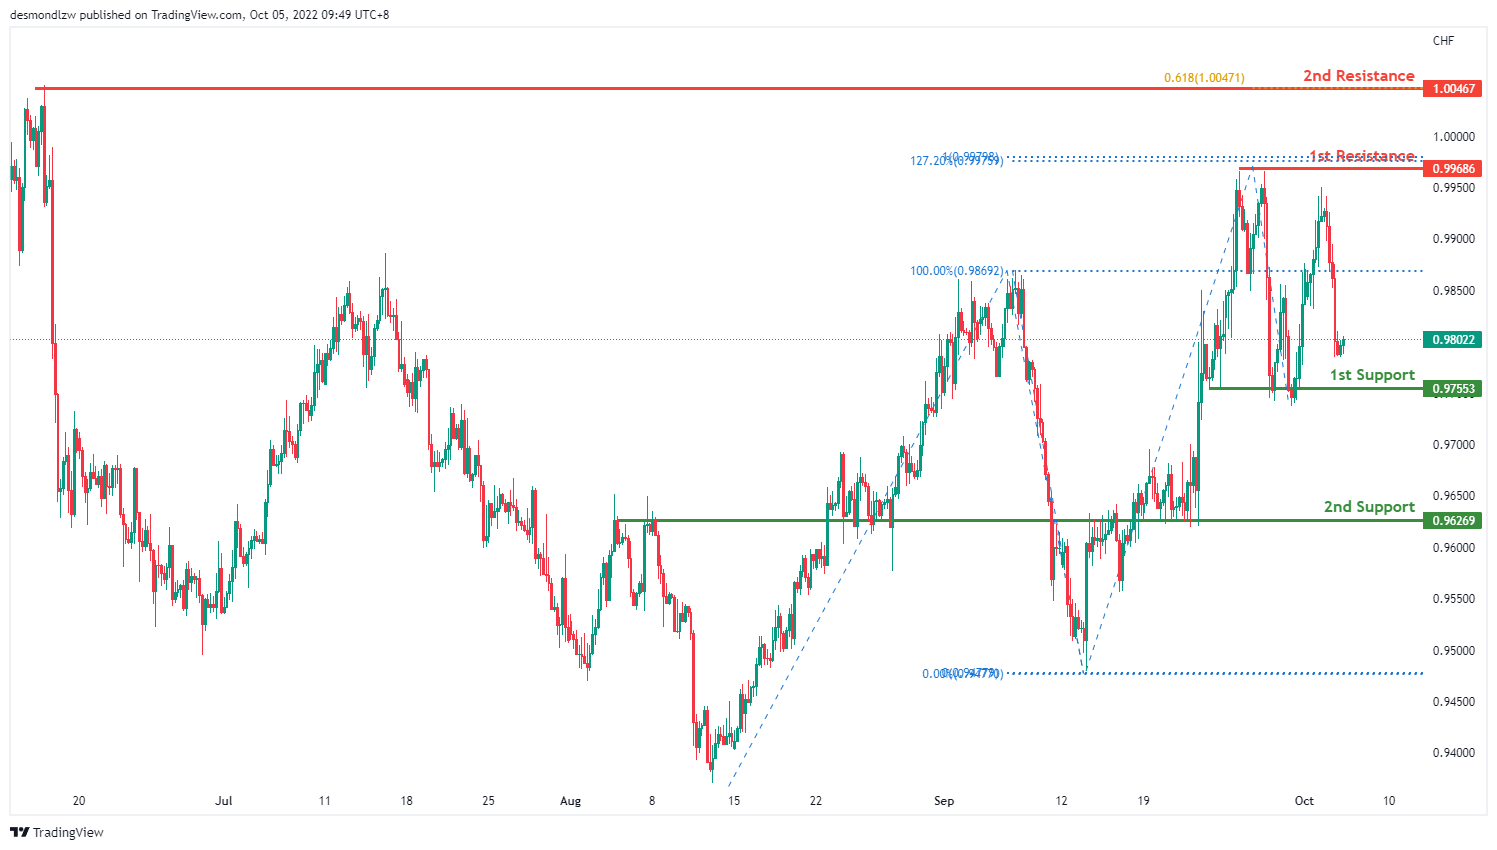
On the H4 chart, price has rejected the resistance level and is moving in a descending manner hence we are bearish bias- prices are moving toward the first support at 0.9755 where the previous swing low sits. If bearish momentum continues, it will bring price down to the second support at 0.9626 where the overlap support sits. Alternatively, price could bounce back to test the first resistance at 0.9968 where the 127.2% extension and 100% projection sits then to test the second resistance at 1.0046
Areas of consideration
- H4 1st support at 0.9755
- H4 1st resistance at 0.9968
XAU/USD (GOLD):
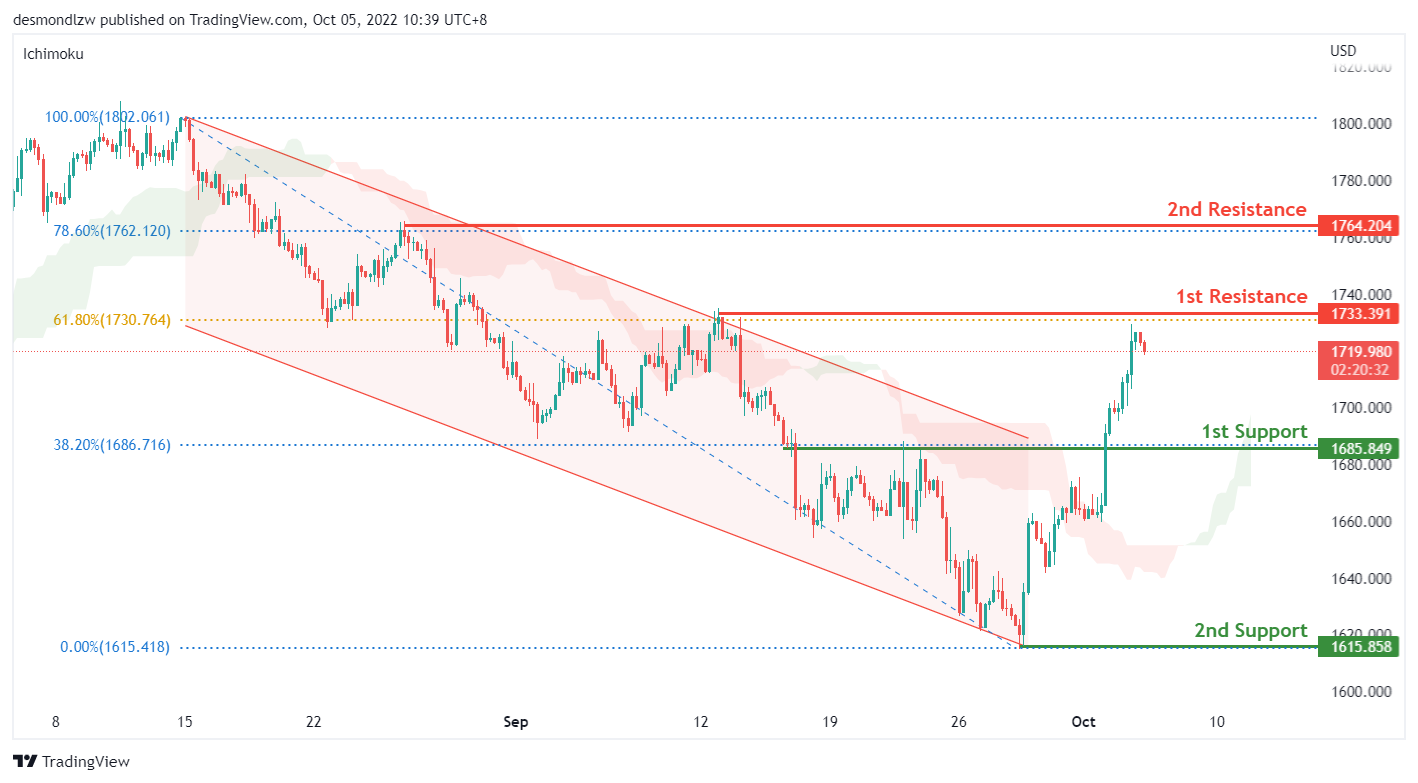
On the H4, price trades strongly higher above the ichimoku cloud as it approaches the 1st resistance of 1733 which is the previous swing high from 12 September 2022 and the 61.80% fibonacci retracement level. We continue to have a bullish bias that price could trade higher to the 2nd resistance of 1764 which is in line with the 78.60% fibonacci retracement level and previous swing high from end August 2022. However, before the move higher, the price could first retrace towards the risk level of 1708 which is the 50% fibonacci retracement level.
Areas of consideration:
- H4 time frame, 1st resistance at 1733.39
- H4 time frame, 1st support at 1685
- H4 time frame, 2nd resistance at 1764
AUD/USD:
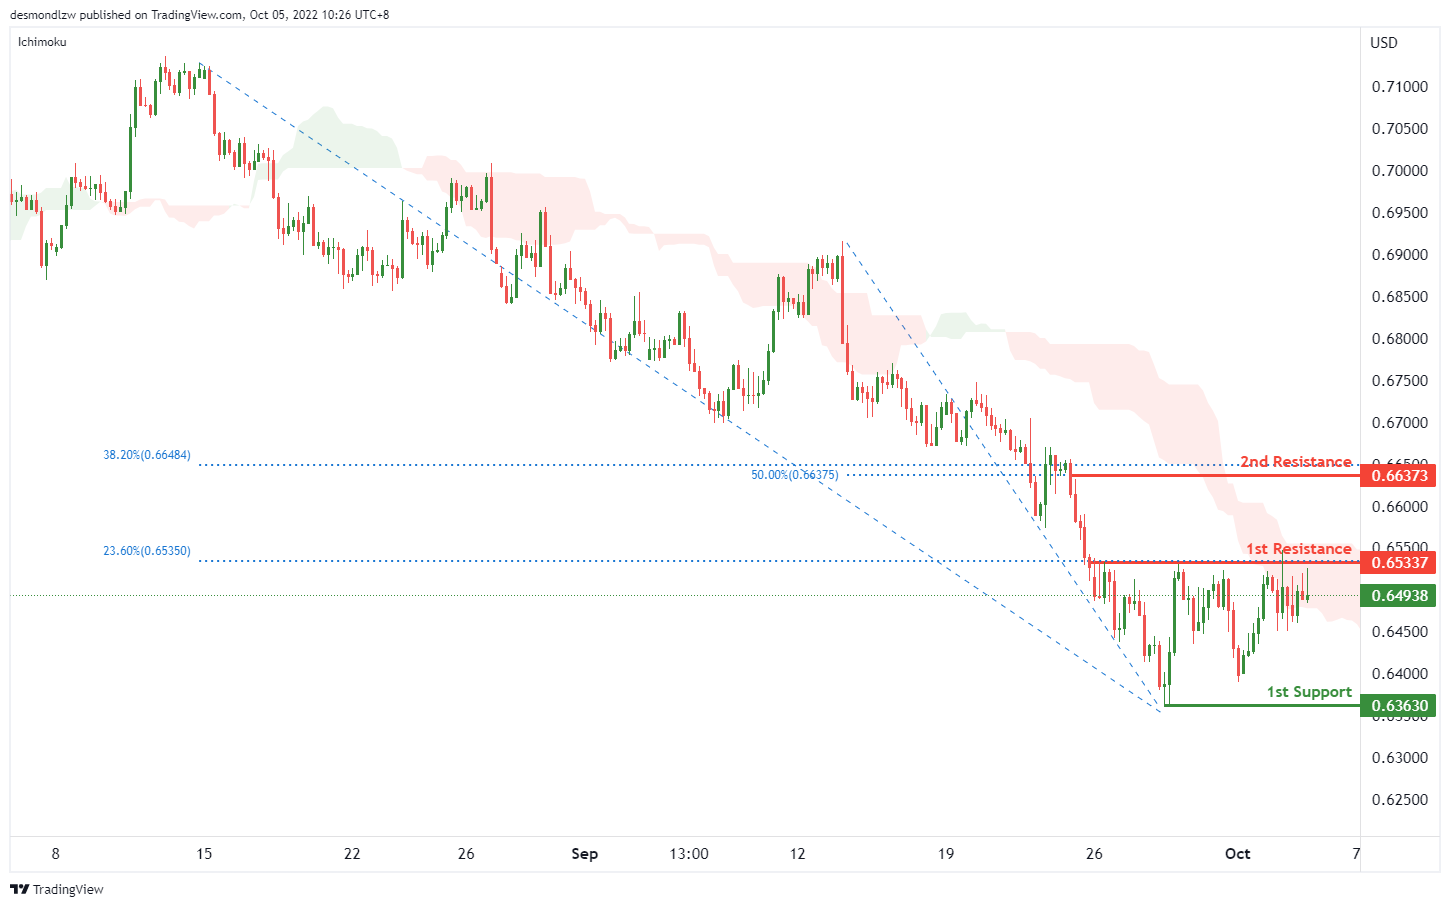
On the H4, with the price testing the 1st resistance at 0.65337, where the 23.6% fibonacci retracement sits, and crossing ichimoku cloud, if the price can break the 1st resistance successfully, we can expect the price rise to the 2nd resistance at 0.66373, which is in line with the 50% and 38.2% fibonacci retracement. Alternatively, the price may drop back to the 1st support at 0.63630, where the swing low is.
Areas of consideration
- H4, 1st resistance at 0.65337
- H4, 2nd resistance at 0.66373
NZD/USD:
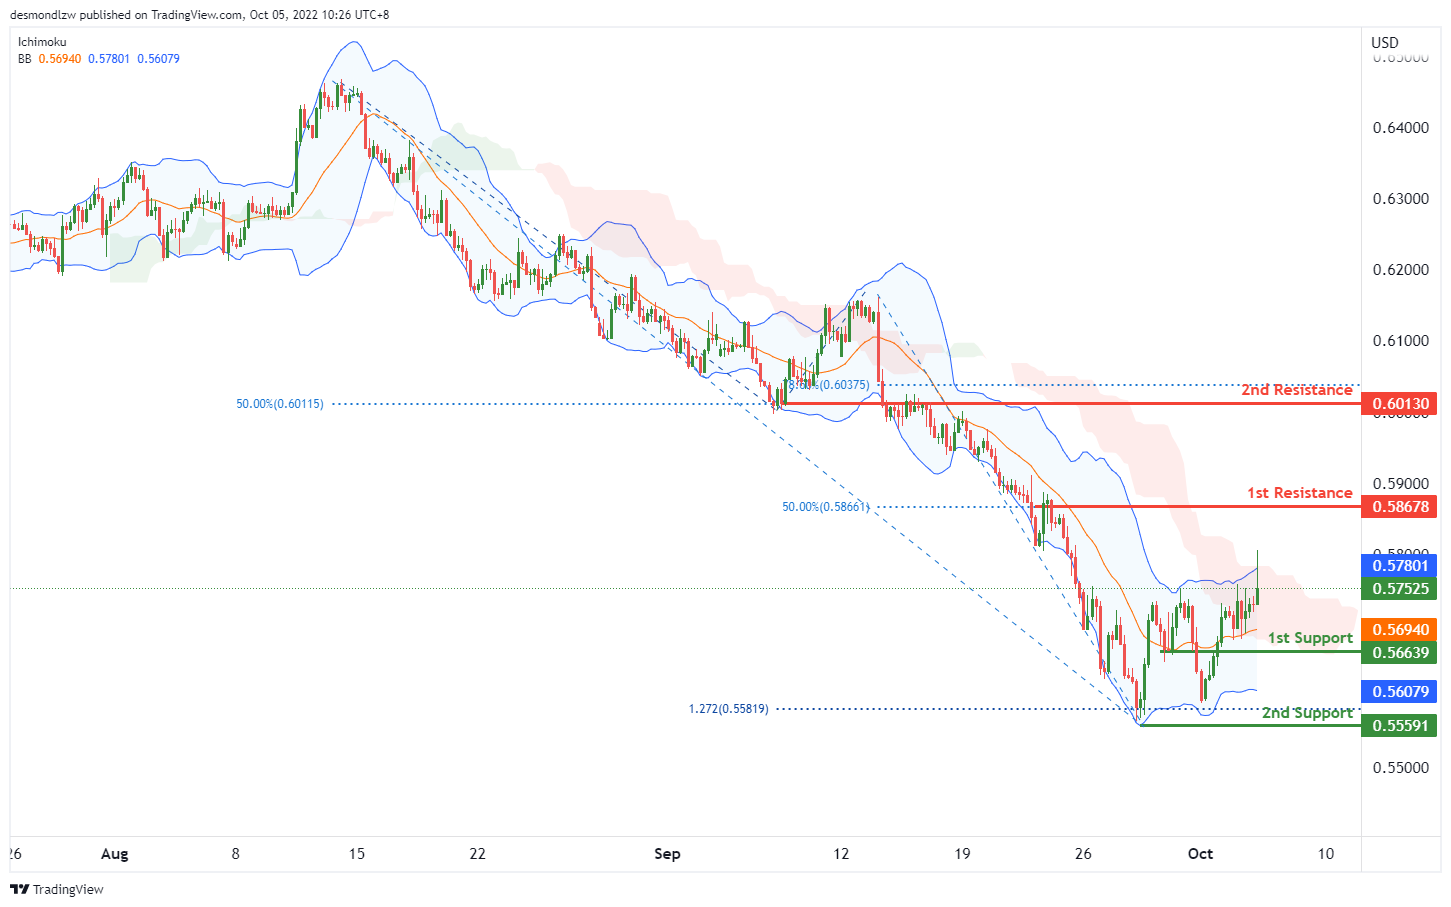
On the H4, with the price crossing the ichimoku cloud and still within the bollinger bands, we have a bullish bias that the price may rise to the 1st resistance at 0.58678, which is in line with the 50% fibonacci retracement. If the 1st resistance is broken, we can expect the price to rise to the 2nd resistance at 0.60130, where the 78.6% fibonacci retracement and 50% fibonacci retracement are. Alternatively, the price may drop to the 1st support at 0.56639, where the previous swing low is. If the 1st support is broken, the next support level could be at 0.55591, which is in line with the significant swing low.
Areas of consideration:
- H4 time frame, 1st resistance at 0.58678
- H4 time frame, 1st support at 0.56639
USD/CAD:
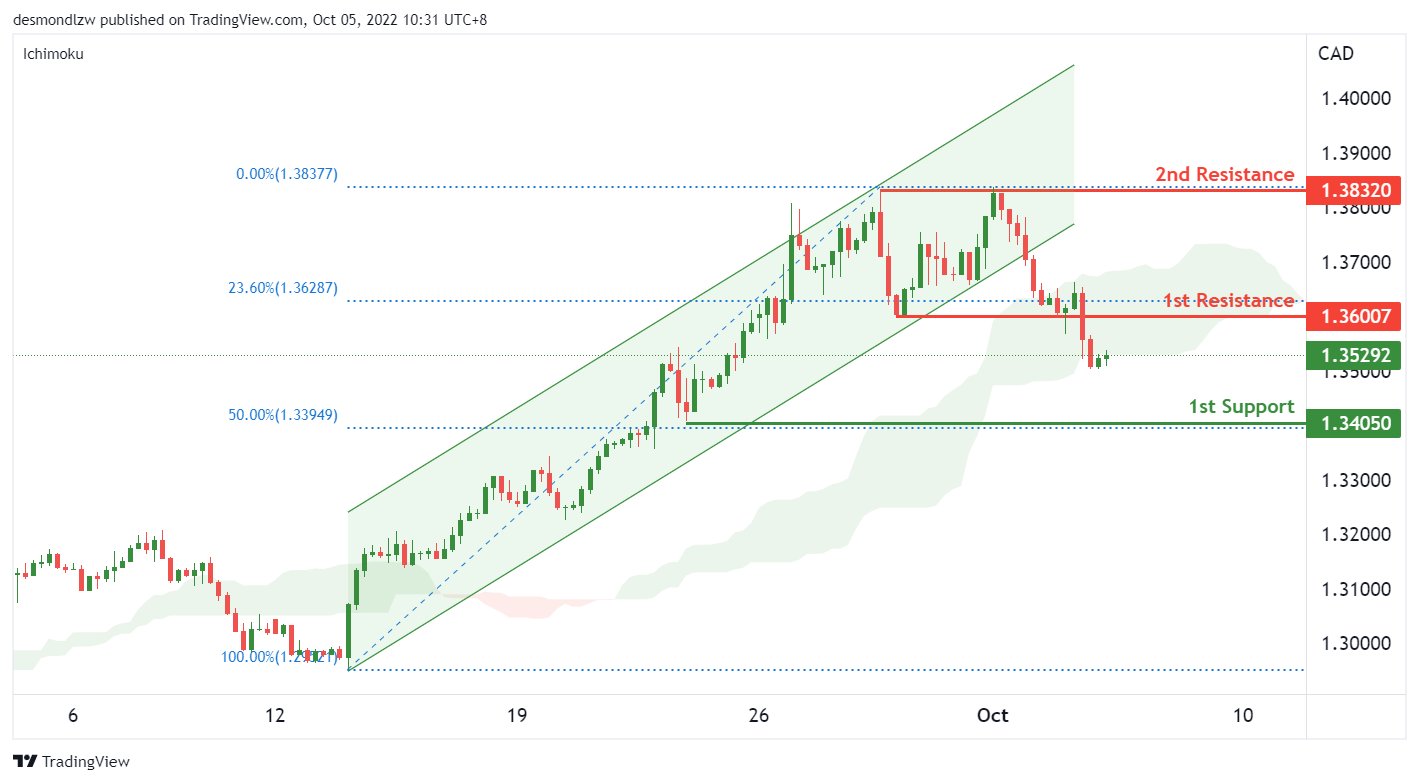
On the H4, the price broke lower from the support turned 1st resistance level of 1.36 which is in line with the 23.60% fibonacci retracement level. With the price trading below the ascending channel and the ichimoky cloud, we have a short term bearish bias. Price could fall to the 1st support of 1.34 which is in line with the 50% retracement level and the previous swing low. However, the price could retest the 1st resistance before trading lower. Alternatively, if price breaks above the 1st resistance level, the USDCAD could trade higher towards the 2nd resistance of 1.3832 which is the previous swing high.
Areas of consideration:
- H4 time frame, 1st resistance at 1.36
- H4 time frame, 1st support at 1.34
- H4 time frame, 2nd resistance at 1.3832
OIL:
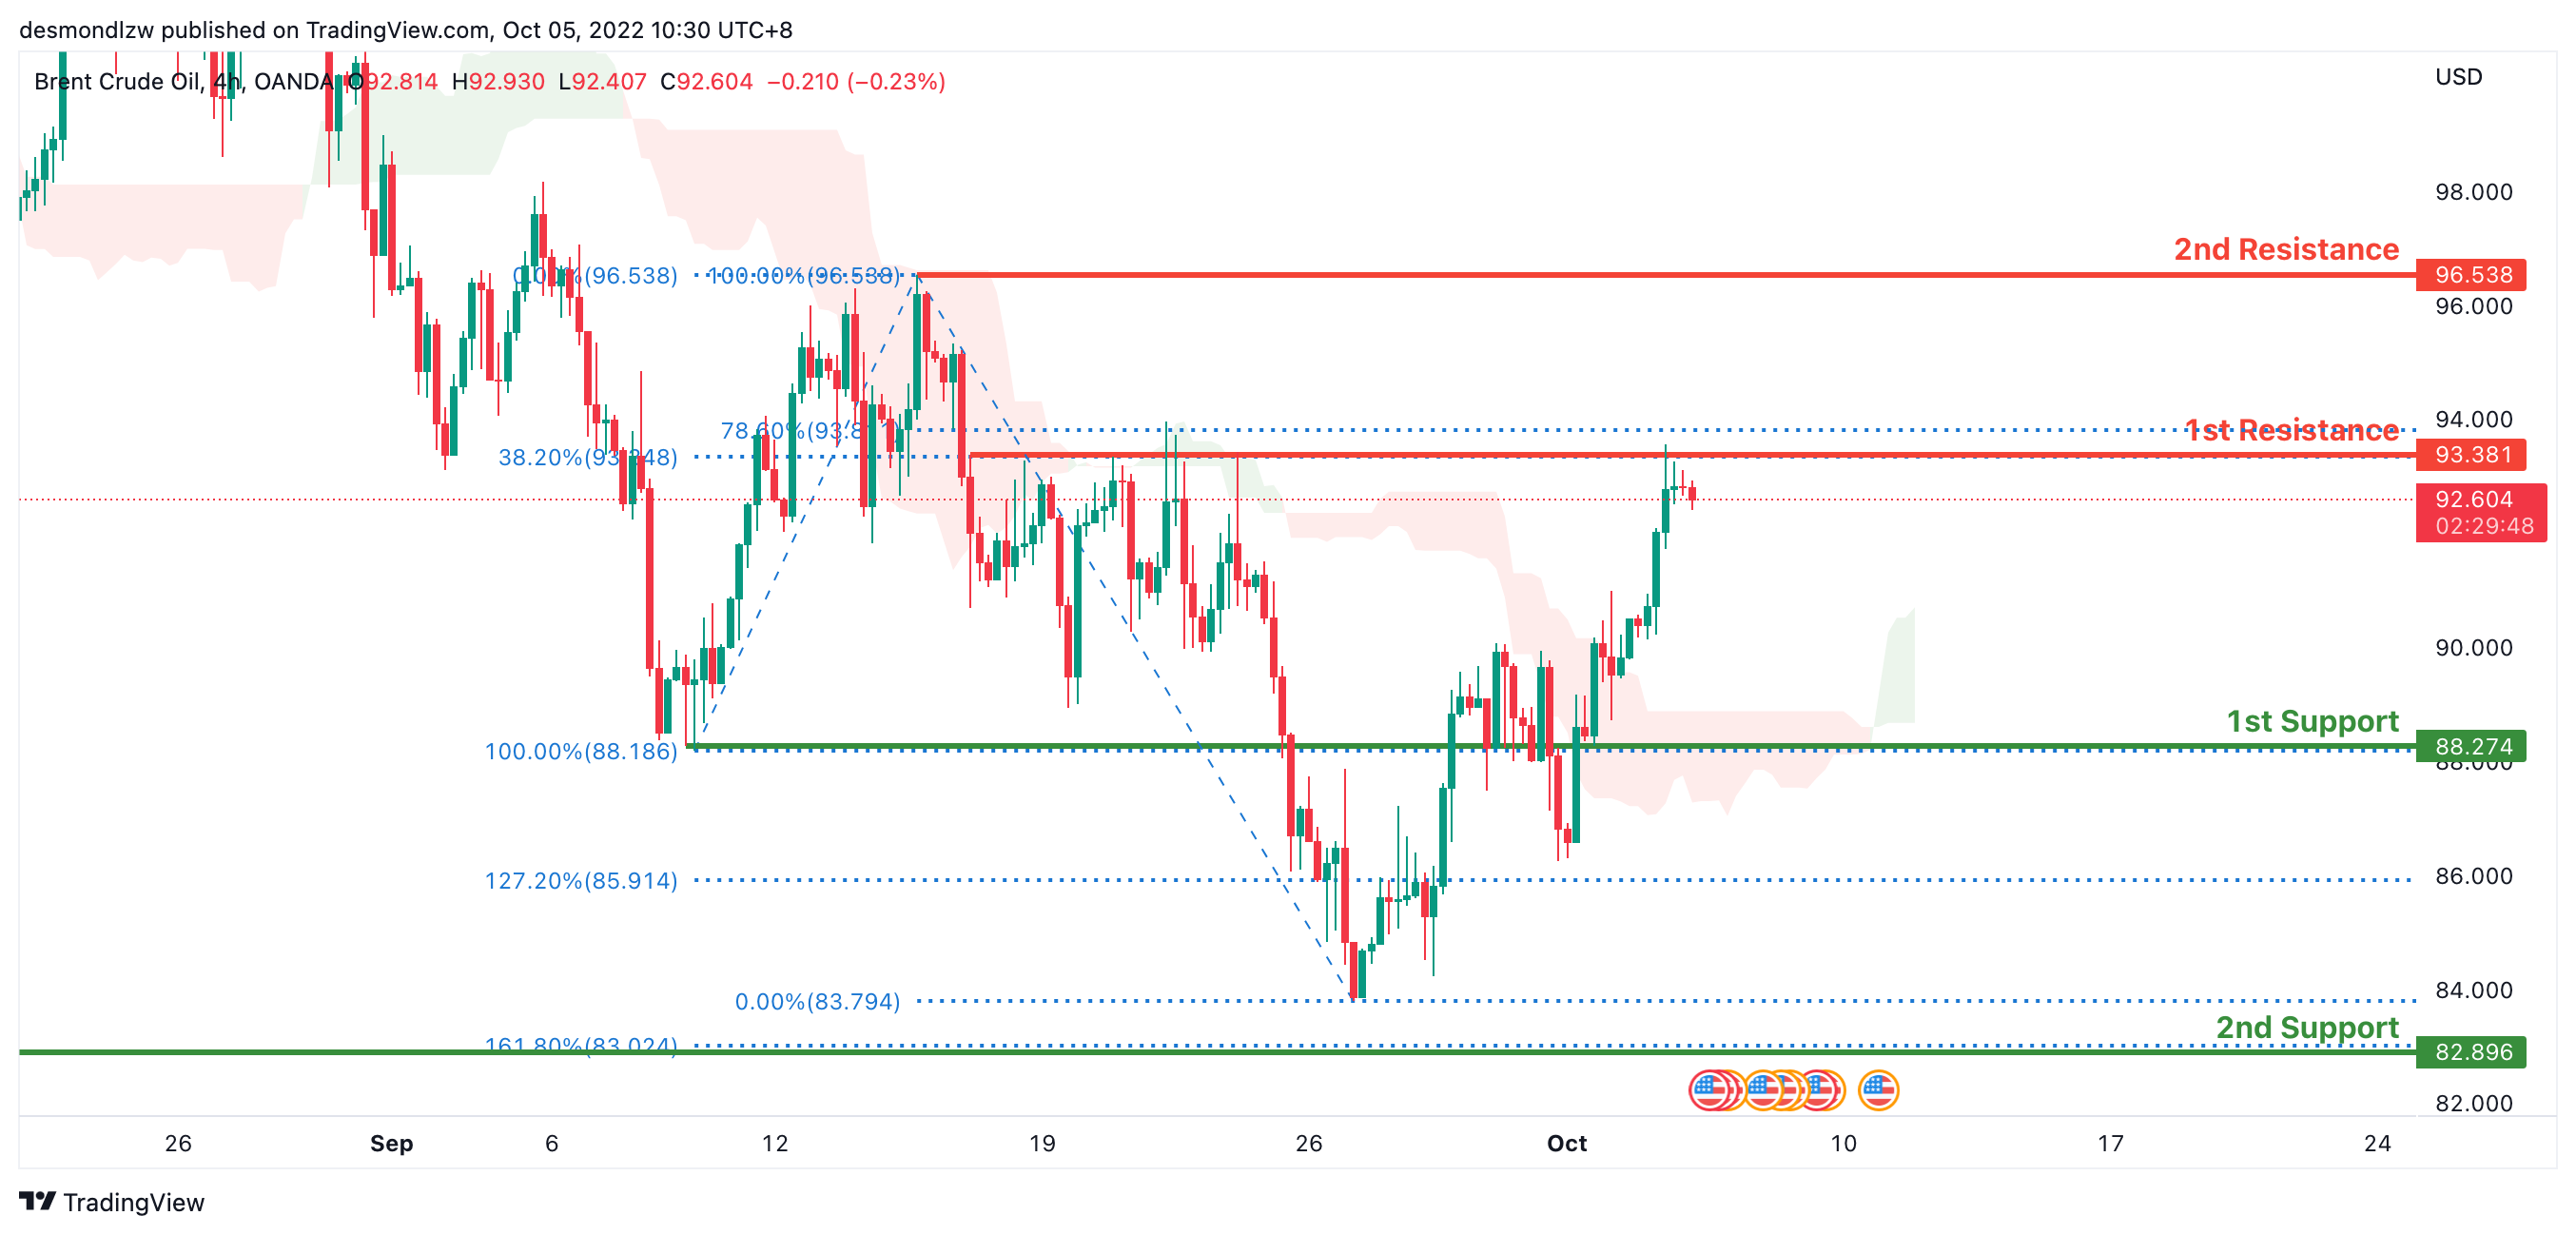
Oil is in a bearish trend on the 4-hour chart. However, price is now above the Ichimoku cloud, indicating that the market is bullish at the moment. Price has broken through the first support level, which has a 100% Fibonacci extension and served as the previous swing low, at 88.788. Overnight, price has tapped onto the first resistance level, where the 38.2% Fibonacci extension line is at 93.381. Expecting price to consolidate around this area.
Areas of consideration:
- H4 time frame, 1st resistance at 93.381
- H4 time frame, 1st support at 88.366
Dow Jones Industrial Average:
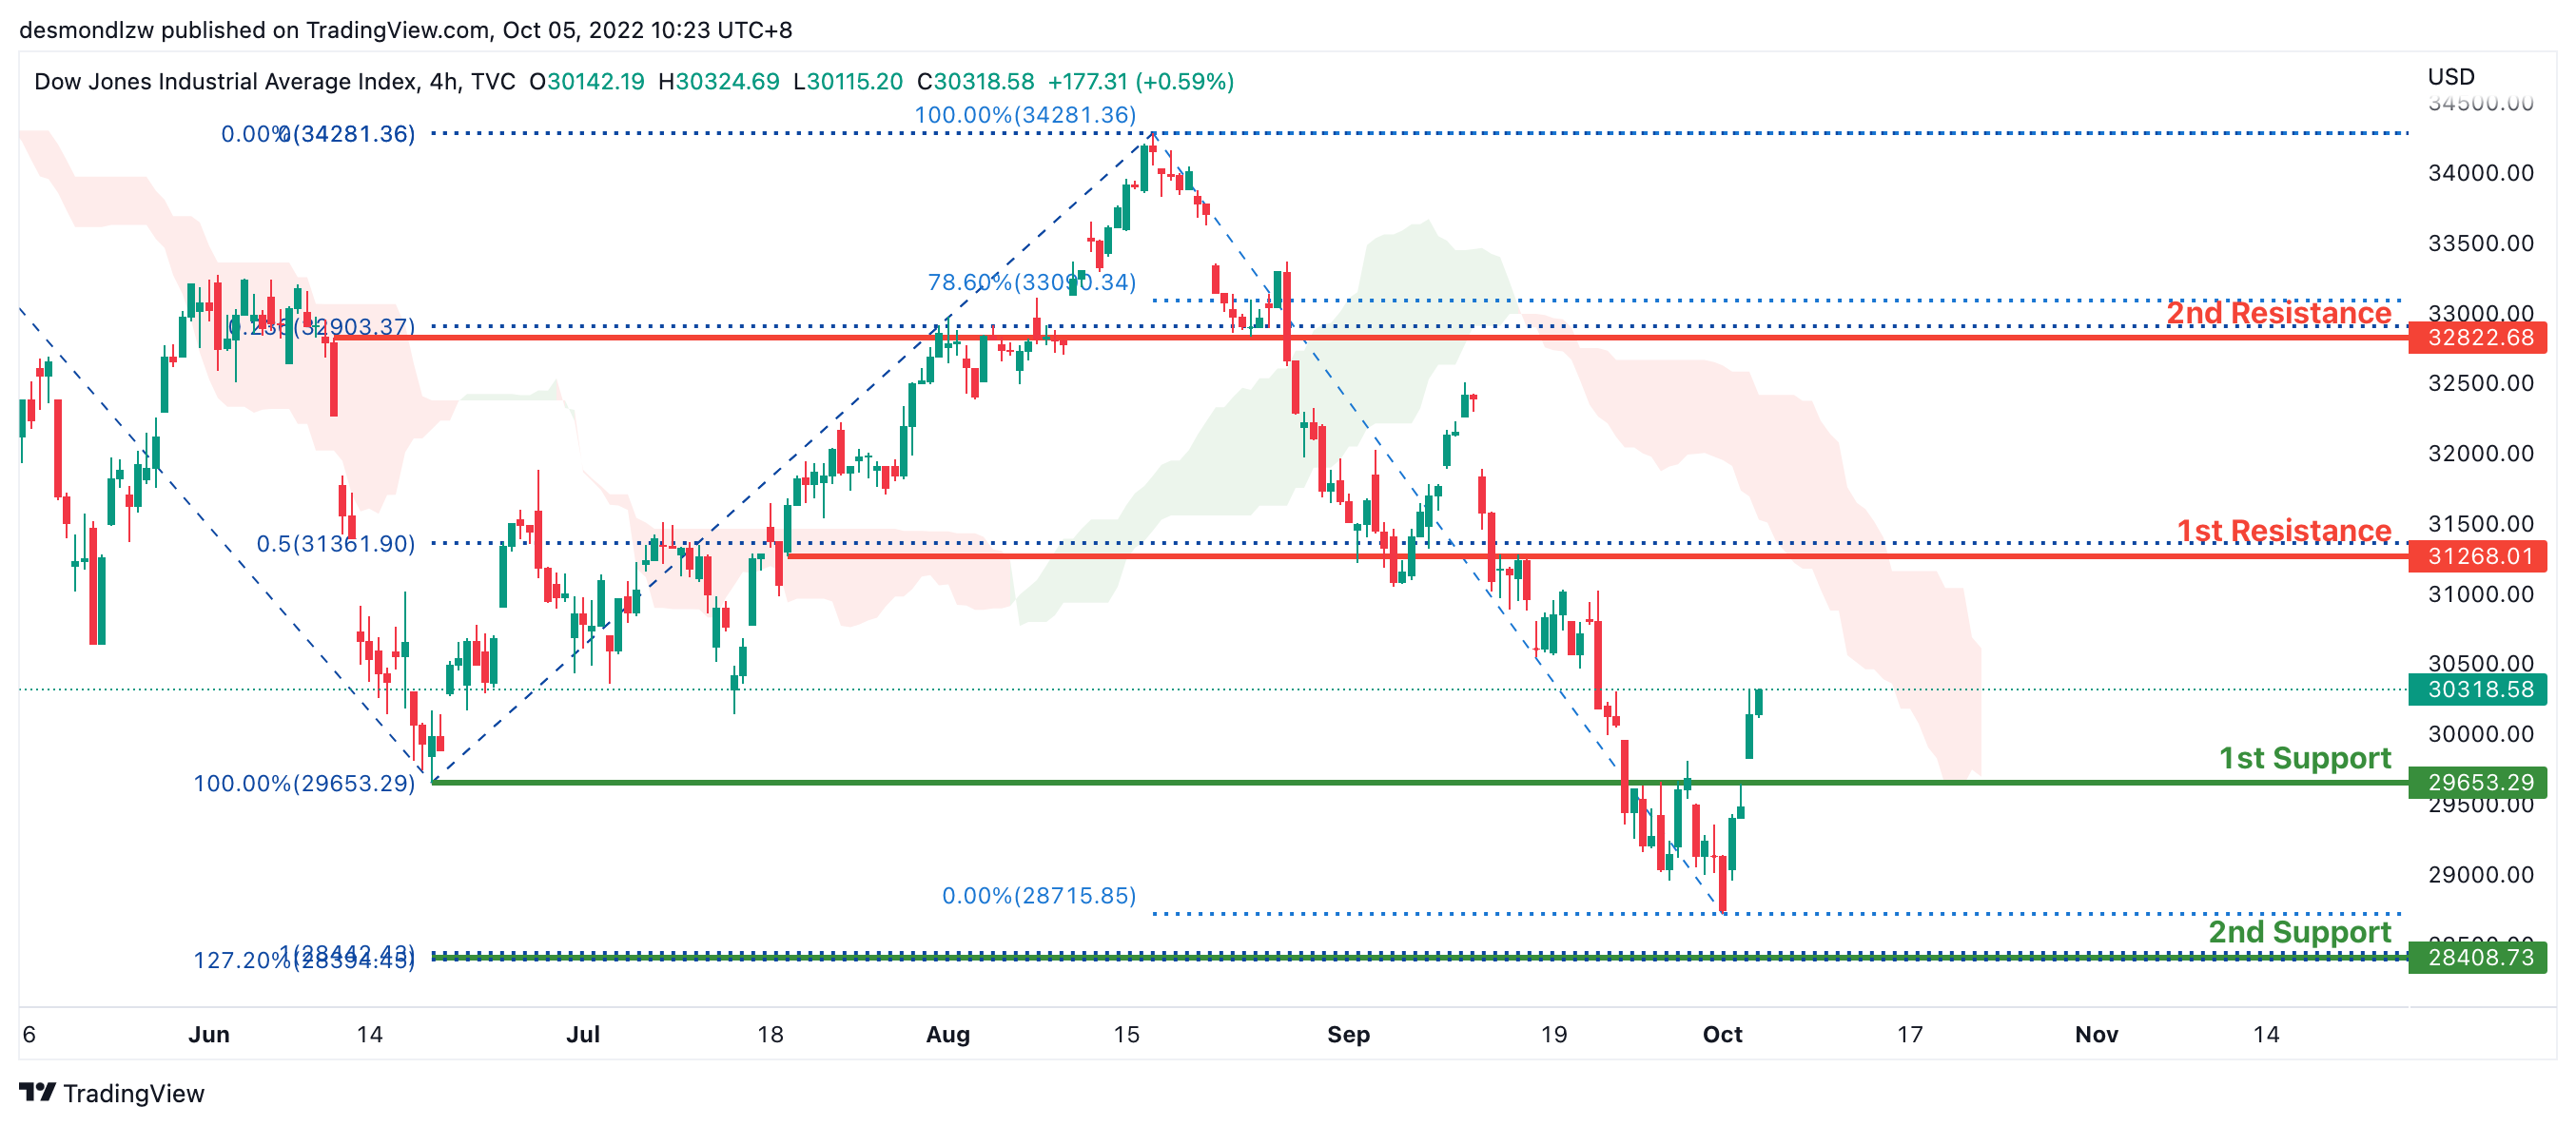
The price is moving downward on the H4 chart. The first support level at 29653.29 has also been breached by the price. Price moved away from the first support level overnight, continuing its upward bullish momentum. The initial resistance level around 28422.42, which is where the 50% Fibonacci line is situated, is where price is anticipated to move.
Areas of consideration:
- H4 time frame, 1st support at 29653.29
- H4 time frame, 1st resistance at 31268.01
DAX:
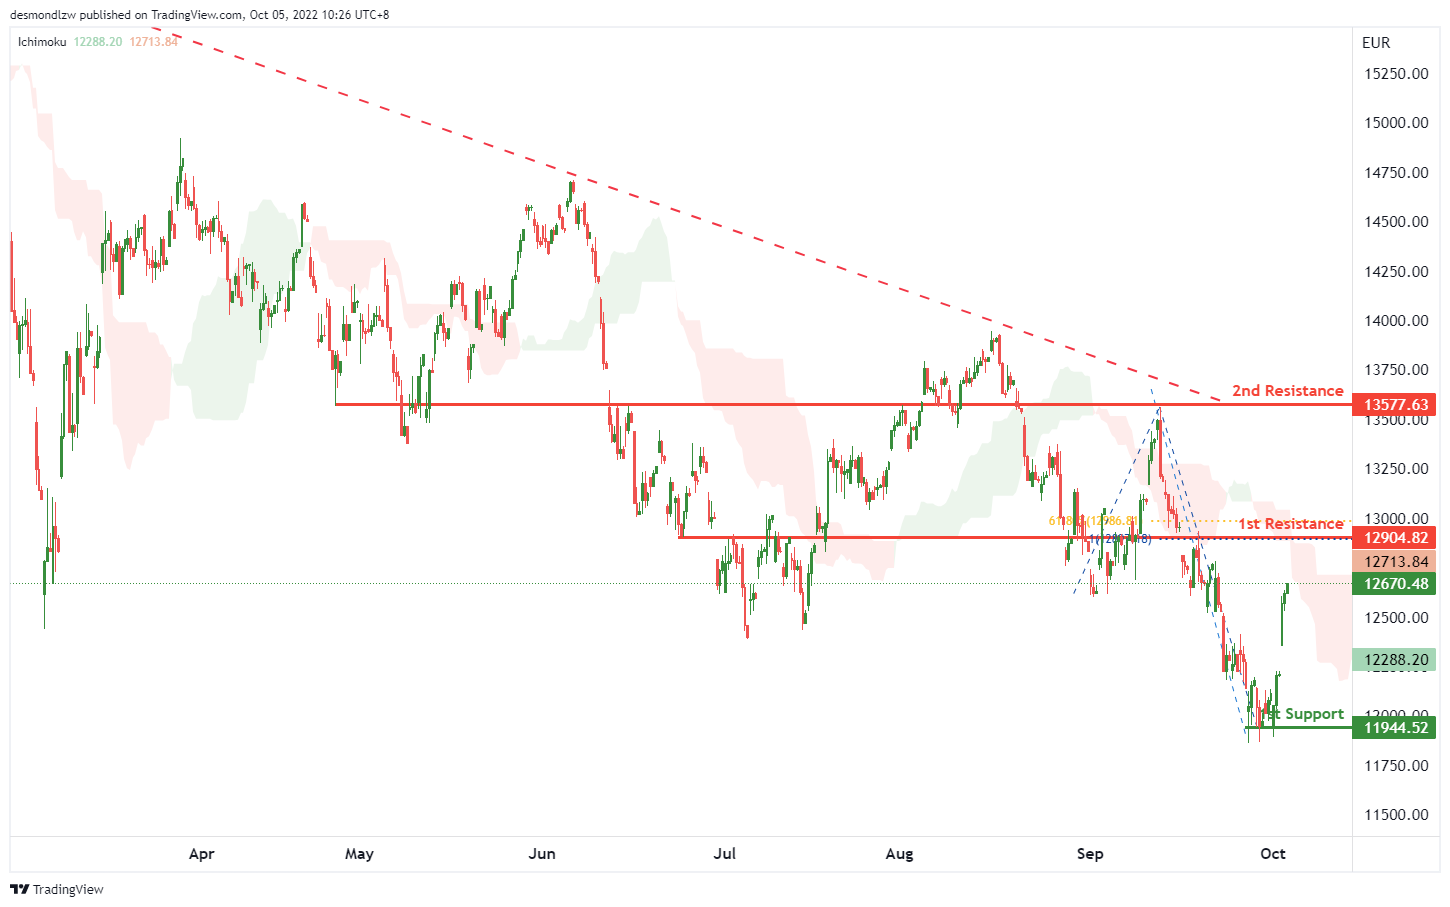
On the H4, with the price bouncing from the 1st support at 11944.52, the price may test the 1st resistance at 12904.82, which is in line with the 100% fibonacci projection and 61.8% fibonacci retracement. If the 1st resistance is broken, the price may rise to the 2nd resistance at 13577.63, where the overlap resistance is. Alternatively, the price may drop back to the 1st support at 11944.52, which is in line with the swing low.
Areas of consideration:
- H4 time frame, 1st resistance at 12904.82
- H4 time frame, 2nd resistance at 13577.63
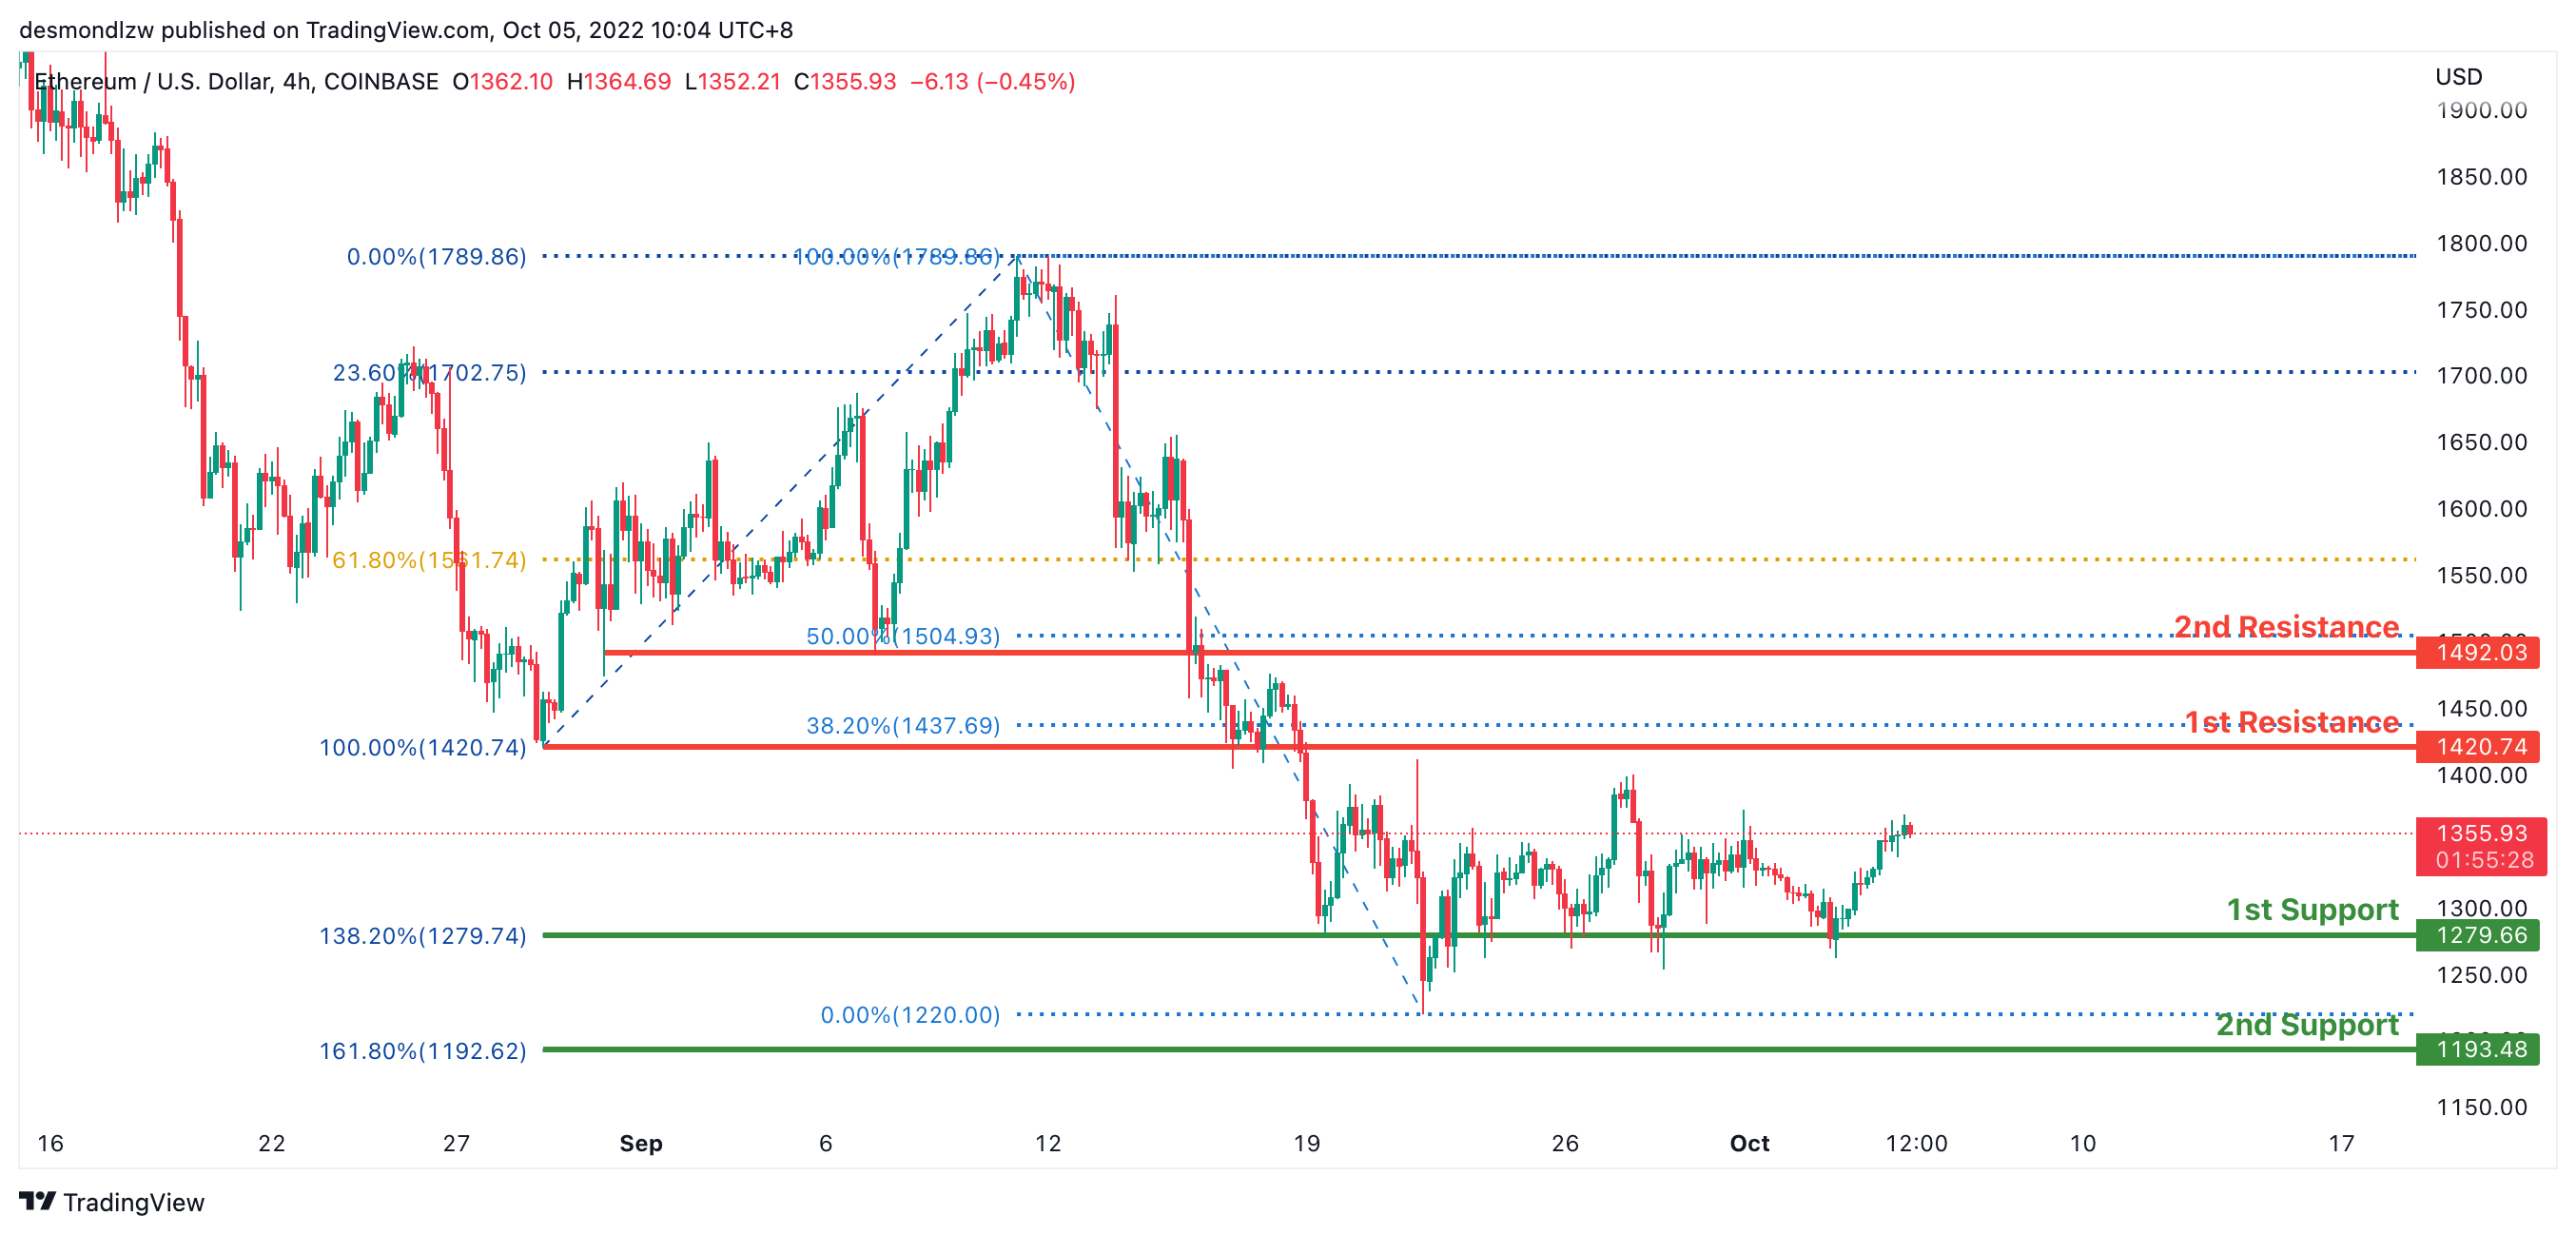
ETHUSD:
The overall price of ETHUSD is quite bearish on the H4. Price has now closed above the Ichimoku cloud, suggesting a potential short-term trend change. Overnight, ETHUSD kept moving upward from the first support level at 1279.74, which is the 138.2% Fibonacci extension line. We anticipate a price reversal to the 100% Fibonacci and 38.2% Fibonacci lines at 1420.74, which is the first resistance line.
Areas of consideration:
- H4 time frame, 1st resistance of 1420.74
- H4 time frame, 1st support at 1279.00
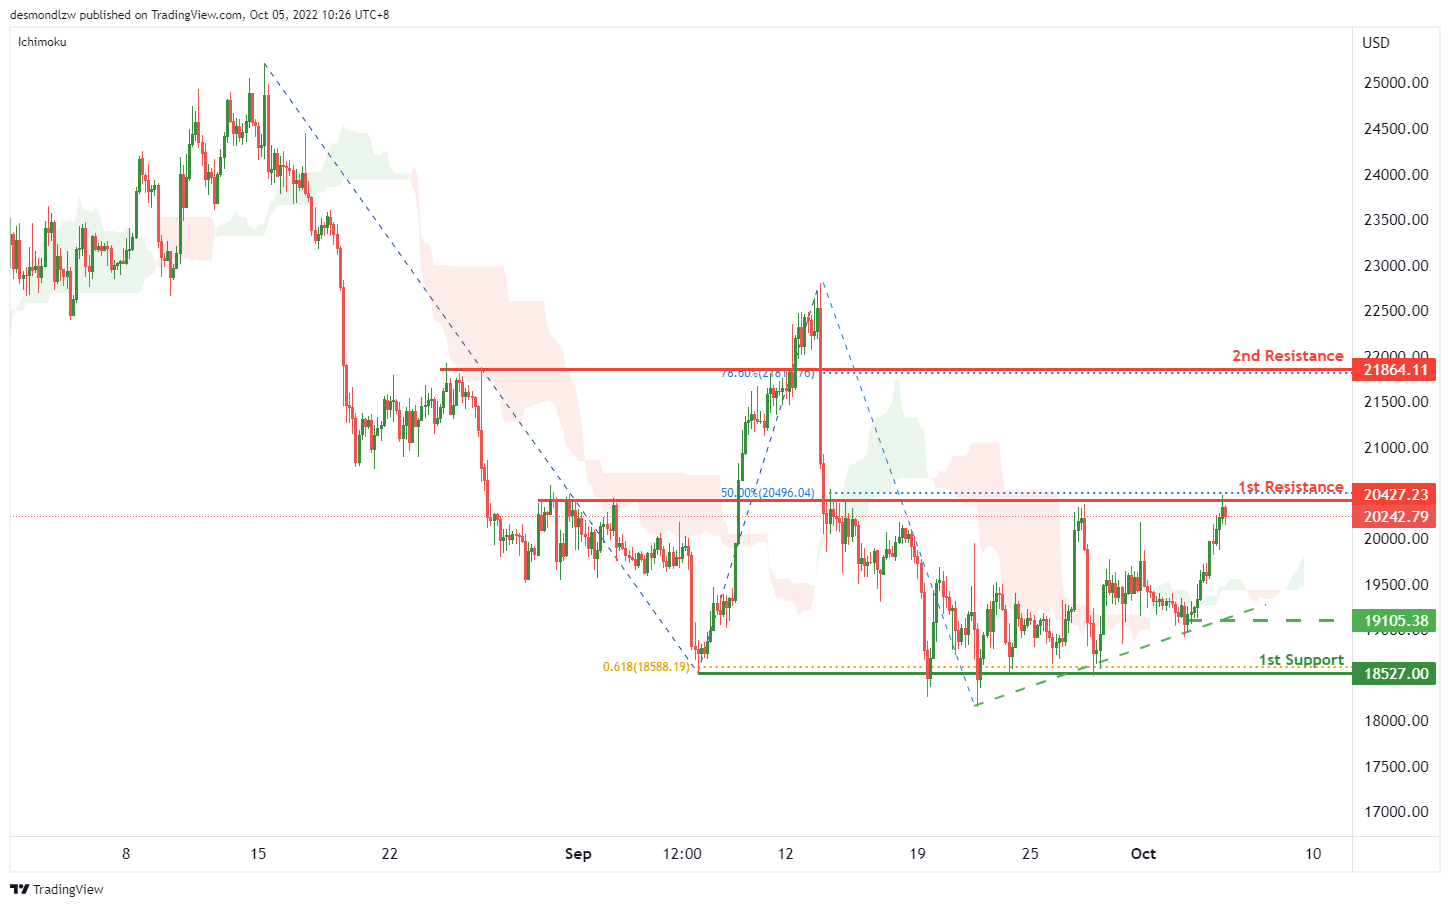
BTCUSD:
On the H4, price is showing a short term ascending trendline and testing the 1st resistance at 20427.23, where the overlap resistance and 50% fibonacci retracement are. If the 1st resistance is broken, the next resistance could be at 21864.11, which is in line with the 78.6% fibonacci retracement. Alternatively, the price may pull back from the 1st resistance and drop to the 1st support at 18527, which is in line with the swing lows and 61.8% fibonacci projection. Take note the 19105.38 could be the intermediate support.
Areas of consideration:
- H4 time frame, 1st resistance at 20427.23
- H4 time frame, 2nd resistance at 21864.11
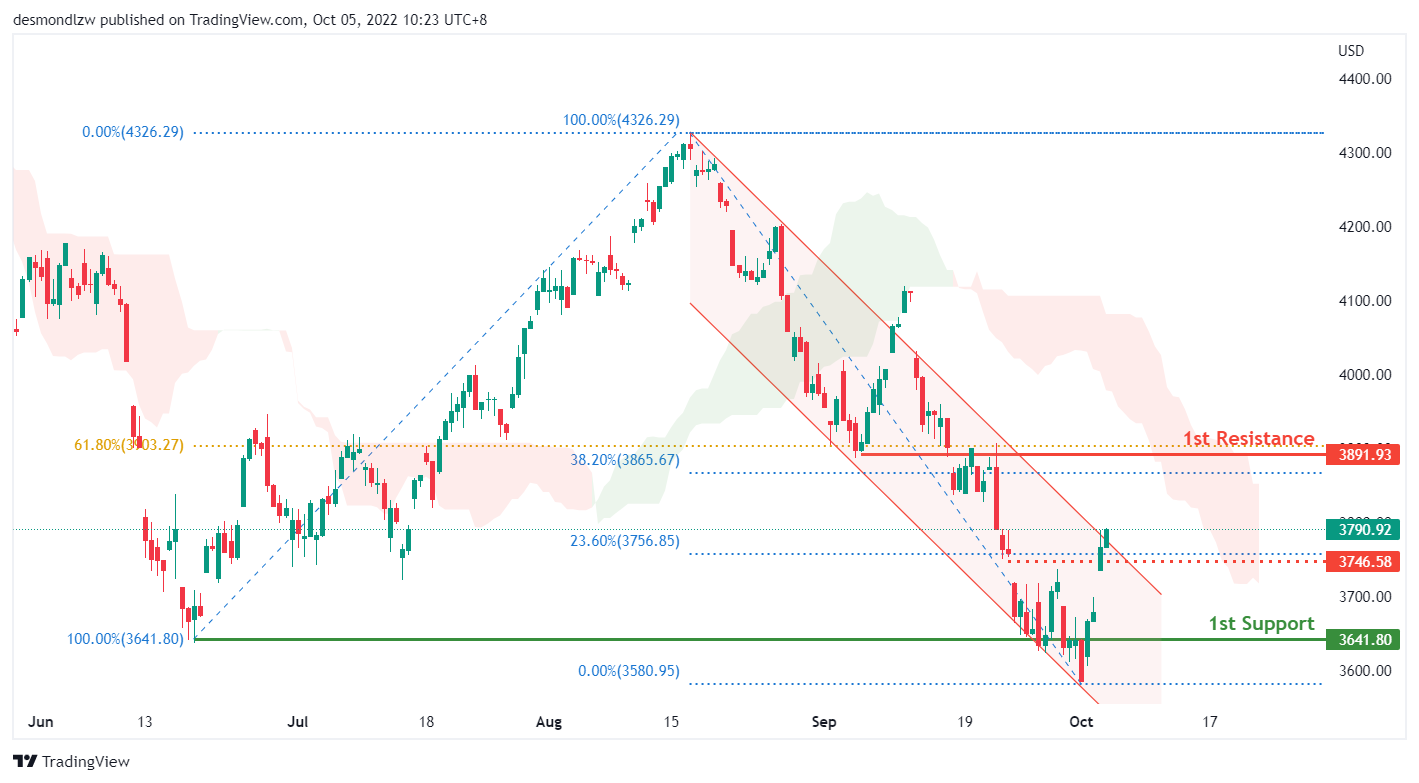
S&P 500:
On the H4, with the price trading higher from 1st support of 3642, previous swing low of June 2022 and the interim risk level of 3746.58 which is in line with the 23.60% fibonacci retracement level, we continue to have a bearish bias. With the price breaking out of the descending channel but below the ichimoku cloud, the price could continue trading higher to the 1st resistance of 3892.
Areas of consideration:
- H4 time frame, 1st resistance at 3892
- H4 time frame, 1st support at 3642
EUR/USD Daily Outlook
Daily Pivots: (S1) 0.9862; (P) 0.9930; (R1) 1.0055; More...
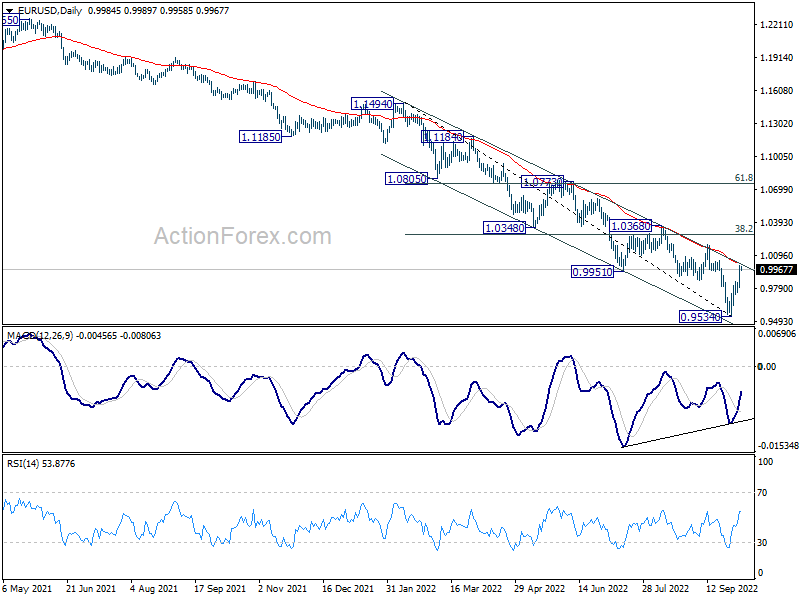
EUR/USD's rebound from 0.9534 is still in progress and intraday bias stays on the upside. Considering bullish convergence condition in daily MACD, sustained break of 55 day EMA (now at 1.0022) will raise the chance of medium term bottoming at 0.9534. Further rally should then be seen to 38.2% retracement of 1.1494 to 0.9534 at 1.0283. On the downside, though, break of 0.9734 minor support will bring retest of 0.9534 low instead.
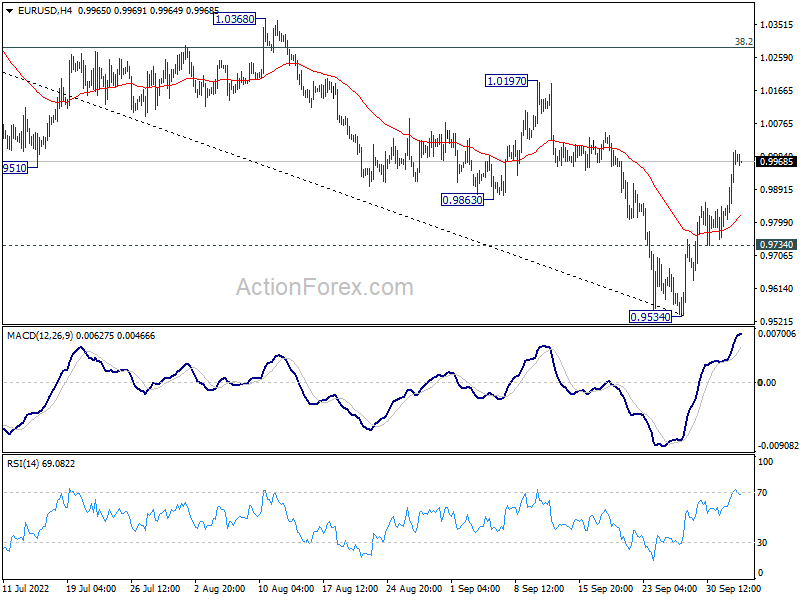
In the bigger picture, down trend from 1.6039 (2008 high) is still in progress. Next target is 100% projection of 1.3993 to 1.0339 from 1.2348 at 0.8694. In any case, break of 1.0197 resistance is needed to be the first sign of medium term bottoming. Otherwise, outlook will stay bearish even with strong rebound.
NZD Rises after RBNZ Hike, Dollar Stays as Worst Performer
New Zealand Dollar rises broadly in quiet markets today, after RBNZ delivered the 50bps rate hike as widely expected, clearing the doubt that it will follow RBA and opt for a smaller hike. Dollar remains the worst performer of the week, following strong risk rebound in stock markets, while yields weakened. Yen is the second weakest, only slightly better than Dollar. Sterling is so far the winner, continuing to reverse prior deep losses while Euro and Swiss France are also firm.
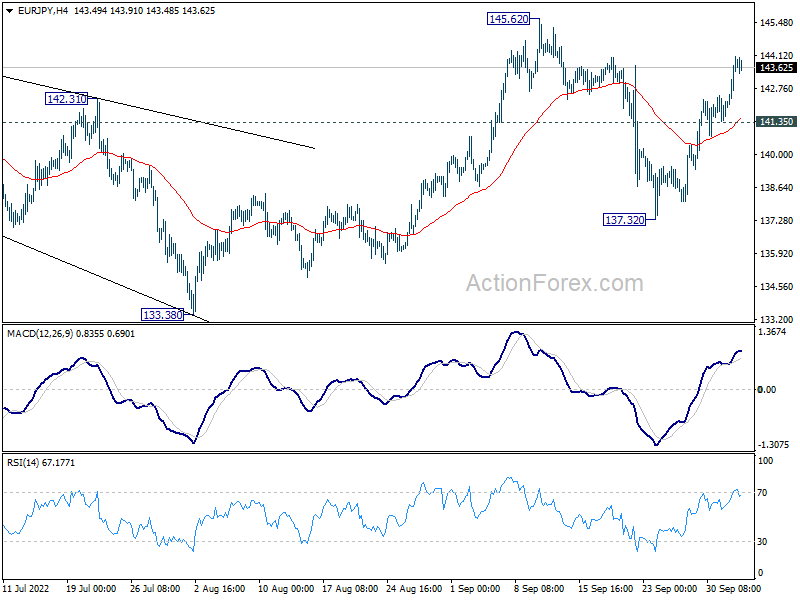
Technically, a focus for now is whether Euro and Sterling could maintain upside momentum to solidify it as a trend. 4 hour RSI in EUR/JPY is dipping back from overbought region, suggesting that there may loss of upside momentum. Break of 140.35 minor support will suggest rejection by 145.62 high, to start the third leg of the consolidation pattern from there.
In Asia, at the time of writing, Nikkei is up 0.36%. Hong Kong HSI is up 5.47%. Singapore Strait Times is up 0.35%. Japan 10-year JGB yield is up 0.0312 at 0.263. Overnight, DOW rose 2.80%. S&P 500 rose 3.06%. NASDAQ rose 3.34%. 10-year yield dropped -0.034 to 3.617.
RBNZ hikes by 50bps, considered 75bps
RBNZ raises Official Cash Rate by 50bps 3.50% as widely expected. In the summary of record it's noted that the Committee considered whether to hike by 50bps or 75bps, but decided that 50bps was appropriate at this meeting.
In the statement, RBNZ noted that domestic spending has remained "resilient". Employment levels are "high" while productivity capacity is "constrained" by labor shortages. wage pressures are "heightened". Also, "spending continues to outstrip the capacity to supply goods and services, with a range of indicators continuing to highlight broad-based pricing pressures."
AUD/NZD topped but not reversing yet
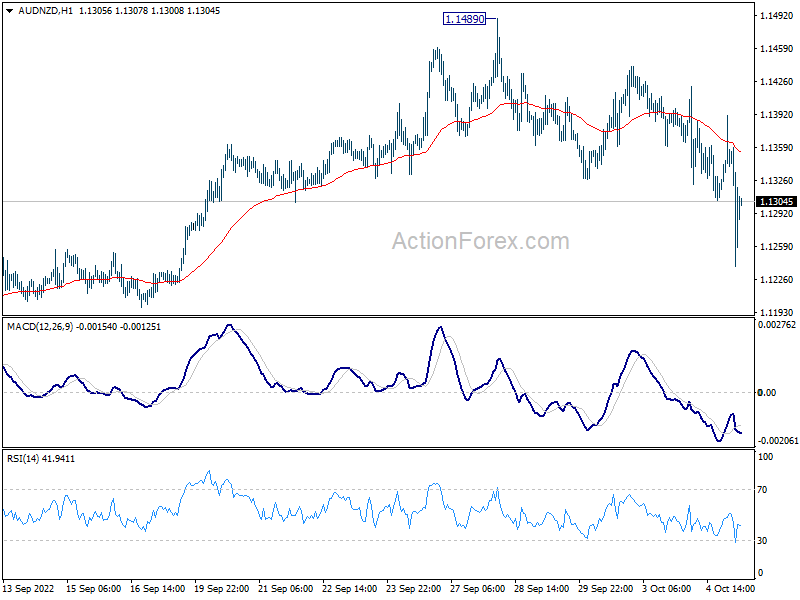
AUD/NZD spikes lower after RBNZ's 50bps rate hike. The development also came with the background that RBA disappointed the markets with a 25bps hike yesterday.
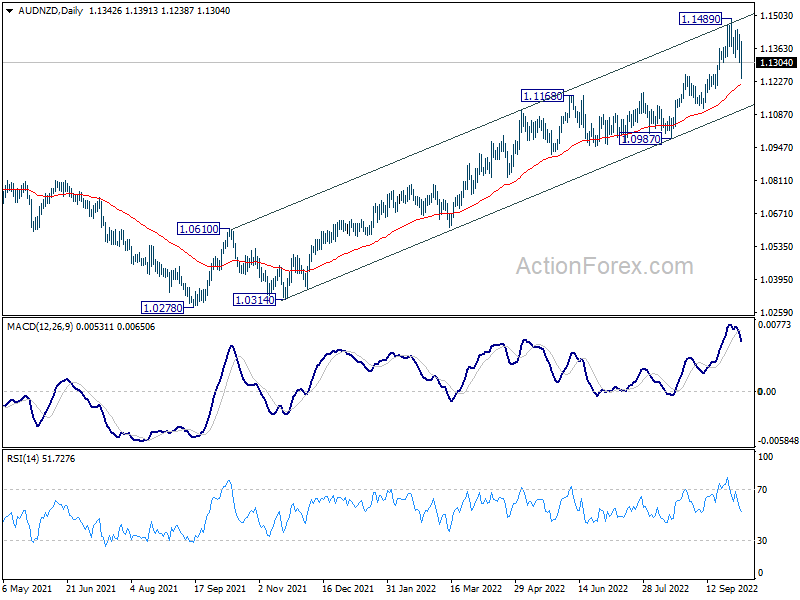
Technically, a short term top was in place at 1.1489 after AUD/NZD hit medium term channel resistance. But it's still early to call for a medium term correction. As long as 55 day EMA (now at 1.1211) holds, the consolidation from 1.1489 should be relatively brief, and larger up trend should resume sooner rather than later.
However, firm break of the 55 day EMA will open up deeper correction through channel support to 1.0987, before having some support for a bounce.
Looking ahead
Germany trade balance, France industrial production, Eurozone PMI services final, and UK PMI services final will be featured in European session.
Later in the day, US will release ADP employment, trade balance and ISM services. Canada will release building permits and trade balance.
EUR/USD Daily Outlook
Daily Pivots: (S1) 0.9862; (P) 0.9930; (R1) 1.0055; More...
EUR/USD's rebound from 0.9534 is still in progress and intraday bias stays on the upside. Considering bullish convergence condition in daily MACD, sustained break of 55 day EMA (now at 1.0022) will raise the chance of medium term bottoming at 0.9534. Further rally should then be seen to 38.2% retracement of 1.1494 to 0.9534 at 1.0283. On the downside, though, break of 0.9734 minor support will bring retest of 0.9534 low instead.
In the bigger picture, down trend from 1.6039 (2008 high) is still in progress. Next target is 100% projection of 1.3993 to 1.0339 from 1.2348 at 0.8694. In any case, break of 1.0197 resistance is needed to be the first sign of medium term bottoming. Otherwise, outlook will stay bearish even with strong rebound.
Economic Indicators Update
| GMT | Ccy | Events | Actual | Forecast | Previous | Revised |
|---|---|---|---|---|---|---|
| 01:00 | NZD | RBNZ Interest Rate Decision | 3.50% | 3.50% | 3.00% | |
| 06:00 | EUR | Germany Trade Balance (EUR) Aug | 4.0B | 5.4B | ||
| 06:45 | EUR | France Industrial Output M/M Aug | -0.30% | -1.60% | ||
| 07:45 | Italy | Italy Services PMI Sep | 49.2 | 50.5 | ||
| 07:50 | EUR | France Services PMI Sep F | 53 | 53 | ||
| 07:55 | EUR | Germany Services PMI Sep F | 45.4 | 45.4 | ||
| 08:00 | EUR | Eurozone Services PMI Sep F | 50.2 | 48.9 | ||
| 08:30 | GBP | Services PMI Sep F | 49.2 | 49.2 | ||
| 12:15 | USD | ADP Employment Change Sep | 200K | 132K | ||
| 12:30 | USD | Trade Balance (USD) Aug | -67.8B | -70.6B | ||
| 12:30 | CAD | Building Permits M/M Aug | -0.80% | -6.60% | ||
| 12:30 | CAD | International Merchandise Trade (CAD) Aug | 3.5B | 4.1B | ||
| 13:45 | USD | Services PMI Sep F | 49.2 | 49.2 | ||
| 14:00 | USD | ISM Services PMI Sep | 56 | 56.9 | ||
| 14:30 | USD | Crude Oil Inventories | -0.2M |