Sample Category Title
Technical Outlook and Review
USD/JPY:
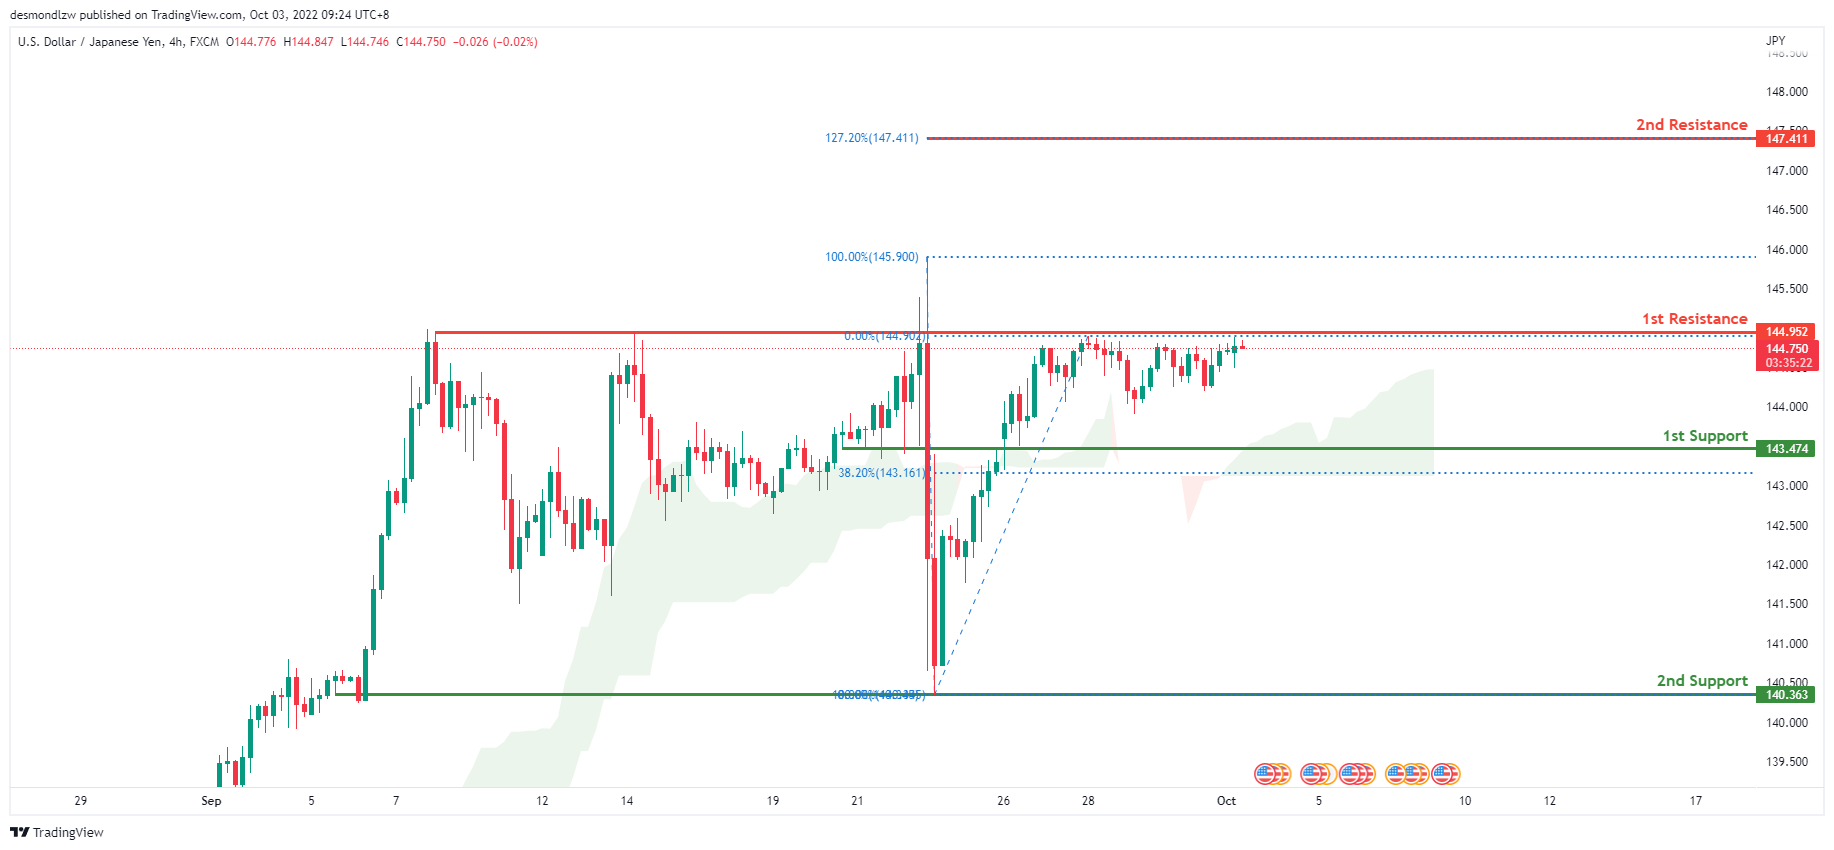
Price is in a strong bullish trend on the H4 chart. In addition, the price is above the ichimoku cloud, indicating a bullish market. Price has been consolidating near 144.952, the 0% Fibonacci line, for the past week following the Bank of Japan’s intervention. Price is expected to break through the first resistance and move towards the second resistance at 147.411 where the 127.2% Fibonacci expansion extension line is located.
Areas of consideration:
- H4 time frame, 1st resistance at 144.952
- H4 time frame, 1st support at 143.474
DXY:
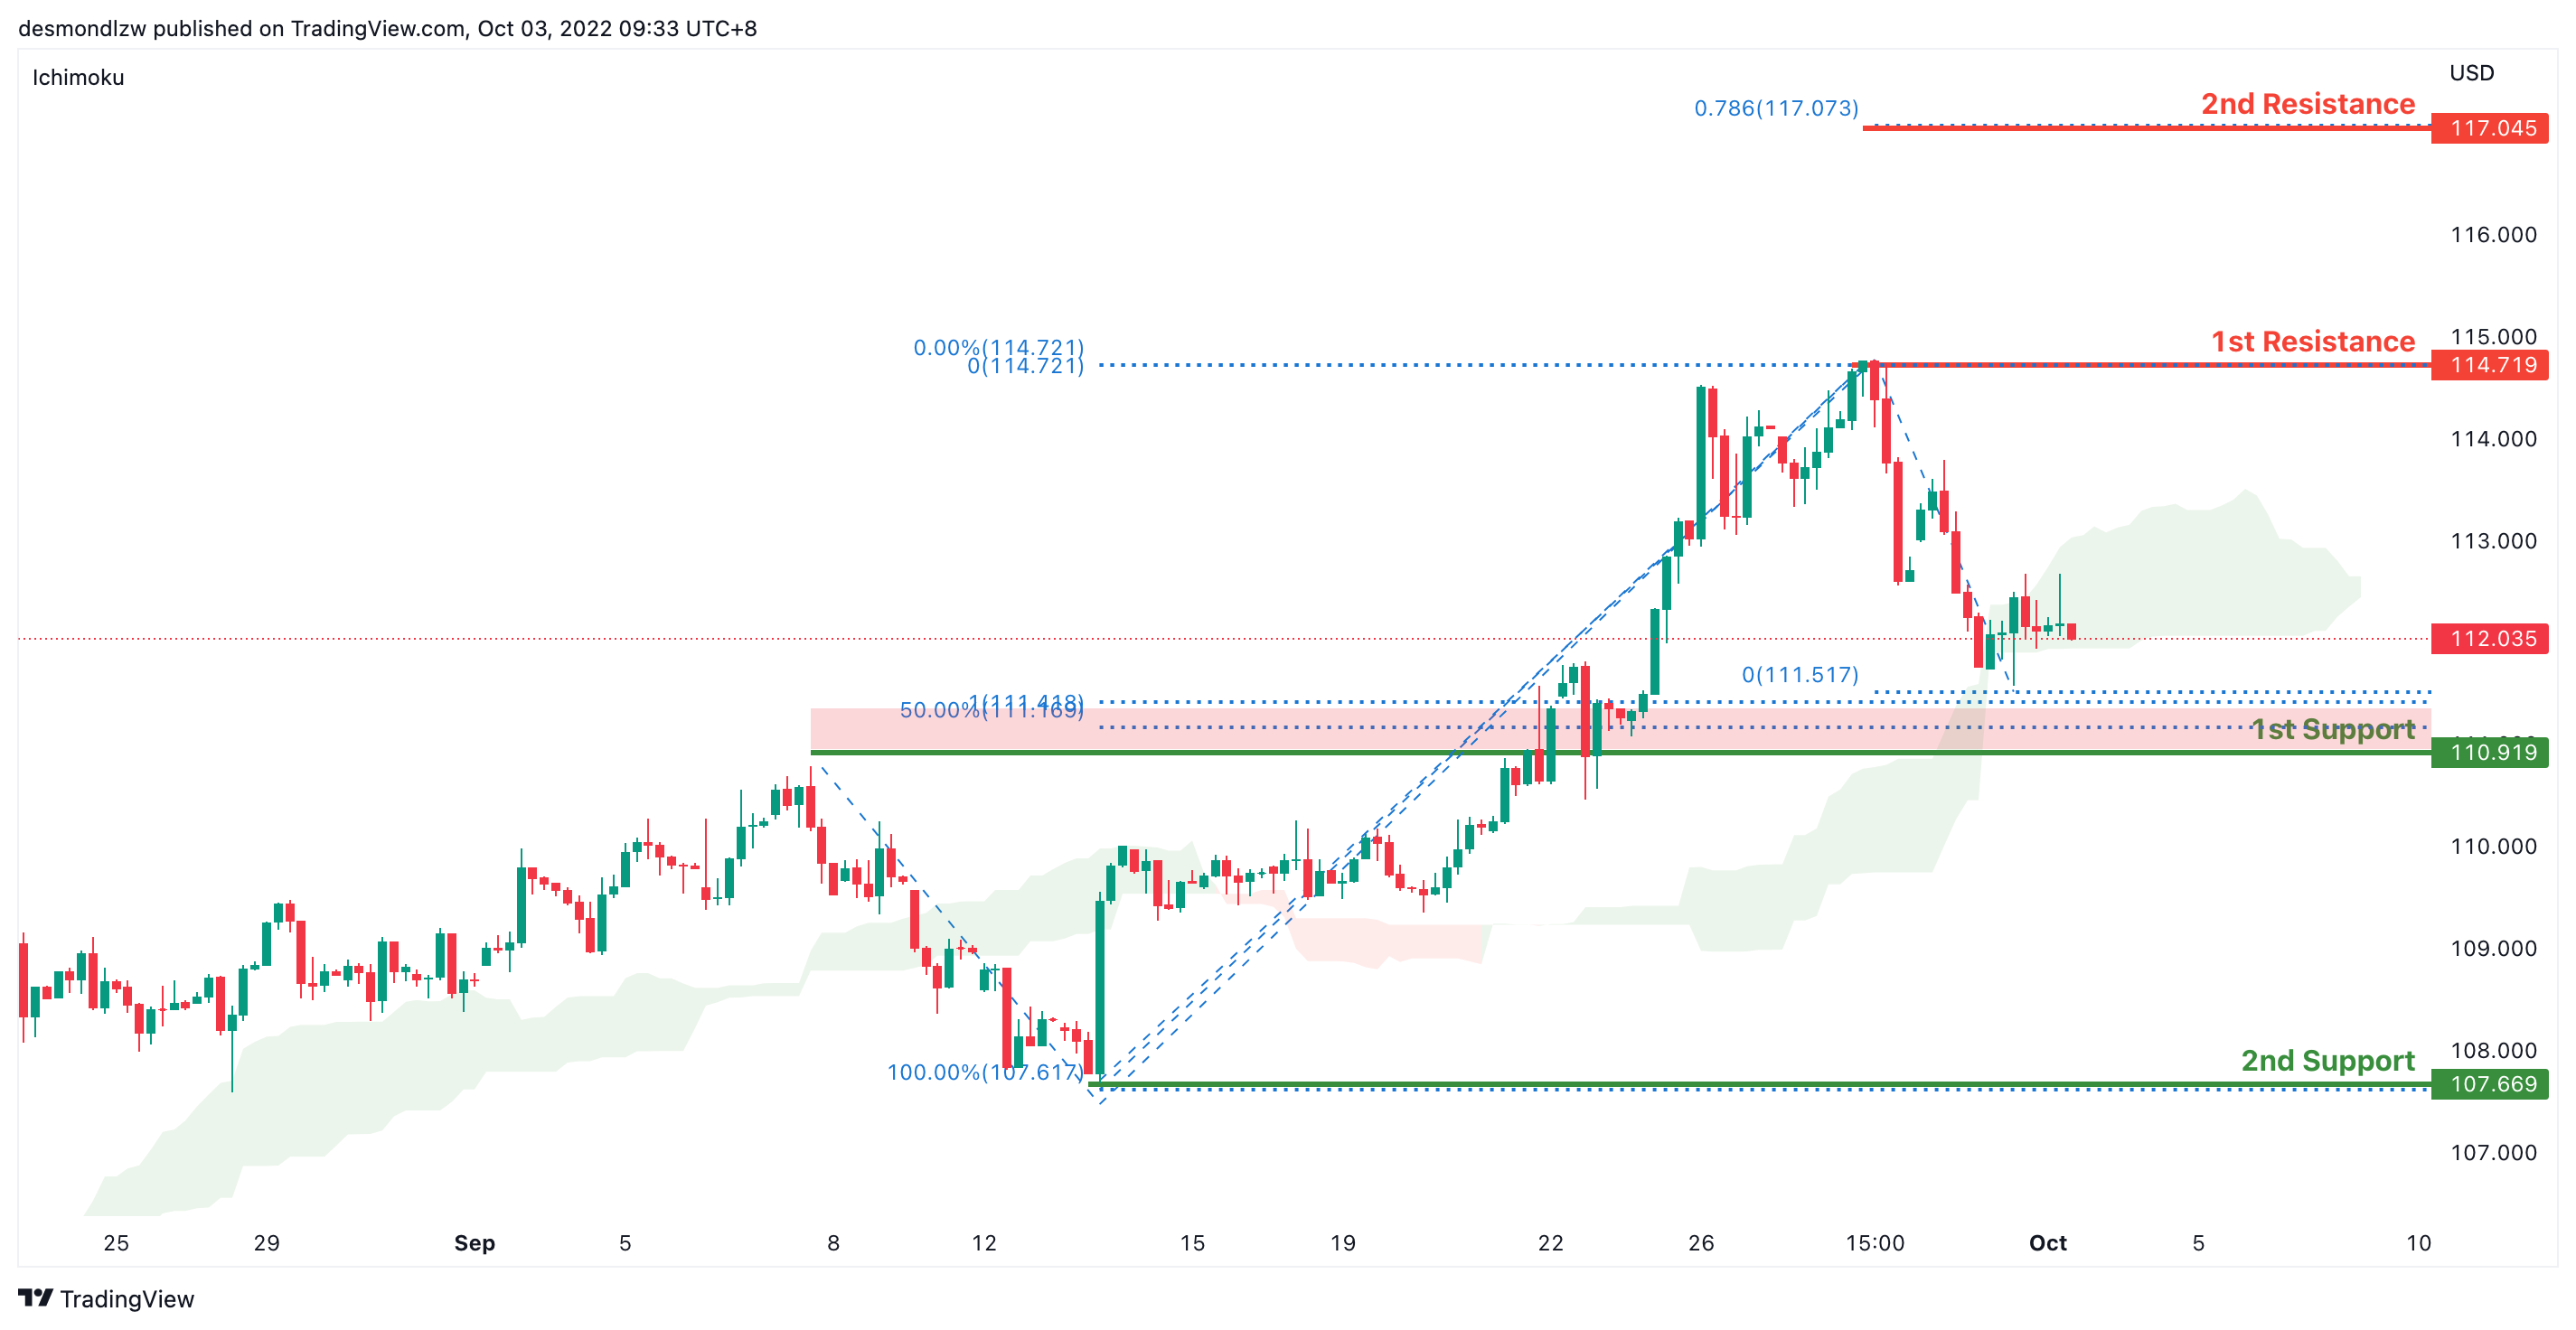
On the H4, price has broken the ichimoku and has pulled back slightly forming a double top- we are bearish bias. Price has rejected the first resistance and pulled back to test the first support at 110.919 where the 50% retracement and 100% projection sits. If price breaks this support it should test the second support at 107.669 where the previous swing low sits. Alternatively price could test the first resistance again at 114.719 levels where the previous swing high sits and if it breaks this level, price might test the second resistance at 117.045 where the 78.6% projection sits.
Areas of consideration:
- H4 time frame, 1st resistance at 114.719
- H4 time frame, 1st support at 110.919
EUR/USD:
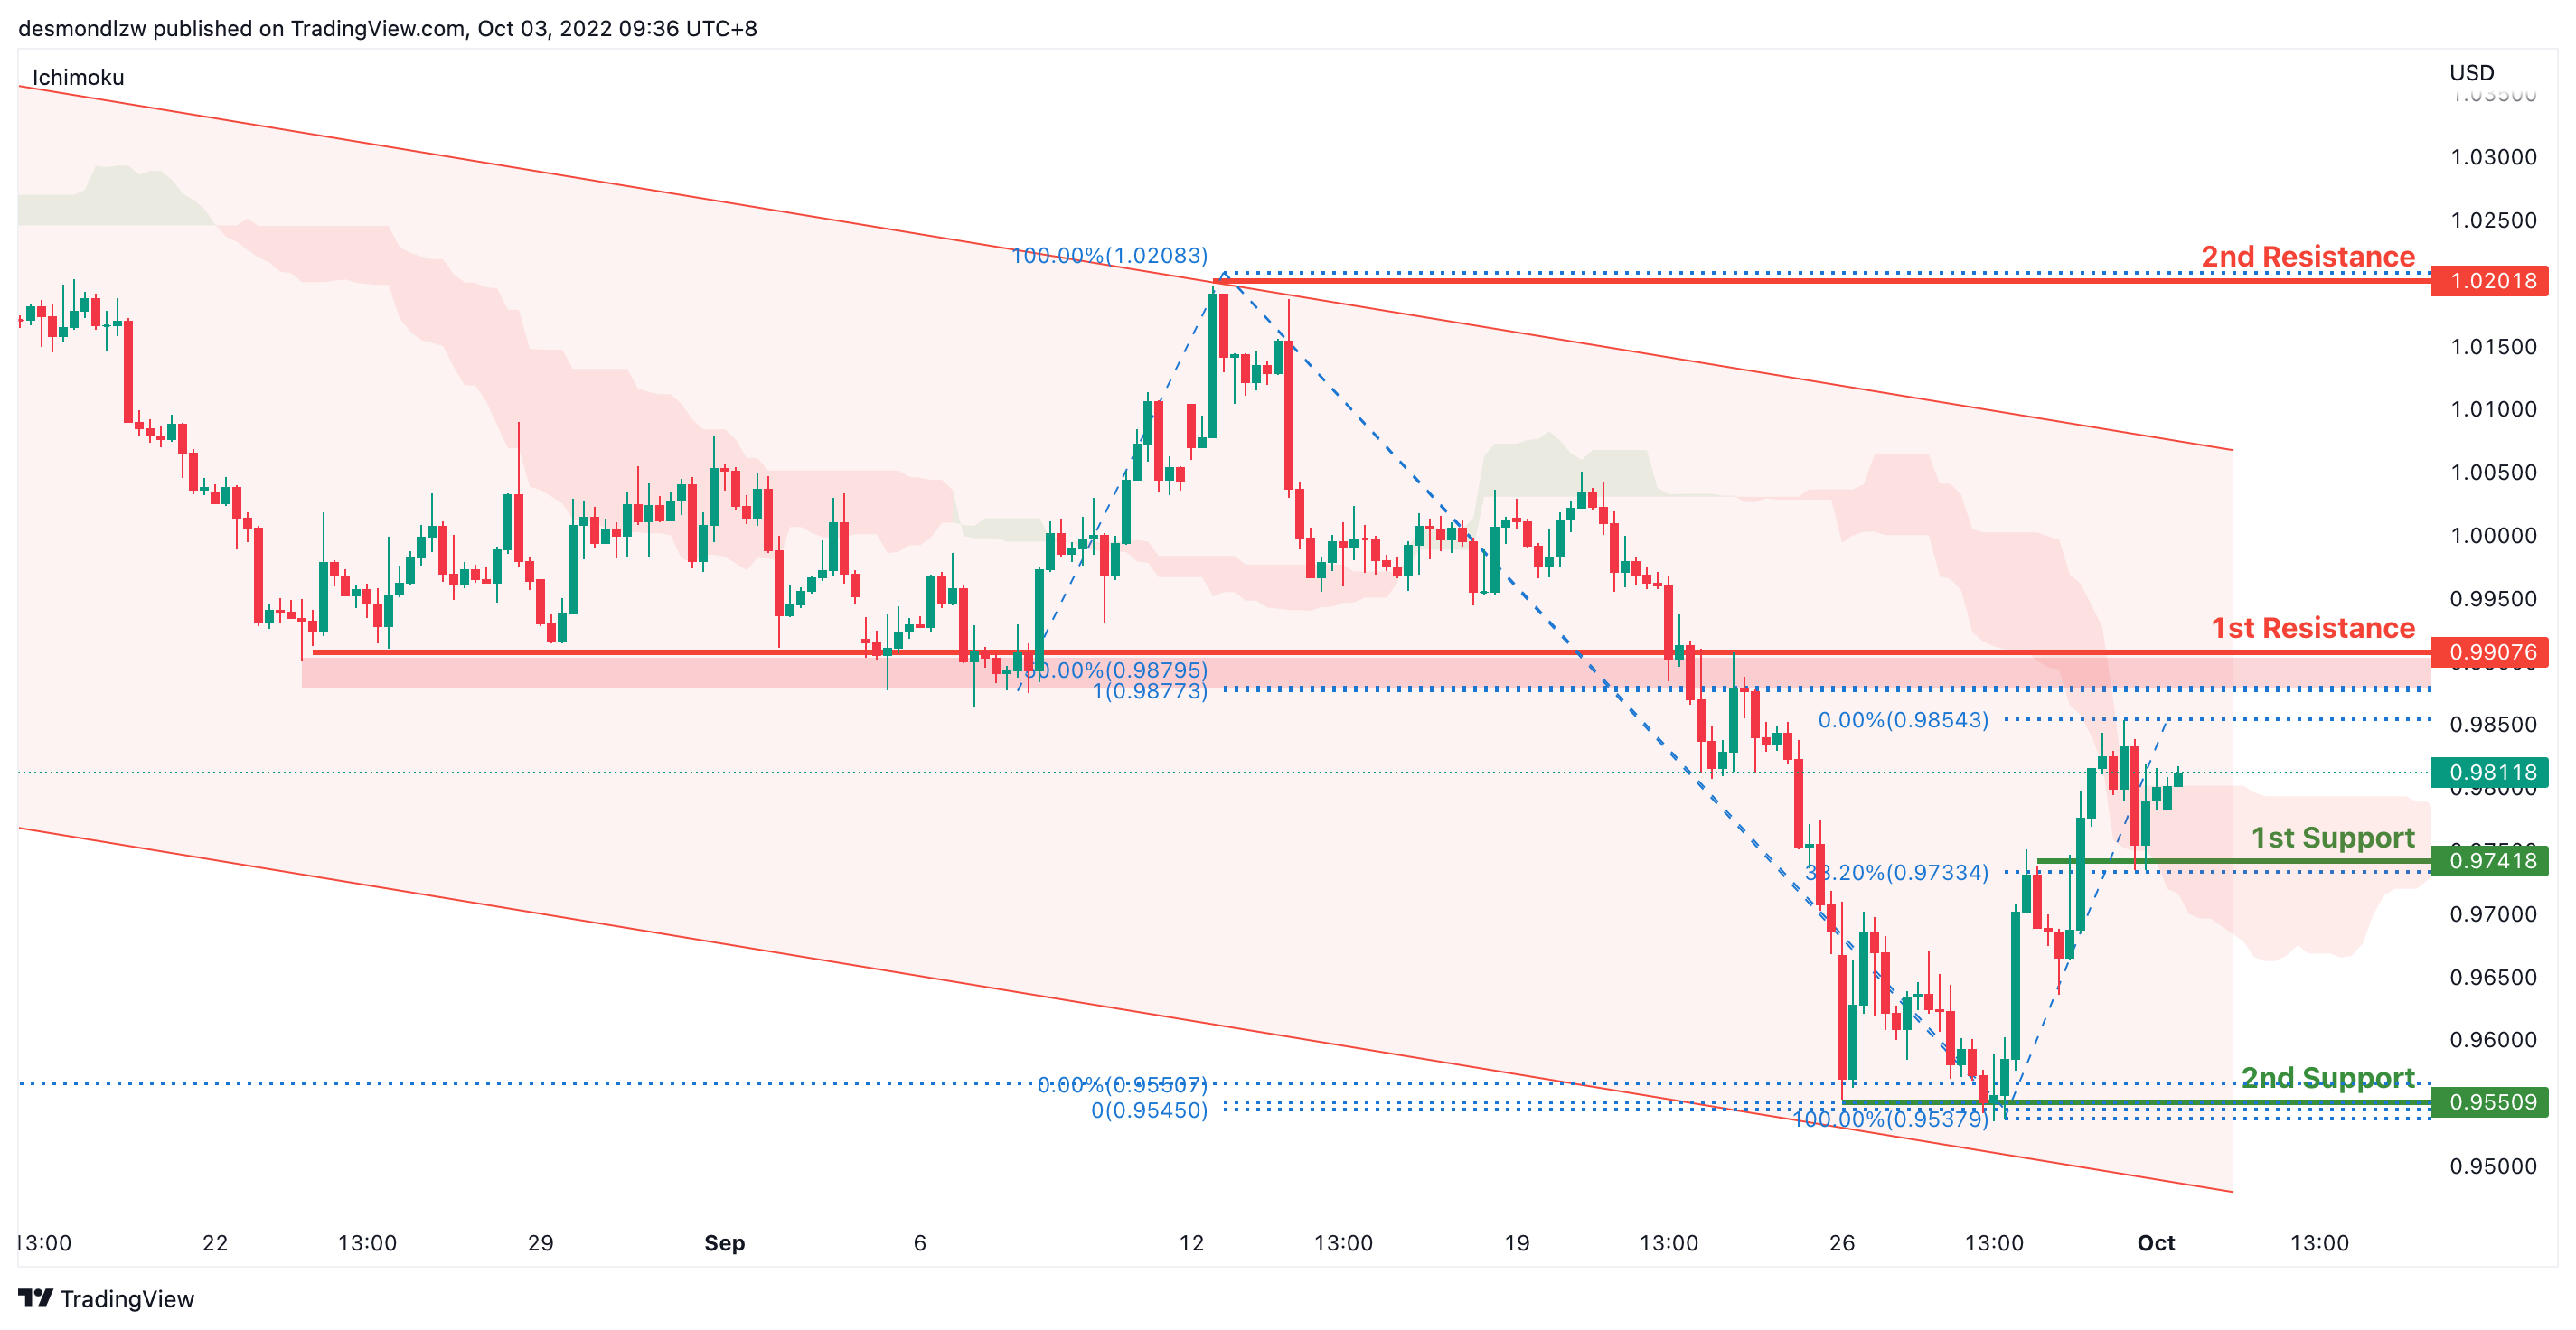
On the H4, price is moving within the channel but in an ascending manner- we are slightly bullish biased. Price has bounced off the first support and is moving toward the first resistance at 0.990 where the 100% projection and 50% retracement sits. If price breaks this level, it will test the second resistance at 1.0201 where the previous swing high sits. Alternatively, the overall bearish momentum could bring price back to test the first support at 0.9741 where the previous swing low and 38.2% retracement sits. If it breaks this level, we have a strong bearish confirmation to bring price down to 0.9550 where the 161.8% extension and swing low sits
Areas of consideration :
- H4 1st resistance at 0.9907
- H4 1st support at 0.9741
GBP/USD:
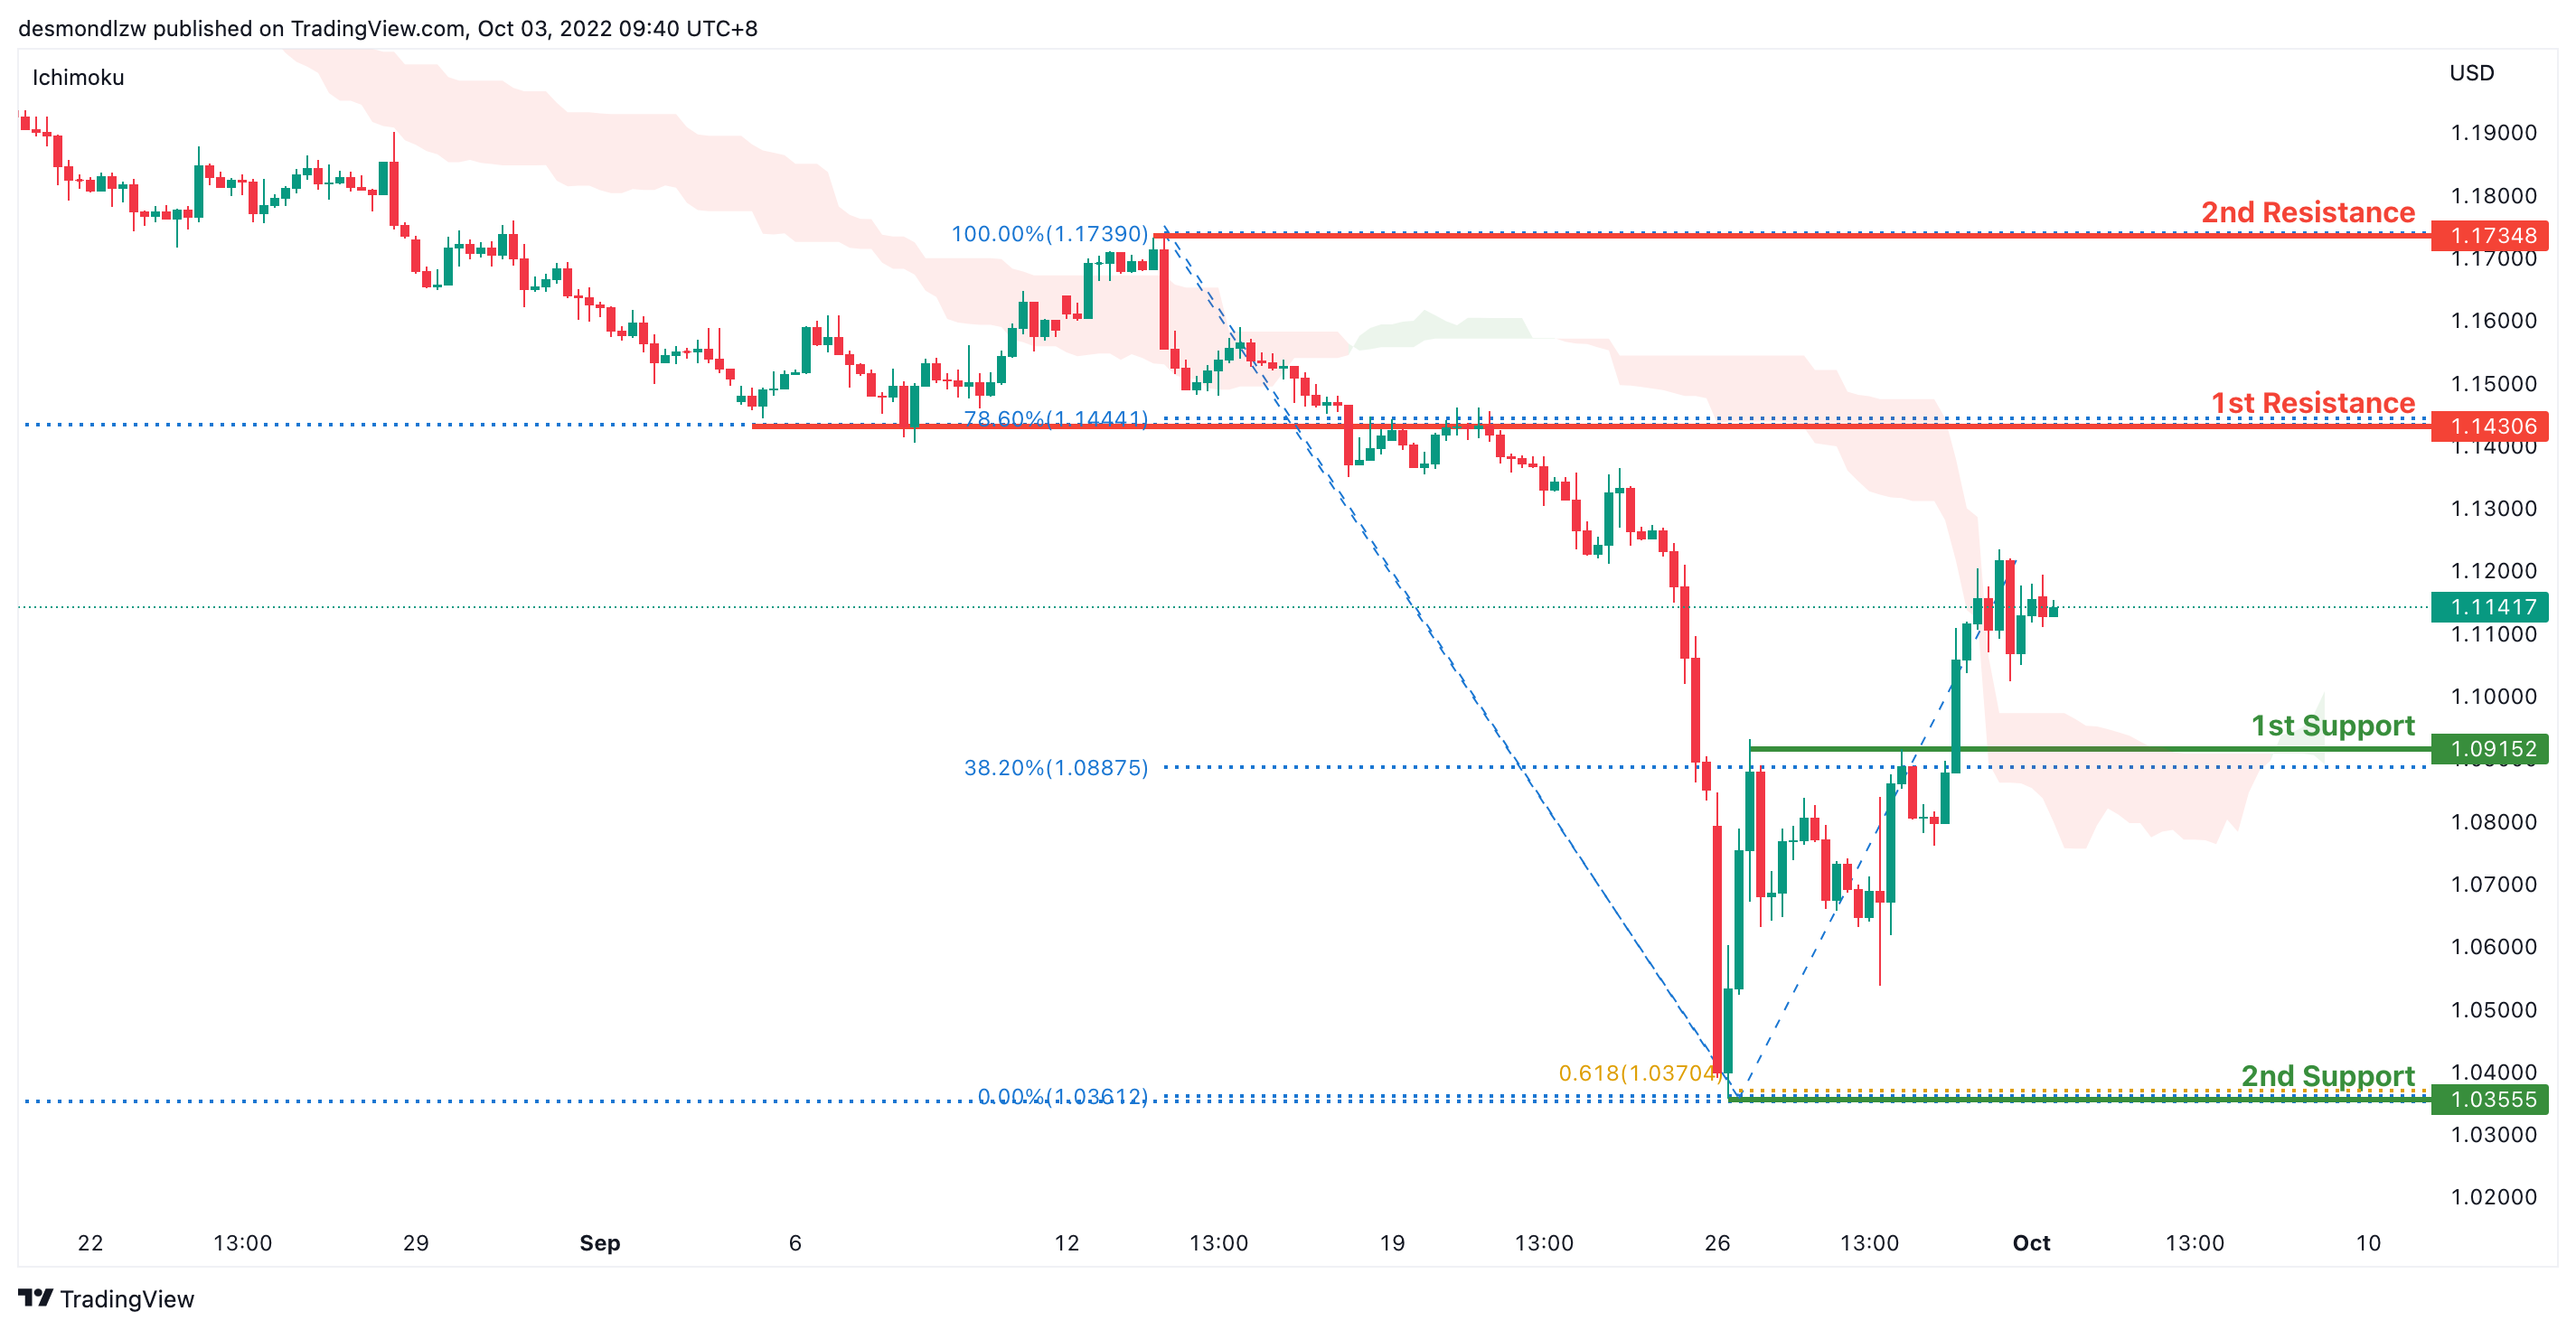
On the H4 time frame, prices have bounced off the support level and are moving in an ascending manner, we are slightly bullish. Price is moving toward the first resistance at 1.1430 where the 78.6% retracement and overlap support sits. If it breaks this level, its bullish momentum will bring price to second resistance at 1.1734 where the previous swing high sits. Alternatively, price could pull back to test the first support at 1.0915 where the 38.2% retracement sits then the second support at 1.0355 where the previous swing low and 138.2% extension and 61.8% projection sits
Areas of consideration:
- H4 1st resistance at 1.1430
- H4 1st support at 1.0915
USD/CHF:
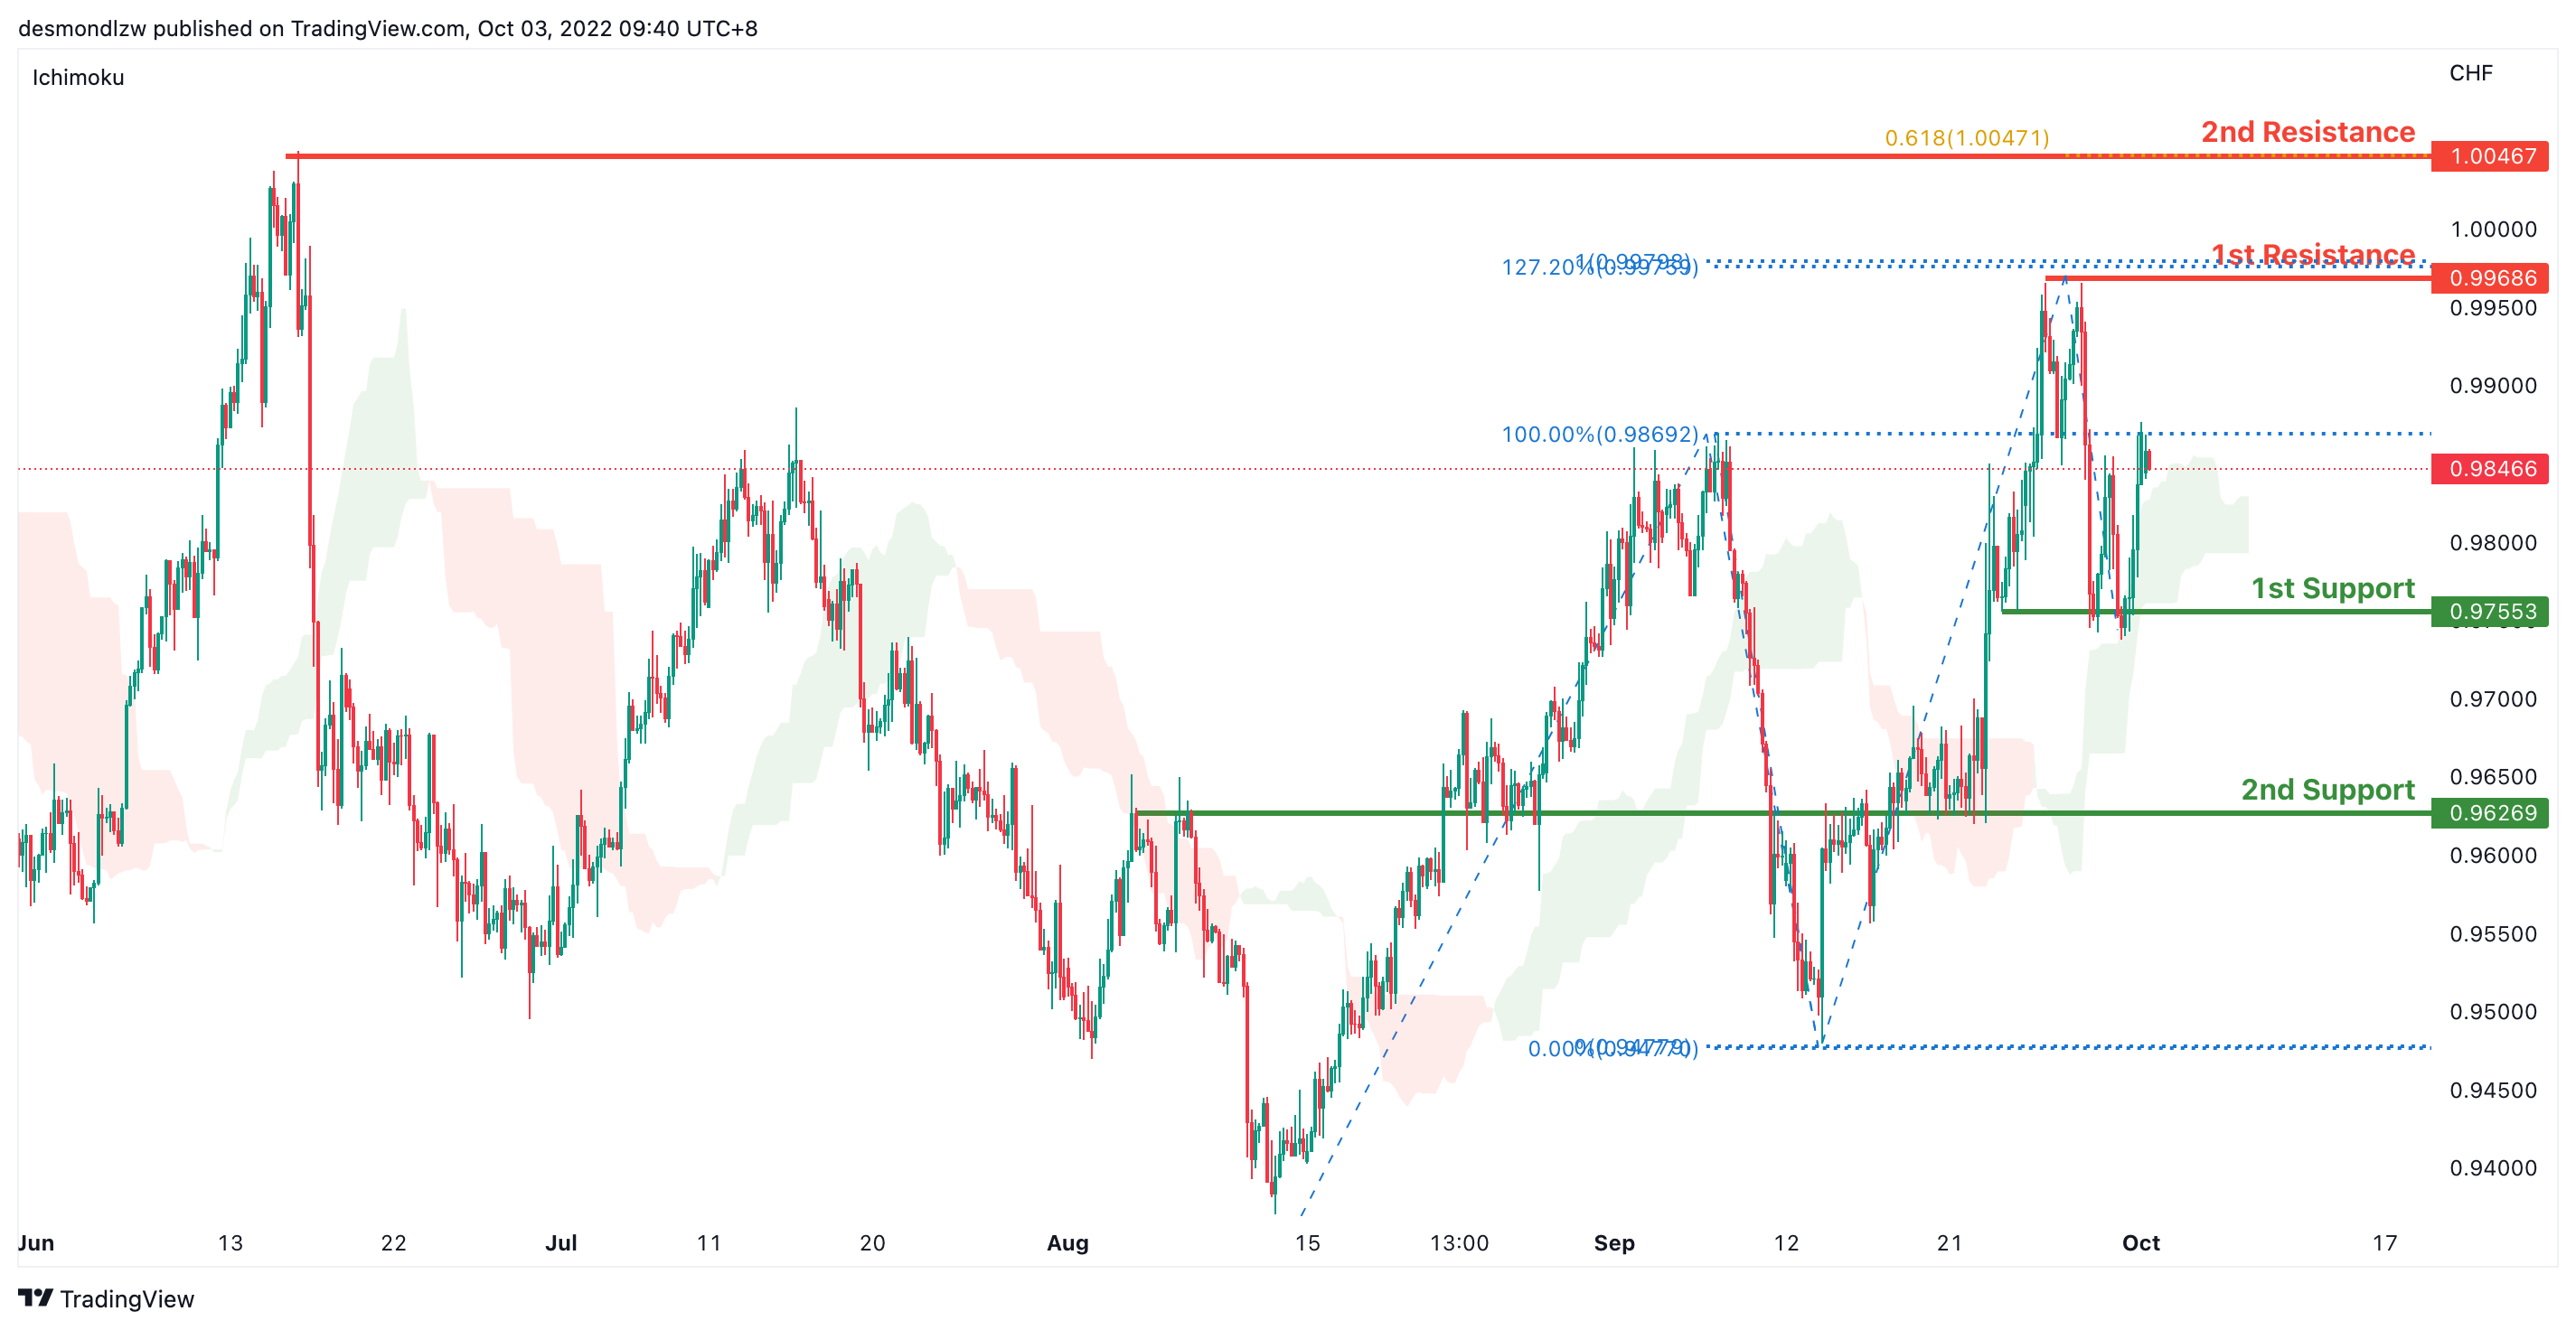
On the H4, prices are above the ichimoku and in an ascending trend we are bullish bias. Price has rejected the support twice and it’s moving toward the first resistance at 0.9968 where the 100% projection,127.2% extension and swing high sits. If bullish momentum continues, it should bring price to the second resistance at 1.0046 where the 61.8% projection and previous swing high sits. Alternatively, price could pull back to test 0.9755 where the first support sits if it breaks this level, we have a bearish confirmation to bring price further down to the second support at 0.9626 where the key overlap support sits.
Areas of consideration
- H4 1st support at 0.9755
- H4 1st resistance at 0.9968
XAU/USD (GOLD):
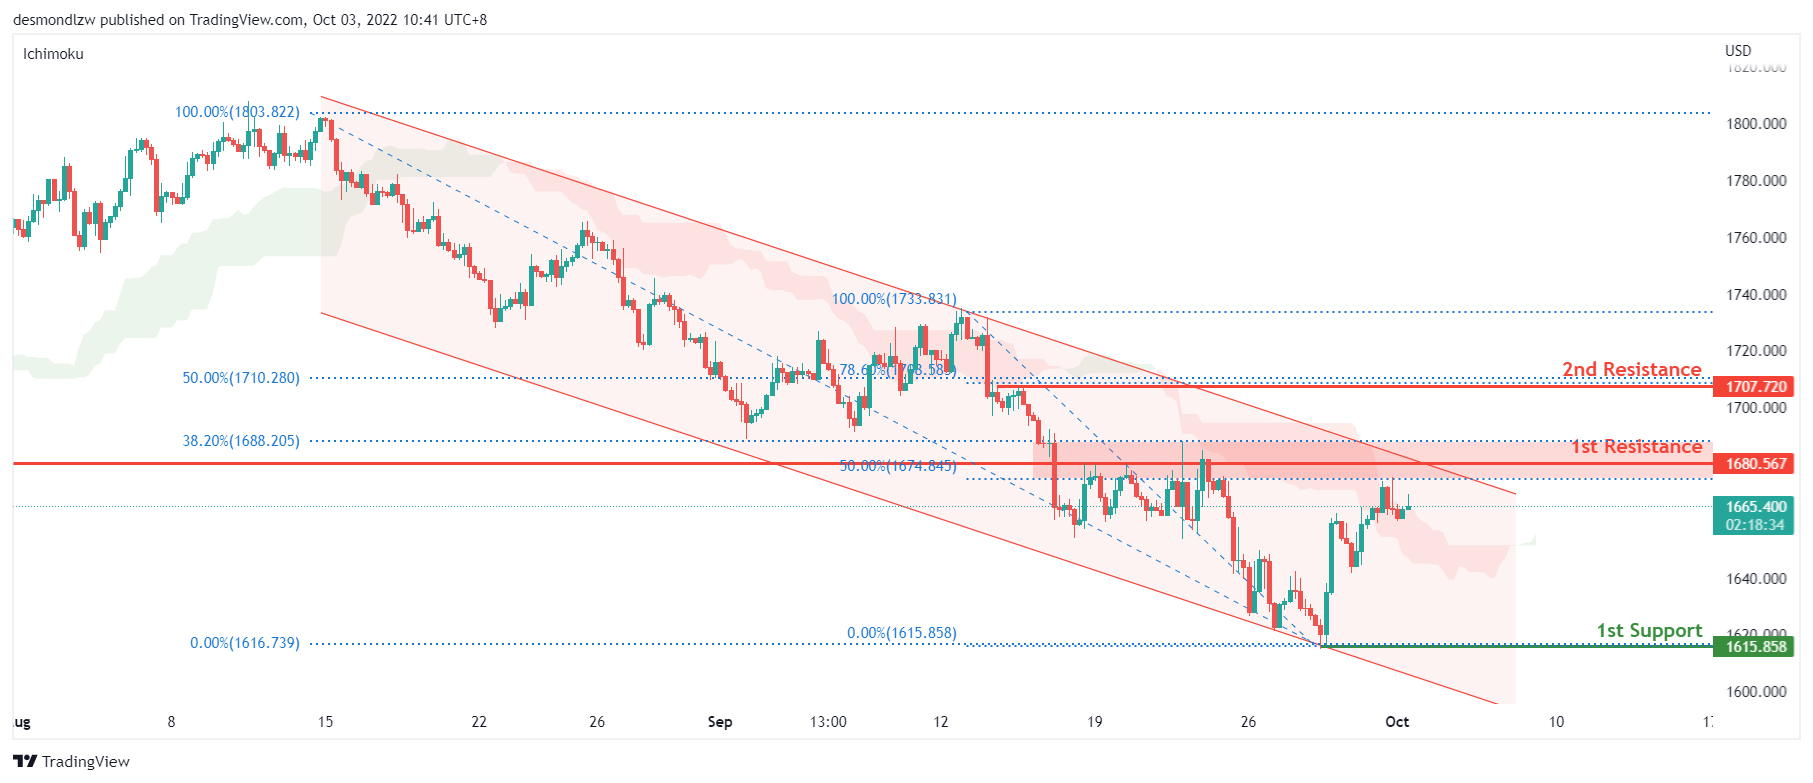
On the H4, price is showing a rejection of the 1st resistance of 1680, which is inline with the 50% and 38.2% fibonacci retracement level, swing low from July 2022 and within the bearish channel. With price in the ichimoku cloud, we have a neutral bias. However, price may trade lower towards the 1st support of 1615.85 with a risk level at 1640. Alternatively, price could break above the 1st resistance to trade higher towards the 2nd resistance of 1707 which is inline with the 50% and 78.6% fibonacci retracement level.
Areas of consideration:
- H4 time frame, 1st resistance at 1680.56
- H4 time frame, 2nd resistance at 1707.72
- H4 time frame, 1st support at 1615.85
AUD/USD:
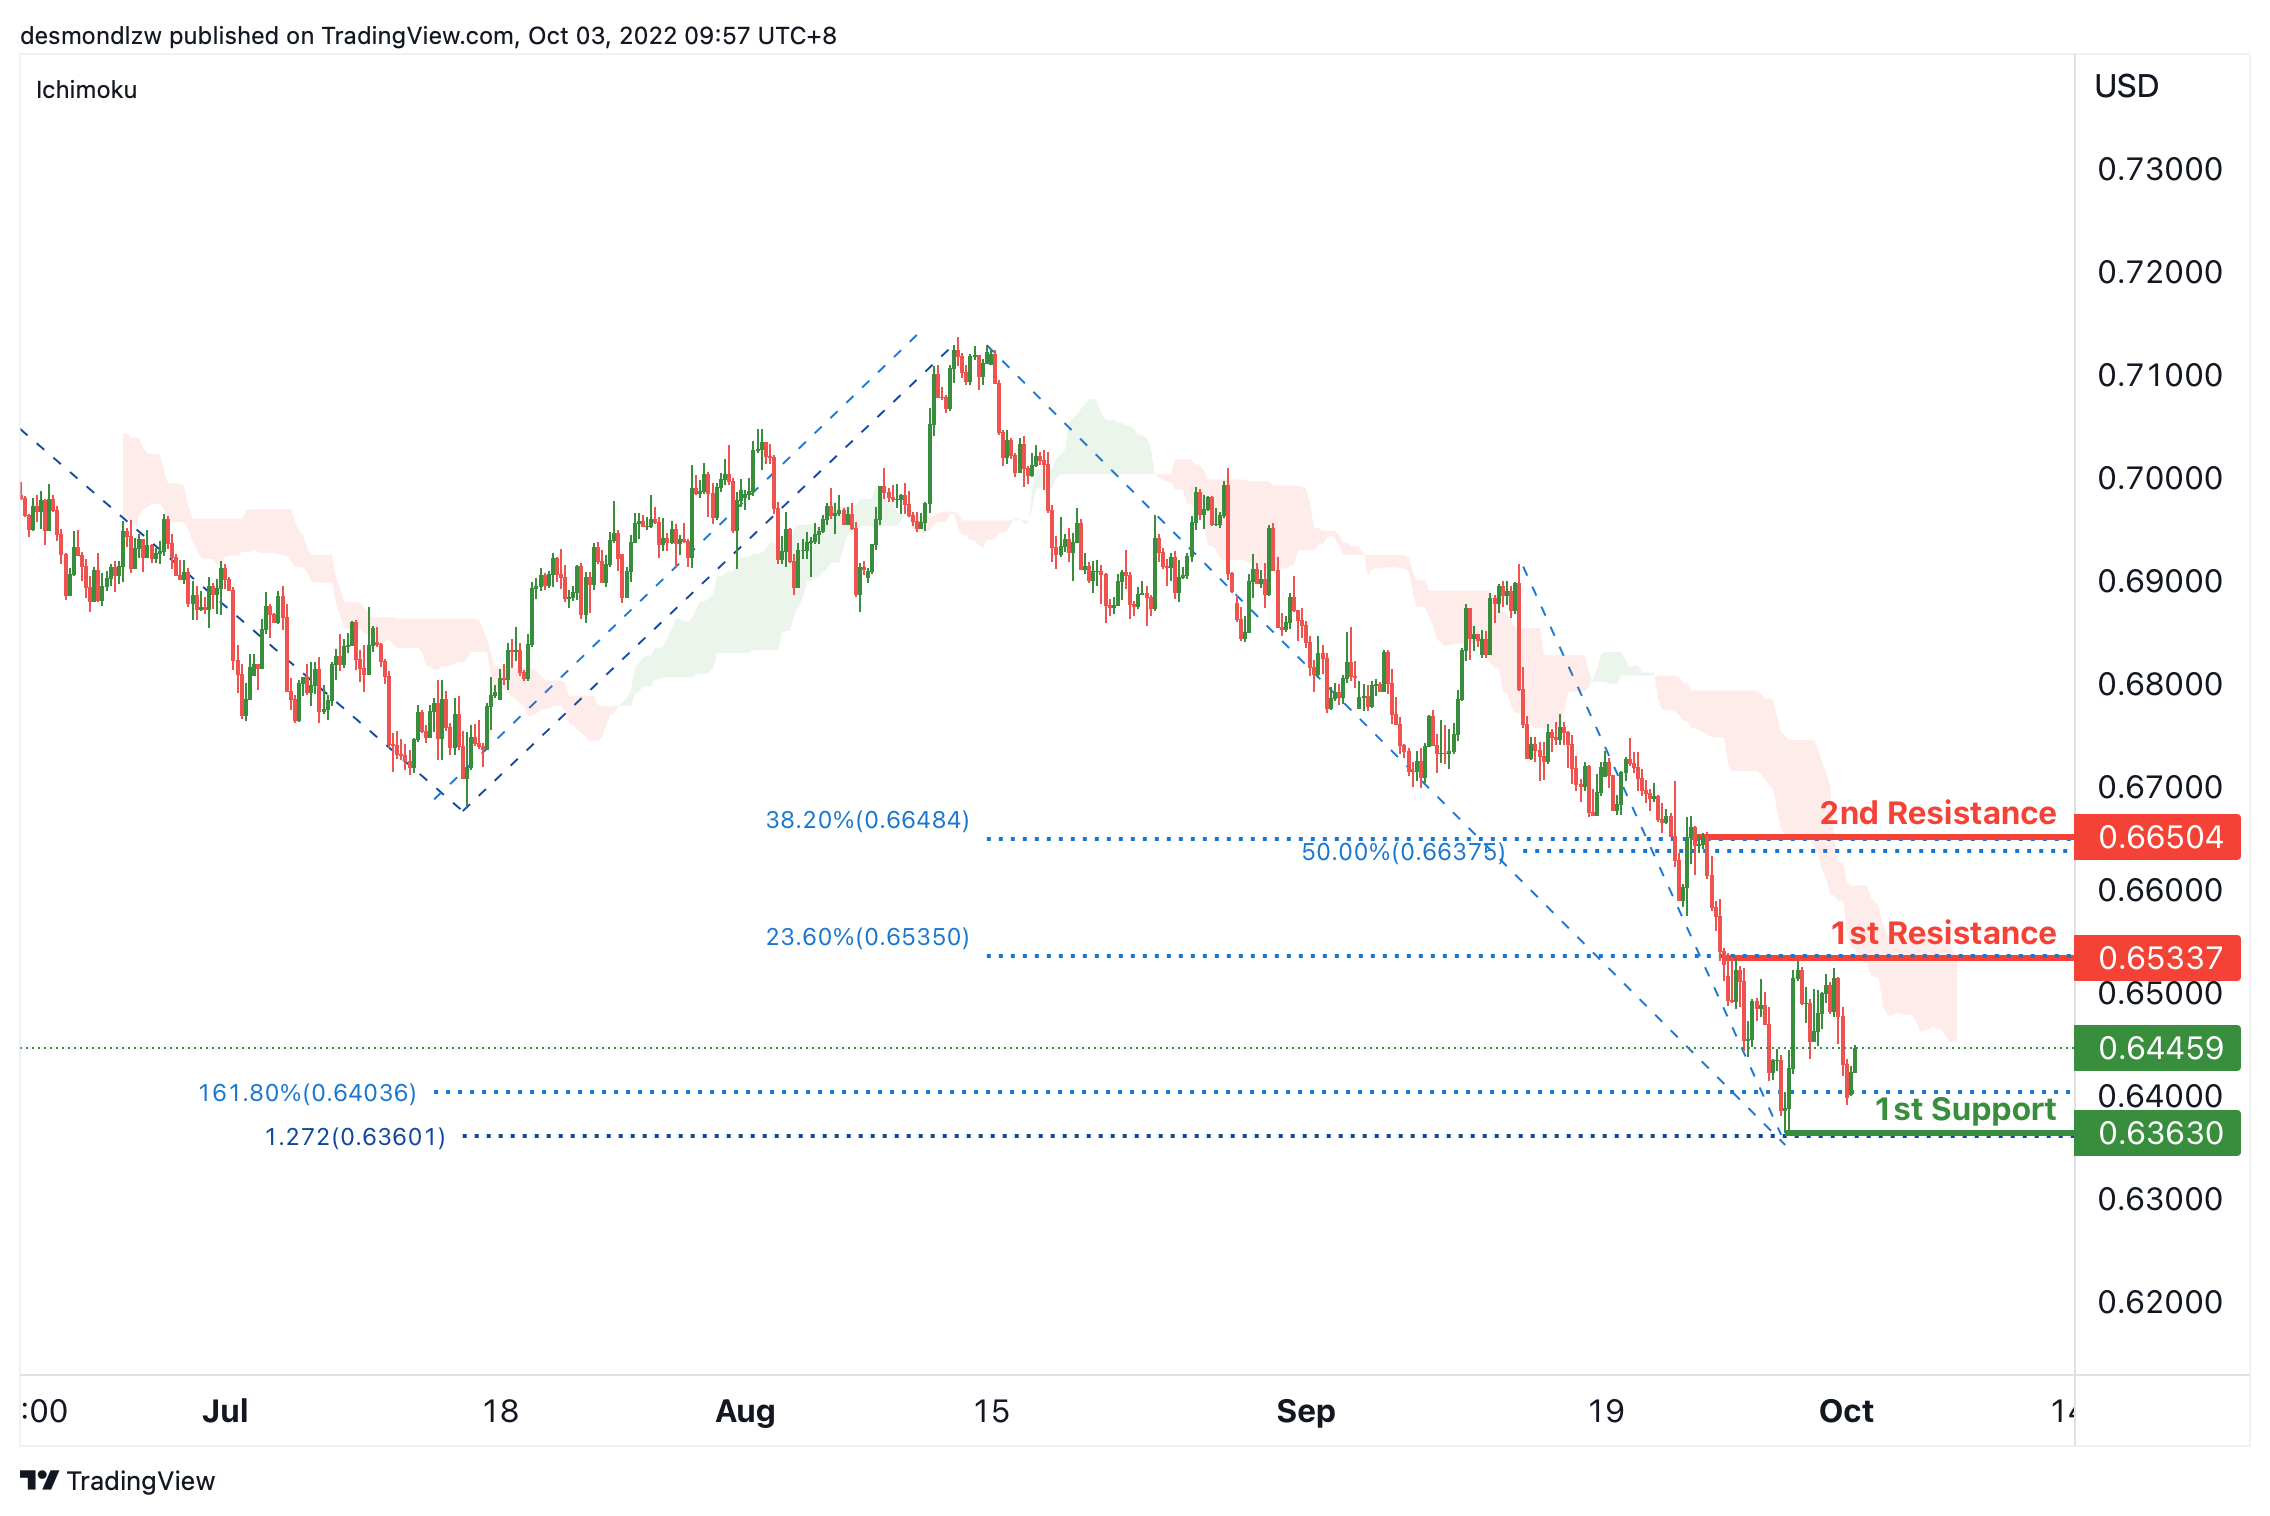
On the H4, the price is bouncing from the 1st support, we can expect the price test the 1st resistance at 0.65337, which is in line with the 23.6% fibonacci retracement, if the price can break the 1st resistance, we can expect the price rise to the 2nd resistance at 0.66504, where the pullback resistance, 50% and 38.2% fibonacci retracement are. Alternatively, as the price is still below ichimoku cloud, the price may drop to the 1st support again at 0.63630, which is in line with the swing low, 161.8% fibonacci extension and 127.2% fibonacci projection.
Areas of consideration
- H4, 1st resistance at 0.65337
- H4, 1st support at 0.63630
NZD/USD:
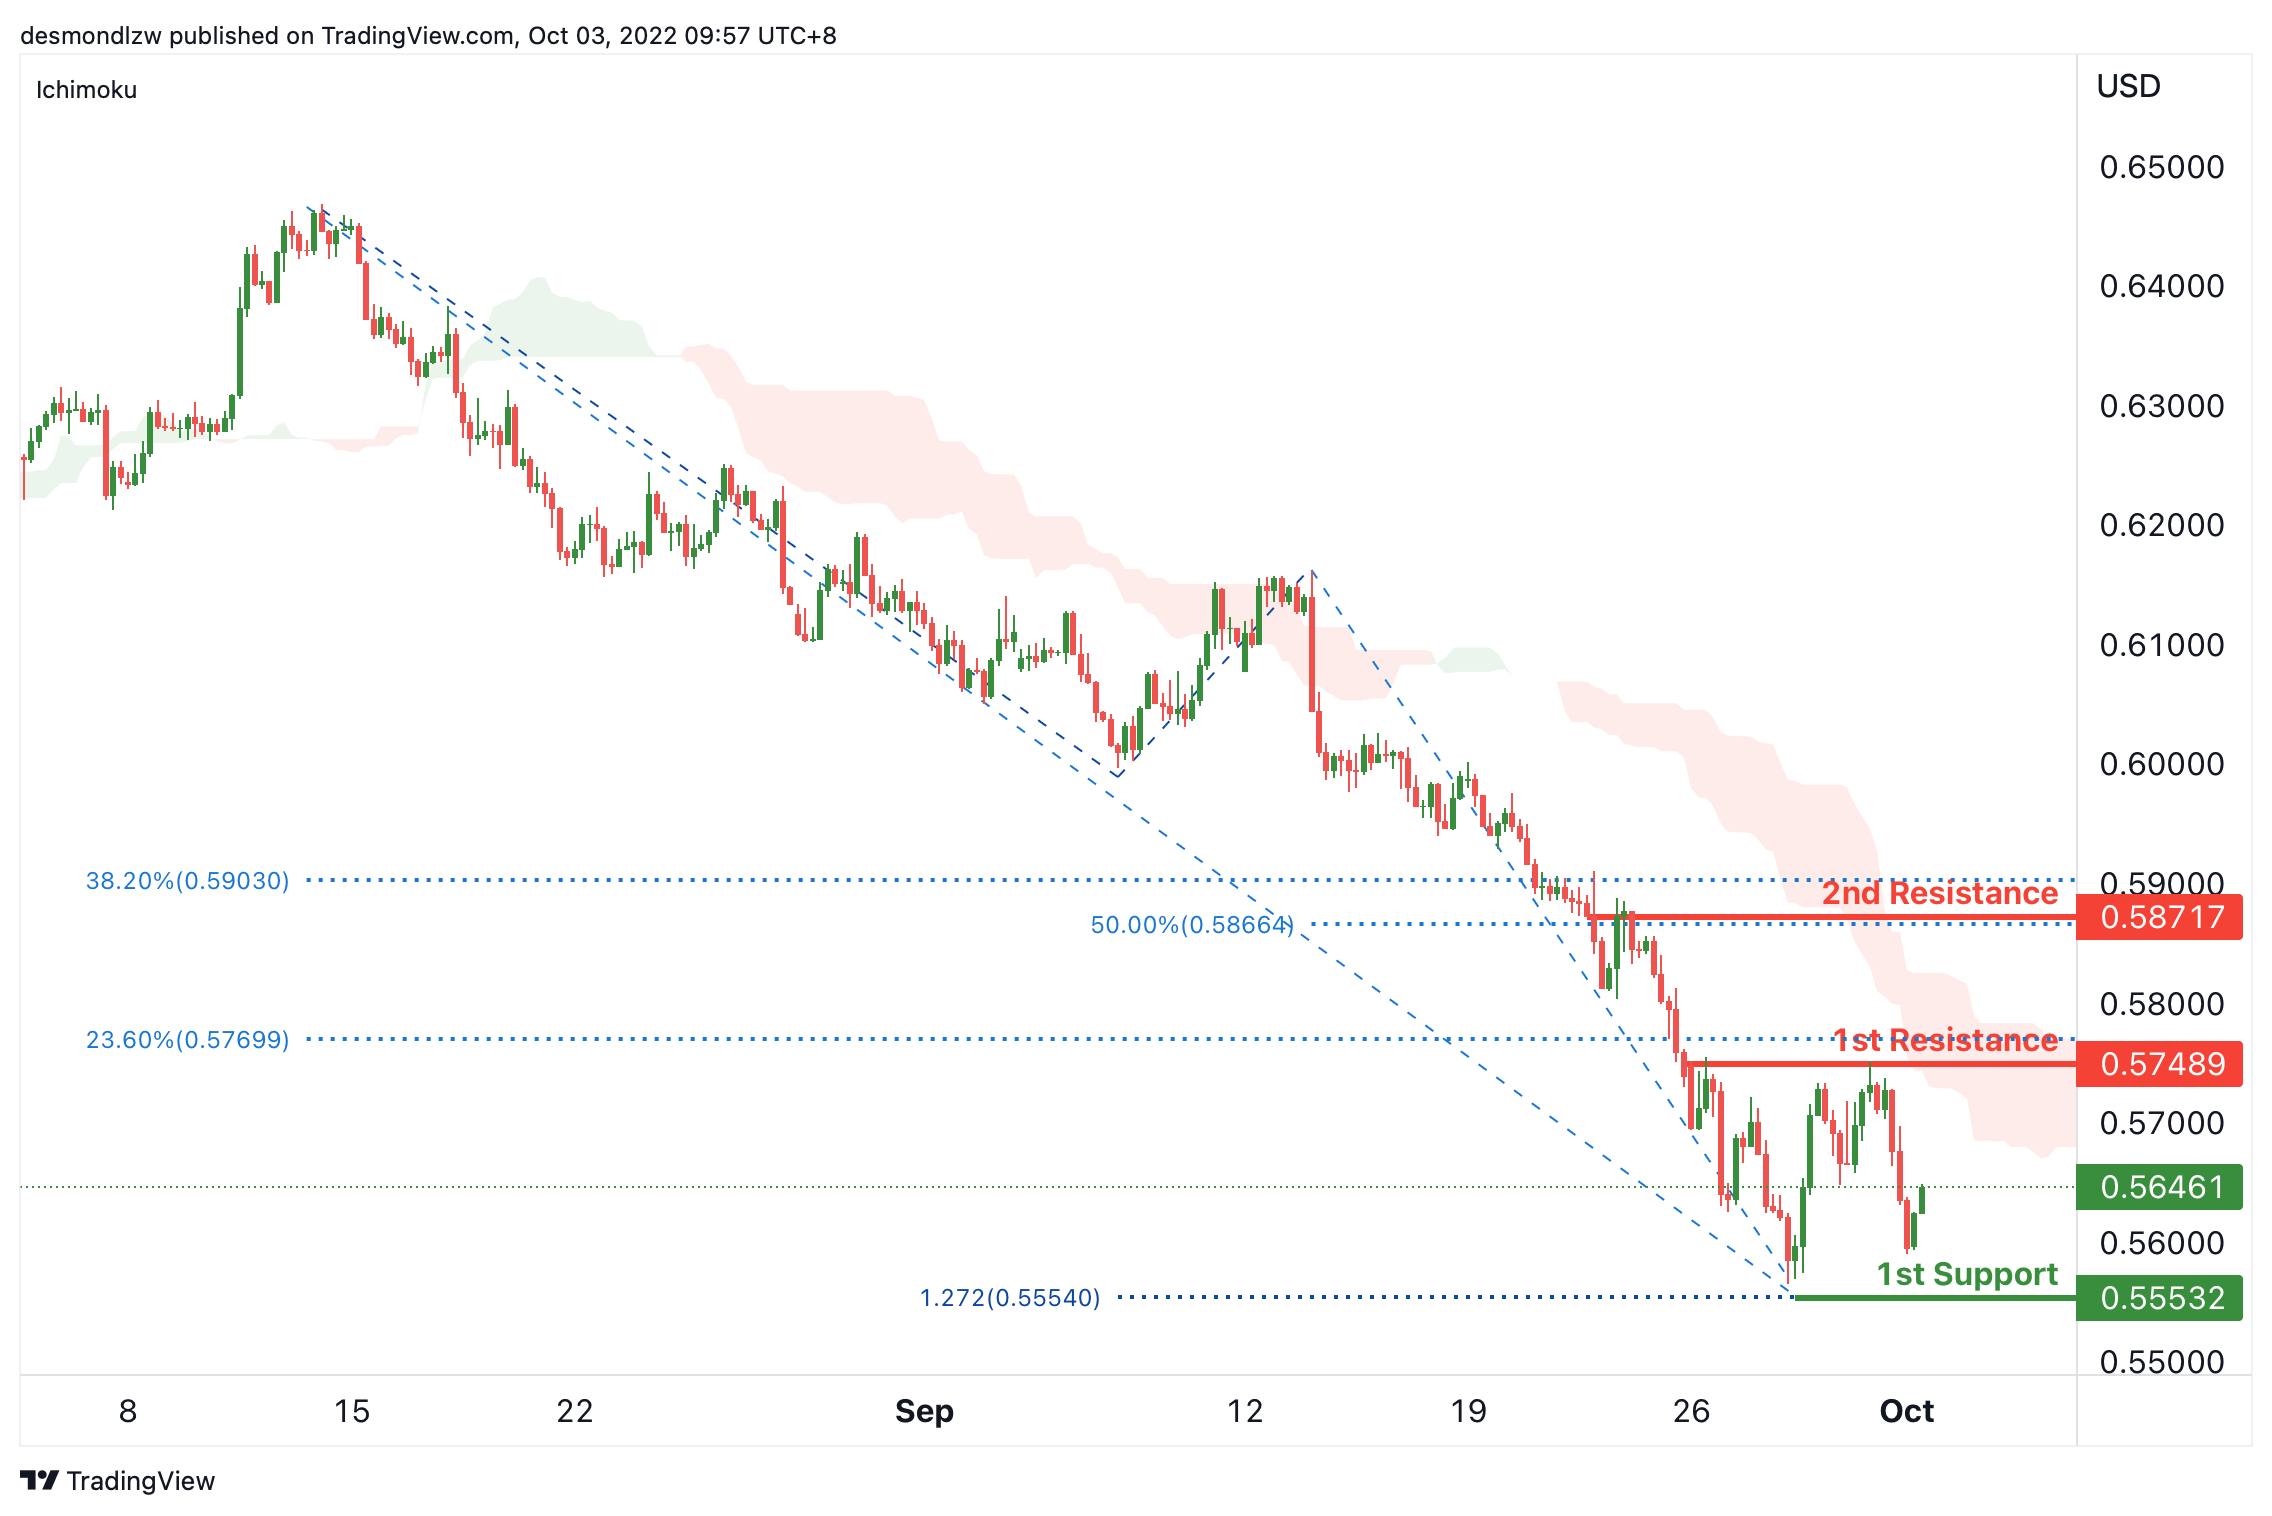
On the H4, with the price bouncing from the 1st support, we can expect the price test the 1st resistance at 0.57489, which is in line with the 23.6% fibonacci retracement, if the 1st resistance is broken, the price may break the 1st resistance and rise to the 2nd resistance at 0.58717, where the 38.2% and 50% fibonacci retracement are. Alternatively, the price may drop to the 1st support at 0.55532, where the swing low and 127.2% fibonacci projection are.
Areas of consideration:
- H4 time frame, 1st resistance at 0.57489
- H4 time frame, 1st support at 0.55532
USD/CAD:
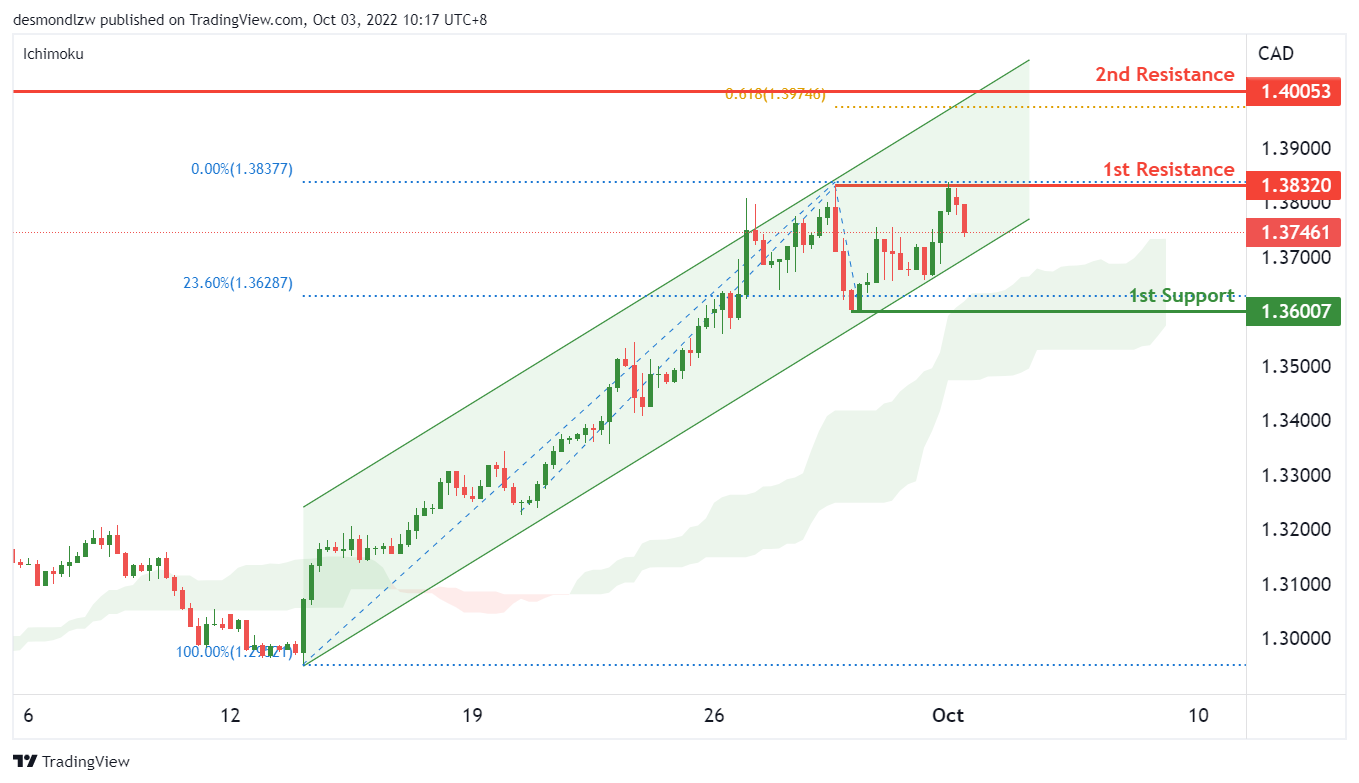
On the H4, the price fails to break above the 1st resistance of 1.3832 but maintains within the ascending channel and above the ichimoku cloud. We continue to have a bullish bias that price may rise to the 2nd resistance at 1.40, which is in line with the 61.8% fibonacci extension level and previous swing high from June 2020. However, price could first fall to test the 23.6% fibonacci retracement level before a continuation to the upside.
Areas of consideration:
- H4 time frame, 1st resistance at 1.3832
- H4 time frame, 2nd resistance at 1.40
- H4 time frame, 1st support at 1.36
OIL:
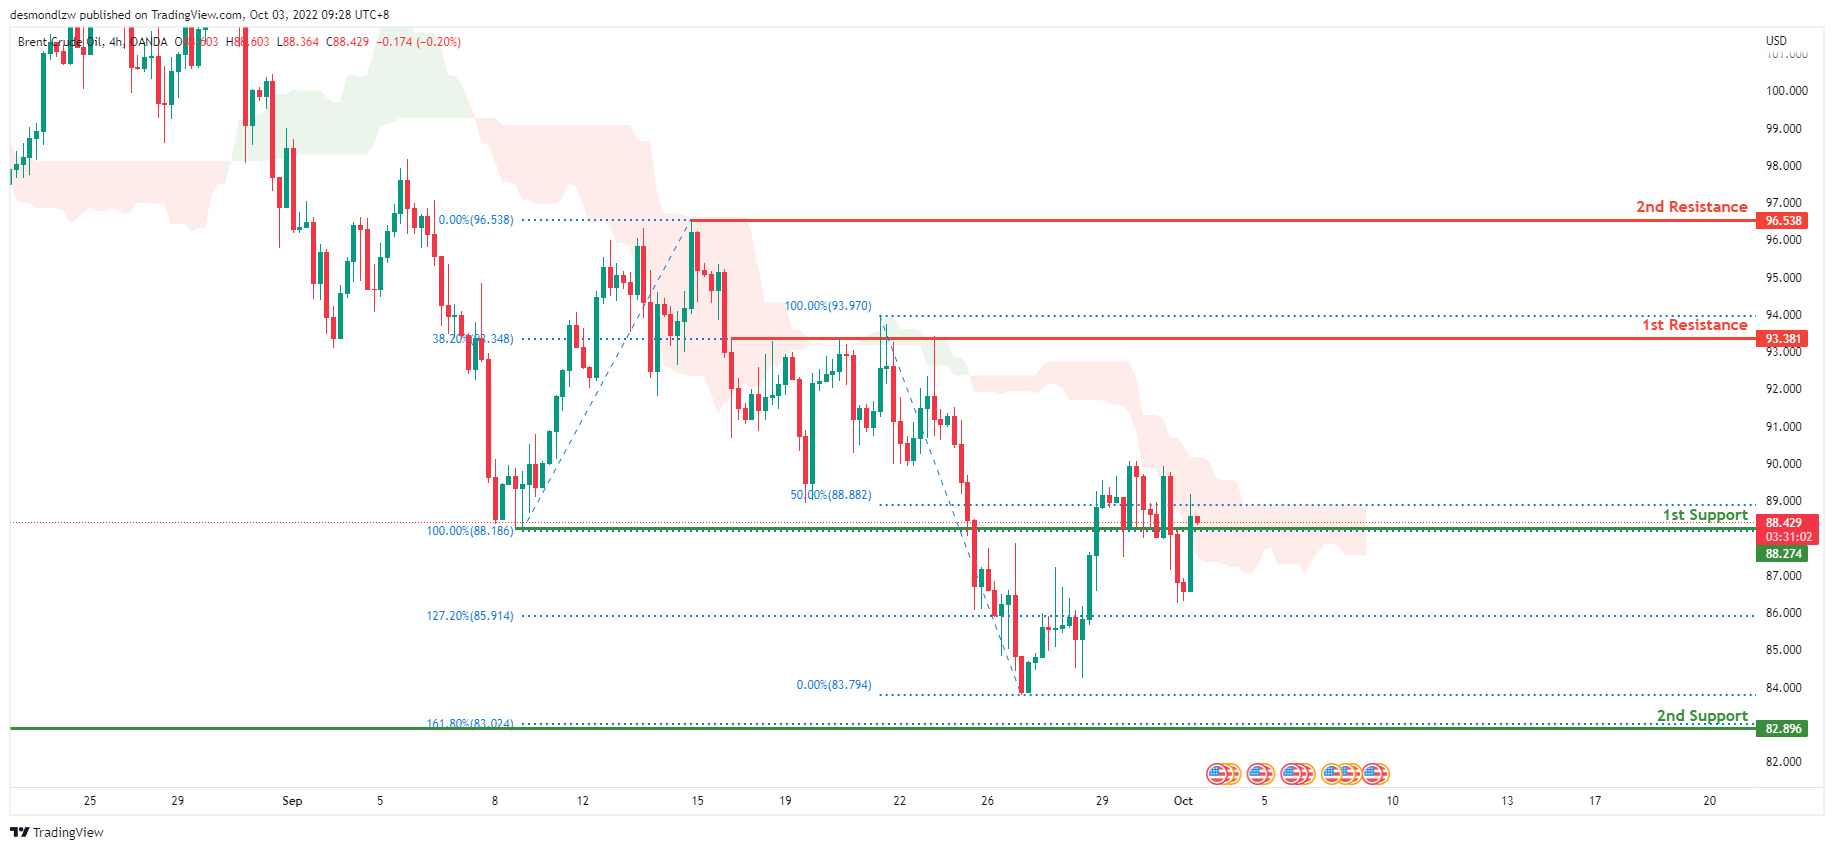
On the 4-hour chart, oil is in a bearish trend. Price is currently consolidating near the first support level at 88.788, which has a 100% Fibonacci extension and served as the previous swing low. Price has rejected and broken back up this level several times in the last week, indicating that it is a strong level. Price is expected to move towards the first resistance level, which is the 38.2% Fibonacci extension line, at 93.381.
Areas of consideration:
- H4 time frame, 1st resistance at 93.381
- H4 time frame, 1st support at 88.366
Dow Jones Industrial Average:
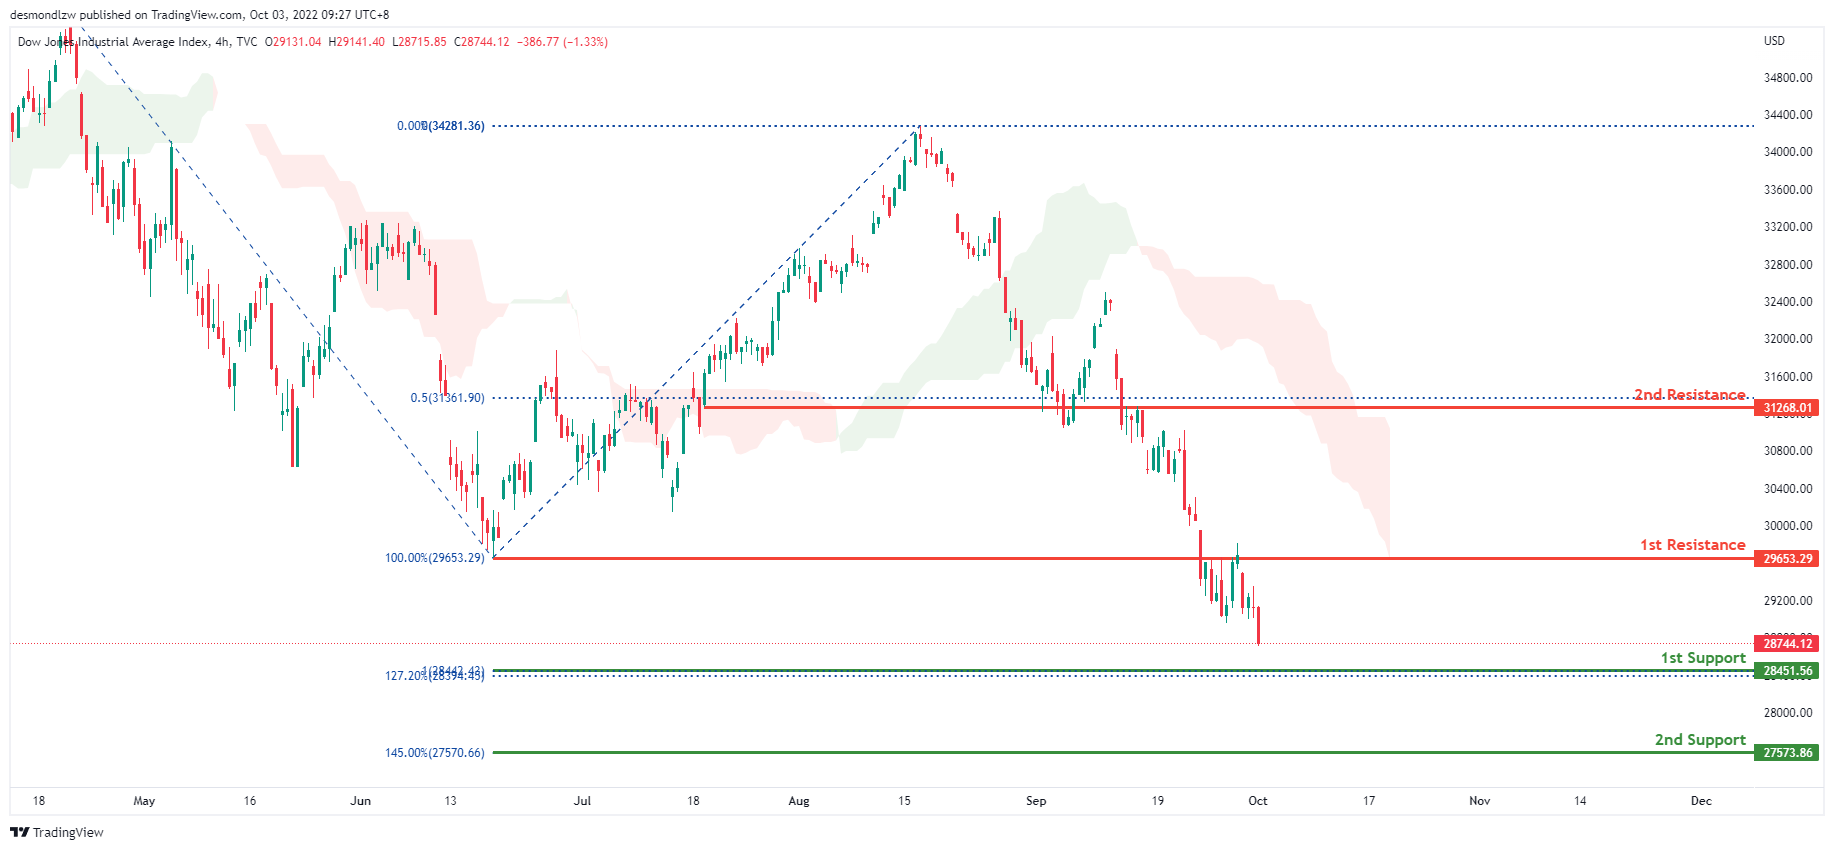
The price is in a bearish trend on the H4. Furthermore, the price is lower than the ichimoku cloud, indicating a bearish market. Price has also broken through the first resistance level, which contains the 100% Fibonacci line and the previous swing low, at 29653.29. Given the current bearish momentum, price is expected to move towards the first support level at 28422.42, which contains the 100% Fibonacci projection line and the 127.2% Fibonacci extension line.
Areas of consideration:
- H4 time frame, 1st support at 28408.73
- H4 time frame, 1st resistance at 29653.29
DAX:
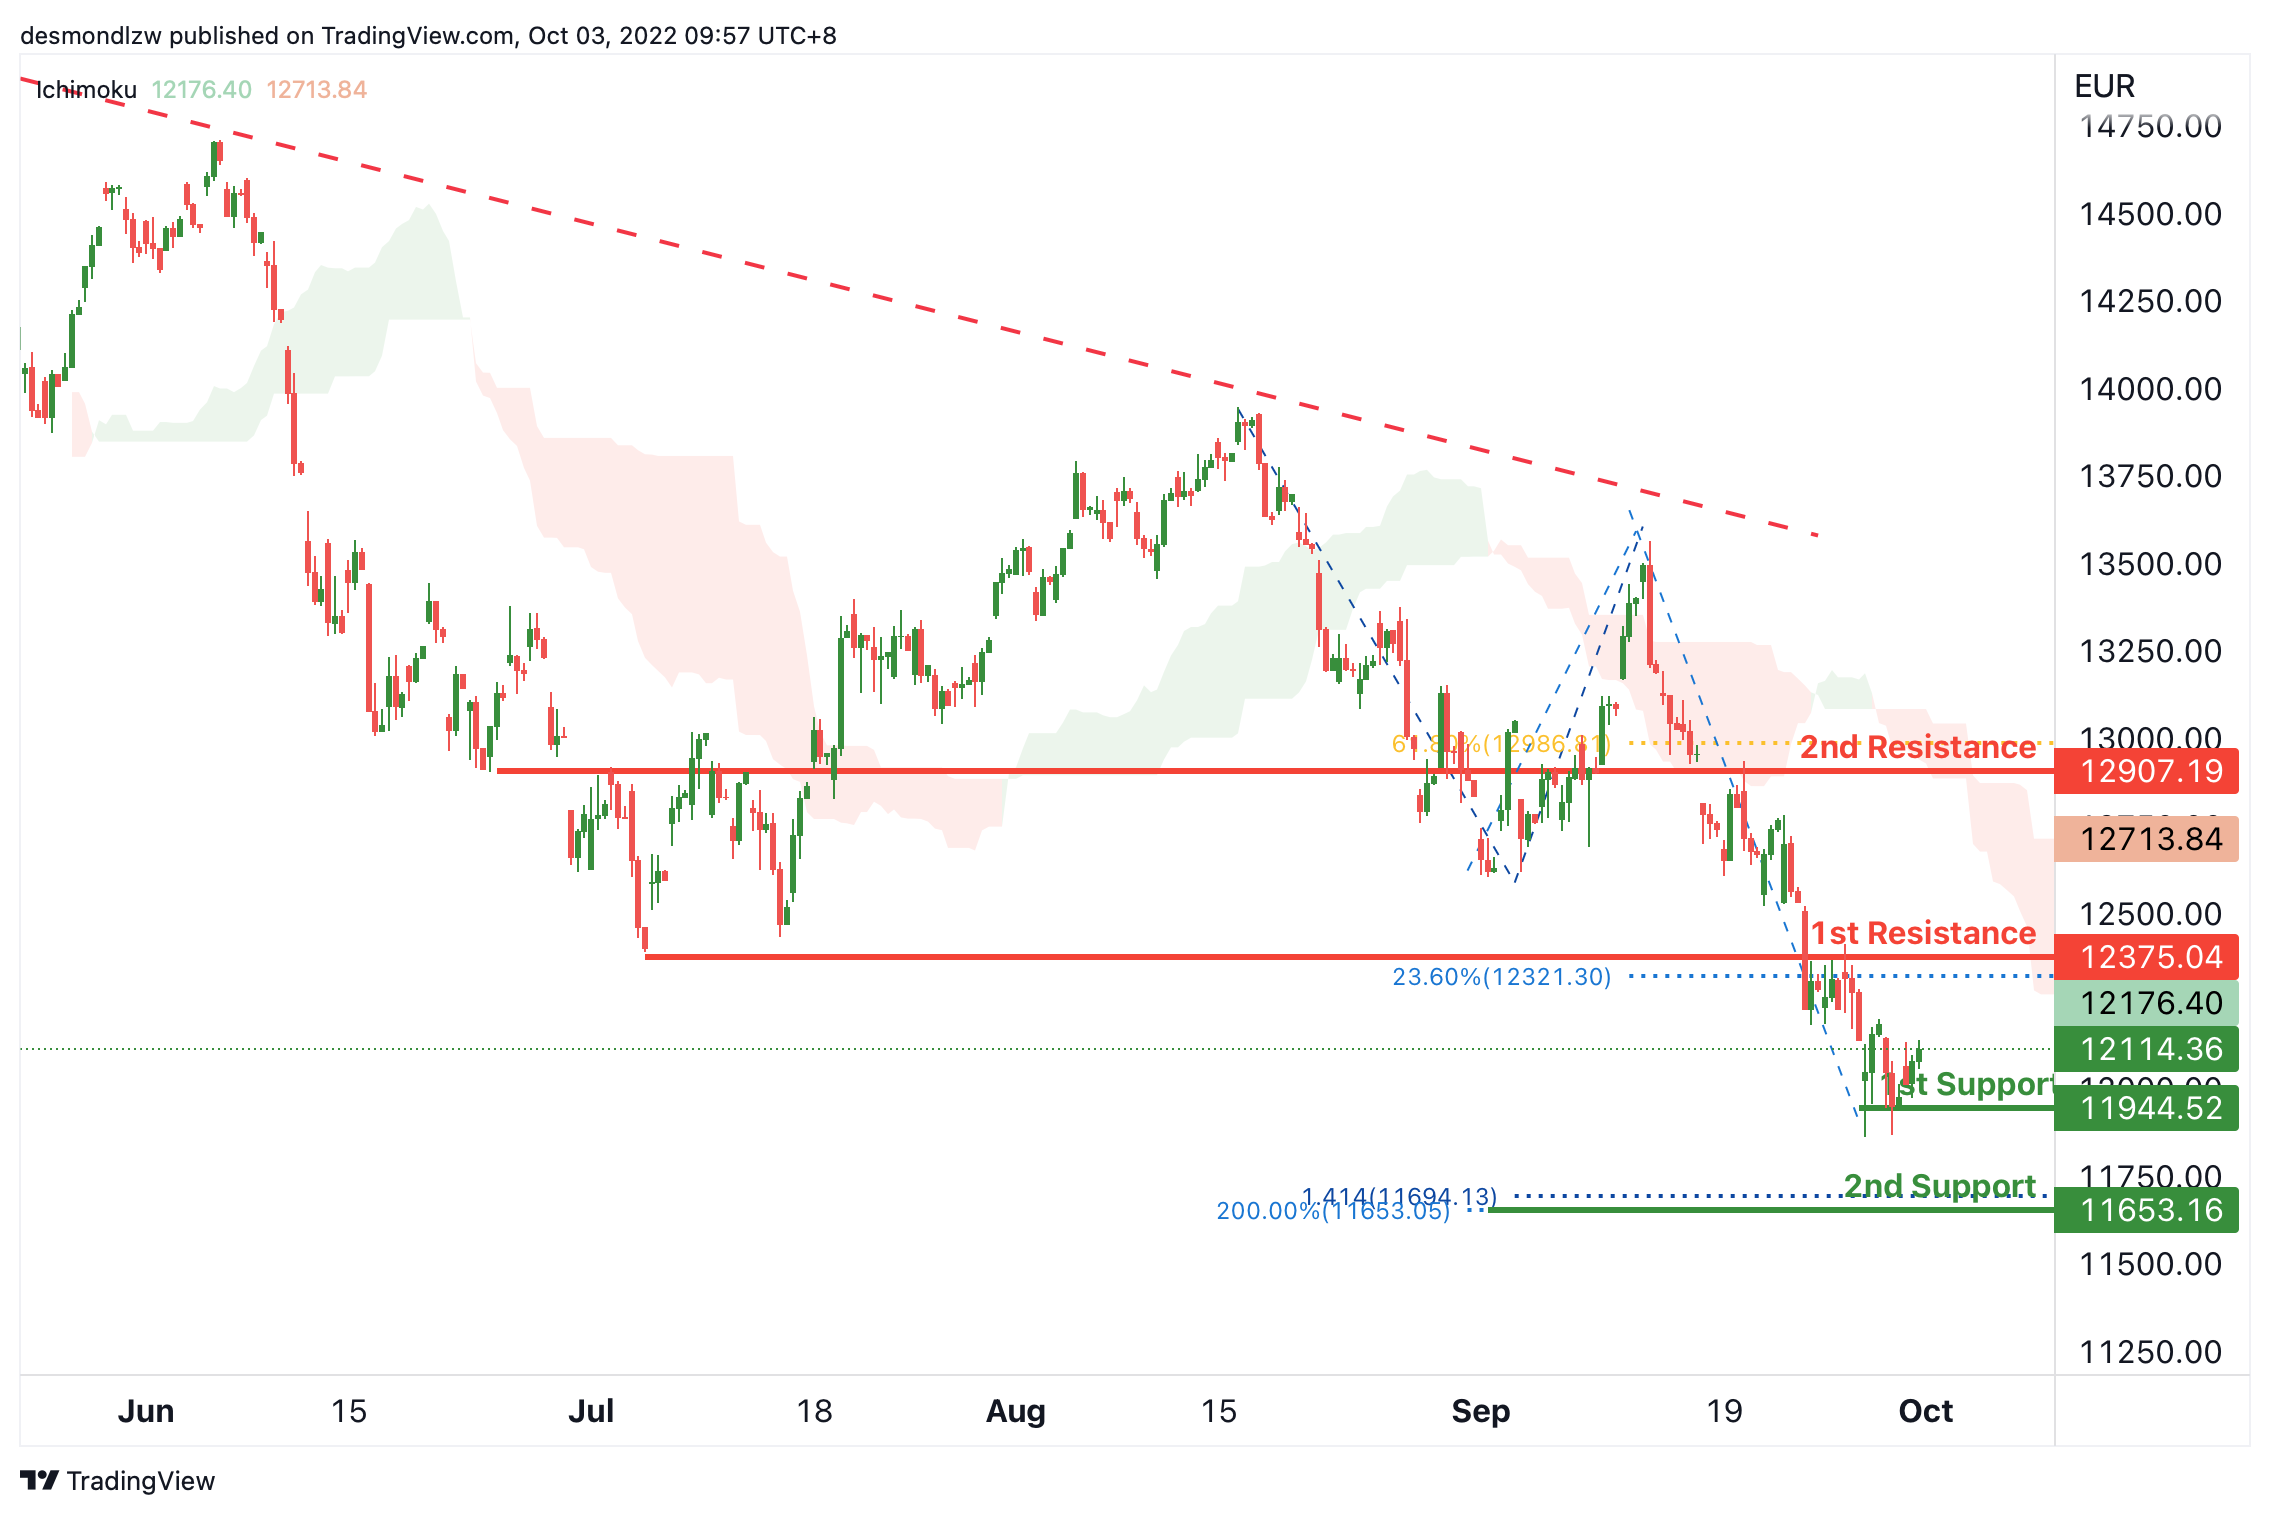
On the H4, with the price bouncing from the 1st support at 11944.52, the price may test the 1st resistance at 12375.04, which is in line with the overlap resistance and 23.6% fibonacci retracement. If the 1st resistance is broken, the price may rise to the 2nd resistance at 12907.19, where the 61.8% fibonacci retracement is. Alternatively, the price may break the 1st support and drop to the 2nd support at 11653.16, where where the 141.4% fibonacci projection and 200% fibonacci projection are.
Areas of consideration:
- H4 time frame, 1st resistance at 12375.04
- H4 time frame, 1st support at 11944.5
ETHUSD:
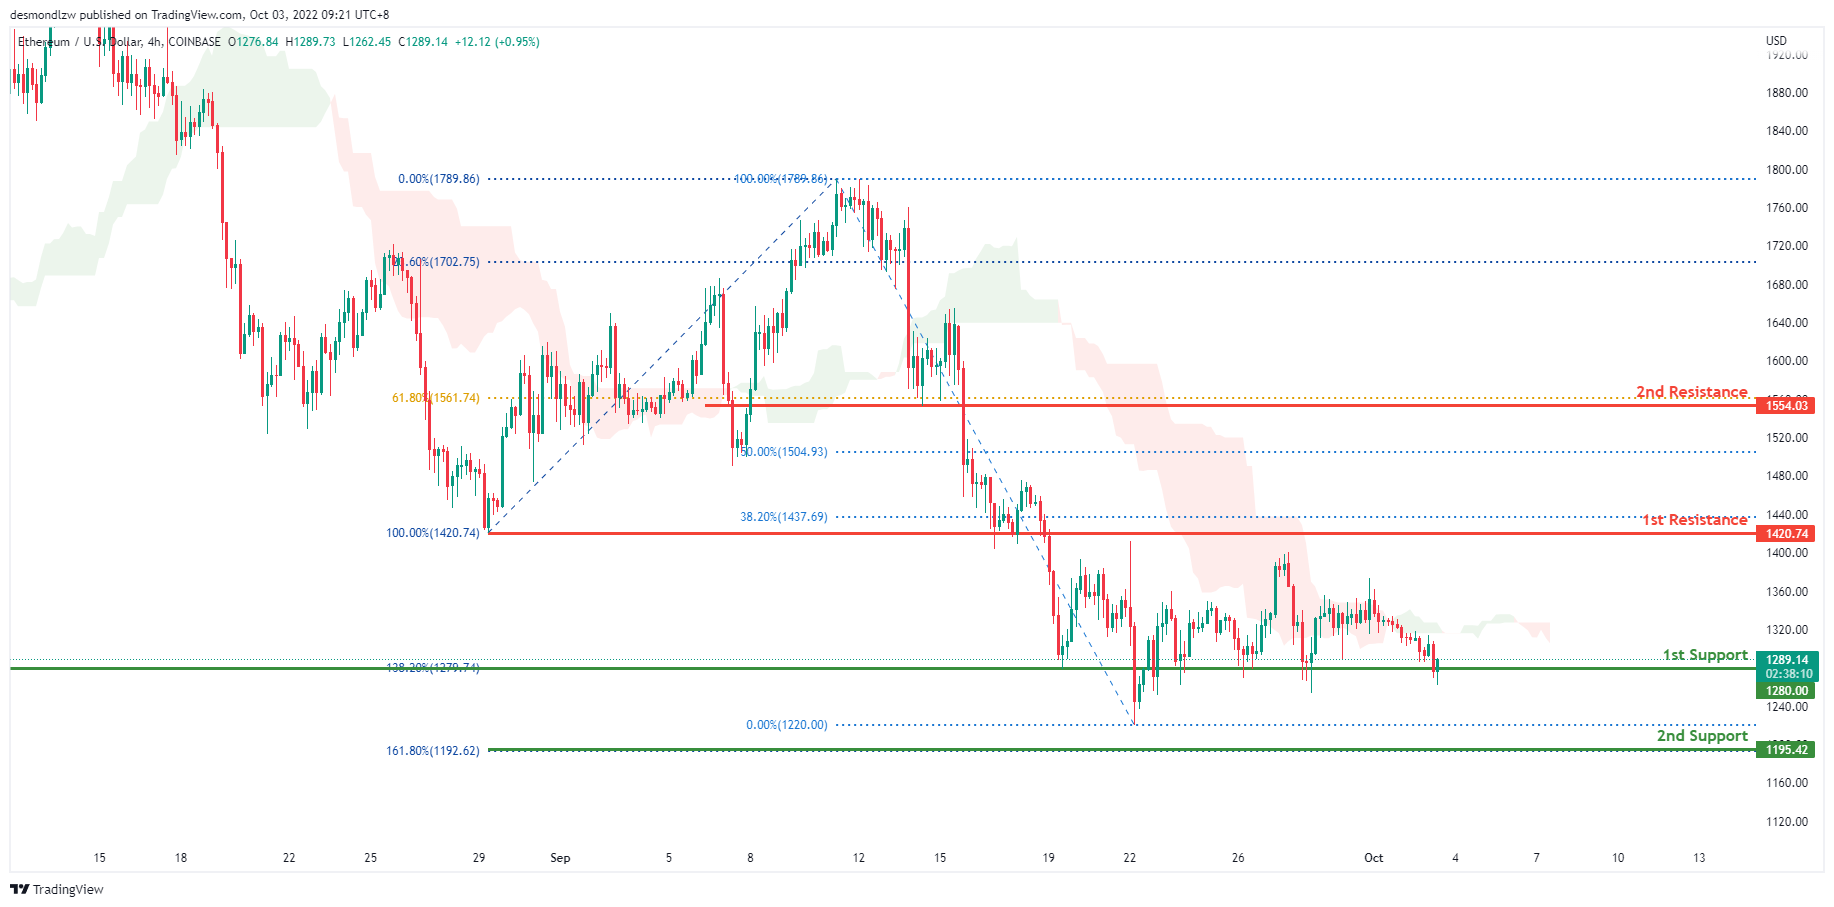
The overall price of ETHUSD on the H4 is very bearish. In addition, the price is below the ichimoku cloud, indicating a bear market. For the past two weeks, price has been consolidating above the first support line at 1270.74, which also happens to be the 138.2% Fibonacci line. Expect price to break through this support level and head towards the second support level at 1192.62, which contains the 161.8% Fibonacci extension line.
Areas of consideration:
- H4 time frame, 1st resistance of 1420.74
- H4 time frame, 1st support at 1280.00
BTCUSD:
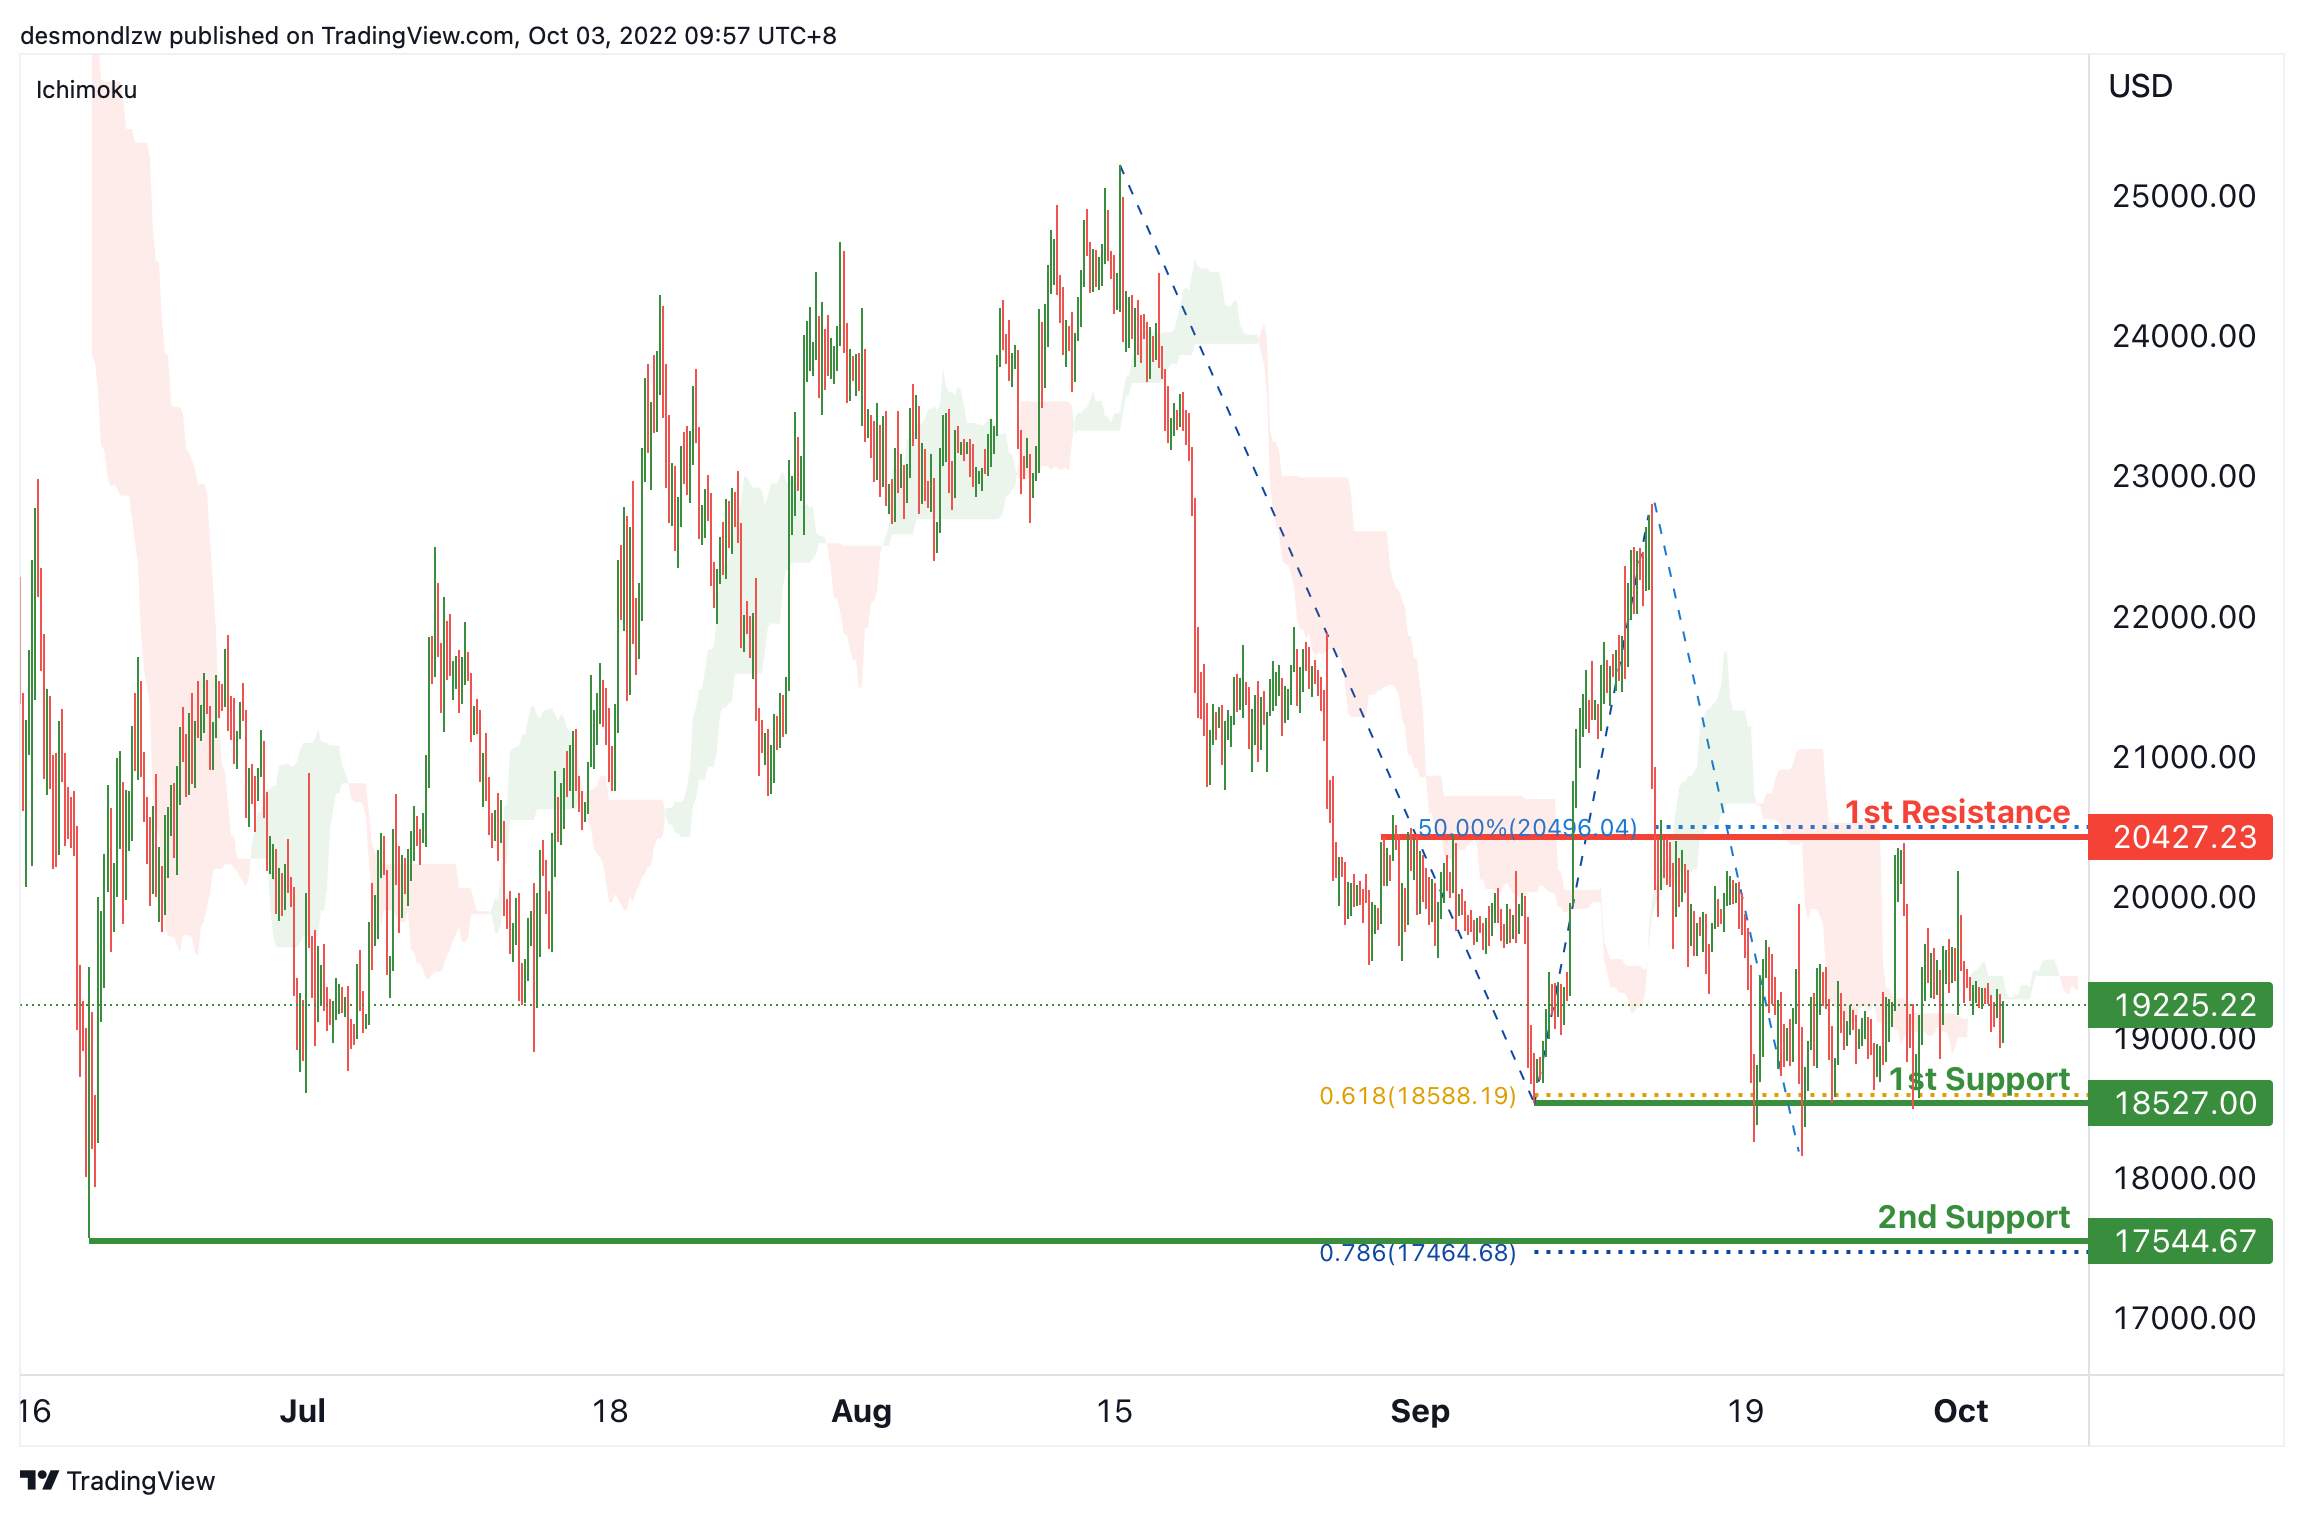
On the H4, price is consolidating. Currently the price is below the ichimoku cloud, the price may test the 1st the 1st support at 18527, which is in line with the swing lows and 61.8% fibonacci projection. If the 1st support is broken, the 2nd support could be at 17544.67, which is in line with the 78.6% fibonacci projection and swing low. Alternatively, the price may rise to test the resistance at 20427.23, where the overlap resistance and 50% fibonacci retracement are.
Areas of consideration:
- H4 time frame, 1st resistance at 20427.23
- H4 time frame, 1st support at 18527
S&P 500:
On the H4, with the price trading lower from the 1st resistance, within the descending channel and below the ichimoku cloud, we continue to have a bearish bias. Look for a bearish continuation with the 1st support at 3438.96, which is in line with the previous swing low of October 2020, 127.20% fibonacci expansion and 61.8% fibonacci extension level.
Areas of consideration:
- H4 time frame, 1st resistance at 3637.23
- H4 time frame, 1st support at 3438.96
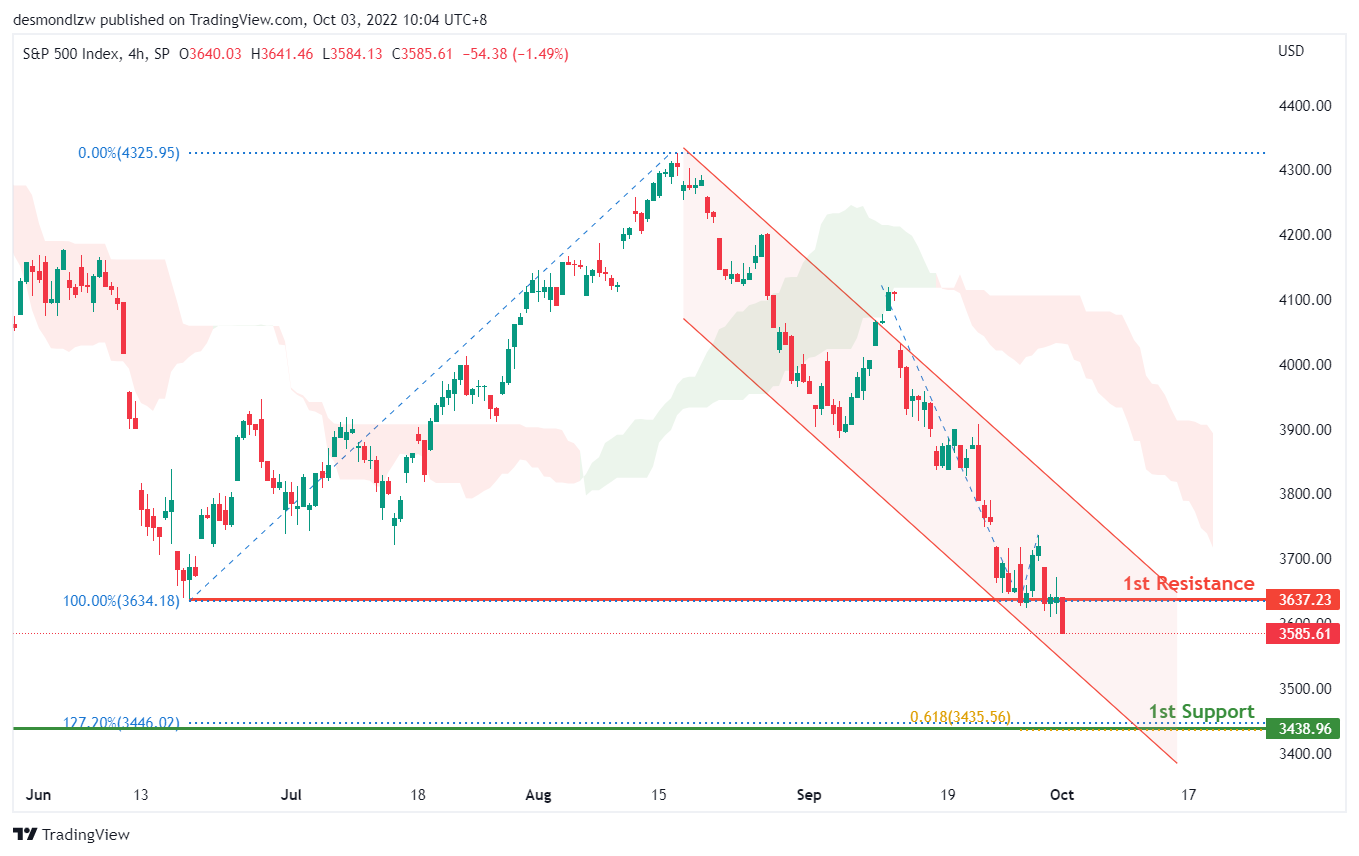
Japan PMI manufacturing finalized at 50.8, weakness even turned worse
Japan PMI Manufacturing was finalized at 50.8 in September, down from August's 51.5. S&P Global said high inflation and subdued global market conditions weight on order books. Output fell at sharpest pace in a year, while input buying reduced. Weak yen drove inflationary pressures higher.
Joe Hayes, Senior Economist at S&P Global Market Intelligence, said: "Weakness in Japan's manufacturing sector persisted in September and even turned worse. New orders fell at their sharpest rate in two years – high inflation is eroding client purchasing power, while slowing global economic growth is hurting exports. Weakness in the yen is doing little to bolster export demand either and instead is pushing imported inflation up drastically and drove domestic price pressures up even further."
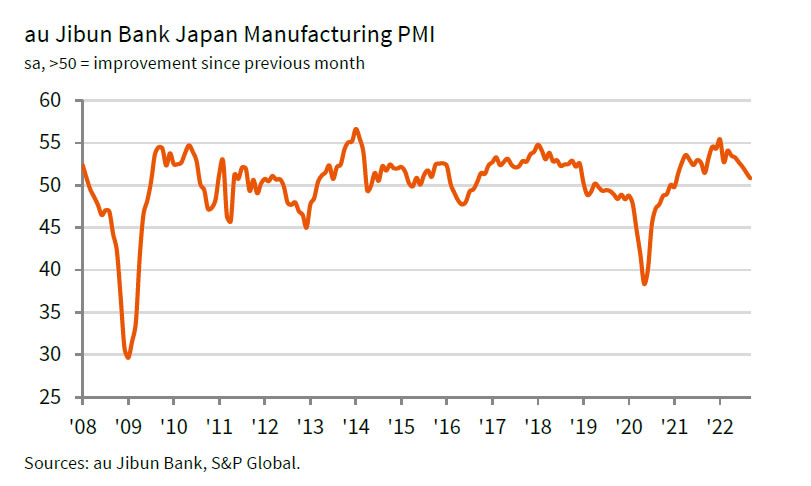
Japan business outlook deteriorated in Q3
Japan Tankan large manufacturing index dropped from 9 to 8, below expectation of 11. That's the third straight quarter of deterioration. Non-manufacturing index improve slightly from 13 to 14, above expectation of 13, and rise for the second straight quarter.
Large manufacturing outlook dropped from 10 to 9, below expectation of 11. Non-manufacturing outlook also deteriorated from 13 to 11, below expectation of 15.
Nevertheless, large companies are expected to increase capital expenditure by 21.5% in the current fiscal year ending March 2023, above expectation of 18.8%.
Meanwhile, companies expect inflation to hit 2.6% a year from now, and 2.1% three years ahead. Five years ahead inflation is also projected at 2.0%, highest since data became available in 2014.
BoJ: Upside risks of inflation to be examined humbly and without any preconceptions
In the summary of opinions of BoJ's September 21-22 meeting, it's noted that risks of "consumer prices deviating significantly upward from the baseline scenario, including the impact of foreign exchange rates, needs to be examined humbly and without any preconceptions."
But while a "certain degree of upside risk to prices" exists, there is a "long way to go" to achieve 2% inflation target in a "sustainable and stable manner". Output gap has been "negative", unemployment rate and active active job openings-to-applicants ratio "have not returned to pre-pandemic levels". Surge in energy and raw material prices has brought about an "outflow of income" from Japan. It is "appropriate" to continue with the current monetary easing.
Regarding exchange rate, one opinion noted that " further depreciation of the yen is partly due to differences in the direction of monetary policy between Japan and other economies.. the Bank needs to carefully explain the significance of continuing with the current monetary easing."
EUR/USD Recovers But Faces Uphill Task
Key Highlights
- EUR/USD started an upside correction above the 0.9700 level.
- It is facing a major resistance near 0.9820 and 0.9900 on the 4-hours chart.
- GBP/USD climbed higher sharply above the 1.0850 resistance zone.
- The US ISM Manufacturing PMI could decline from 52.8 to 52.3 in Sep 2022.
EUR/USD Technical Analysis
The Euro started a steady decline from well above the 1.0150 level against the US Dollar. EUR/USD traded to a new multi-year low at 0.9537 before it started a recovery.
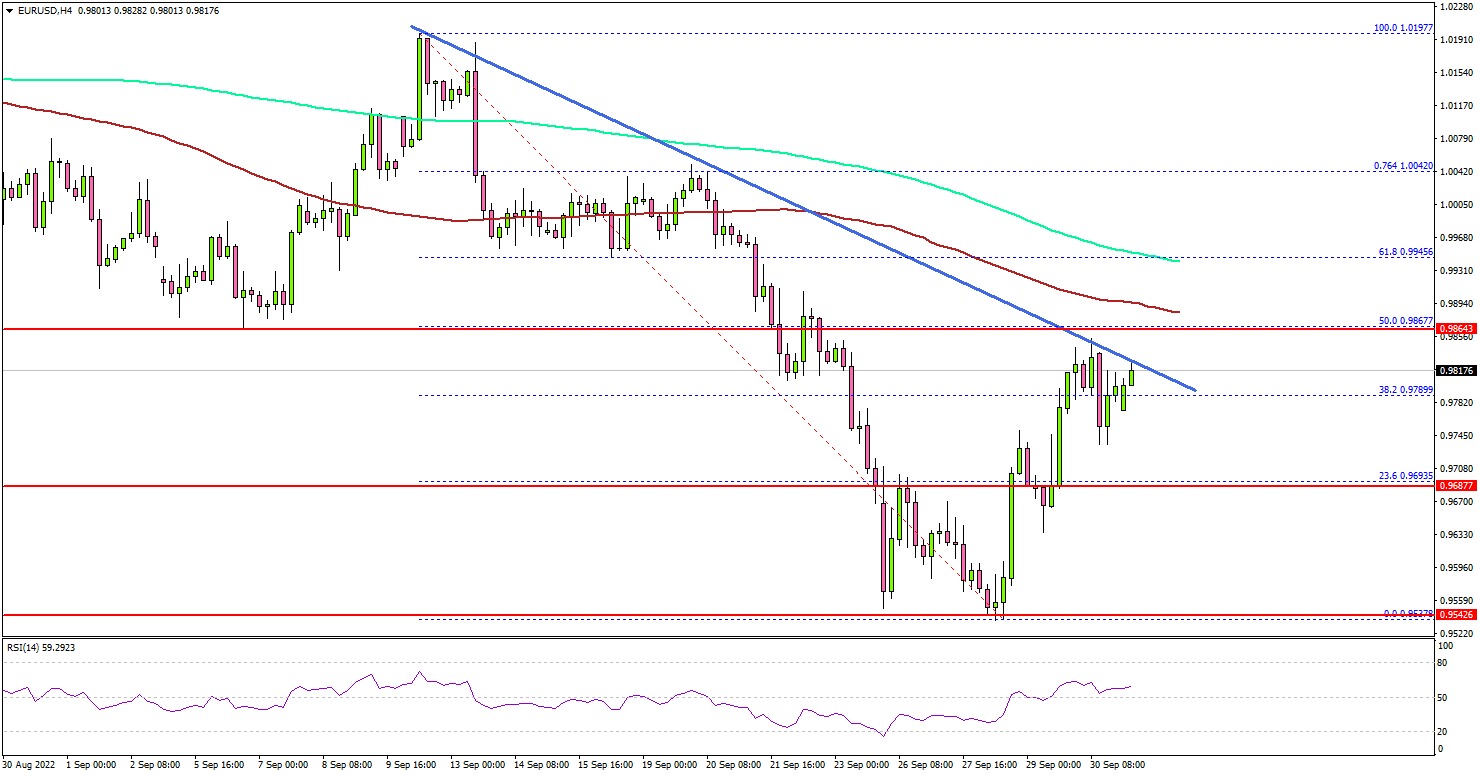
Looking at the 4-hours chart, the pair was able to climb above the 0.9650 and 0.9720 resistance levels. There was a move above the 38.2% Fib retracement level of the downward move from the 1.0197 swing high to 0.9537 low.
It even attempted a move above the 0.9820 resistance zone. However, the pair is facing a major resistance near 0.9820 and 0.9900 on the same chart.
The 50% Fib retracement level of the downward move from the 1.0197 swing high to 0.9537 low is acting as a resistance. The first major resistance is near 0.9900 and the 100 simple moving average (red, 4-hours).
A clear move above the 0.9900 level might send the pair towards the 1.0000 level or at least the 200 simple moving average (green, 4-hours).
On the downside, an initial support is near the 0.9740 level. The main support sits at the 0.9700 level. A downside break below the 0.9700 zone might send the pair towards the 0.9620 level. The next major support is near the 0.9550 level, below which the pair could even test the 0.9400 support zone.
Looking at GBP/USD, the pair started an upside correction and the bulls were able to push the pair above the 1.0850 resistance zone.
Economic Releases
- Germany’s Manufacturing PMI for Sep 2022 - Forecast 48.3, versus 48.3 previous.
- Euro Zone Manufacturing PMI for Sep 2022 – Forecast 48.5, versus 48.5 previous.
- UK Manufacturing PMI for Sep 2022 – Forecast 48.5, versus 48.5 previous.
- US Manufacturing PMI for Sep 2022 – Forecast 51.8, versus 51.8 previous.
- US ISM Manufacturing PMI for Sep 2022 – Forecast 52.3, versus 52.8 previous.
Recession Fears Grow in Europe
Experts forecast that inflation will hit double digits while oil prices continue to fall as recession fears rise amid investor concerns about the ailing state of the global economy.
The Ukraine war is affecting markets around the world and generating extreme volatility.
Fears of recession grow in Europe as Ukraine war marks 6 months
Worries over inflation in Europe have been brewing even before Russia war with Ukraine in February. While some considered it was temporary, others warned that it was a sign of a deeper crisis. Now, six months since the start of the war in Ukraine, is a recession inevitable in Europe?
The impacts of the conflict will likely vary depending on geographical location. Europe, and countries such as the Baltic states and Poland, are likely to experience more difficulties than countries that depend less on Russia for energy. Western Europe, in particular Germany, also has no easy alternative energy source to replace natural gas from Russia.
After Moscow decided to temporarily suspend its gas supply to Germany, gas prices climbed to €295 per Megawatt-Hour. Recent data showed that business activity in Germany and France contracted in August due to falling demand and rising prices.
The euro hit a new 20-year low against the USD, making it more expensive to buy energy on international markets, which is paid with the US dollar. Bundesbank, Germany’s central bank, forecast that inflation, which is at 7.5%, will hit double figures in autumn.
Inflation in the UK is predicted to reach a high in 2023
Goldman Sachs economists have warned that UK inflation could go above 20% in 2023 if natural gas prices remain high in the coming months. The investment bank has warned that high inflation will push the UK economy into recession.
Europe is facing a long list of problems. Capital Economics says that most European countries will be harder hit by the increasing gas prices than the oil crisis in 1974 and 1979, which were both “followed by recessions.”
In fact, recession fears are being mentioned more often in economic forecasts. The Dutch bank ING recently reported that the composite PMI, which tracks business trends in the manufacturing and service sectors, fell below 50 points. “Anything under 50 indicates falling business activity, so the survey is hinting at a contraction that started in the third quarter,” it stated, in reference to July.
Goldman Sach predicts a recession in Europe
In a report, the investment bank Goldman Sachs forecast a mild recession in the second half of 2022 due to disruptions to the gas supply as a result of the Russia war in Ukraine. “A full stop to Russian gas deliveries could trigger a severe downturn in Europe.”
The report indicated that the countries which are most dependent on Russian gas, such as Germany and Italy, would be the hardest affected by the recession.
New interest rate rise
As inflation erodes purchasing power, forcing people to reduce their spending, there is growing pressure on the European Central Bank (ECB) to raise interest rates. Inflation in the eurozone increased to 8.9% in July, and the euro continues to weaken against the dollar.
The ECB looks set to raise interest by another 50 basis points in September. However, there is the chance the ECB will hold off on further interest rate hikes due to pessimistic economic forecasts.
The concern over a likely recession is linked to energy prices. The most optimistic economists maintain that the current energy crisis has been triggered by the war in Ukraine, which means it is a circumstantial problem. Therefore, this view claims that any recession would be temporary, but there is no indication that the war in Ukraine will end soon.
Europe vs. the US
In the US there are already signs of improvement as inflation fell in July from 9.1% to 8.5% due to the drop in gas prices.
However, Europe continues to pay for its dependence on gas and inflation in Europe is already greater than the figure in the US.
Falling food prices and the fall in oil prices have not been enough to counteract the increase in gas prices in Europe. But some analysts argue that a recession could help deal with inflation, so long as it is not a prolonged recession.
The US is more protected than Europe
Due to its huge domestic economy and its ability to meet its energy needs without imports, the US is more protected than Europe is from the effects of the Ukraine-Russia war.
However, due to the global nature of financial markets, this could mean that US investors will see more volatility in the coming months, even if the US avoids recession in comparison to Europe. The European Union’s economy is larger than that of the US and many US-listed companies depend on European consumers for a considerable part of their earnings. If these European consumers spend less due to fear of becoming unemployed in a recession, company earnings and prices of stocks in US investors’ portfolios could also decline.
Beyond the Russia war, uncertainty is also likely to be raised by the prospect of unintended consequences resulting from western sanctions against Russia and the risks that policymakers will involve the US in a conflict that the US could otherwise mainly avoid the effects of.
Eco Data 10/3/22
[php_everywhere instance="1"]
Risk-off Sentiment to Continue, But the Worst is Behind Sterling
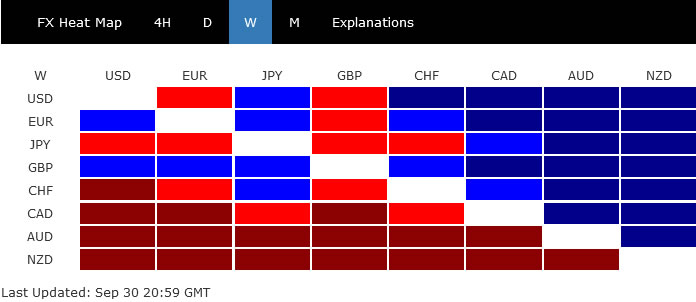
Sterling surprisingly ended as the best performer last week, as it staged an impressive U-turn after initial selloff. BoE's intervention should have saved the Pound for now. The development also helped Euro rebound while Dollar trailed behind as third. Rally in Dollar looked a bit exhausted as it failed to ride on intensifying risk-off sentiment.
On the other hand, commodity currencies tumbled broadly, following worsening investor sentiment. New Zealand Dollar led the way but Australian and Canadian Dollar were not too far behind. Yen was mixed as the impact of Japan's currency intervention faded.
DOW extended selloff on fed tightening, worsening geo-risks
US stock markets ended last week with intensifying selloff. DOW closed down another -500pts to end the month down nearly -9%, worst monthly drop since March 2020. It's also down more than -5% in Q3, and around -20% this year. Other majors didn't perform better, with S&P down nearly -9% in September and nearly -24% this year. NASDAQ was down -10% this month, and more than -30% this year.
On the one hand, Fed's tightening is set to continue on aggressive pace. Markets are pricing in more than 50% chance of another 75bps hike in early November, while the federal funds rate should top 4% be the end of the year for sure. On the other hand, geopolitical risks look likely to worsen after Russia's annexation of four of Ukraine's territory, and threatened to use nuclear weapons. To protect its territory and people, Ukraine is officially applying for NATO membership, to make the "de facto" alliance "de jure".
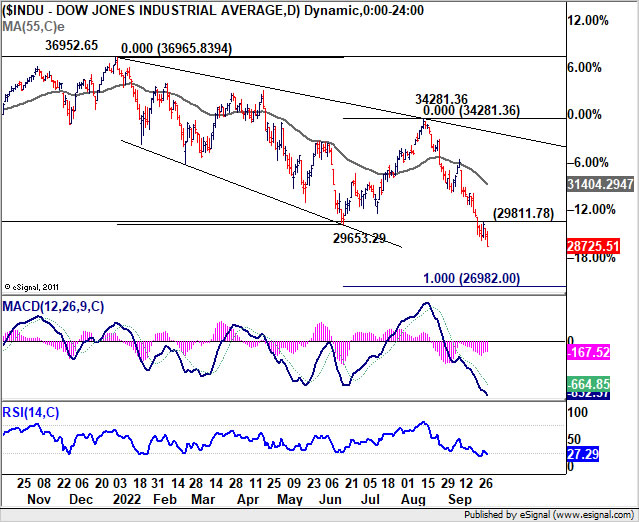
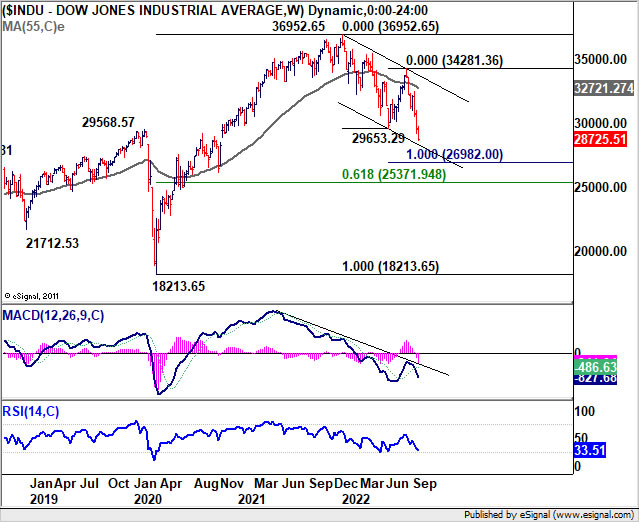
DOW is extending the the fall from 34281.36, which is seen as the third leg of the whole correction from 36965.83. Near term look stays bearish as long as 29811.78 resistance holds. Next target is 100% projection of 36965.83 to 29653.29 from 34281.36 at 26982 and possibly below. There should be some support from 61.8% retracement of 18213.65 to 36952.65 at 25371.94 to bring rebound.
Dollar index struggled the break through channels
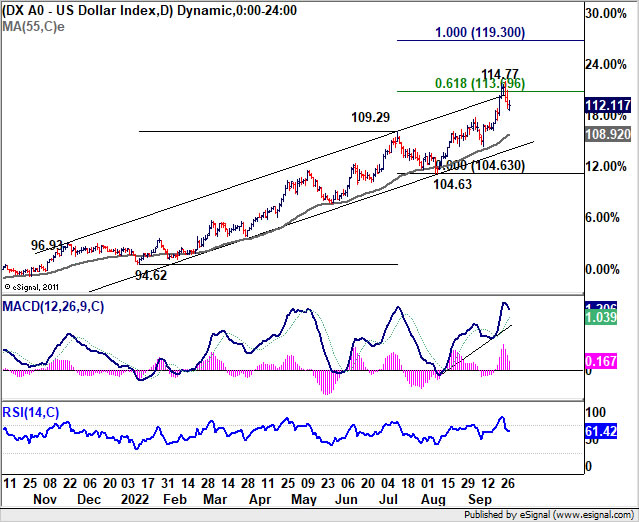
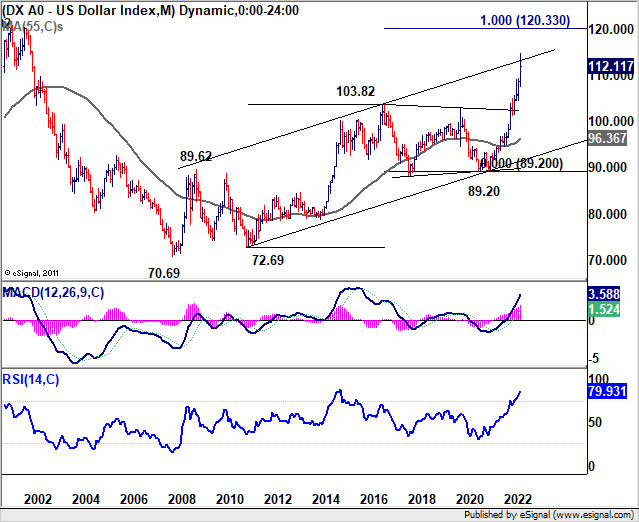
Dollar didn't benefit much from risk-off sentiment. While Dollar index spiked higher to 114.77, it quickly turned into consolidations and retreated. DXY is pressing both the top of a medium term term channel and the two-decade channel. It has also met a target of 61.8% projection of 94.62 to 109.29 from 104.63 at 113.69. Hence, there is prospect of more consolidation before 114.77 first.
Still, break of 109.29 resistance turned support is needed to confirm topping. Otherwise, further rally will remain in favor after the pull back completes. Firm break of 113.69 will pave the way to 100% projection at 119.30, which is close to 120 psychological level, and 2001 high.
More downside for AUD/JPY and NZD/JPY as risk-off continues
Talking about risk-off sentiment, there is prospect of more downside in commodity-yen crosses, in particular, as USD/JPY could head back towards lower end of range of 140.33/145.89.
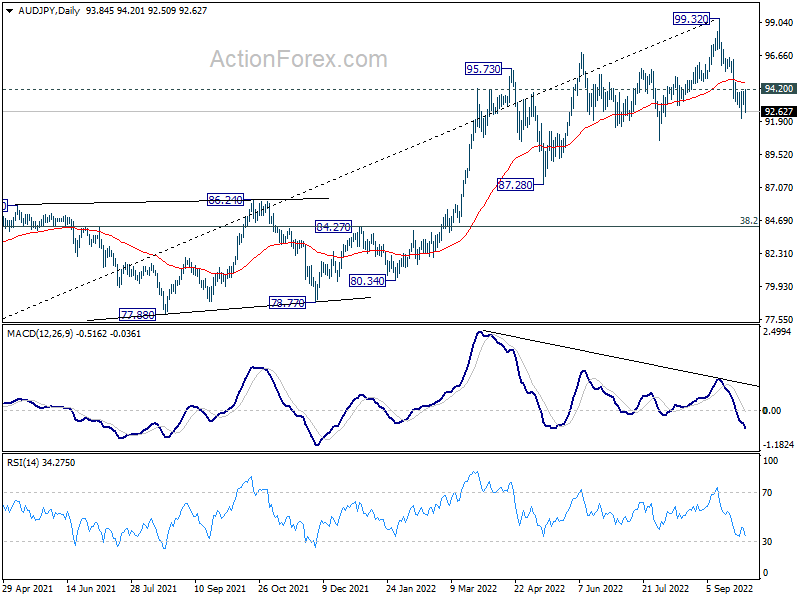
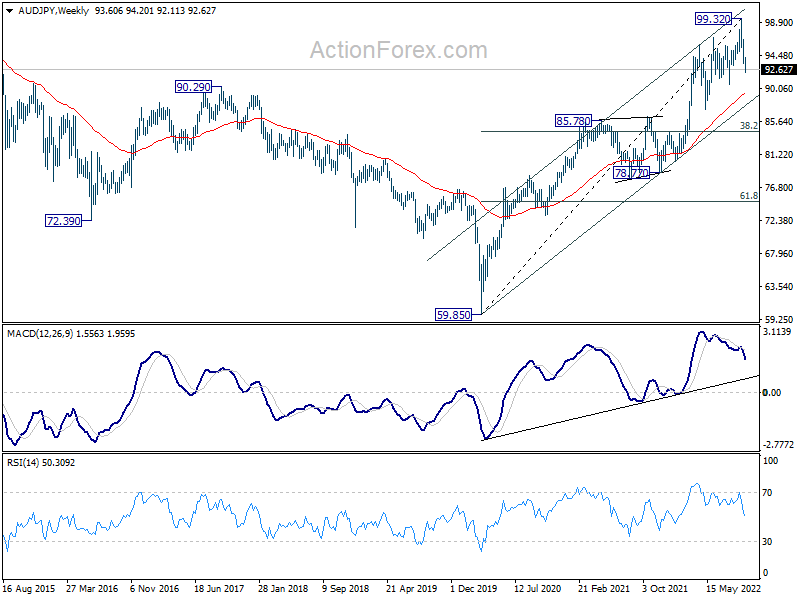
AUD/JPY's correction from 99.32 extended lower last week and near term outlook will stay bearish as long as 94.20 resistance holds. Considering bearish divergence condition in daily MACD, 99.32 should be a medium term top. The question is, whether it's now in correction to the rise from 78.77, or that from 59.85.
First line of defense is between channel support at 87.80 and 55 week EMA (now at 87.94). Strong support from there would keep the correction relatively brief and shallow. However, sustained break of this zone will pave the way back to 38.2% retracement of 59.85 to 99.32 at 84.24, which is close to 85.78 resistance turned support.
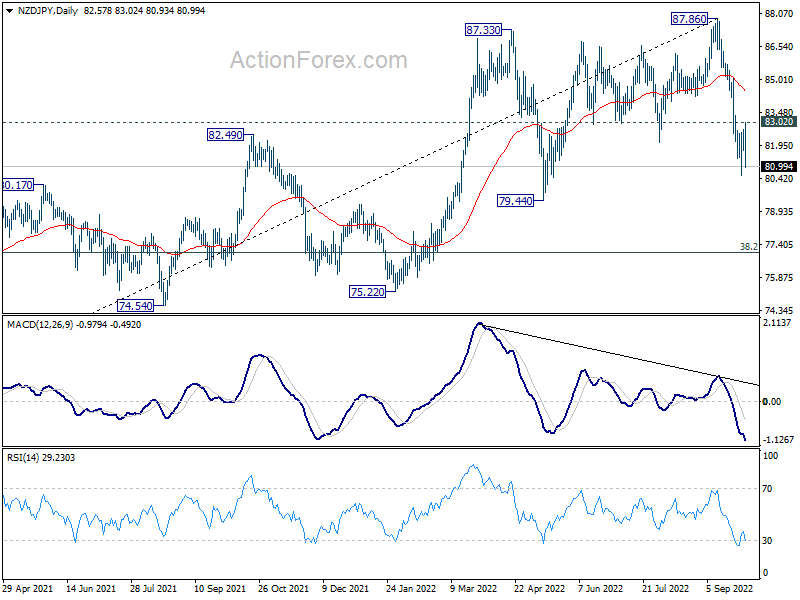
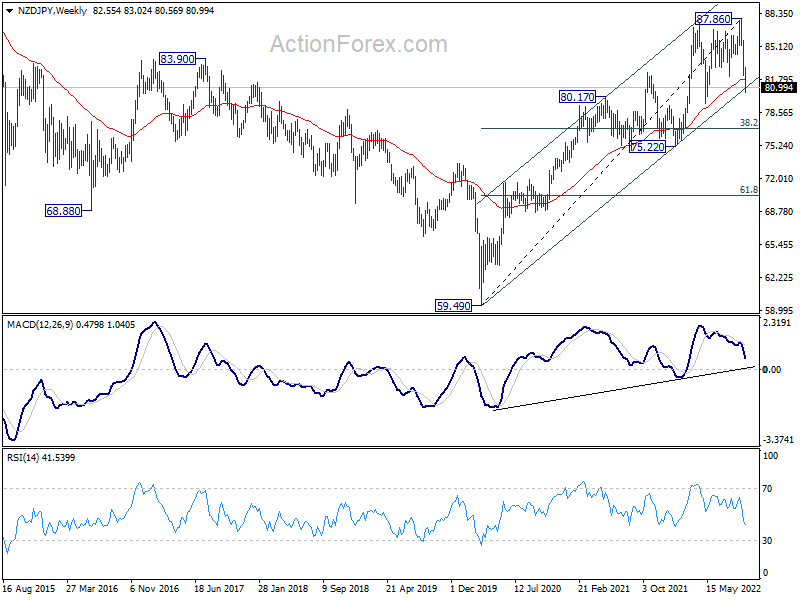
NZD/JPY's performance was worse and it's broken 55 week EMA, and pressing channel support. Near term outlook stays bearish as long as 83.02 resistance holds. Sustained break of channel support at 81.06 will indicate that it's already correcting whole up trend from 59.49. Deeper fall would then be seen to 38.2% retracement of 59.49 to 87.86 at 77.02 before bottoming.
The worst is behind Sterling
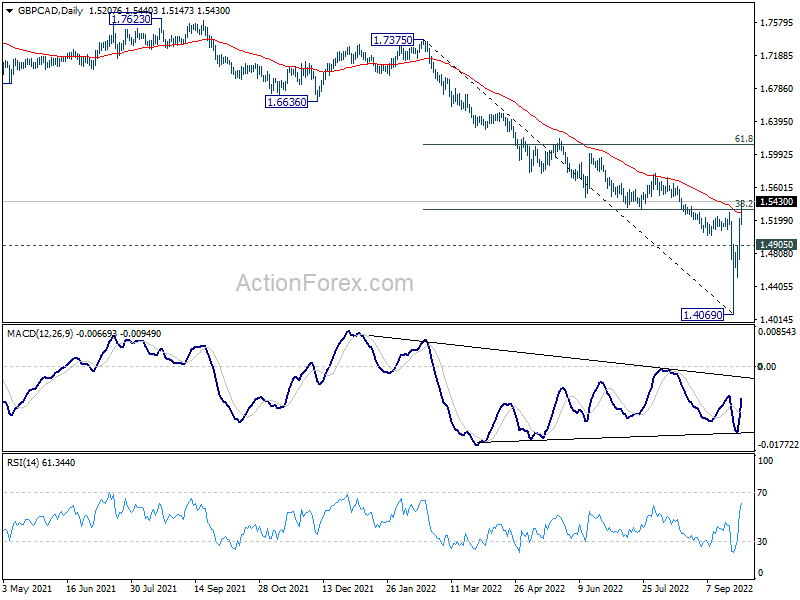
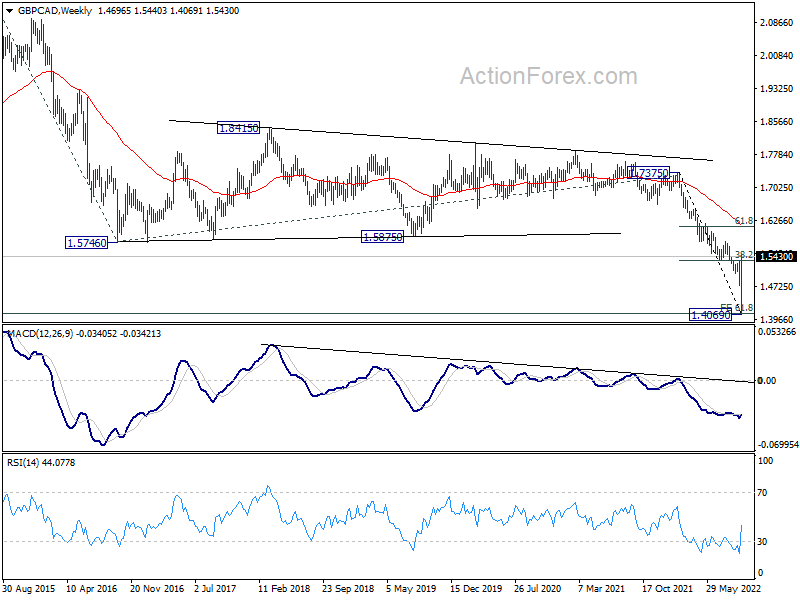
On the other hand, the worst appears to be behind for the Pound, after BoE stepped in with targeted and time-limited operation to stabilize gilts. GBP/CAD's break of 55 day EMA (now at 1.5297) suggests that the down trend from 1.7375 has completed at 1.4069, on bullish convergence condition in daily MACD.
Further rise is now expected in GBP/CAD as long as 1.4905 minor support holds, at least as a corrective rebound. Next target is 61.8% retracement of 1.7375 to 1.4069 at 1.6112, which is slightly above 1.5857 long term support turned resistance, and below 55 week EMA (now at 1.6149). Strong resistance could be seen around there limit upside, but that's a later story.
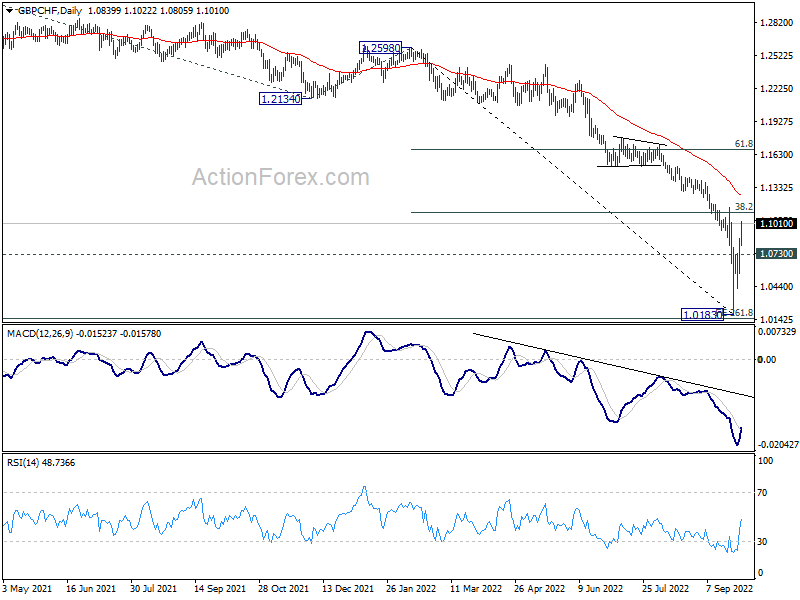
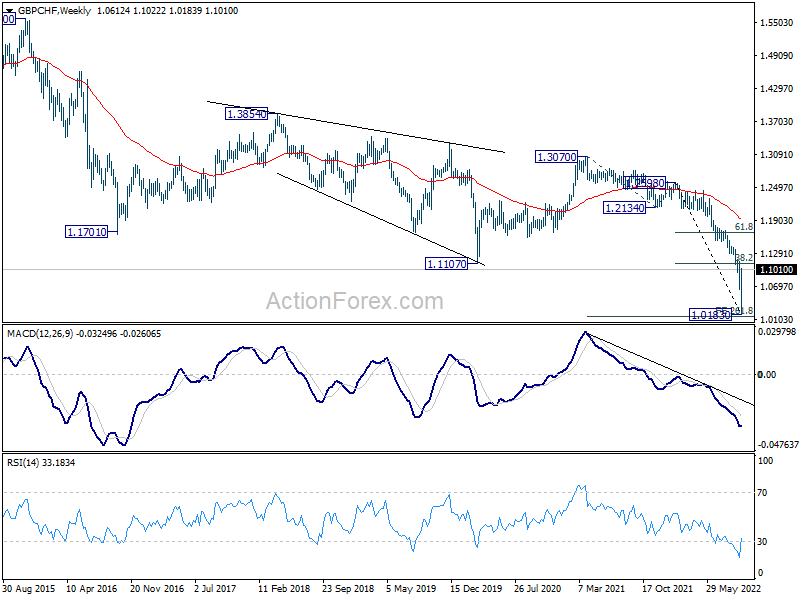
To further confirm underlying momentum of Sterling's rebound, GBP/CHF will also be monitored. Sustained break of 38.2% retracement of 1.2598 to 1.0183 at 1.1106 will indicate stronger rebound is on the way to 61.8% retracement at 1.1675. The could help lift Sterling elsewhere. However, rejection by 1.1106, followed by break of 1.0730 minor support, will bring retest of 1.0183 low. That would, instead, cap the Pound's rebound against others.
EUR/AUD Weekly Outlook
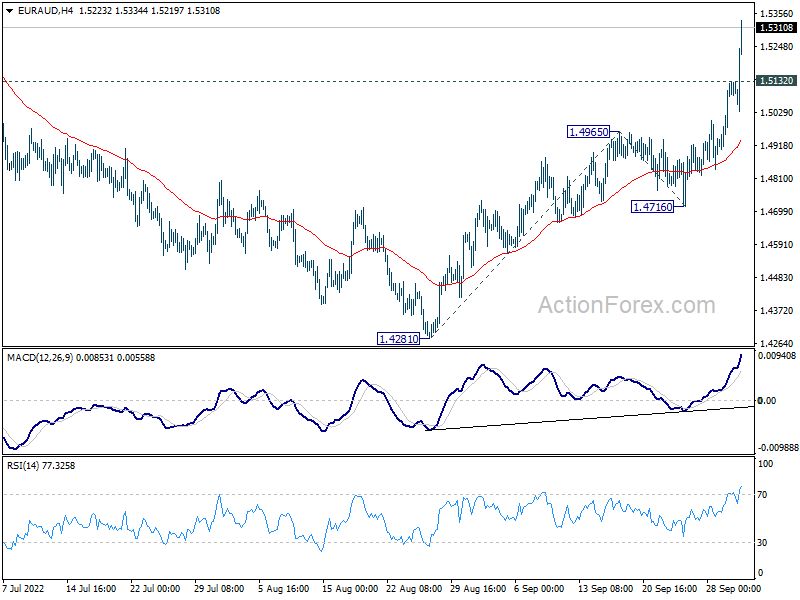
EUR/AUD's rebound from 1.4281 resumed last week and accelerated to close strongly at 1.5310. Initial bias stays on the upside this week for 100% projection of 1.4281 to 1.4965 from 1.4716 at 1.5400, which is close to 1.5396 key resistance. Firm break there will carry larger bullish implication. Next target is 161.8% projection at 1.5823. On the downside, below 1.5132 minor support will turn intraday bias neutral first.
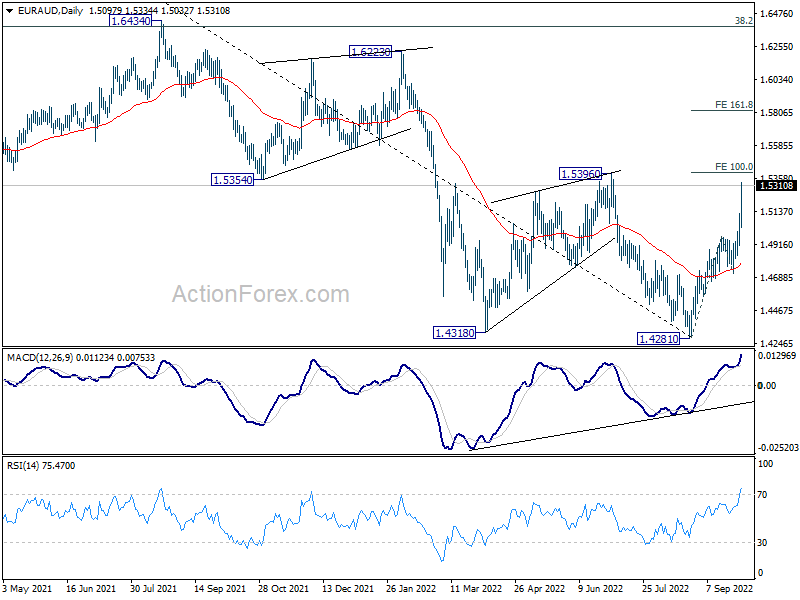
In the bigger picture, current development raises the chance of medium term bottoming at at 1.4281, on bullish convergence condition in daily MACD. Firm break of 1.5396 will bring stronger rally back to 1.6434 key resistance next. Nevertheless, rejection by 1.5396 will maintain medium term bearishness for another fall through 1.4281 at a later stage.
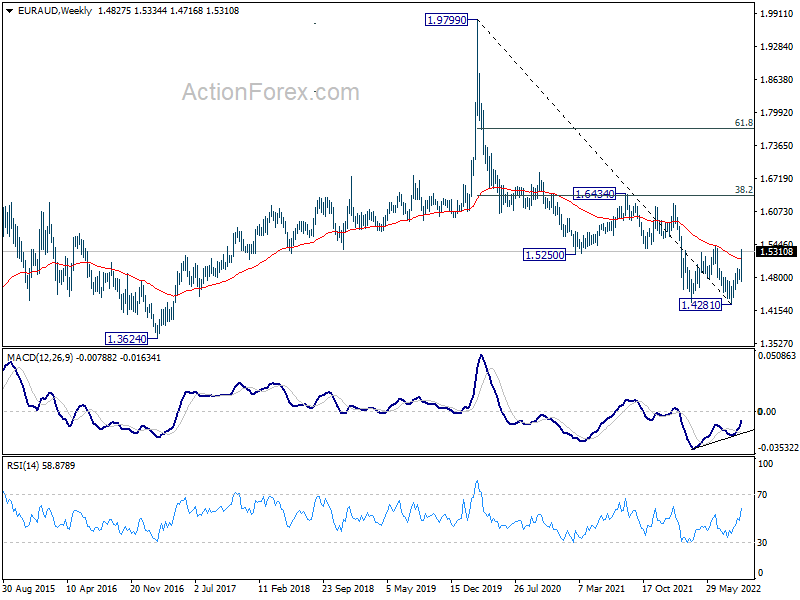
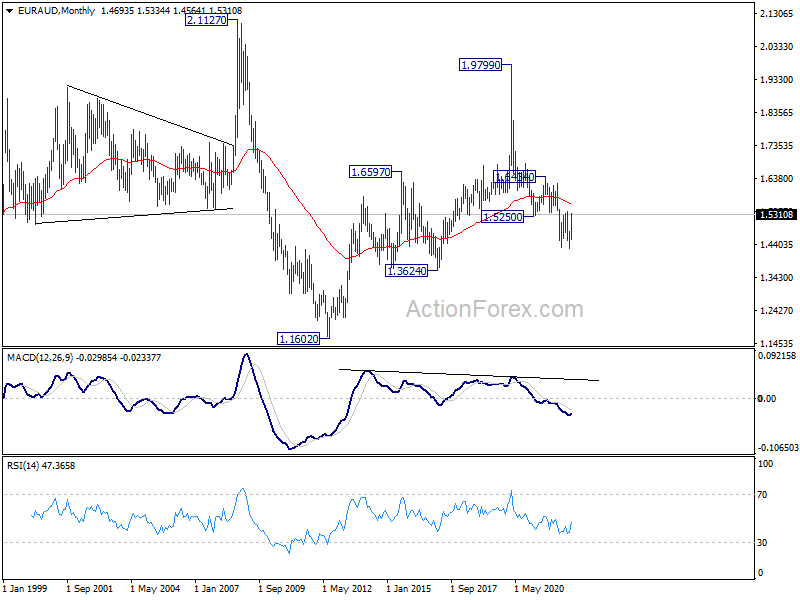
In the longer term picture, as long as 55 month EMA (now at 1.5610) holds, the down trend from 1.9799 (2020 high) could still extend to 1.3624 long term support, and below. However, sustained trading above 55 month EMA will raise the chance that this down trend was over. Further break of 1.6434 resistance should confirm medium term bullish reversal.
EUR/USD Weekly Outlook
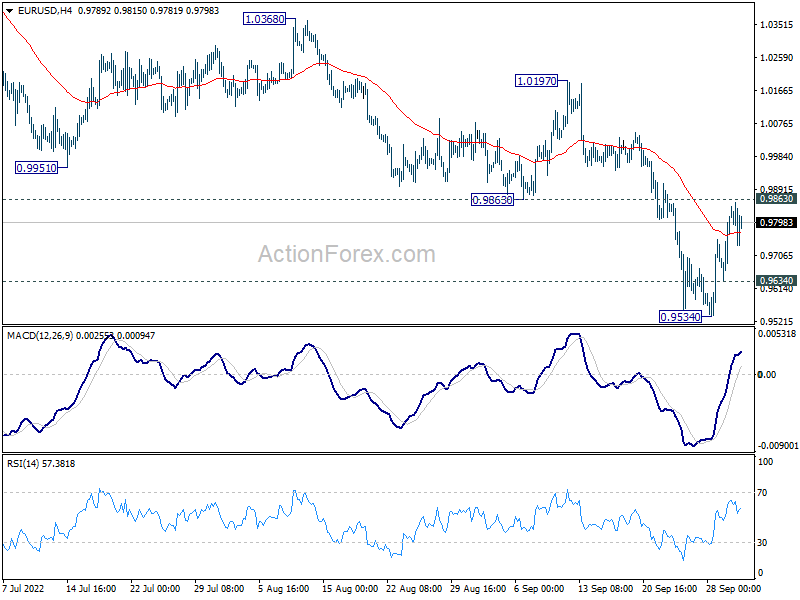
EUR/USD recovered after dipping to 0.9534 last week, but stays below 0.9863 support turned resistance. Initial bias remains neutral this week first. Break of 0.9634 minor support will suggest that larger down trend is ready to resume. Intraday bias will be back on the downside for 0.9534 and below. However, sustained break of 0.9863 will confirm short term bottoming, and bring stronger rally back to 1.0197 resistance instead.
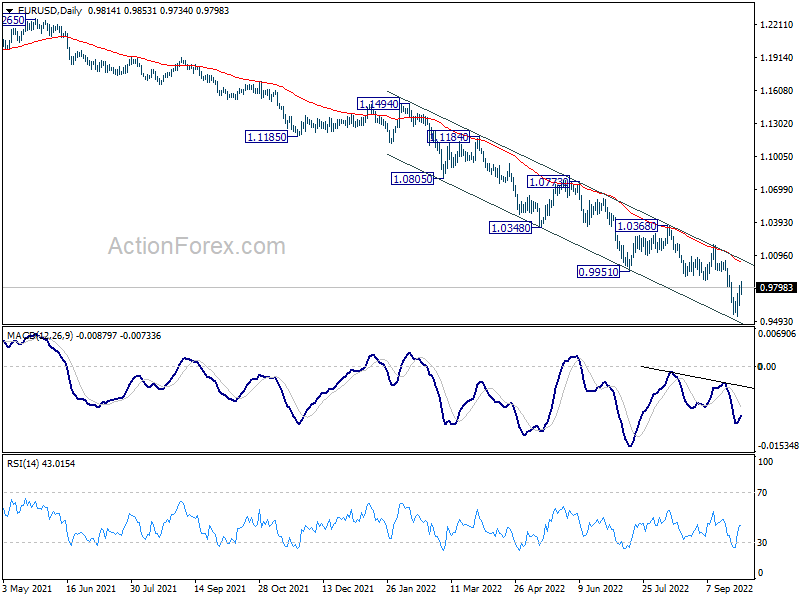
In the bigger picture, down trend from 1.6039 (2008 high) is still in progress. Next target is 100% projection of 1.3993 to 1.0339 from 1.2348 at 0.8694. In any case, break of 1.0197 resistance is needed to be the first sign of medium term bottoming. Otherwise, outlook will stay bearish even with strong rebound.
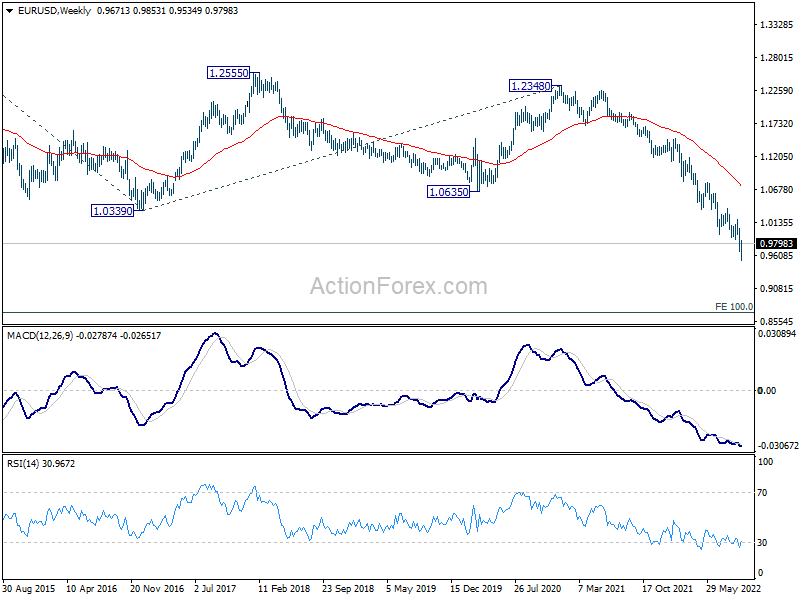
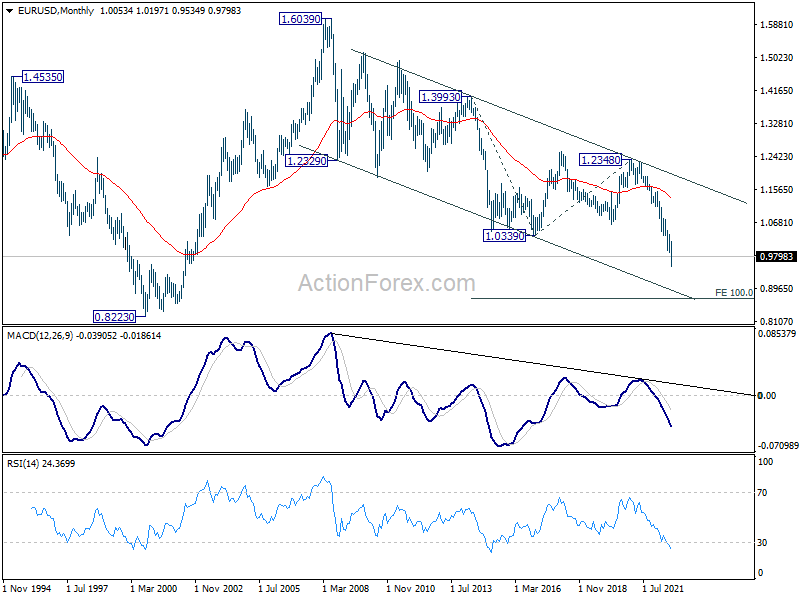
In the long term picture, long term down trend from 1.6039 (2008 high) is extending. Next target is 100% projection of 1.3993 to 1.0339 from 1.2348 at 0.8694. This will now remain the favored case as long as 1.0635 support turned resistance holds.
USD/JPY Weekly Outlook
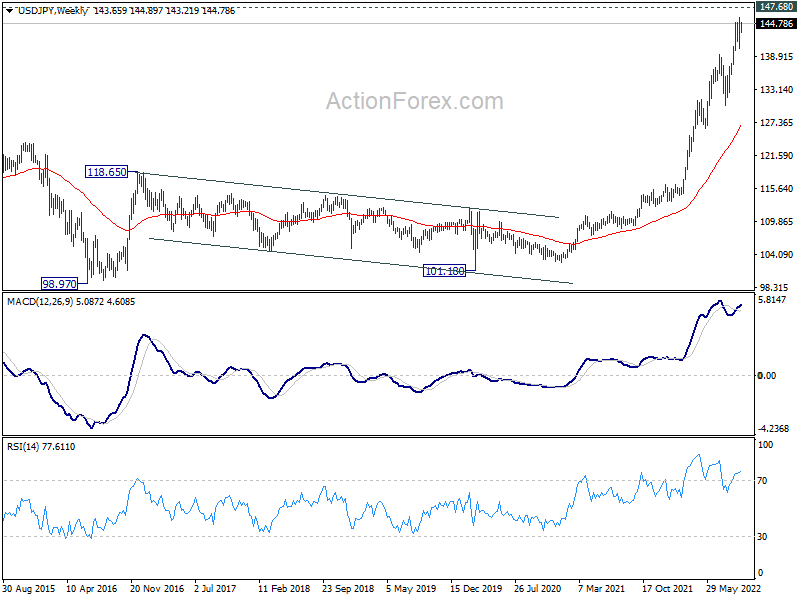
USD/JPY stayed in consolidation below 145.89 last week and outlook is unchanged. Initial bias remains neutral this week first. Further rally is expected as long as 139.37 resistance turned support holds. Break of 145.89 will target 147.68 long term resistance. On the downside, however, decisive break of 139.37 will confirm short term topping. Deeper decline would be seen back towards 130.38 support.
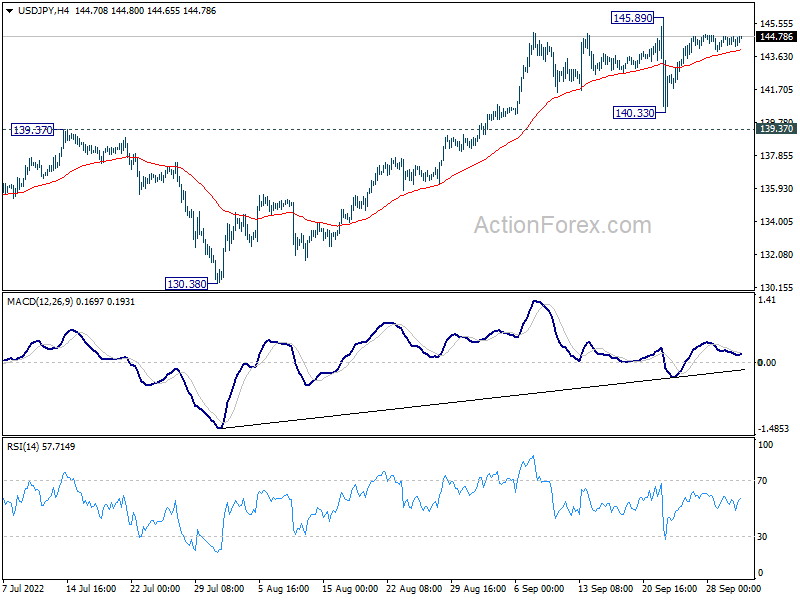
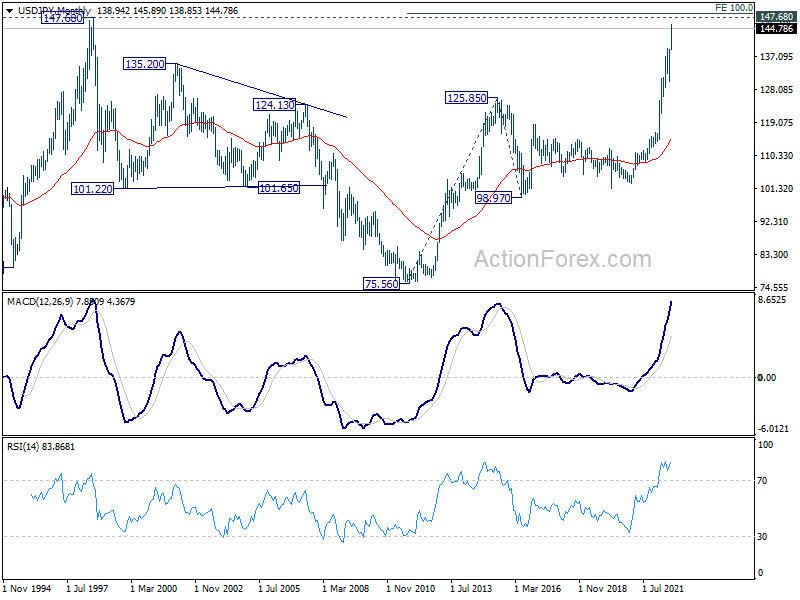
In the bigger picture, up trend from 101.18 is still in progress, as part of the whole up trend from 75.56 (2011 low). Further rise should be seen to 147.68 (1998 high). For now, break of 130.38 support is needed to be the first indication of medium term topping. Otherwise, outlook will stay bullish even in case of deep pull back.
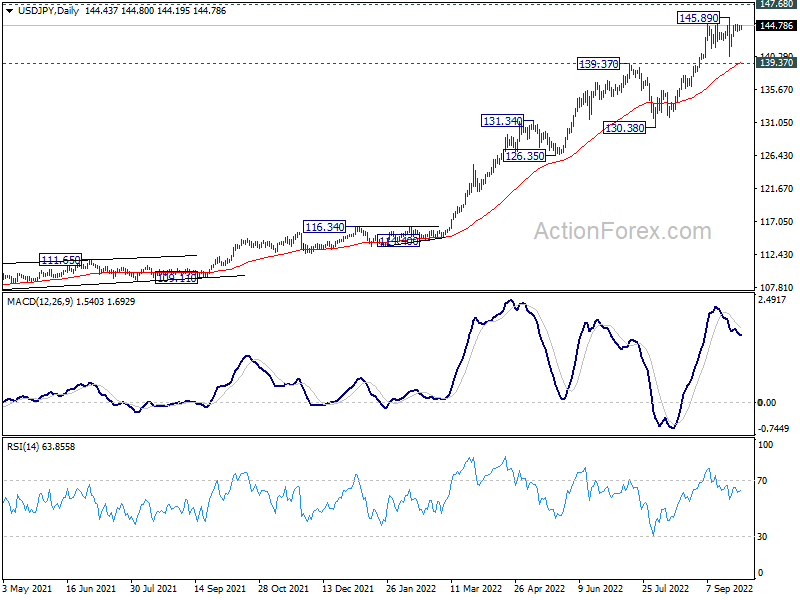
In the long term picture, rise from 101.18 is seen as part of the up trend from 75.56 (2011 low). Further rally is expected to 100% projection of 75.56 (2011 low) to 125.85 (2015 high) from 98.97 at 149.26, which is slightly above 147.68 (1998 high). This will remain the favored case as long as 130.38 support holds.