Sample Category Title
Swiss CPI unexpectedly slowed to 3.3% yoy, EUR/CHF extends rebound
Swiss CPI dropped -0.2% mom in September, below expectation of 0.1% mom. The decrease of 0.2% compared with the previous month can be explained by several factors including falling prices for fuels, heating oil, hotels and supplementary accommodation. In contrast, prices for clothing and footwear increased.
Comparing with the same month a year ago, CPI slowed to 3.3% yoy, down from 3.5% yoy, below expectation of 3.5% yoy. Core CPI (excluding fresh and seasonal products, energy and fuel) was flat mom, up 2.0% yoy (unchanged from August). Domestic product prices rose 1.8% yoy (unchanged from August). Imported product prices rose 7.8% yoy (down from 8.6% yoy in August).
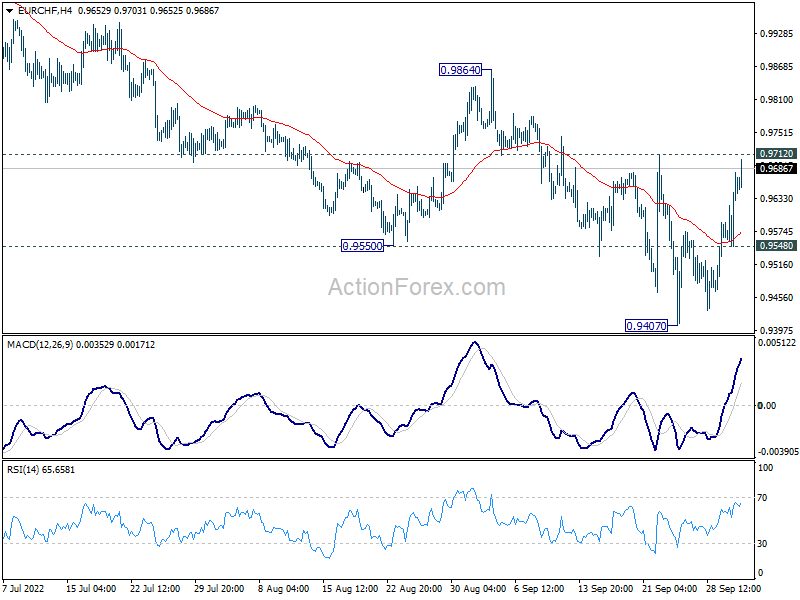
EUR/CHF rises further as Swiss CPI unexpectedly slowed. Immediate focus is now on 0.9712 resistance. Firm break there will raise the chance of larger bullish reversal, and target 0.9864 structural resistance for confirmation.
USD/CHF: Is there Enough Gas in the Bears’ Tank to Continue the Correction Trend?
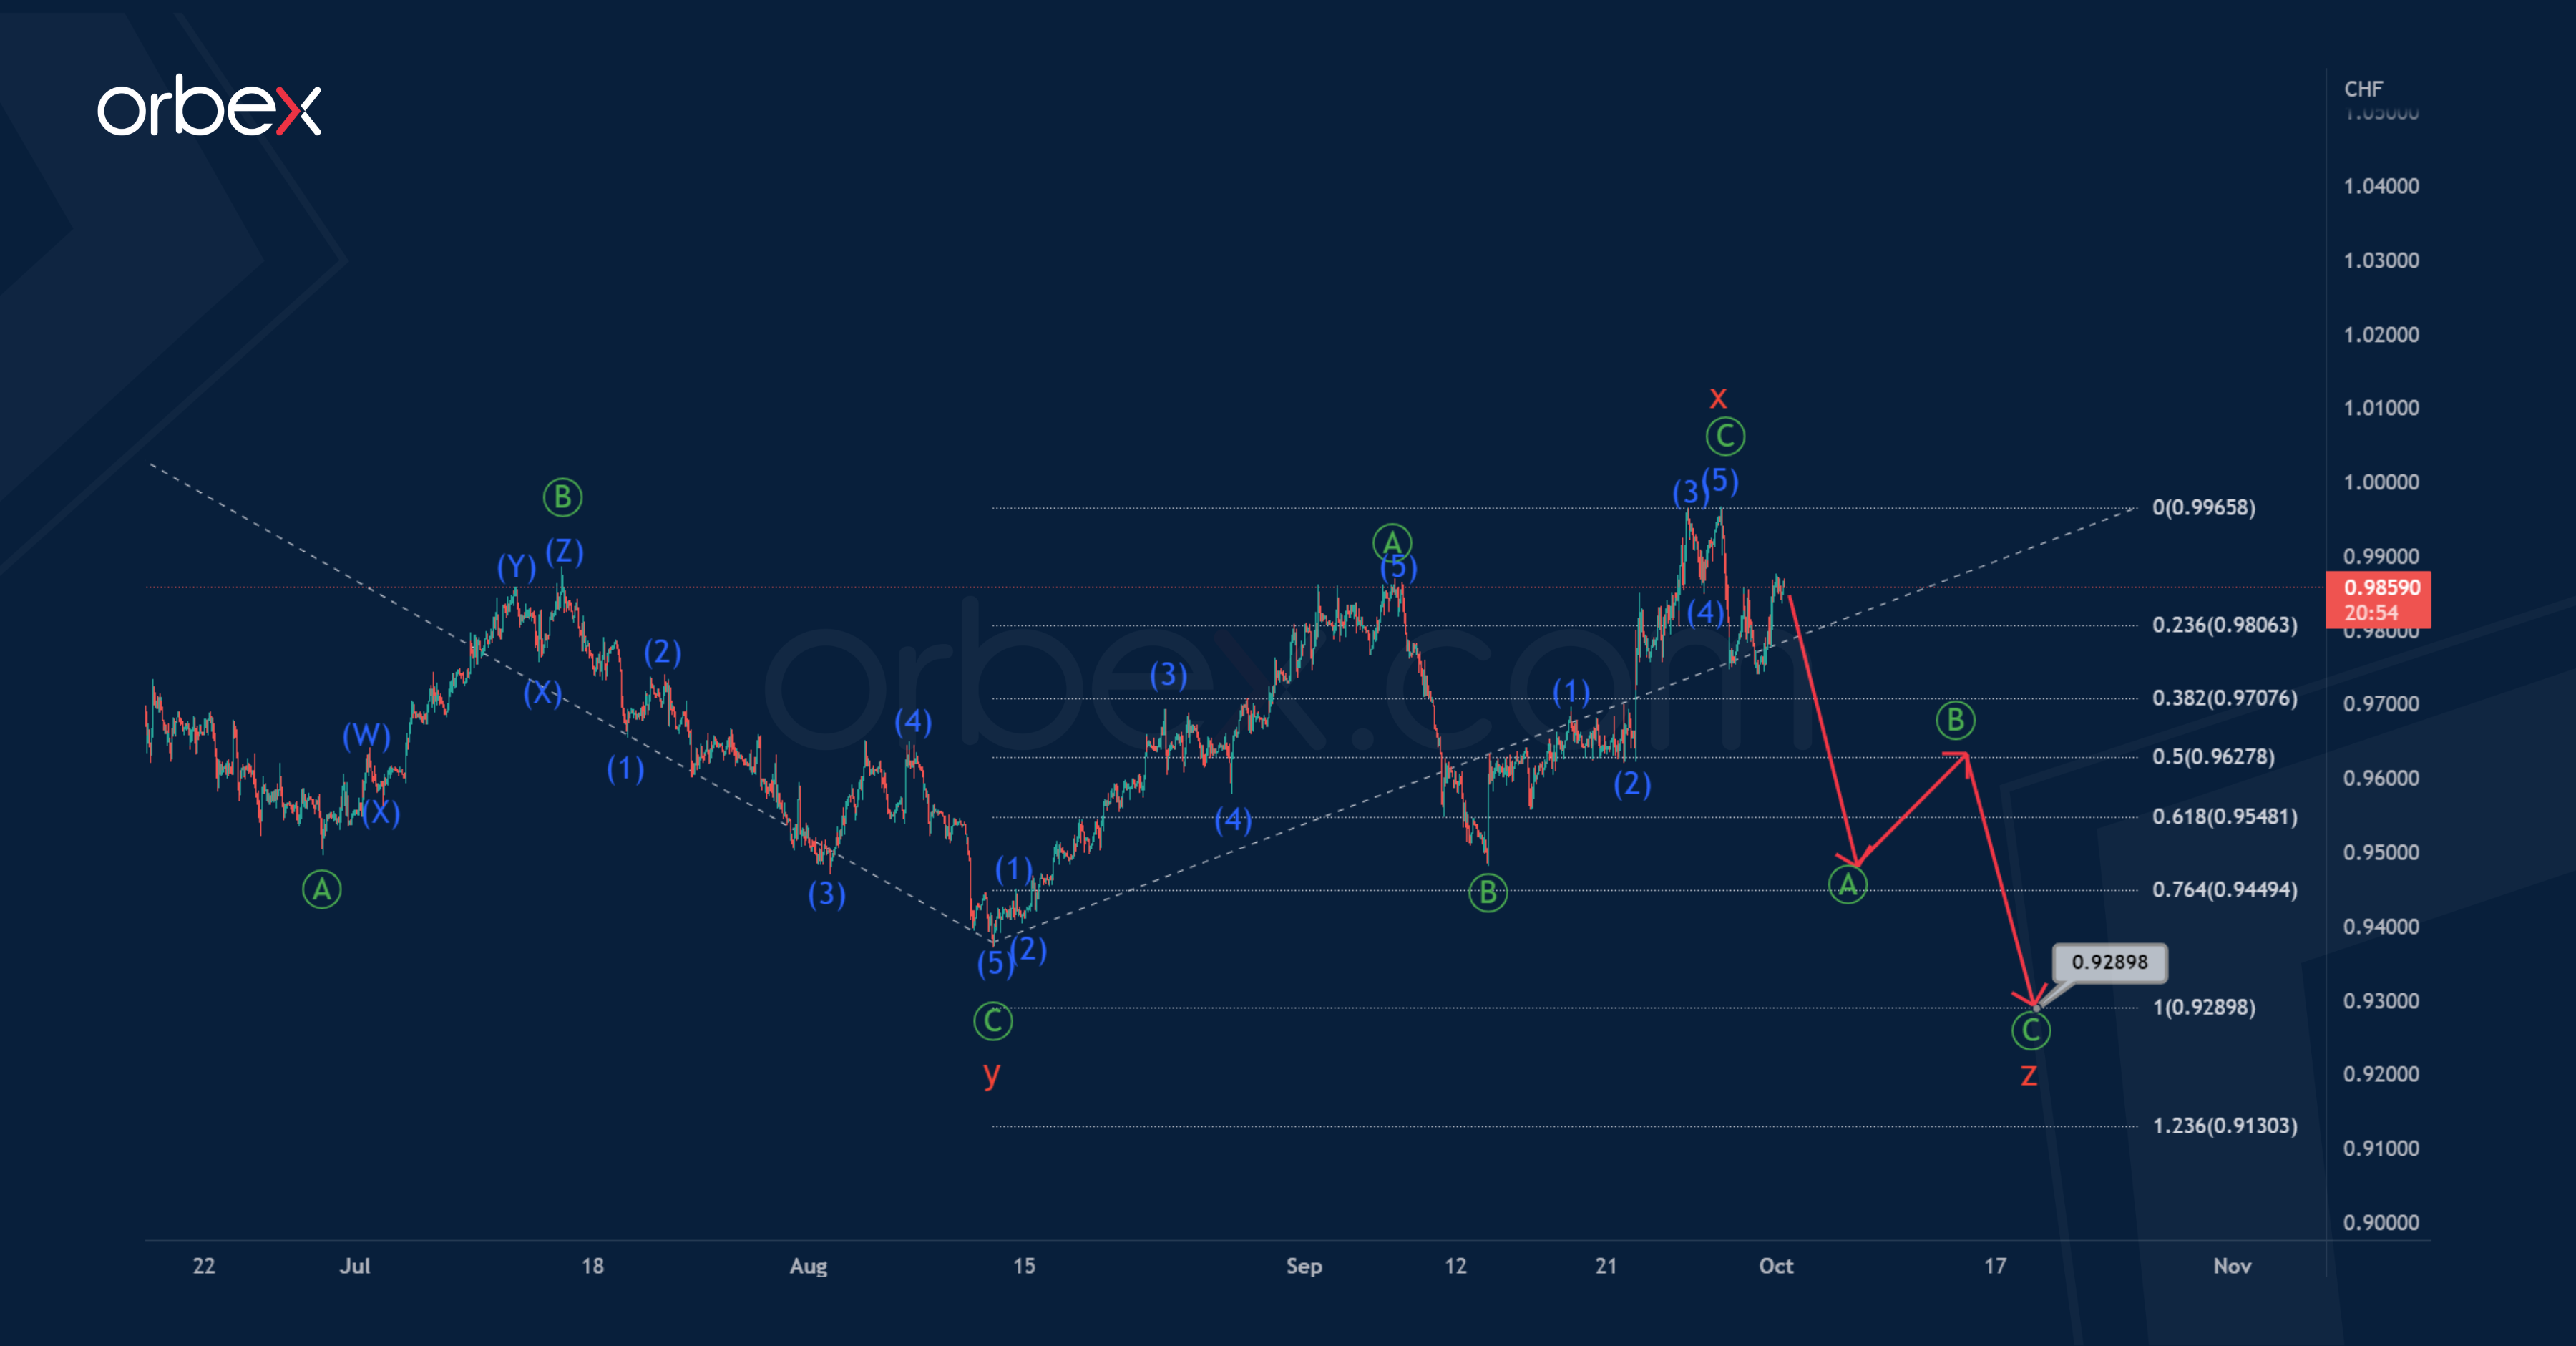
On the 1H timeframe for the USDCHF pair, we see the final part of the proposed large double zigzag consisting of cycle sub-waves w-x-y. This pattern looks fully completed.
Perhaps the price decline in the cycle wave y, which is the primary standard zigzag, has recently come to an end. Currently, there is a development of the initial part of a new corrective trend.
It is assumed that a standard 3-wave zigzag Ⓐ-Ⓑ-Ⓒ of the primary degree is under construction.
It is likely that the first two sub-waves Ⓐ-Ⓑ are completed, so an increase in impulse Ⓒ is expected, as shown in the chart, to 1.0096.
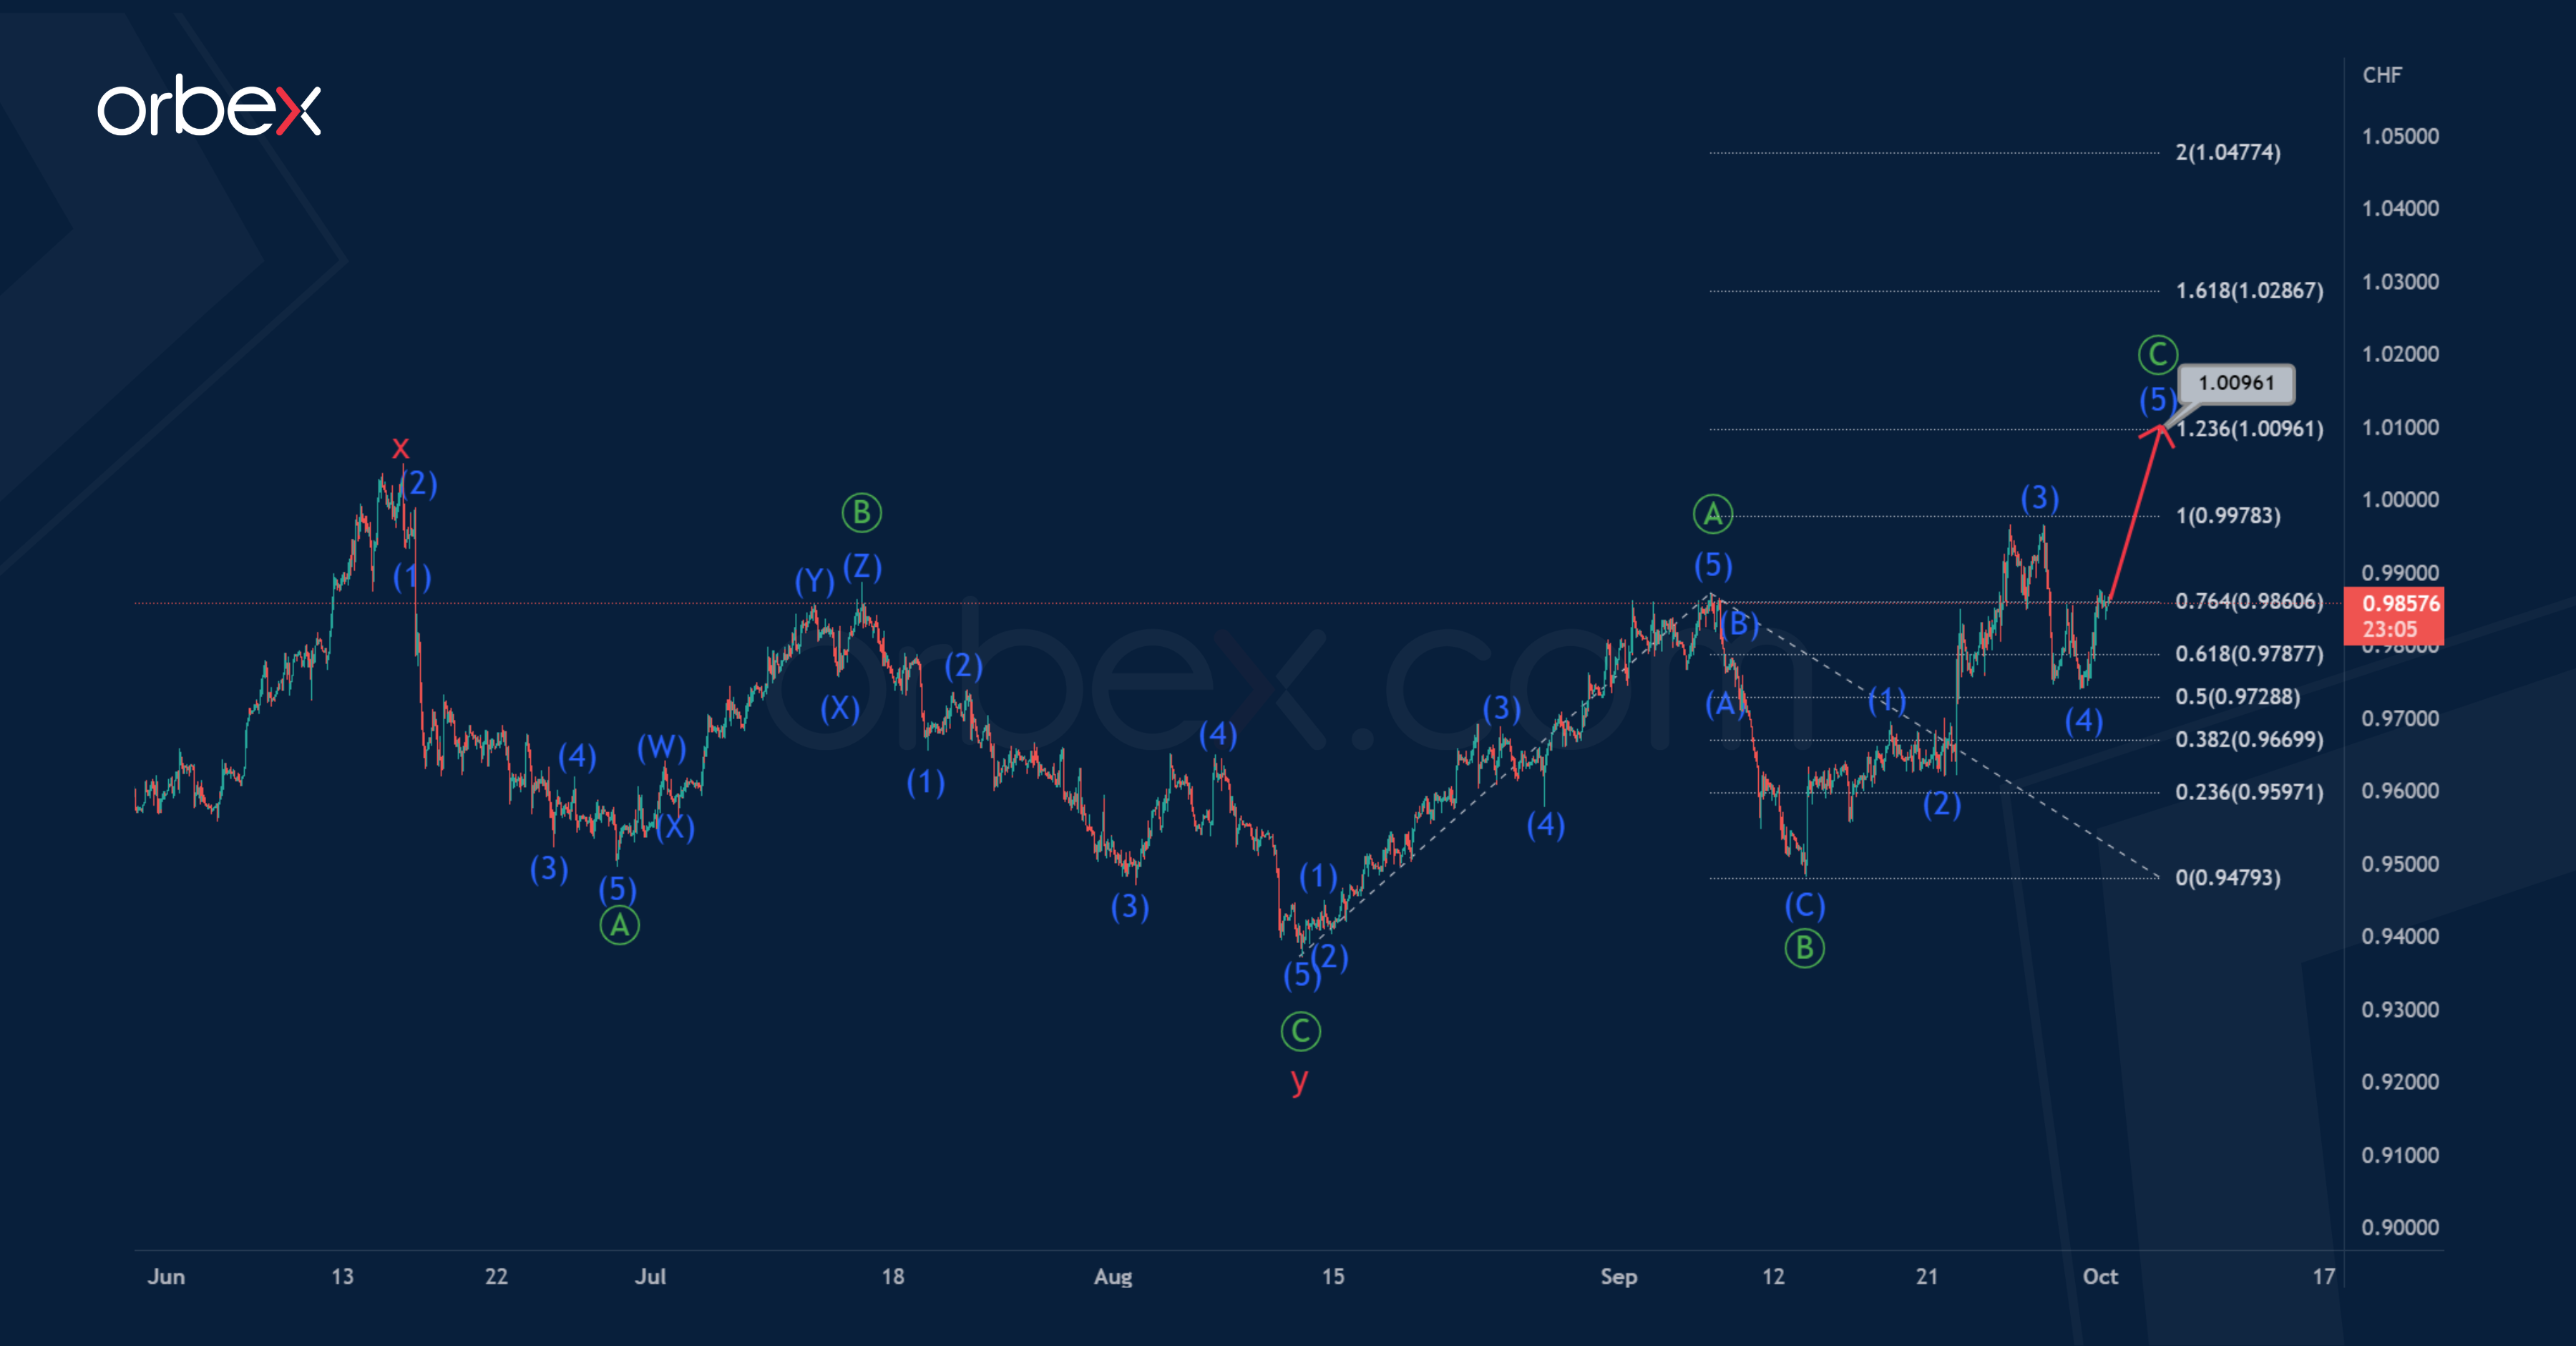
At that level, wave Ⓒ will be at 123.6% of first impulse Ⓐ.
Alternatively, the cycle pattern may take a more complex form, that is, a triple zigzag w-x-y-x-z.
Thus, if this option is confirmed, we will see a decrease in the price and the construction of the final sub-wave z.
It is possible that wave z will tend to equality with the previous actionary wave y, and therefore its end is possible near 0.928.
An approximate scheme of possible future movement is shown on the chart.
EURUSD Holds Bullish Bias in Very Short-Term
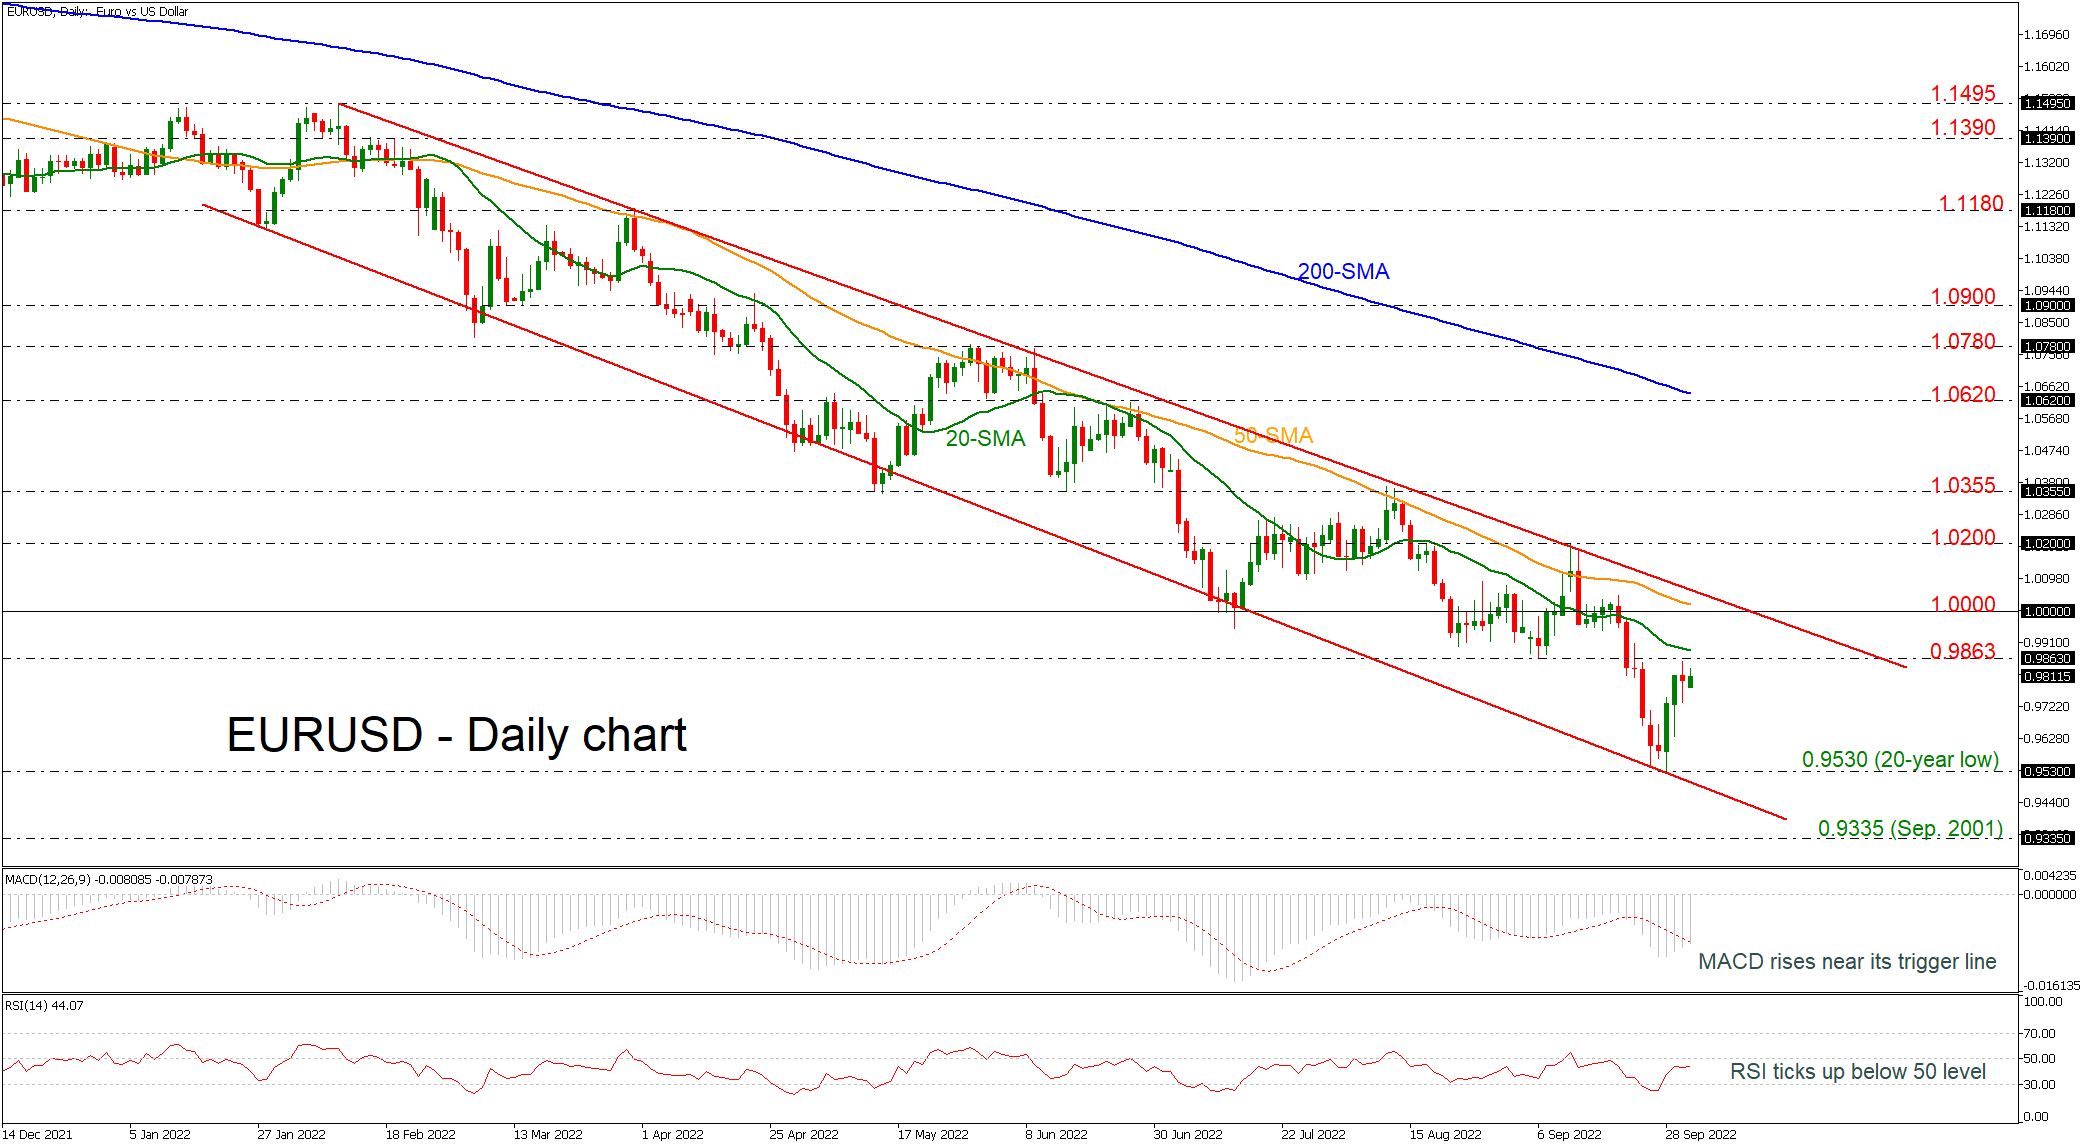
EURUSD posted almost 4% of gains after the bounce off the 20-year low of 0.9530 in the preceding week, remaining within the long-term downward sloping channel.
Technically, the RSI indicator is pointing upwards in the bearish region, while the MACD is trying to strengthen its bullish bias in the negative area, suggesting that the next near-term movements could be to the upside.
Currently, the price is approaching the 20-day simple moving average (SMA), which is standing slightly above the 0.9863 resistance, while more gains could open the way for the parity level and the 50-day SMA at 1.0020. Running higher, a break of the descending channel could add some optimism for bullish actions until the 1.0200 barrier.
In the negative scenario, a drop off again could hit the latest trough of 0.9530 before challenging the September 2001 inside swing high of 0.9335. Beneath these obstacles, the next marks to have in mind are the psychological levels such as 0.9300, 0.9200 and 0.9100.
Summarizing, EURUSD has been in a bullish movement in the very short-term; however, the bigger picture remains strongly bearish.
DAX 40 Lacks Support
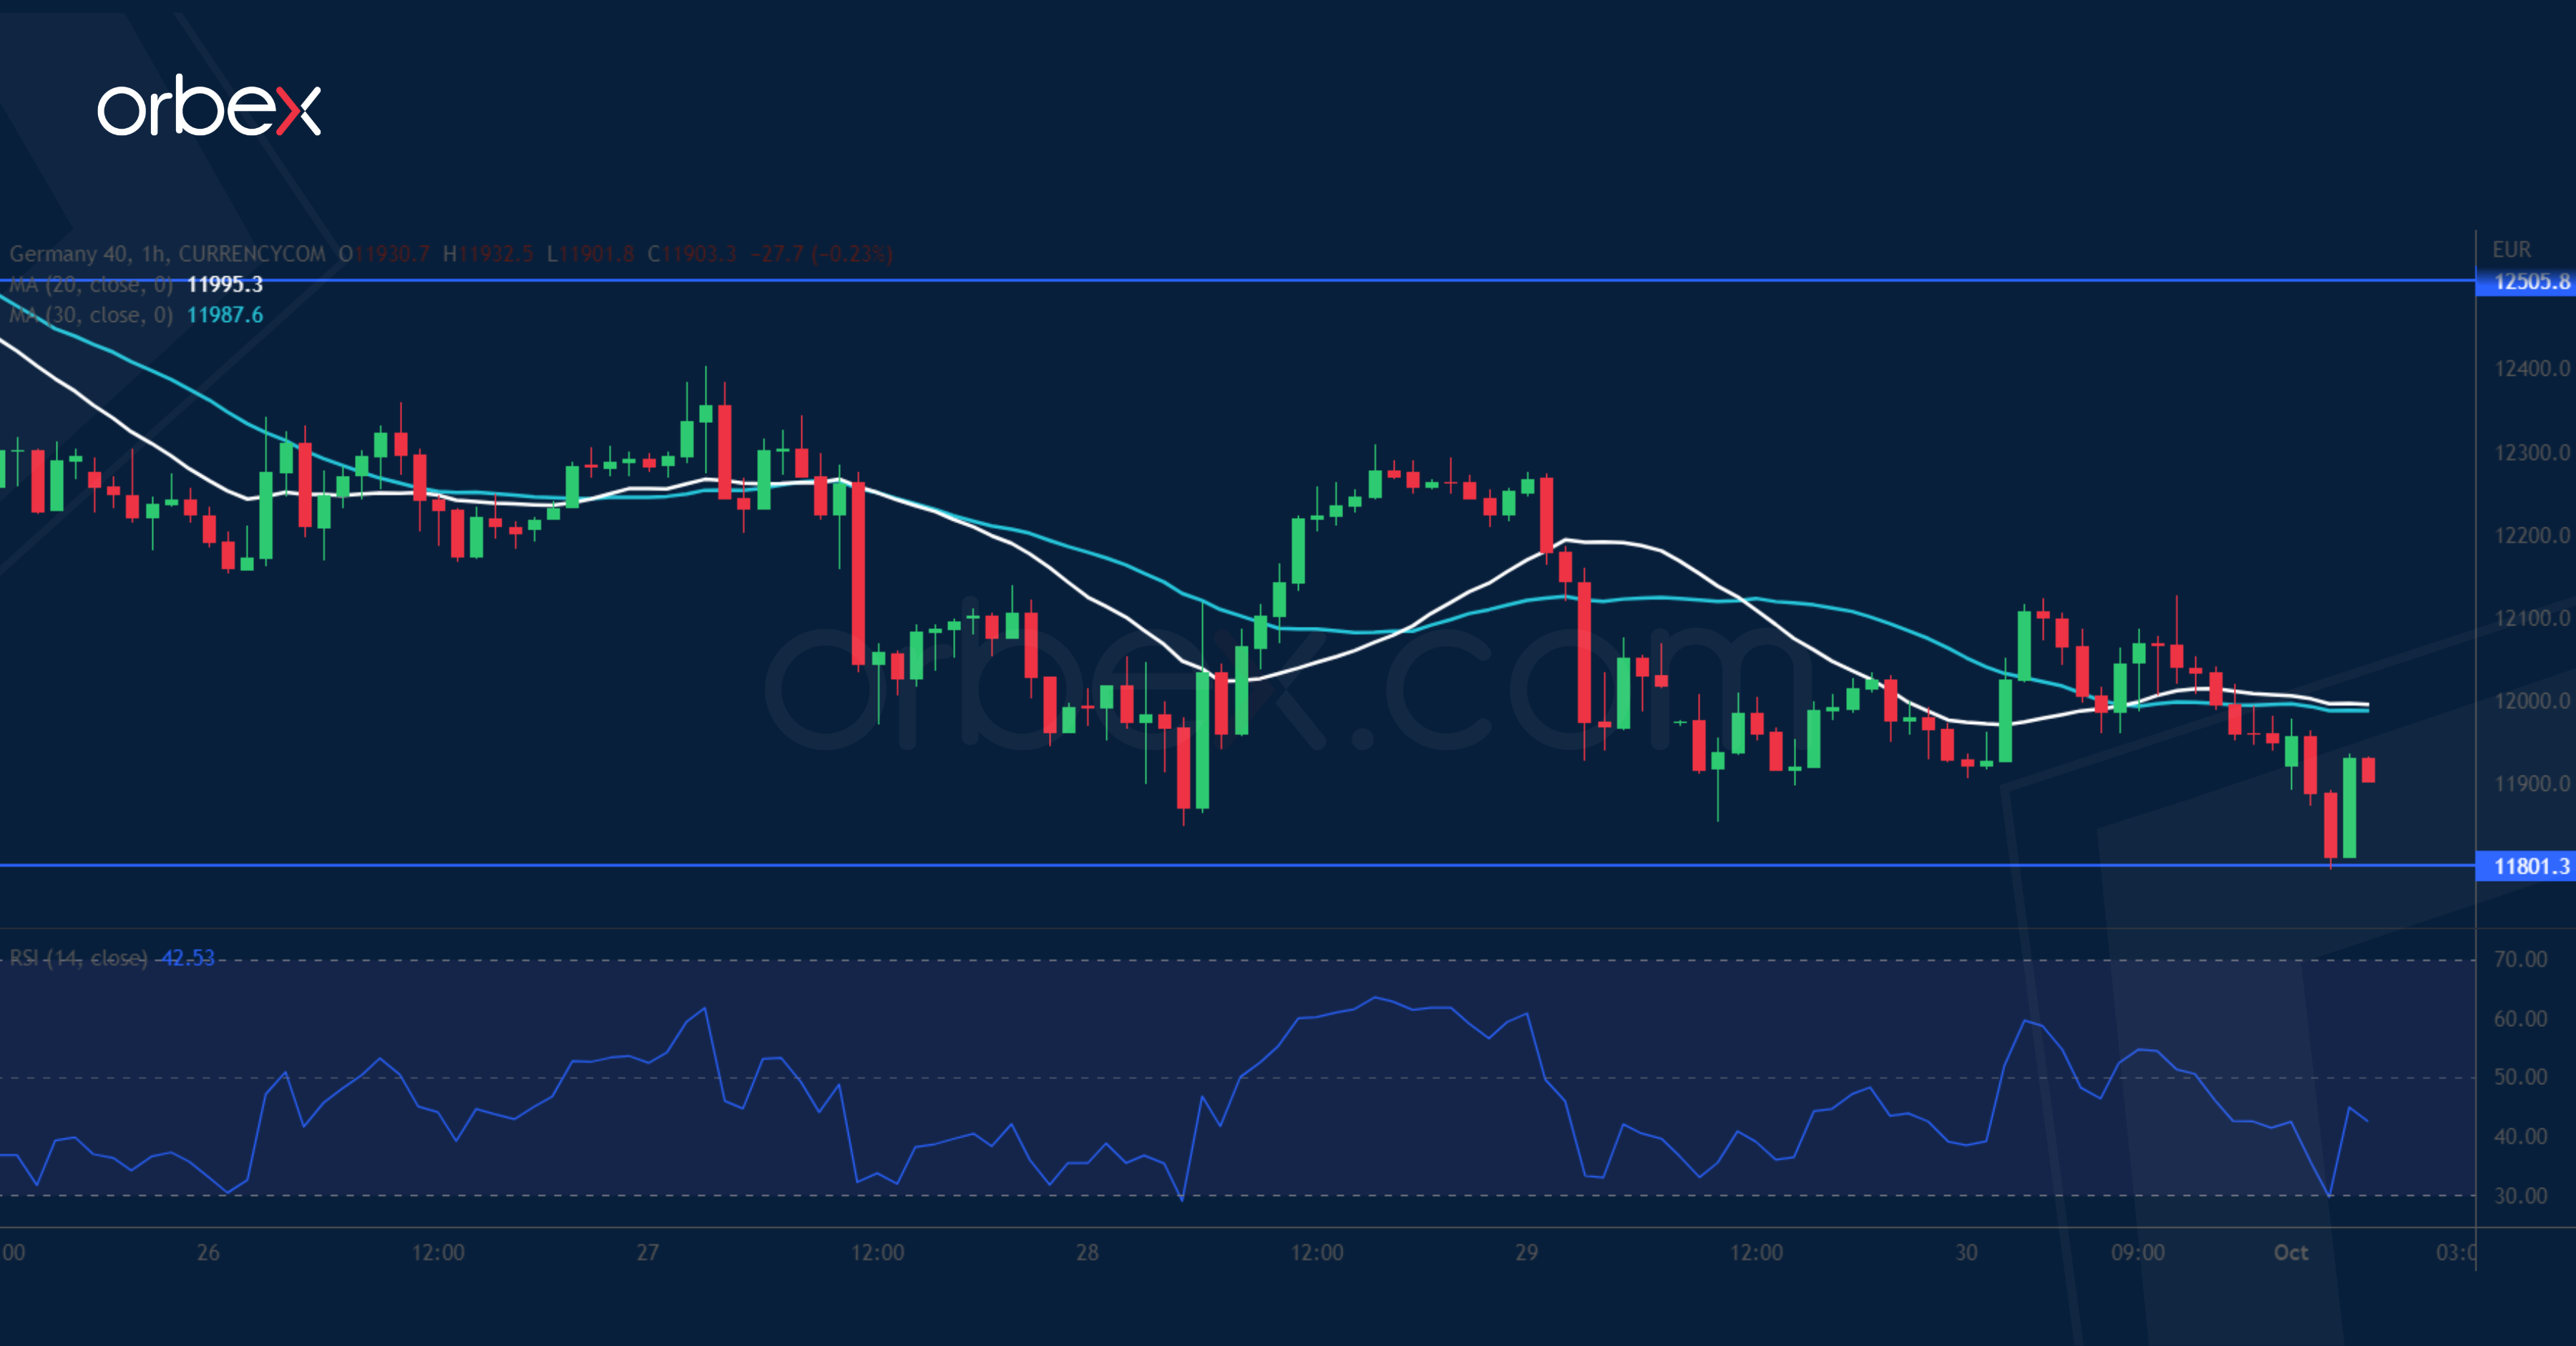
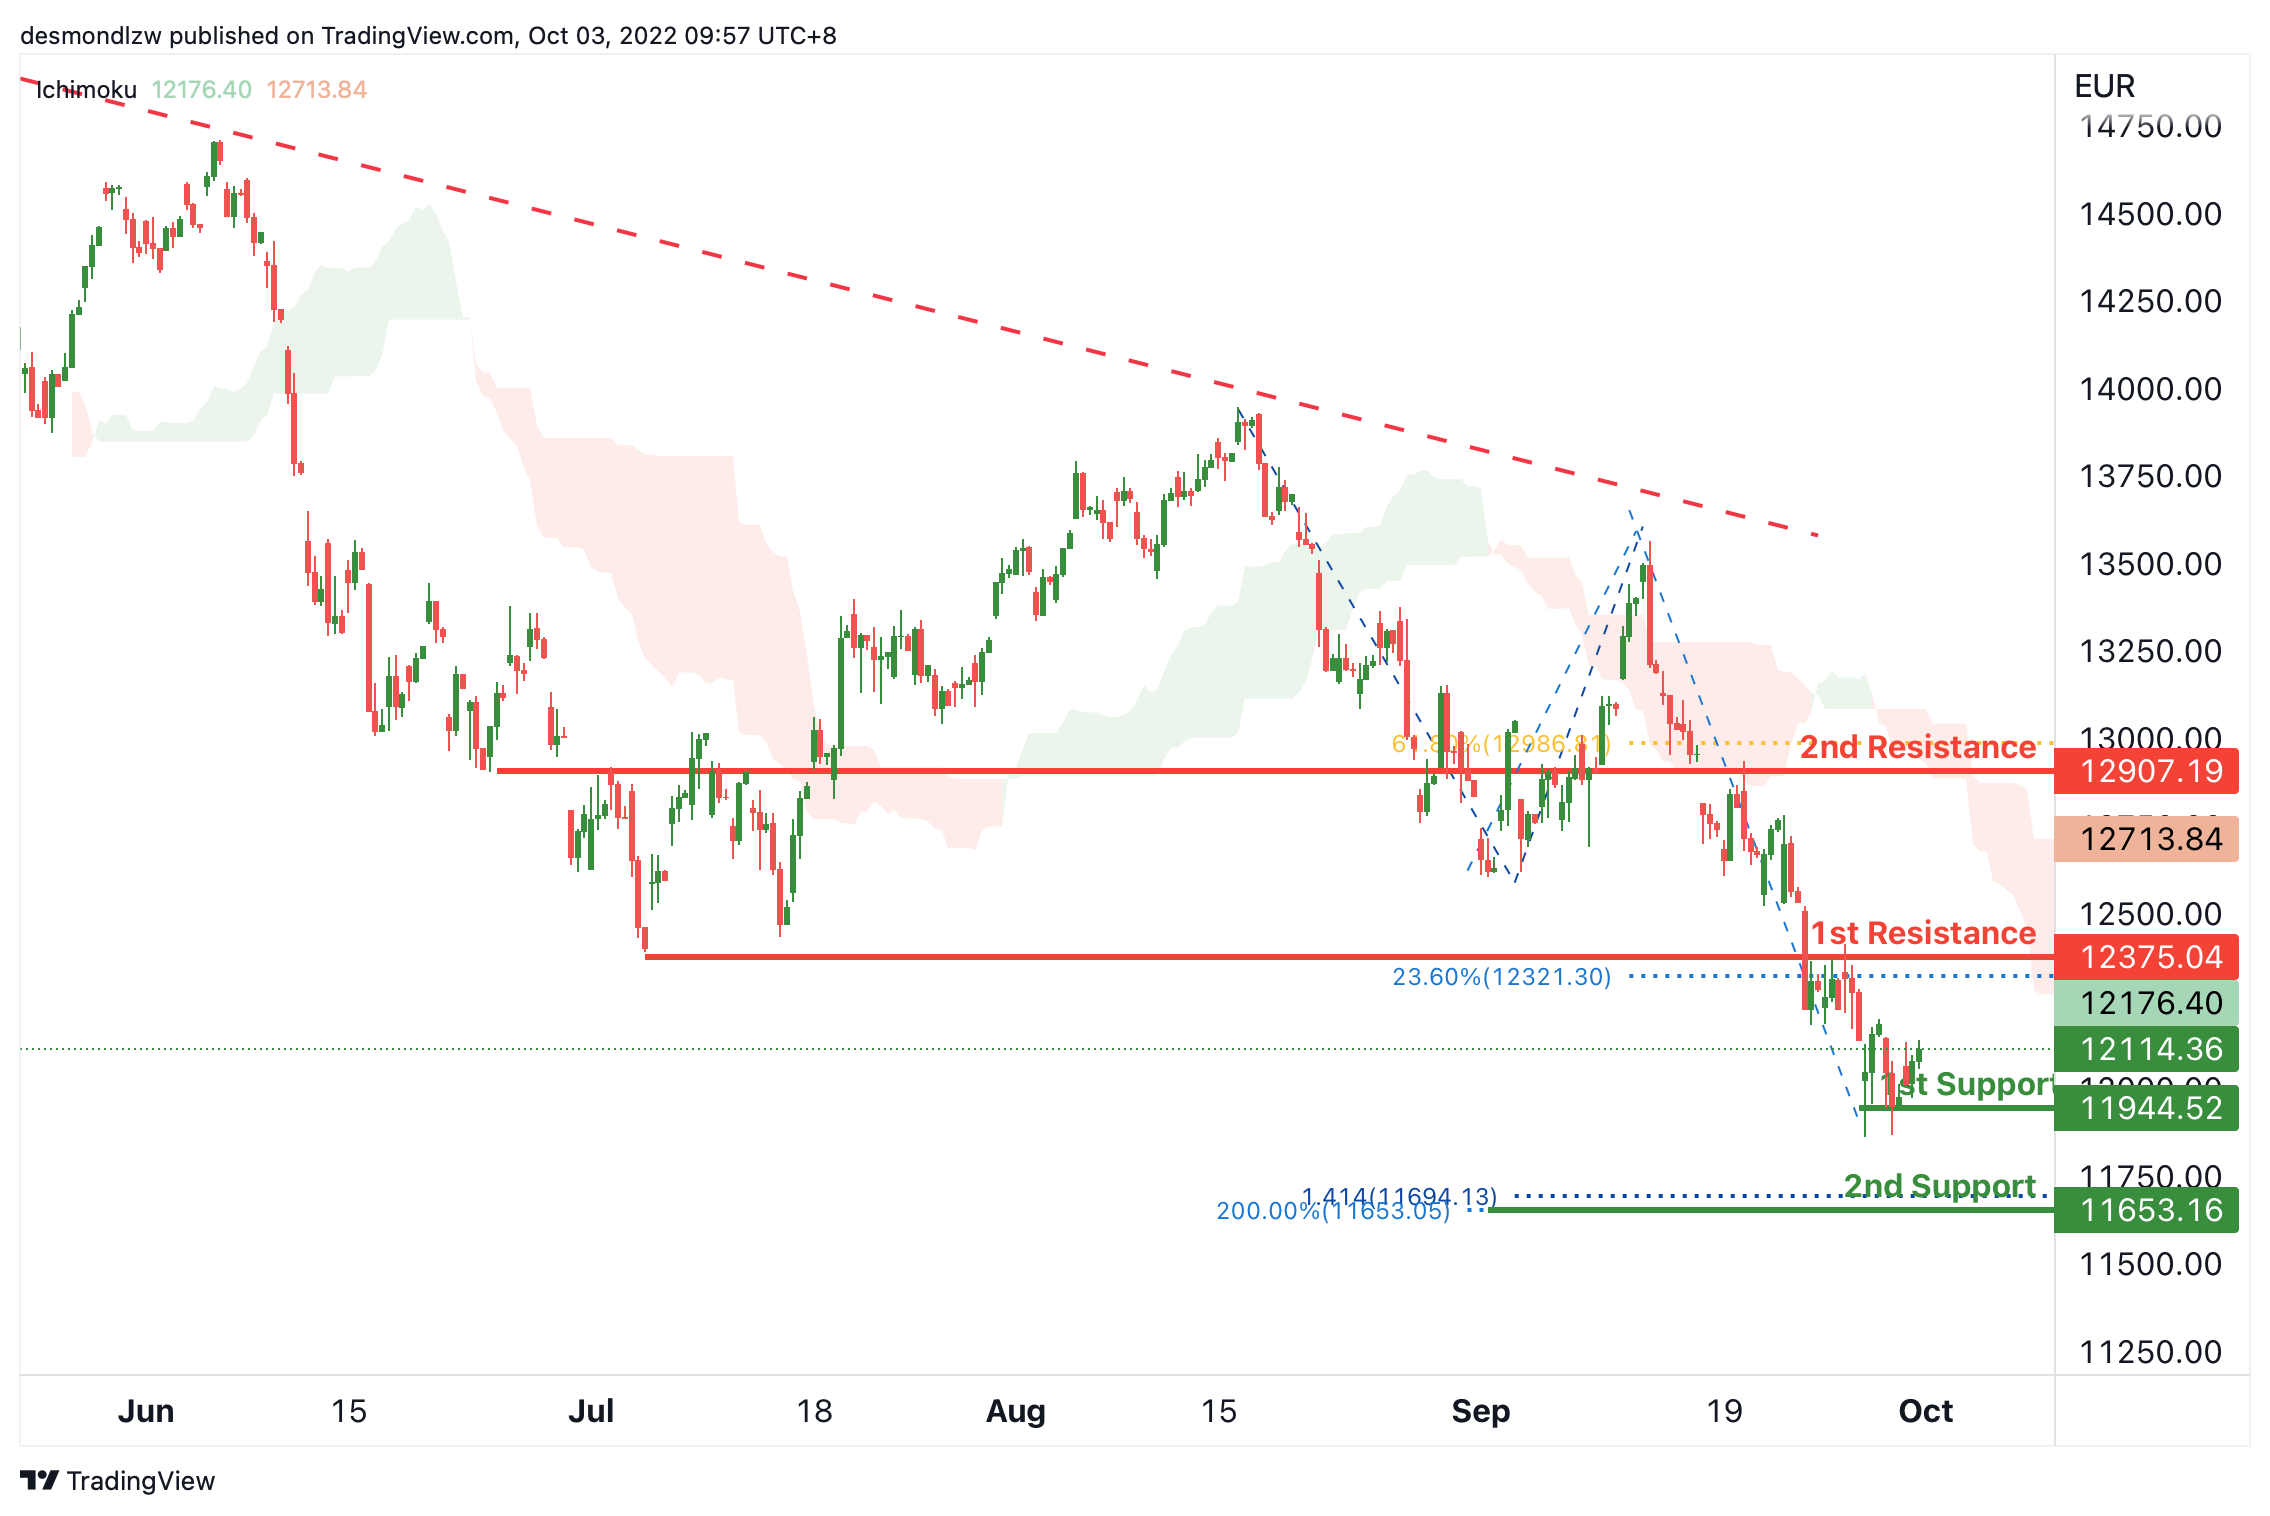
The Dax 40 slides over the prospect of a 75 basis point hike from the ECB. A combination of a break below the critical support at 12450 and a bearish MA cross on the daily chart indicates that sentiment has shifted back to the downside, making the bear market official. Sellers may see any rebound as an opportunity to stake in. The demand-turned-supply area around 12500 could keep the buying in check. 11800 might be a temporary support and its breach would trigger a new round of sell-off to October 2020’s low at 11400.
GBP/USD Tests Resistance
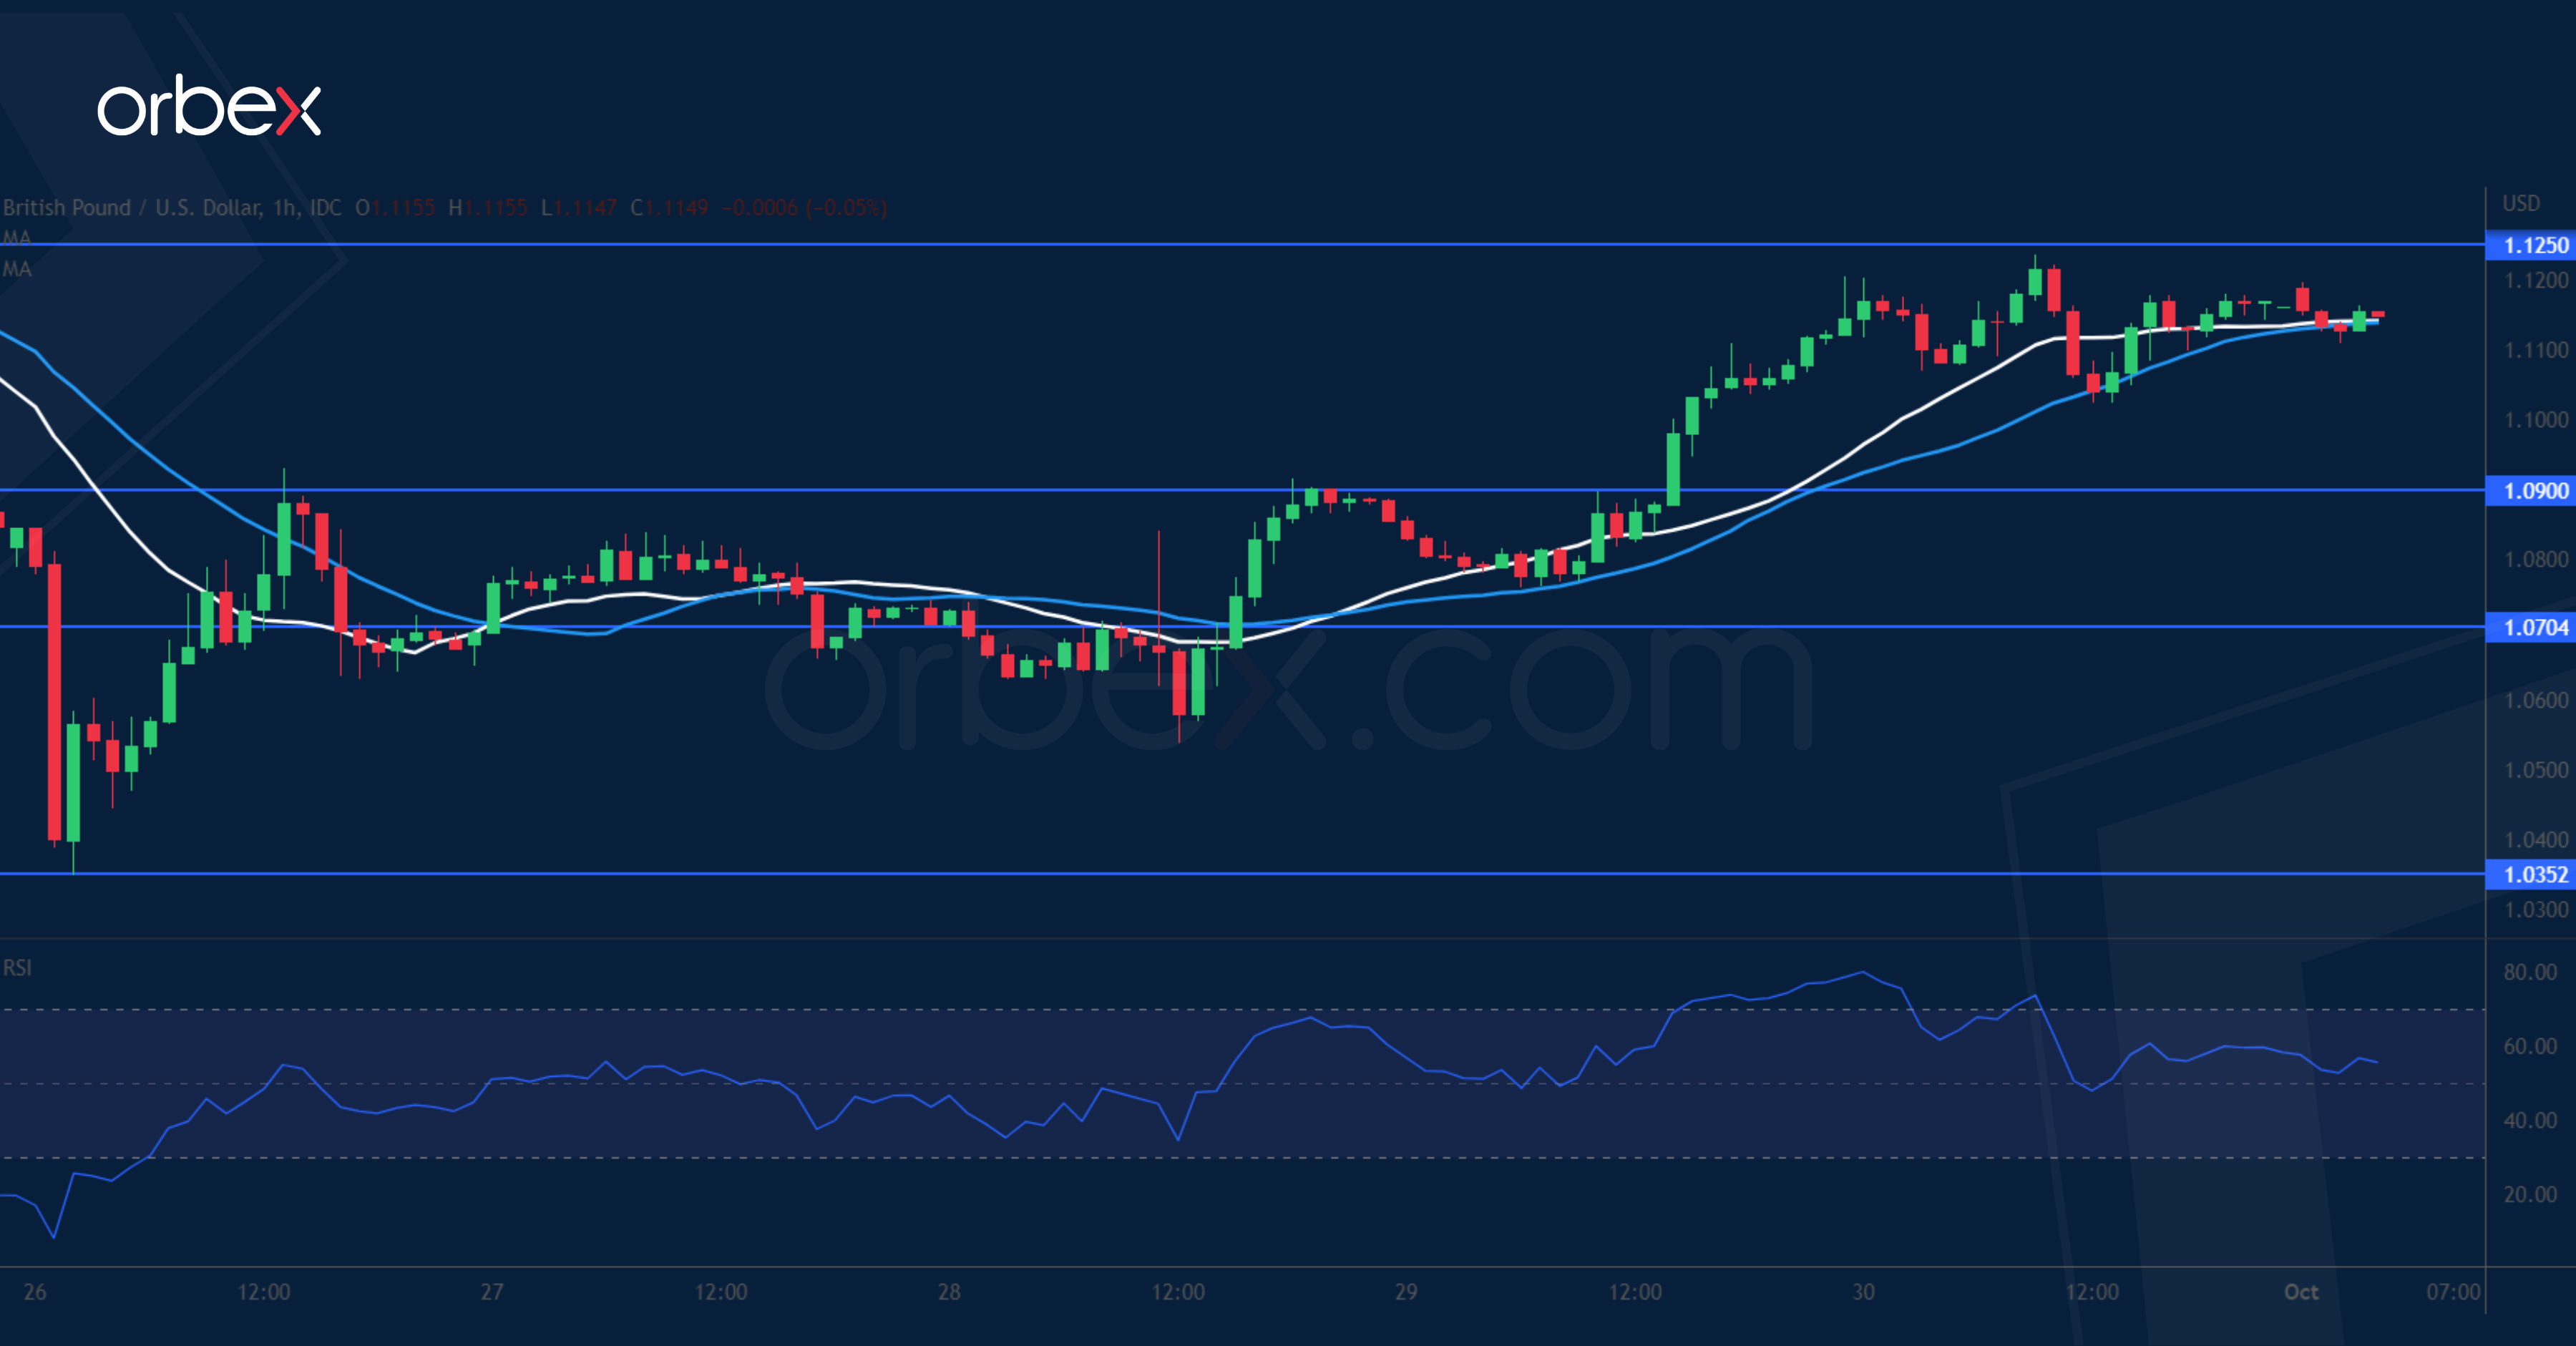
The pound bounced back thanks to emergency BoE bond buying. The price is now at a crossroads after it recouped all the losses from the previous liquidation. Selling pressure could be expected around 1.1250 over the 20-day moving average as sentiment remains downbeat in the medium-term. However, its breach could give Sterling some breathing room and turn things around in the coming days. As the RSI returns to the neutral area, the demand zone between 1.0700 and 1.0900 is key in assessing buyers’ commitment.
EUR/USD Attempts to Bounce
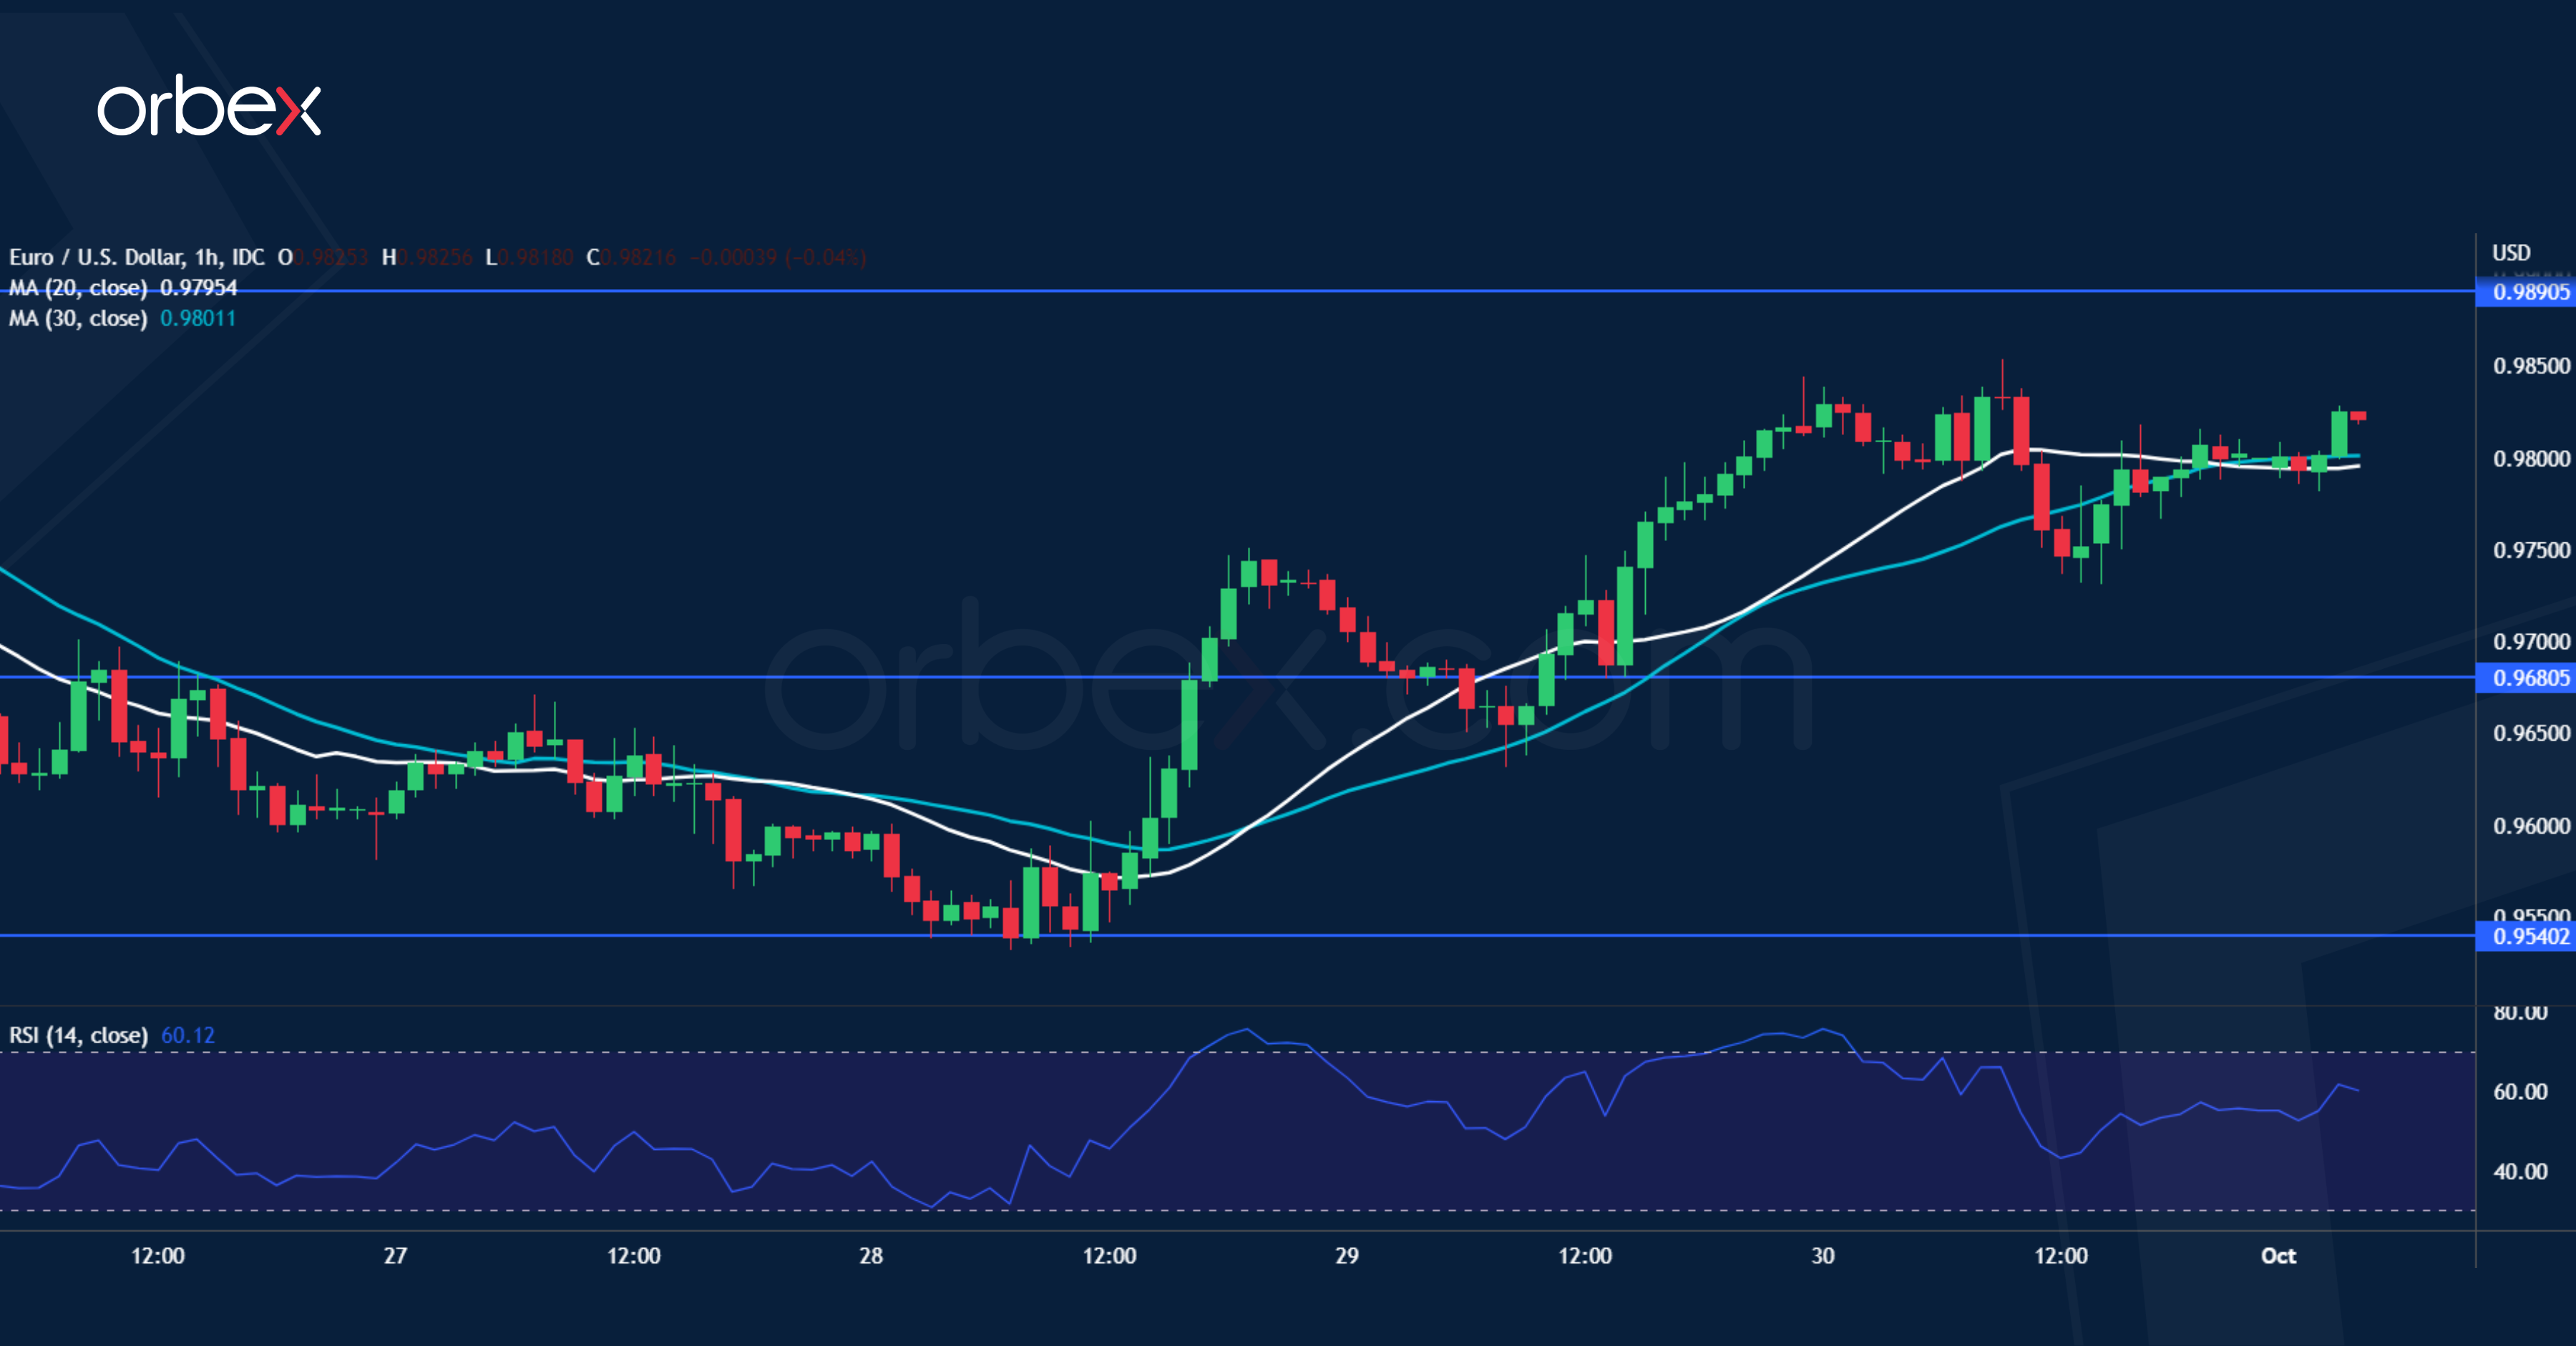
The euro recovers as record high inflation in September cements expectations for another large ECB rate hike. An oversold RSI on the daily chart attracted some buying interest, but this could turn out to be a mean reversion trade rather than a sustained recovery. 0.9890 on the 20-day moving average is a resistance and trend followers could be expected to jump in to fade the bounce. In case of a bullish breakout, the single currency may flirt again with parity. Otherwise, 0.9680 is a fresh support should the pair start to drift lower.
Daily Technical Analysis
EUR/USD
At the end of last week, the bulls failed to consolidate the resistance breach at 0.9821, and at the time of writing, they are again moving slightly below this level and seem to be just waiting for an opportune moment to attempt another breakout. If they manage to consolidate their breach this time around, then an opportunity to breach the next resistance at 0.9877 could be created. If the bears manage to prevail instead, then we could witness an attempt to breach the nearest support at 0.9738. At 14:00 GMT today, traders will turn their attention towards the news on the business activity index in the manufacturing sector, which could cause high volatility.
USD/JPY
The Ninja’s trend from the end of last month has carried over into the beginning of October as well. The levels at which the Japanese yen has consolidated is the range of 143.76 – 144.85. At the time of writing, the bulls are moving closer towards the upper limit of the trend. In the event of a breach, we could witness an attempt to reach the next resistance at 145.88. The lack of news from the land of the rising sun can be taken as a sign that the currency pair will continue to move within the aforementioned limits.
GBP/USD
On sterling territory, the bulls managed to consolidate their breach of the resistance at 1.1106, which also marked last week’s peak performance. If they manage to take advantage of the accumulated momentum, then we could witness an attempt to breach the next resistance at 1.1216. On the other hand, if the bears manage to increase the selling pressure, then this could lead to an attempt to reach the support at 1.0887.
EUGERMANY40
The bears started today's trading session in the German index with an aggressive attack. At the time of writing, they are headed for the support at 11858. If they manage to break through and confirm the breach, then we will likely see an attempt to reach the next support at 11700. If the bulls manage to instead "show their horns", then a possible breach attempt of the psychological resistance at 12000 could become a likely scenario.
US30
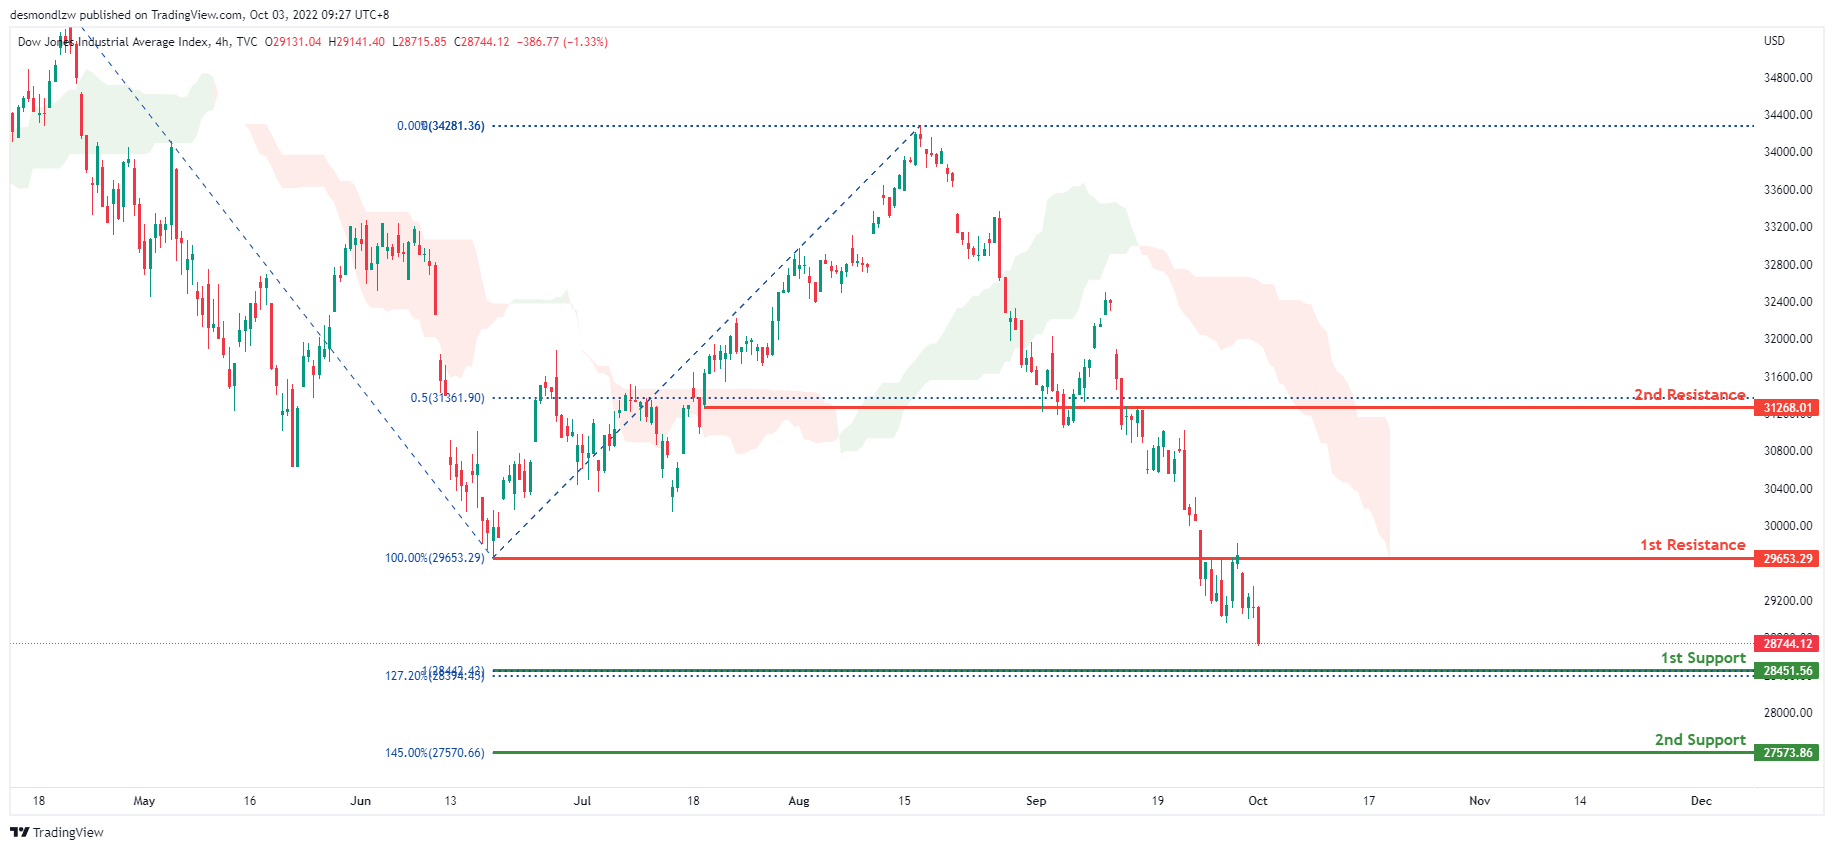
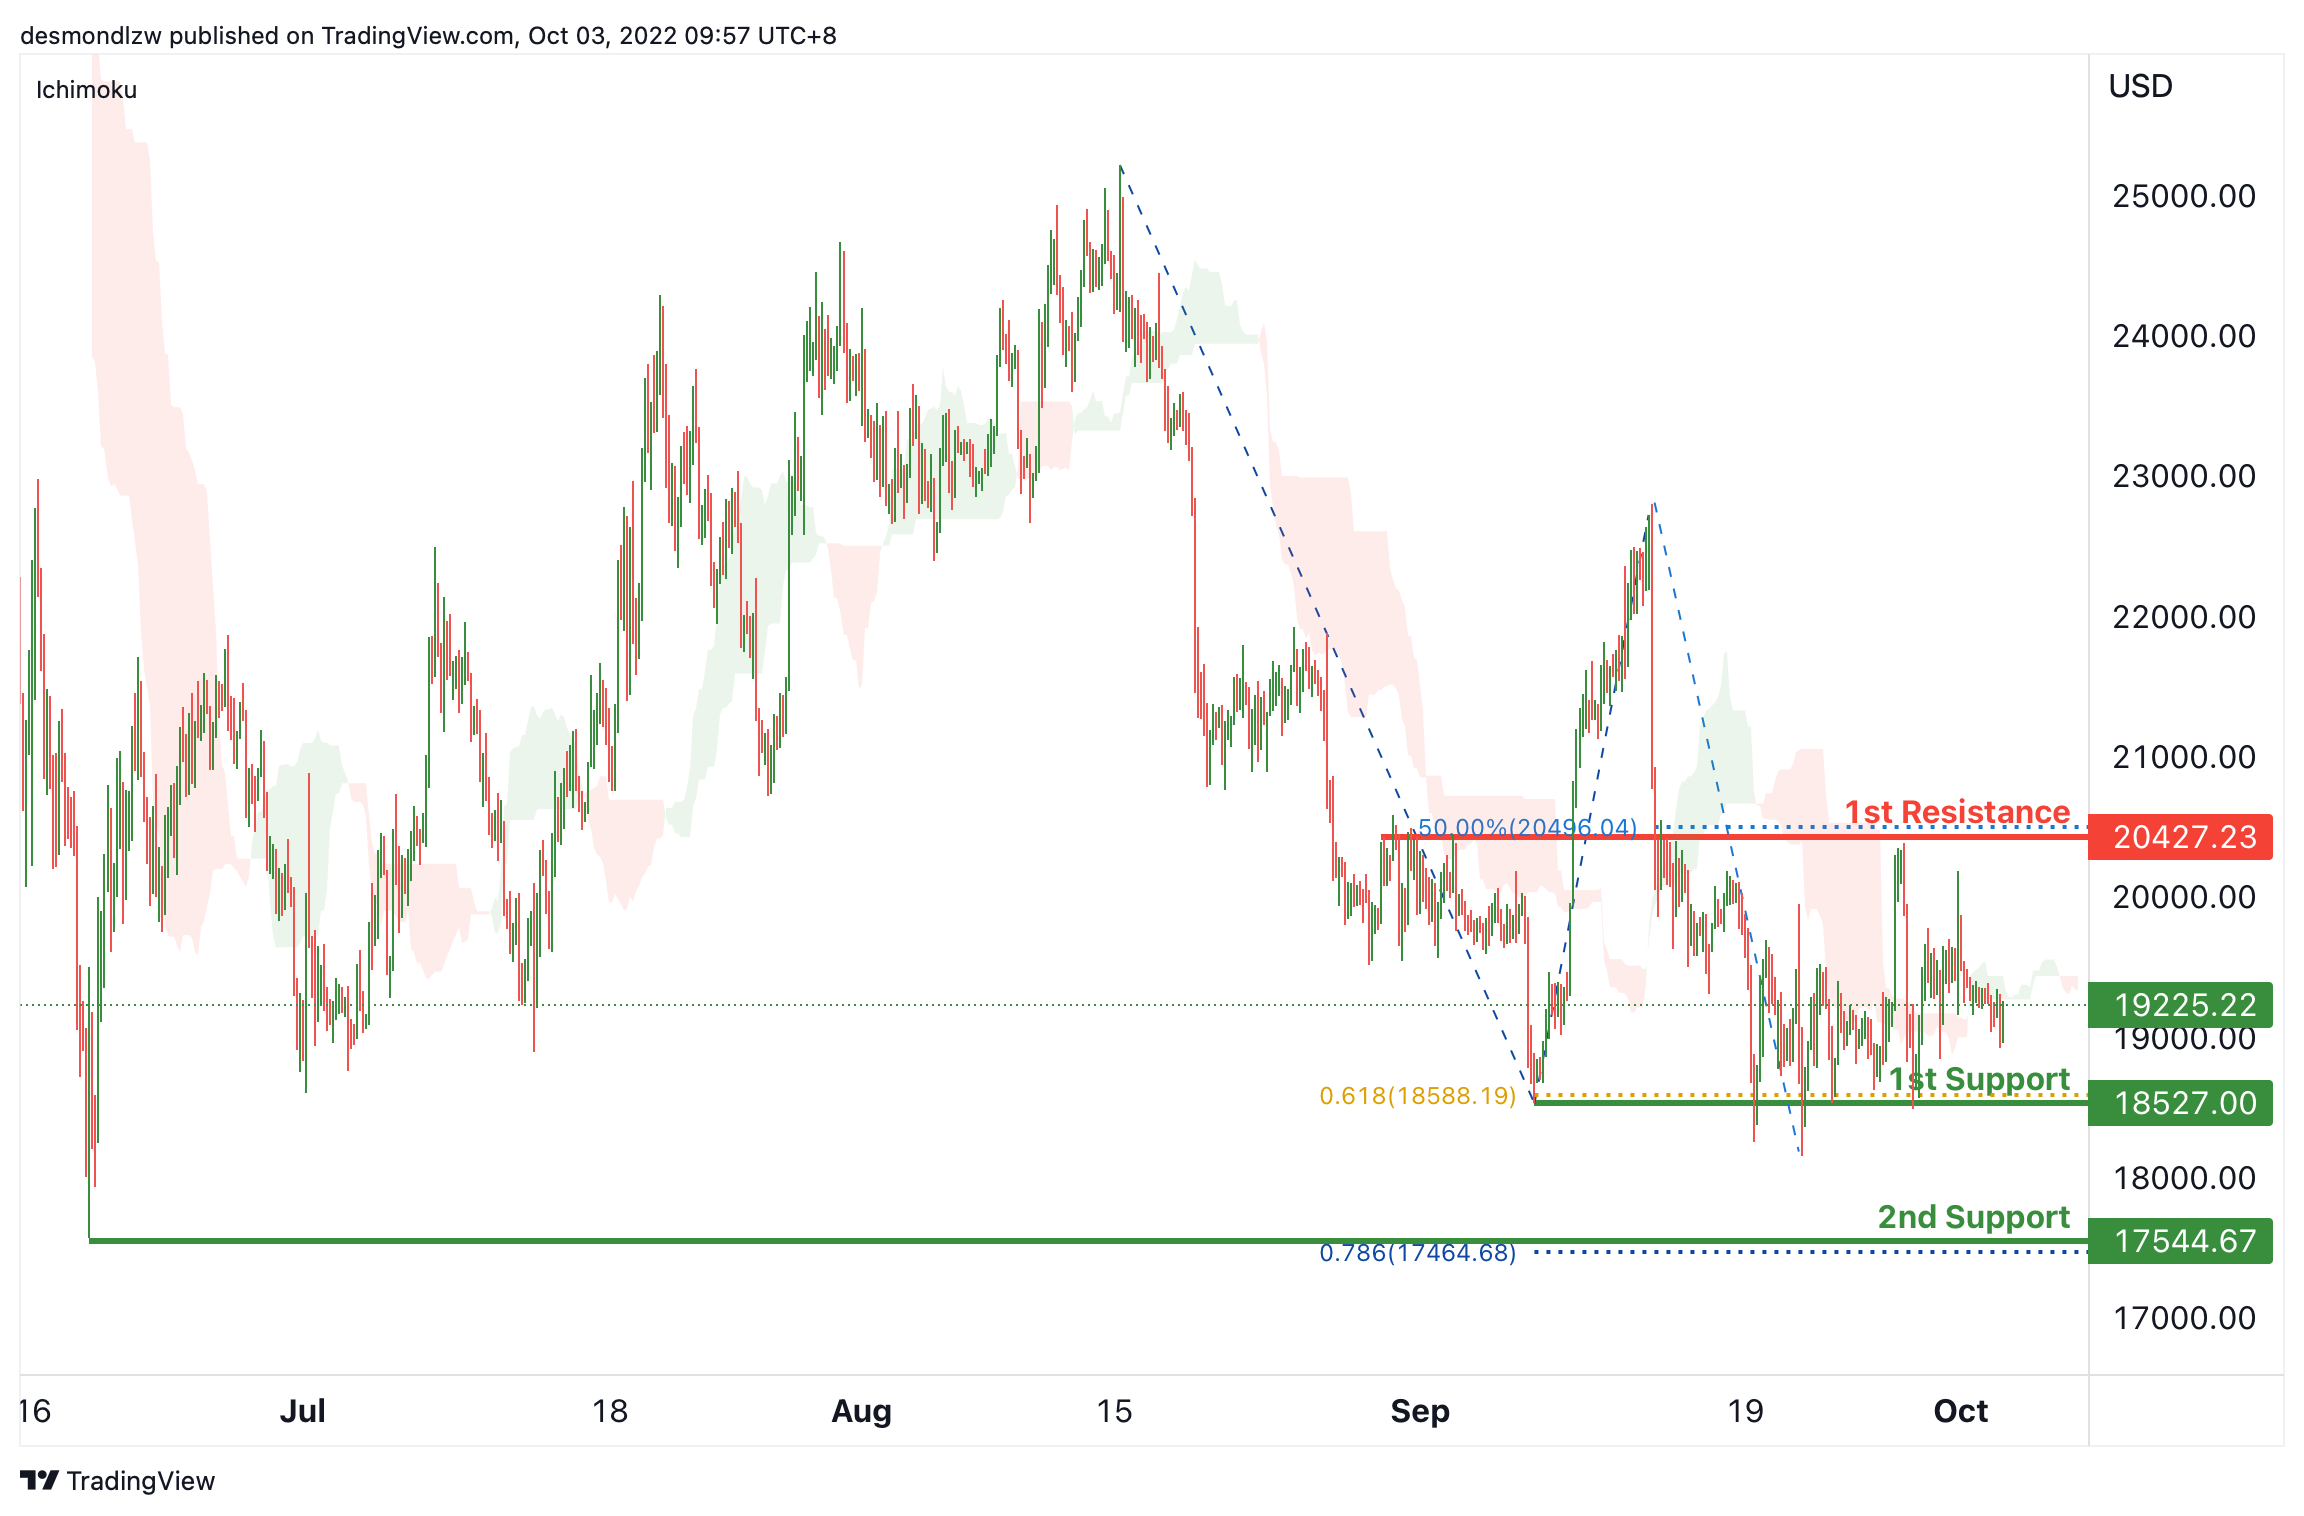
For the bulls, the situation with the blue-chip index is not all roses, either. Bullish investors continue to lose ground quickly. The momentum of the bears could lead them to try to breach the support at 28300. If the breach is confirmed, we could even see the US30 trading below 28000. For reference, it has not been seen below this level ever since late October 2020. Today, investors will be closely monitoring the ISM manufacturing data for the U.S., which is due to be released at 14:00 GMT.
Tankan Survey of BoJ Showed a Rather Unconvincing Picture
Markets
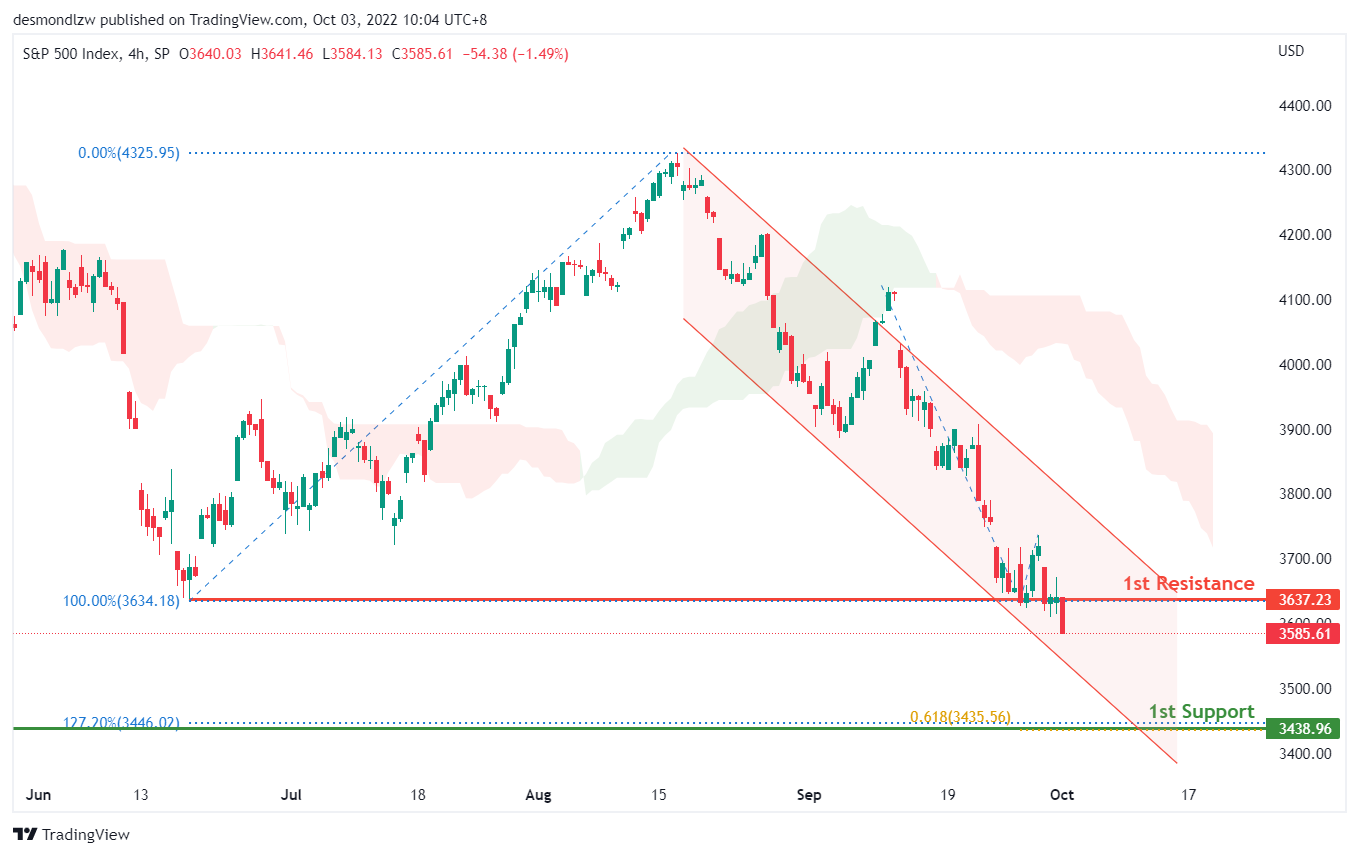
We had important inflation figures due on Friday. The price surge hit double digits in Europe while the Fed’s preferred gauge in the US (PCE (core) deflator) topped expectations too. But with the third quarter drawing to a close, core bond markets were in for some temporary relief after the recent aggressive repositioning. Yields in Germany eased between 4.5 (2y) and 7.3 bps (10y). UK Gilt yields, last week’s focal point, tanked 14-16.4 bps at the wings. American rates were the exception however, more than completely reversing declines to the tune of 10 bps across the curve thanks to a sharp rise in the final trading hours. Daily changes amounted eventually from +5.3 bps (30y) to +8.5 bps (2y) in a flattener. This late yield outburst also affected stock markets in the US. It pushed the S&P500 (-1.5%), which was already having a difficult day, over the edge. At 3585 a new YtD low was set. The USD was still strong but investors at the same time unwound some very popular short bets on JPY, EUR and GBP. EUR/USD closed only marginally lower at 0.98. GBP/USD grinding higher to 1.117. EUR/GBP erased almost all of the gains that followed UK Chancellor Kwarteng’s fiscal overhaul announcement two weeks ago. The pair dipped below 0.88.
Chinese markets this week are closed for Golden Week. It makes the Asian session a rather dull one this morning. You’ll find the two most important events in the headline section below. Commodity currencies (AUD, NZD, CAD) benefit this morning from the OPEC rumours. The euro and the yen aren’t in great shape but lucky for them, the USD isn’t either. Sterling pares losses following a report that the UK may reverse the planned scrapping of the top tax rate. Core bonds either extend their recovery (Bund) or make another attempt (Treasuries) to do so. Stocks enter the final quarter on weak footing with losses up to 1.8% (Hong Kong). European futures at the open fell 2.4% (in thin liquidity) but in the meantime pared losses to 1.4%.
Today’s economic calendar contains the US manufacturing ISM (expected to ease from 52.8 to 52.1). Other important economic input follows on Wednesday (ADP job report, non-manufacturing ISM) and Friday (September payrolls). For the time being, we stick to our view of temporary consolidation on core bond markets and the US dollar. For the US10y and European 10y swap/German 10y yield, downside support kicks in around 3.5% and 2.72%/1.93% (June highs). The first reference in the trade-weighted dollar (DXY) is situated around 110.8, followed by 109.29.
News Headlines
According to sources, OPEC+ at its meeting in Vienna on Wednesday is considering an output reduction of 1 mln barrels per day (or more). After touching a peak in the wake of the Russian invasion in Ukraine, oil prices have dropped sharply from levels of >$120 p/b for Brent to currently near $87 p/b as investor fears for a global recession easing demand, higher yields and a strong dollar put prices under pressure. A cut of 1 mln barrels p/d would be the biggest reduction since the start of the pandemic in 2020. If so, the move could raise tensions between the US and Saudi Arabia as the US and other consumers asked the country raise production to give breathing space to the global economy and as lower prices would reduce Russia’s oil revenues.
The quarterly Tankan Survey of the Bank of Japan showed a rather unconvincing picture. The manufacturing index for large companies unexpectedly dropped from 9 to 8. The outlook amongst large manufacturers also declined to 9 from 10. The assessment of large non-manufacturers increased slightly from 13 to 14 but the outlook also deteriorated. On the other hand, the Japanese industry expects capex to rise more than expected at 21.3% in the fiscal year 2022. Large manufacturers also indicated to take into account an average rate of USD/JPY of 122.73 for this fiscal year. This much stronger than current rate near 145. With respect to currency weakness, Japanese Finance Minister Suzuki this morning again warned Japan stands ready to take decisive action to prevent excessive moves in the FX markets.
EUR/USD Daily Outlook
Daily Pivots: (S1) 0.9740; (P) 0.9797; (R1) 0.9859; More...
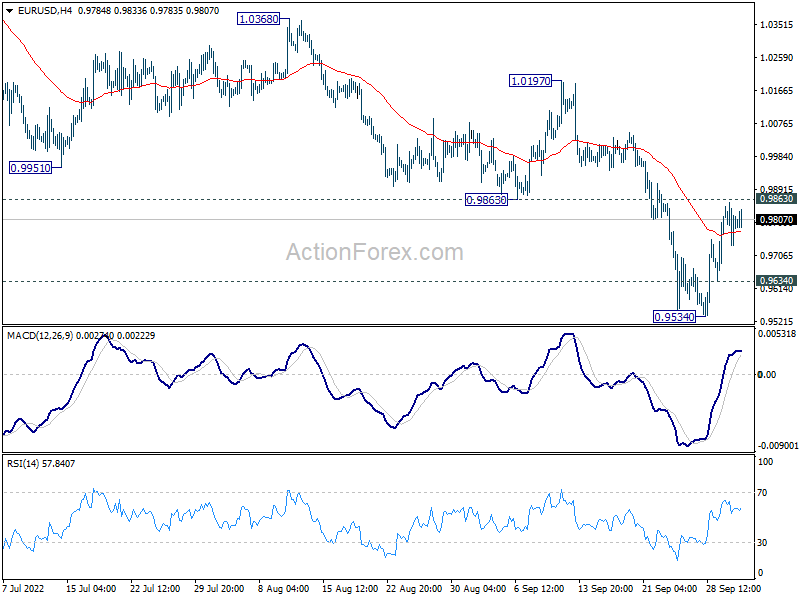
Intraday bias in EUR/USD stays neutral at this point. Break of 0.9634 minor support will suggest that larger down trend is ready to resume. Intraday bias will be back on the downside for 0.9534 and below. However, sustained break of 0.9863 will confirm short term bottoming, and bring stronger rally back to 1.0197 resistance instead.
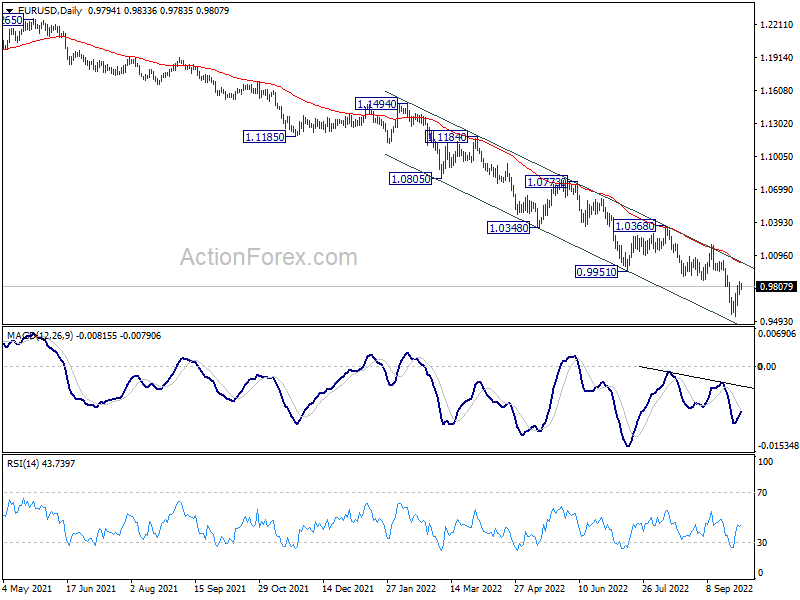
In the bigger picture, down trend from 1.6039 (2008 high) is still in progress. Next target is 100% projection of 1.3993 to 1.0339 from 1.2348 at 0.8694. In any case, break of 1.0197 resistance is needed to be the first sign of medium term bottoming. Otherwise, outlook will stay bearish even with strong rebound.
USD/JPY Daily Outlook
Daily Pivots: (S1) 144.36; (P) 144.59; (R1) 144.96; More...
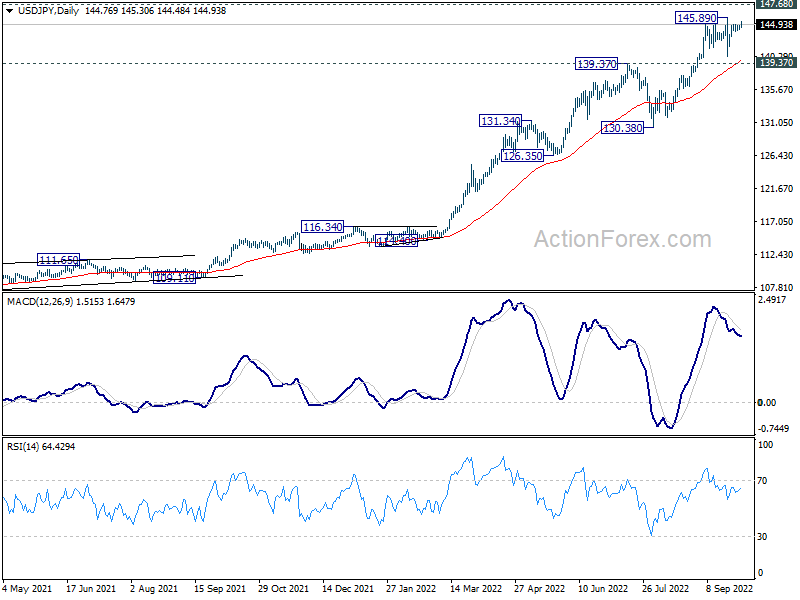
Intraday bias in USD/JPY remains neutral as consolidation from 145.89 is extending. Further rally is expected as long as 139.37 resistance turned support holds. Break of 145.89 will target 147.68 long term resistance. On the downside, however, decisive break of 139.37 will confirm short term topping. Deeper decline would be seen back towards 130.38 support.
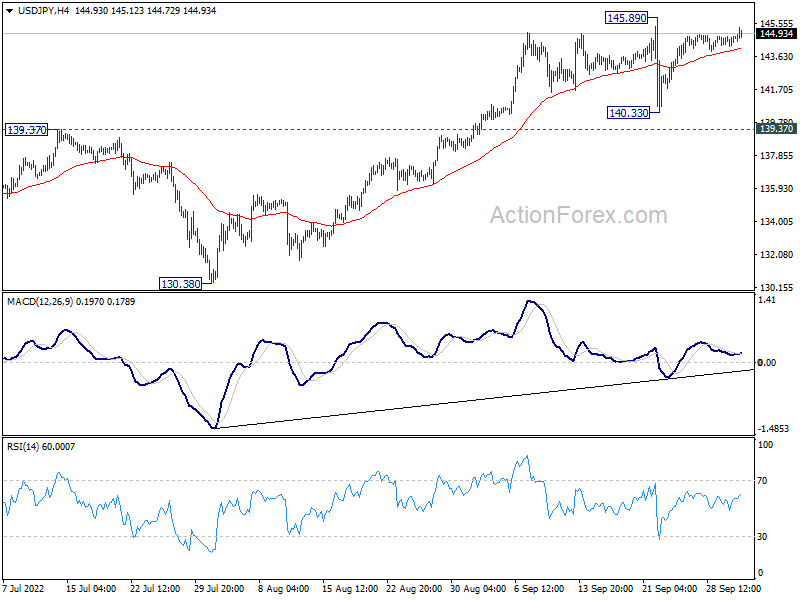
In the bigger picture, up trend from 101.18 is still in progress, as part of the whole up trend from 75.56 (2011 low). Further rise should be seen to 147.68 (1998 high). For now, break of 130.38 support is needed to be the first indication of medium term topping. Otherwise, outlook will stay bullish even in case of deep pull back.