

Sample Category Title
GBP/USD Recovers Above 1.1200, 1.1400 Presents Resistance
Key Highlights
- GBP/USD started an upside correction above the 1.1000 level.
- It broke a major bearish trend line at 1.1030 on the 4-hours chart.
- EUR/USD is facing a couple of key hurdles near the 0.9850 level.
- The US ISM Manufacturing PMI declined from 52.8 to 50.9 in Sep 2022.
GBP/USD Technical Analysis
The British Pound traded to a new low at 1.0340 against the US Dollar. GBP/USD formed a base above 1.0350 and started a decent recovery wave.
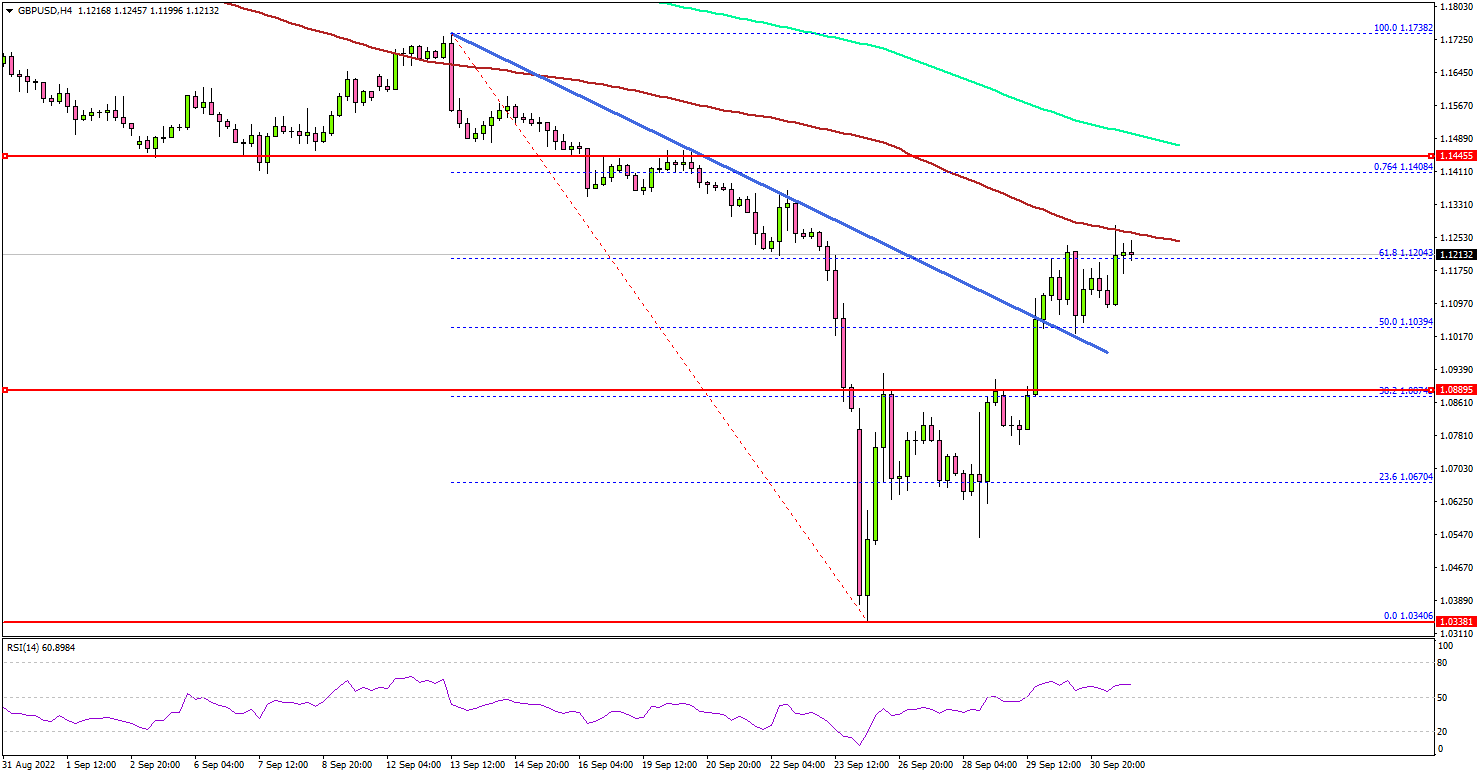
Looking at the 4-hours chart, the pair was able to climb above the 1.0800 and 1.1000 resistance levels. There was a move above the 50% Fib retracement level of the downward move from the 1.1738 swing high to 1.0340 low.
Besides, there was a break above a major bearish trend line at 1.1030 on the same chart. The pair tested the 1.1250 resistance zone and the 100 simple moving average (red, 4-hours).
The 61.8% Fib retracement level of the downward move from the 1.1738 swing high to 1.0340 low acted as a resistance. The first major resistance is near 1.1250 level, above which the pair may perhaps rise towards the 1.1400 resistance.
A clear move above the 0.9900 level might send the pair towards the 1.1500 level or at least the 200 simple moving average (green, 4-hours).
On the downside, an initial support is near the 1.0980 level. The main support sits at the 1.0900 level. A downside break below the 1.0900 zone might send the pair towards the 1.0800 level. The next major support is near the 1.0720 level, below which the pair could even test the 1.0600 support zone.
Looking at EUR/USD, the pair is facing a major resistance near the 0.9850 level and remains at a risk of a fresh decline in the near term.
Economic Releases
- US Factory Orders for August 2022 (MoM) - Forecast +0.3%, versus -1% previous.
Elliott Wave View: AUDUSD Rally to Fail for More Downside
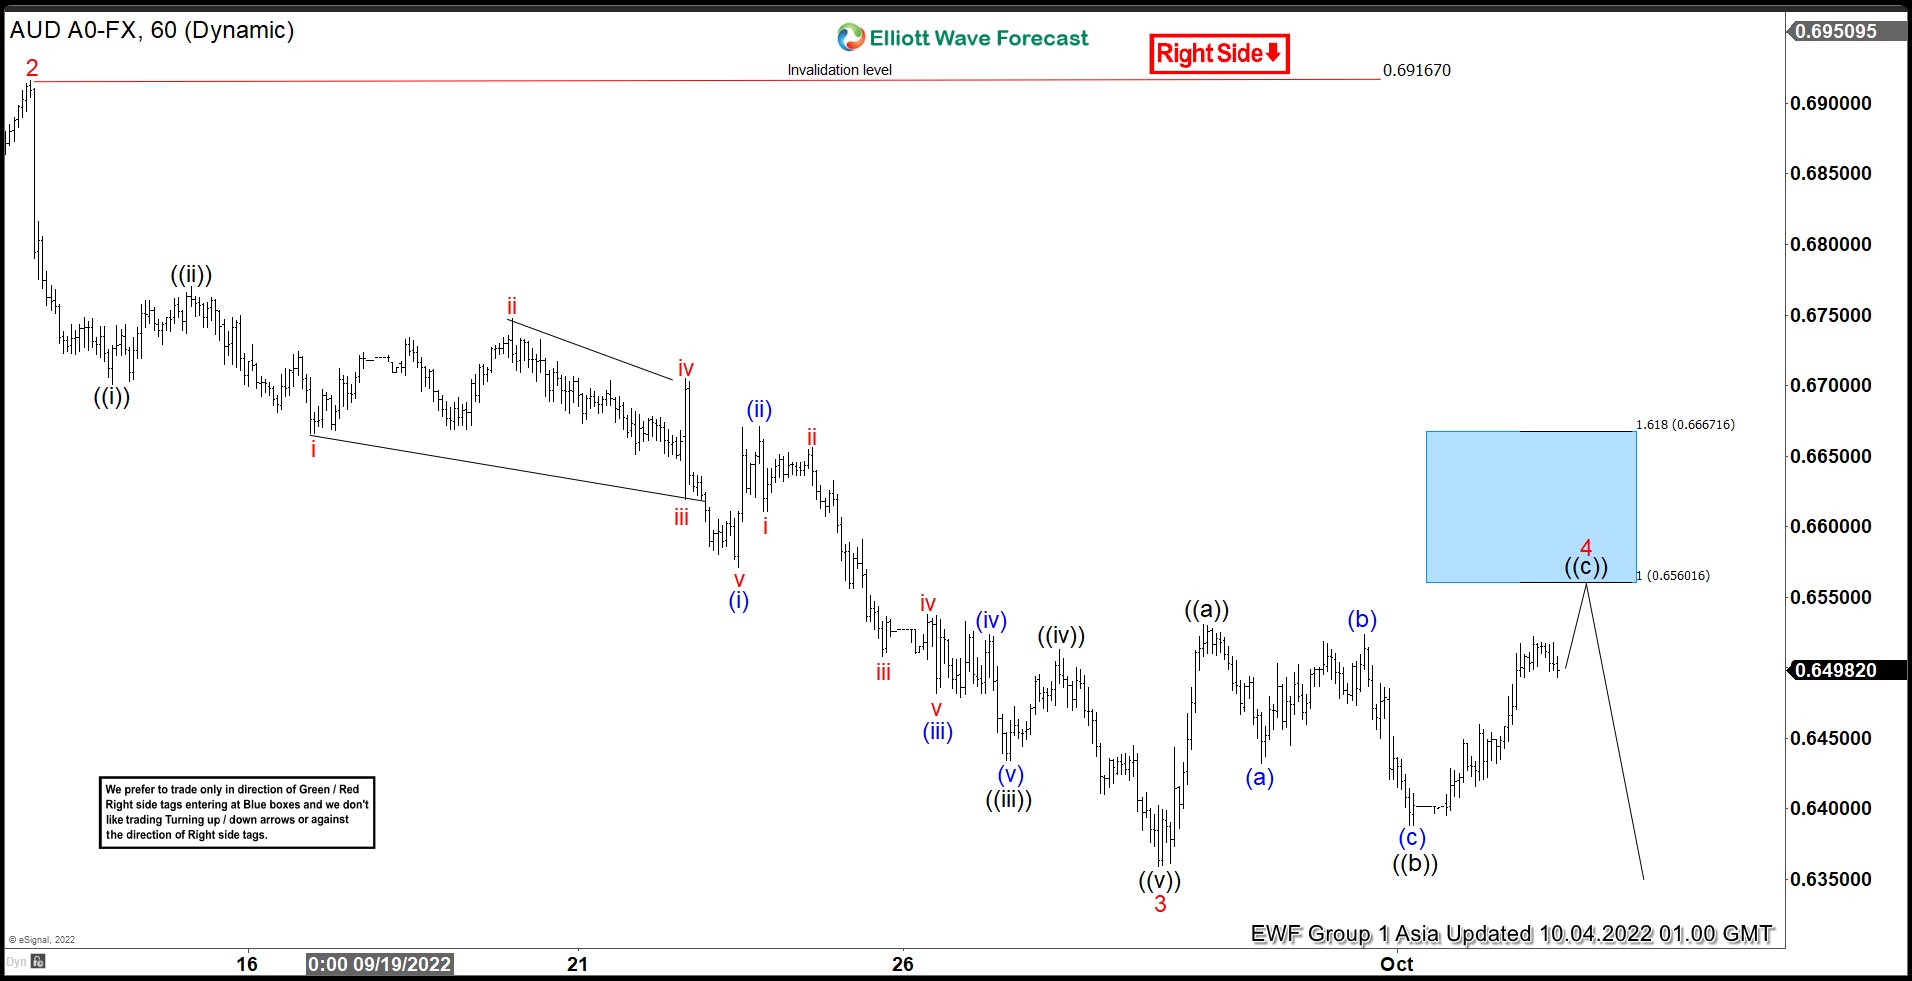
Short term Elliott Wave view on AUDUSD suggests that cycle from 8.11.2022 high is in progress as a 5 waves impulse structure. Down from 8.11.2022 high, wave 1 ended at 0.6699 and rally in wave 2 ended at 0.6916. Wave 3 took the form of an impulse in lesser degree. Down from wave 2, wave ((i)) ended at 0.6701 and rally in wave ((ii)) ended at 0.677. Pair resumes lower in wave ((iii)) towards 0.6434, and rally in wave ((iv)) ended at 0.6512. Final leg lower wave ((v)) ended at 0.6359 which completed wave 3.
Wave 4 rally is in progress as a zigzag Elliott Wave structure. Up from wave 3, wave ((a)) ended at 0.65309 and pullback in wave ((b)) ended at 0.6388. Wave ((c)) higher is in progress and expected to reach 0.656 – 0.666 blue box area to complete wave 4. This blue box area is a 100% – 161.8% Fibonacci extension of wave ((a)). From this area, pair should resume lower in wave 5. Near term, as far as pivot at 0.6916 high stays intact, expect rally to fail in 3, 7, or 11 swing for further downside.
AUDUSD 60 Minutes Elliott Wave Chart
Eco Data 10/4/22
[php_everywhere instance="1"]
Pound is Keeping a Stiff Upper Lip
The Pound Sterling keeps trying to reach stability against the USD. On Monday, 3 October, GBP/USD is balancing around 1.1211.
After the Bank of England revised its stance on supporting the country’s economy and decided to buy government bonds instead of selling them, the Pound got too much stress and dropped to multi-year lows.
The monetary and financial policy delivered by the Bank of England together with Her Majesty's Treasury makes investors worry. It looks like London put up with an inflation boost and might try to improve the economy from the other side.
It does not necessarily mean that this strategy will work – market players should wait for real data that will help them to analyse the effect.
So far, the Pound remains fundamentally weak.
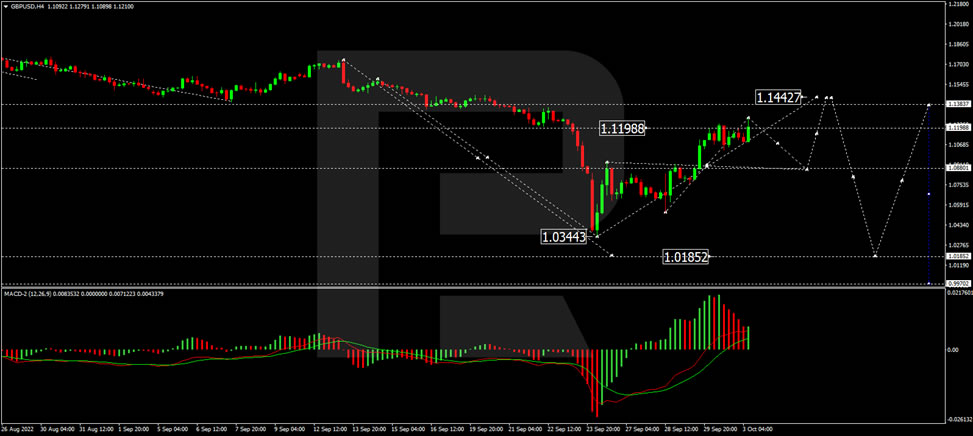
As we can see in the H4 chart, after finishing the descending wave at 1.1275, GBP/USD has formed a new consolidation range there. If later the price breaks the range to the downside, the market may resume trading downwards with the target at 1.0880; if to the upside – form one more ascending structure towards 1.1447 and then start another decline to reach 1.0185. From the technical point of view, this scenario is confirmed by the MACD Oscillator: its signal line is moving above 0 and may continue growing to reach new highs soon.
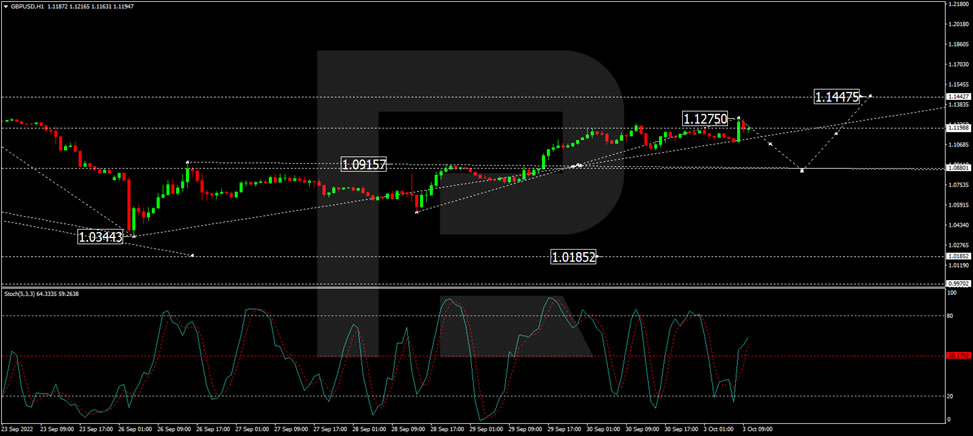
In the H1 chart, GBP/USD has completed the ascending structure with the short-term target at 1.1275. Possibly, the pair may fall towards 1.0880 and then start another growth to reach 1.1447. Later, the market may resume trading within the downtrend with the target at 1.0880. From the technical point of view, this scenario is confirmed by the Stochastic Oscillator: its signal line is moving below 80 and may fall to break 50. After that, the line may reach 20 and then resume growing to return to 80.
Gold and Silver jump after poor US ISM
Gold and silver rise notably as Dollar weakens after poorer than expected ISM manufacturing PMI. The disappointing data prompts some talks that Fed officials could start to turn more cautious about the pace of tightening.
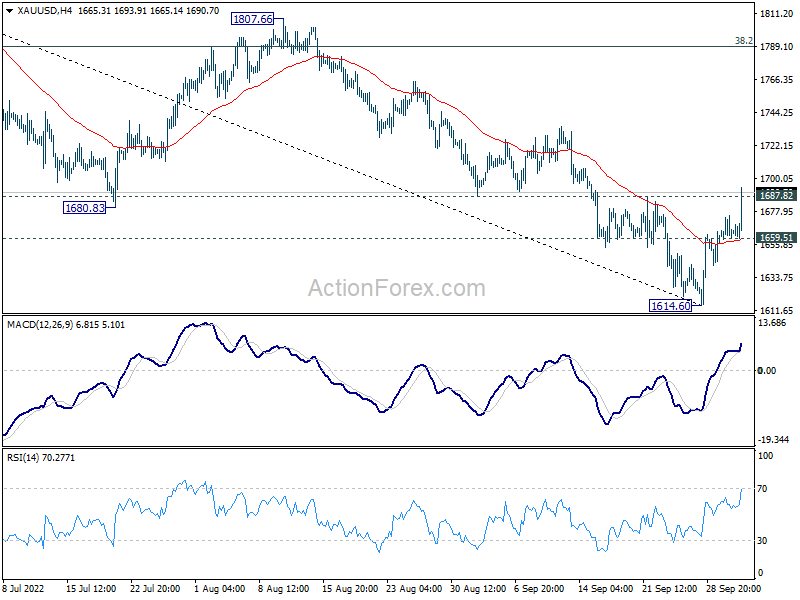
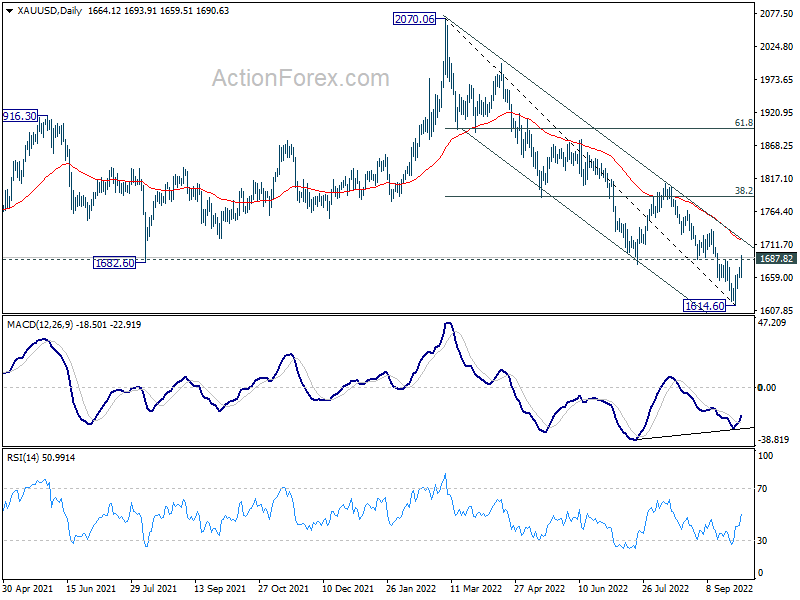
Gold's break of 1687.82 resistance indicates short term bottoming at 1614.60. Further rise is now in favor as long as 1659.51 minor support holds, to 55 day EMA (now at 1718.30), which is close to medium term falling channel resistance.
For now, it's still early to call for bullish trend reversal, despite bullish convergence condition in daily MACD. But sustained break of 55 day EMA should at least bring stronger rise towards 38.2% retracement of 2070.06 to 1614.60 at 1788.58.
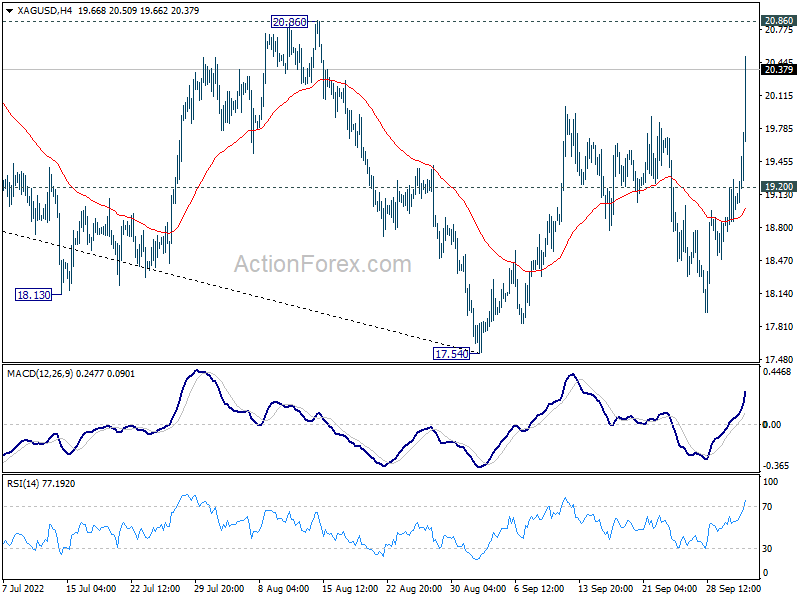
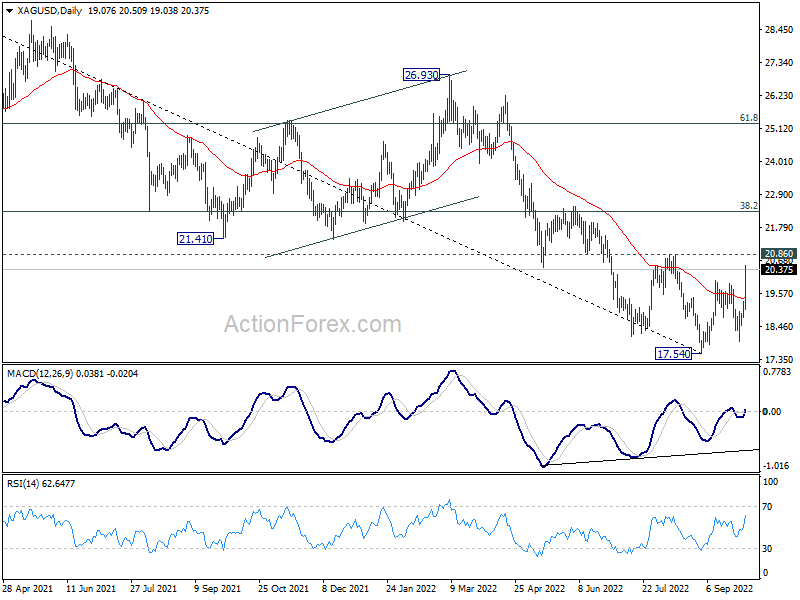
Silver is making slightly more progress than gold with strong break of 55 day EMA. Further rally is now expected as long as 19.20 minor support holds. Break of 20.86 resistance will target 38.2% retracement of 30.07 to 17.54 at 22.32. Reaction from there will reveal the chance of bullish trend reversal.
It’s Time to Look at New Zealand
Inflation in New Zealand is the highest since 1990, edging to 7.3% in Q2 2022. The currency is under heavy pressure as the Reserve Bank of New Zealand is trying to reverse the inflationary spiral. The week ahead will give us a valuable clue about the country’s monetary policy, and we are here to talk about that.
What is happening with the New Zealand economy?
The GDP growth in New Zealand reached 5% in 2021, making the economy one of the fastest-developing in Oceania. However, as the world suffered from geopolitical shocks and supply crunches, inflation started to speed up. Although the direct impact of the Russian invasion of Ukraine is limited due to their small shares in New Zealand’s trade, the indirect effect is present. Rising commodity and energy prices gradually increased the cost of living, pressing on businesses and consumers.
Currently, inflation stays at 7.3%, the highest since 1990, and may become two-digit as tourism rebounds from the Covid-19 lockdowns.
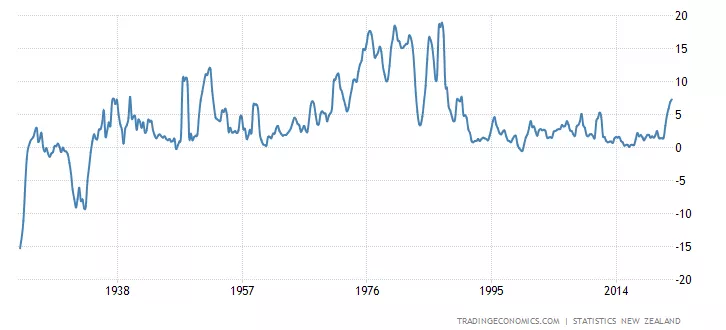
Source: tradingeconomics.com
The unemployment level is at a historic low (3.2%), but the labor market lacks skilled workers. Moreover, when the country reopened the border in March 2022, the outflow of migrants soared. That happened because workers needed new work visas and had to wait till July 2022 to get them. All this increases pressure on the labor market and pushes prices even higher.
Where is it all going?
The Reserve Bank of New Zealand (RBNZ) will publish its Official Cash Rate on Wednesday, October 5, 04:00 GMT+3. The RBNZ’s deputy governor Christian Hawkesby said the bank considered a rate increase between 25 and 75 points before deciding to raise the rate by 50 basis points this month. As he said, once rates get to 4.0-4.25%, the bank will understand the monetary policy and the economic performance better.
As the current rate is at 3.0%, we expect the bank to make at least three consecutive rate changes. The closest one will probably be a 50-basis-point, followed by two 25-s, or a 50 and a 25. We expect the downturn in New Zealand’s economy to slow as the tightening cycle ends.
According to Organization for Economic Co-operation and Development (OECD) report, economic growth will slow from 5.0% in 2021 to 3.0% in 2022 and 2.0% in 2023. Therefore, the country is likely to withstand global recession with its head held high.
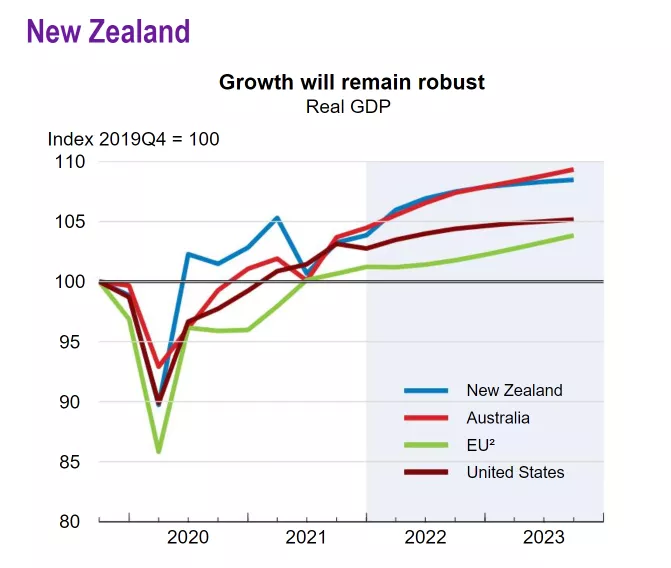
New Zealand’s dollar prospects
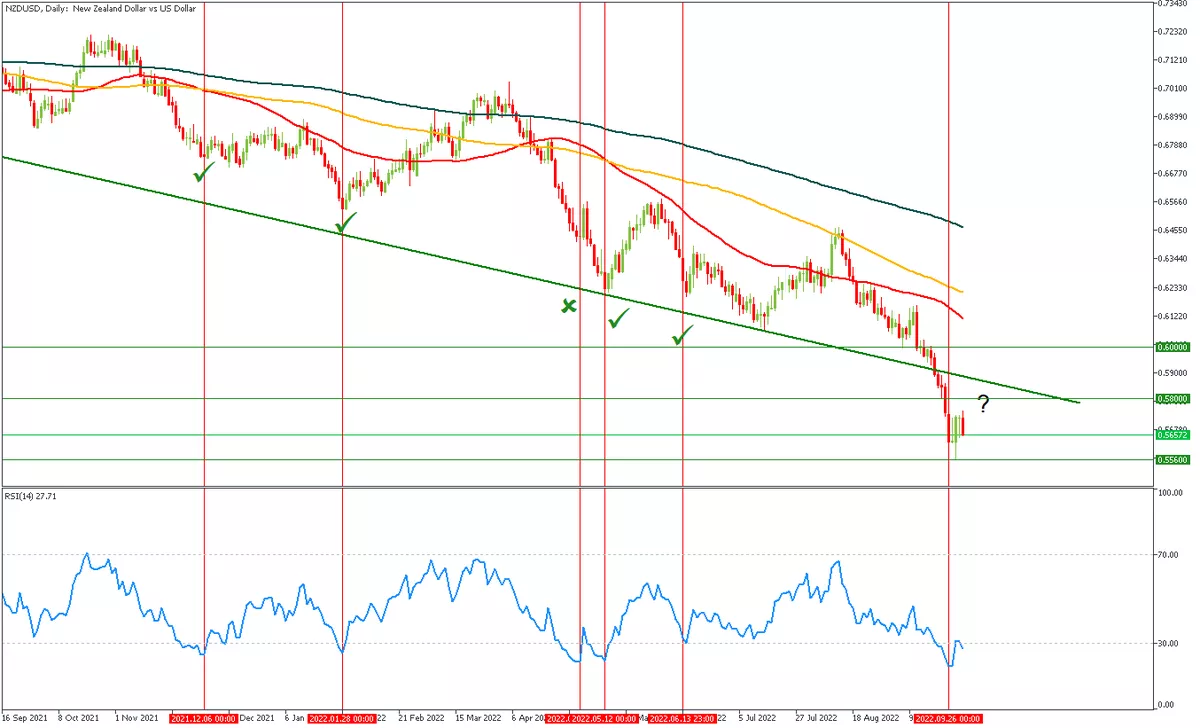
As the NZD remains under pressure, especially against the strong USD, we can spot signs of an upcoming reversal o a daily chart. First, the RSI is in the oversold zone. Generally a buy signal, it worked four out of five times over the last year.
Moreover, the RBNZ Rate Statement, which comes right after the Cash Rate announcement, may come along with our suggestions on future rate changes. It will give some relief to the NZD bulls and push the NZDUSD pair to the resistance trendline.
A less likely scenario is unexpectedly hawkish comments from the bank’s members that may push the pair above the trendline and bring it to the 50-period MA.
NZDUSD daily chart
Resistance: 0.5800, 0.6000
Support: 0.5560
ISM Manufacturing ekes out another month of expansion
The September ISM manufacturing index registered 50.9, falling short of expectations of a 52.0 print. The index fell 1.9 percentage points from the August's reading of 52.8.
New orders fell by 4.2 percentage points to 47.1, while new export orders fell 1.6 percentage points to 47.8.
The backlog of orders sub-index came in at 50.9, falling 2.1 percentage points from August's 53.0 print.
The production index rose 0.2 percentage points to 50.6 while the employment index sank 5.5 percentage points to 48.7.
The supplier deliveries sub-index fell to 52.4 from 55.1 in August. Supplier delivery times expanded at their slowest rate since January 2020.
Nine of 18 manufacturing industries reported growth in September. Growth was led by Nonmetallic Mineral Products; Machinery; Plastics & Rubber Products; Miscellaneous Manufacturing; Apparel, Leather & Allied Products; and Transportation Equipment.
Key Implications
The ISM manufacturing index eked out another gain in September, registering slightly above the 50-reading that is the cut-off for growth. The details of the report were decidedly negative with new orders, new export orders and employment all sinking. Moreover, only half of the 18 industries reported growth in the month.
In a bit of good news, supply side disruptions continue to ease, mitigating one the key inflationary impulses from the past year. However, the improvements are coming as a byproduct of softening demand, as higher interest rates work their way through the economy.
Despite better supply conditions, the growth outlook is decidedly frail. Recent signals by the Fed that even higher interest rates will be needed to quell inflation don't bode well for rate-sensitive durable good purchases. Looking forward, the Fed's fight against inflation will continue to work to cool demand and form a key headwind for the manufacturing sector.
AUDJPY Wave Analysis
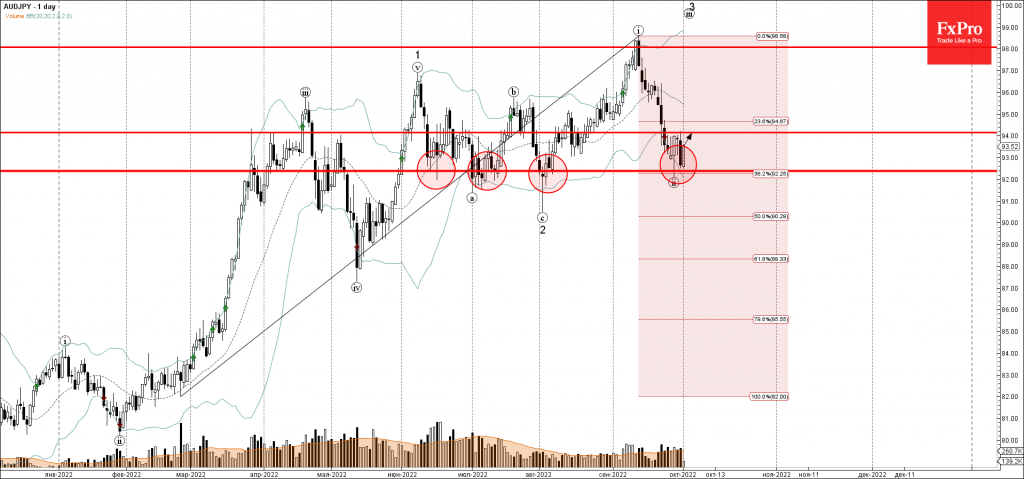
- AUDJPY reversed from long-term support level 92.35
- Likely to rise to resistance level 94.00
AUDJPY recently reversed up from the long-term support level 92.35 (which has been reversing the pair from the middle of June), strengthened by the lower daily Bollinger Band and by the 38.2% Fibonacci correction of the upward impulse from February.
The upward reversal from the support level 92.stopped the previous short-term corrective wave (ii).
Given the clear daily uptrend, AUDJPY can be expected to rise further toward the next resistance level 94.00 (earlier resistance from the end of September).
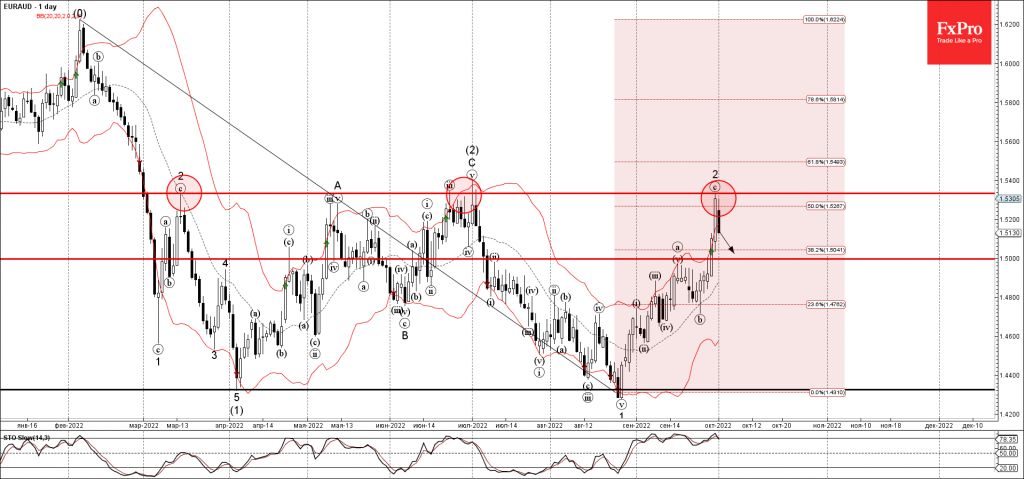
EURAUD Wave Analysis
- EURAUD reversed from resistance level 1.5335
- Likely to fall to support level 1.500
EURAUD recently reversed down from the key resistance level 1.5335 (which has been reversing the price from the start of March), upper daily Bollinger Band and the 50% Fibonacci correction of the downward impulse from February.
The downward reversal from the resistance level 1.5335 stopped the previous short-term ABC correction 2.
Given the widespread euro sales, EURAUD can be expected to fall further toward the next round support level 1.5000.
Sunset Market Commentary
Markets
Core bonds kick off the final quarter of the year recovering from the massacre they had to endure over the course of August and September. It was the Bank of England that ushered in this period of consolidation by announcing an emergency bond buying programme for the sake of financial stability mid-last week. UK Gilts outperform today, thanks to Chancellor Kwarteng’s pivot. In an interview this morning, the finance minister said he would not proceed with the abolition of the top tax rate. The measure is estimated to cost some £3bn, peanuts compared to the remaining £40bn+ unfunded tax cuts on top of the cost related to energy caps. It does fuel (market) hopes for the government to backtrack on other, more costly desiderata. The UK curve steepens with declines ranging between 16.6 bps (30y) to 25.6 bps (2y). Money markets price out 50 bps of rate hikes. The terminal rate is now seen at 5.5%. US Treasuries perform better than Bunds but it’s a close call. US yields drop about 15 bps in the 2y-5y segment and 9-13bps in the 10-30y going into the manufacturing ISM release later today. Real yields bear the brunt. Yields in Germany ease 11-13.3 bps across the curve with the 10y yield (1.98%) nearing first support at 1.927% (June high). Europe’s 10y swap yield (-12.7 bps) loses the symbolic 3% mark. Oil prices advance more than 4% today (Brent at $88.64/b). This follows rumours that OPEC+ would cut oil production by as much as 1 million barrels per day, the biggest curb since the pandemic. The cartel seeks to put an end to sliding oil prices over lingering recession fears. Since the summer, Brent lost about a third of its value. Commodity currencies outperform as a result. The likes of the Canadian, Aussie and New Zealand dollar add between 1 and 1.5% against the US dollar. But it’s nothing more than only partially undoing Friday’s leg lower (which actually stretches back all the way to mid-September). Sterling enjoys some bids after the Kwarteng-pivot. EUR/GBP eases below first support at 0.8721 to test the big figure. Cable (GBP/USD, 1.124) is on track to recoup all of the losses incurred since the Chancellor announced the mini-budget on September 23. The pair is aided by a softer dollar in general. EUR/USD nevertheless weakens a tad further south of 0.98. Gas prices tank almost 10% as stocks near 90% while demand this year could drop as much as 10%, the IEA said in its quarterly report this morning. But that’s of little help for the euro this time. European stocks erased 2.4% losses to turn flat. US equities add between 0.3-1%.
News Headlines
The Turkish statistical office today reported September inflation at 3.08% m/m and 83.45% Y/Y (was 1.46% m/m and 80.21% Y/Y). Core inflation also rose further to 68.09% from 66.08%. Both figures were close to expectations. In a monthly perspective, the biggest monthly again came from housing (9.99% M/M) followed by education (6.99%) and communication (3.4%). In a yearly perspective, transportation (117.66%), food and non-alcoholic beverages (93.05%) furnishings and household equipment (89,68) showed the biggest rise. PPI inflation also accelerated further to 4.78% M/M and 151.50% Y/Y. The further rise in inflation comes as the Central Bank of the Turkish Republic further eased the policy rate to 12% in September as the government aims for lower rates to support growth and exports. In line with recent price action, the reaction of the Turkish lira was limited (EUR/TRY 18.17).
Inflation in Switzerland unexpectedly slowed in September. Headline inflation printed at -0.2% M/M and 3.3% Y/Y (down from 3.5% in August). Core inflation was unchanged at 2.0%. The move, amongst others was driven by a 2.6% monthly decline in petroleum products. Services prices also declined 0.2% M/M. Still, the figures remains above the 2% target and the SNB is expected to raise its policy rate further in December. Other data showed that sight deposits held at the SNB dropped sharply in the week to September 30 from CHF 626.6 bln to 563.7 bln. The decline suggests that the SNB used bond sales, reverse repos or bill sales to drain liquidity from the market and bring the market interest rate closer to the SNB policy rate (0.5%). After declining at the end of last week, the Swiss franc today stabilized near EUR/CHF 0.9665.