Sample Category Title
Technical Outlook and Review
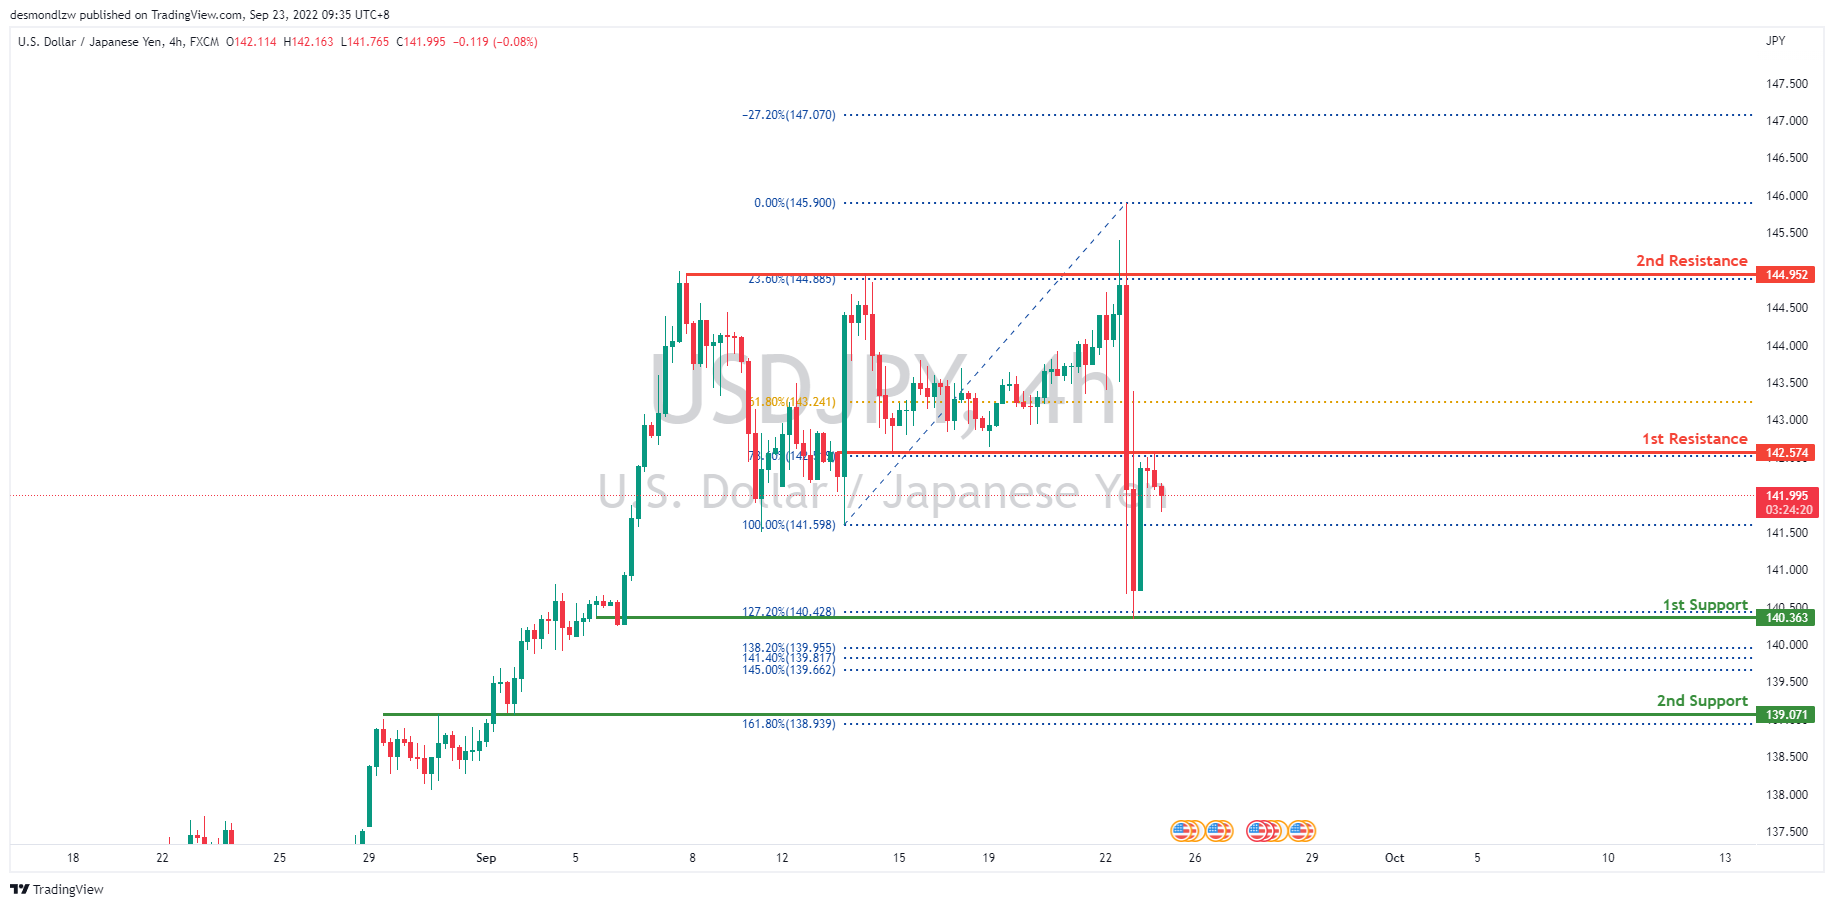
USD/JPY:
On the H4 chart, price has reflected off the 1st support at 140.363 and back up to the 1st resistance at 142.574 where the 78.6% Fibonacci line is. Price might possibly reflect off it and head back down towards the 1st support. Price could also possibly break past up the 1st resistance and head up towards the 2nd resistance at 144.952 where the 24.6% Fibonacci line lies.
Areas of consideration:
- H4 time frame, 1st resistance at 142.574
- H4 time frame, 1st support at 140.363
DXY:
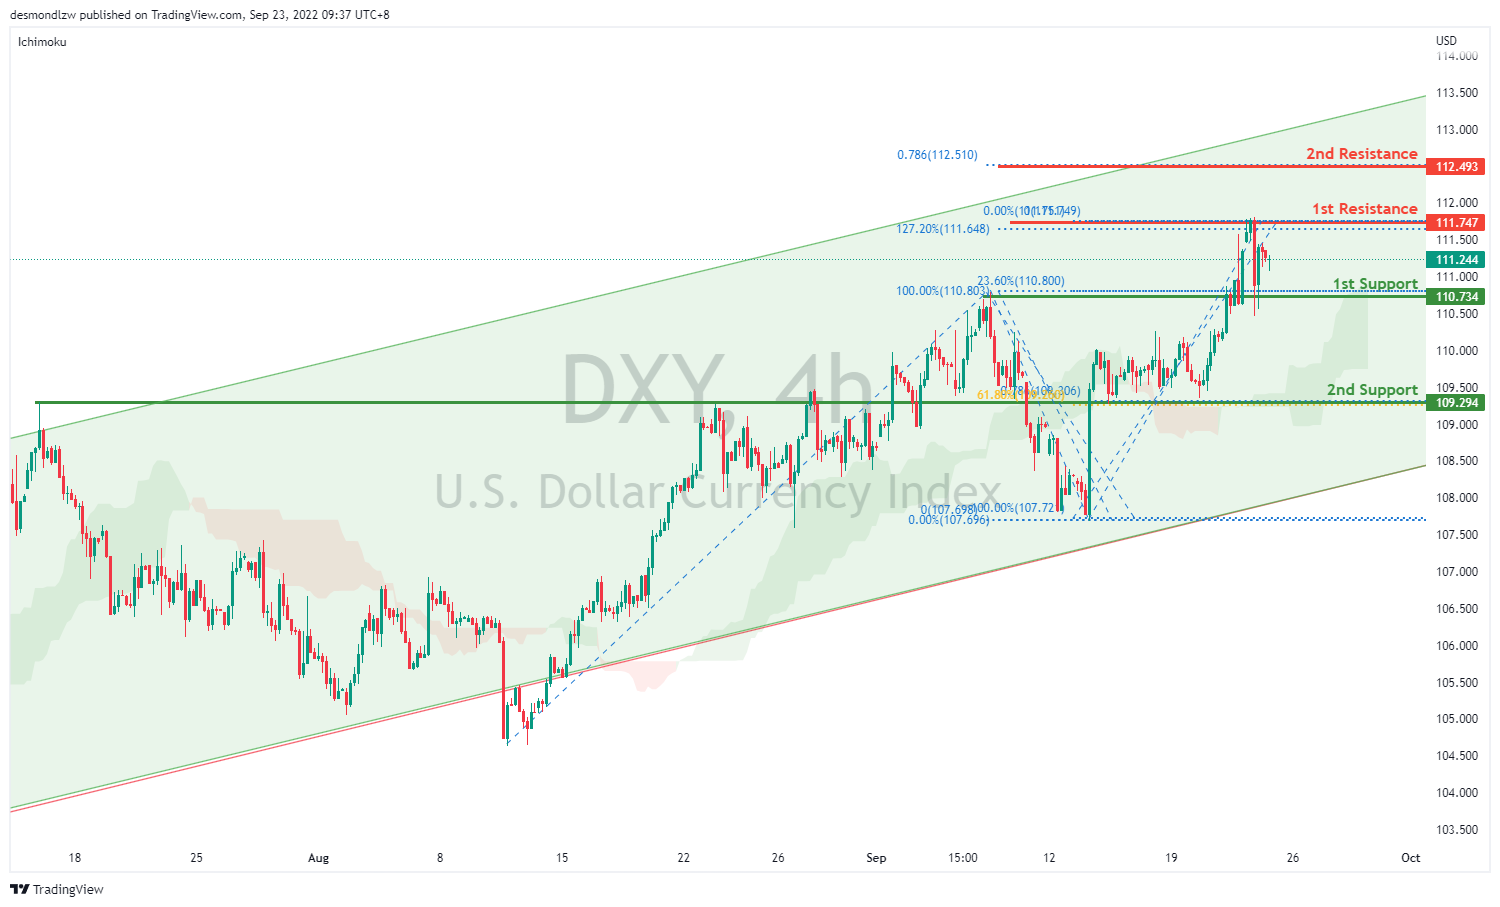
On the H4, price is still respecting the bullish channel and has failed to break the first support- we are bullish bias. Price has broken the previous high to test at the first resistance at 111.747 where the 127.2% extension sits. If bullish momentum continues, it should bring price toward the second resistance at 112.493 where the 78.6% projection sits. Alternatively, it could pull back to test the first support at 110.734 where the 23.6% retracement and previous swing high sits then the second support at 109.294 where the 78.6% projection,61.8% retracement and overlap support sits
Areas of consideration:
- H4 time frame, 1st resistance at 111.747
- H4 time frame, 1st support at 110.734
EUR/USD:
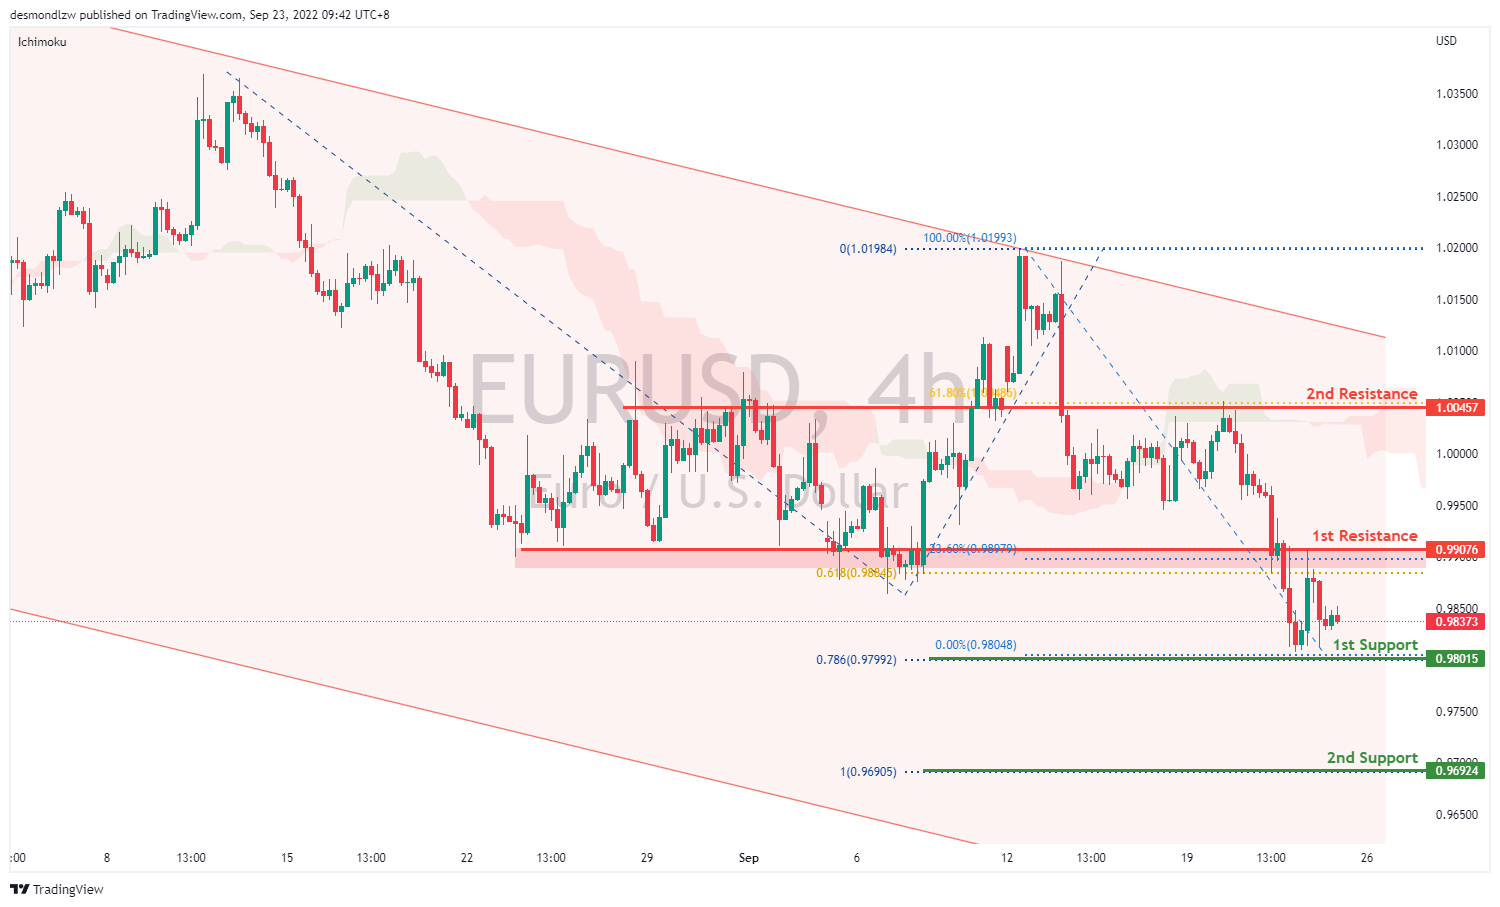
On the H4, price is moving within the channel in a descending manner- we are bearish biased. Price has bounced off the first resistance and it looks like it’s moving to test 0.9801 where the 78.6% projection sits. If price breaks this level, it will bring prices to the second support at 0.9692 where the 100% projection sits. Alternatively it could pull back to test the first resistance again at 0.9907 level where the 23.6% retracement, 61.8% projection and previous swing low sits then to the second resistance at 1.0045 where the 61.8% retracement and previous swing high sits.
Areas of consideration :
- H4 1st resistance at 0.9907
- H4 1st support at 0.9801
GBP/USD:
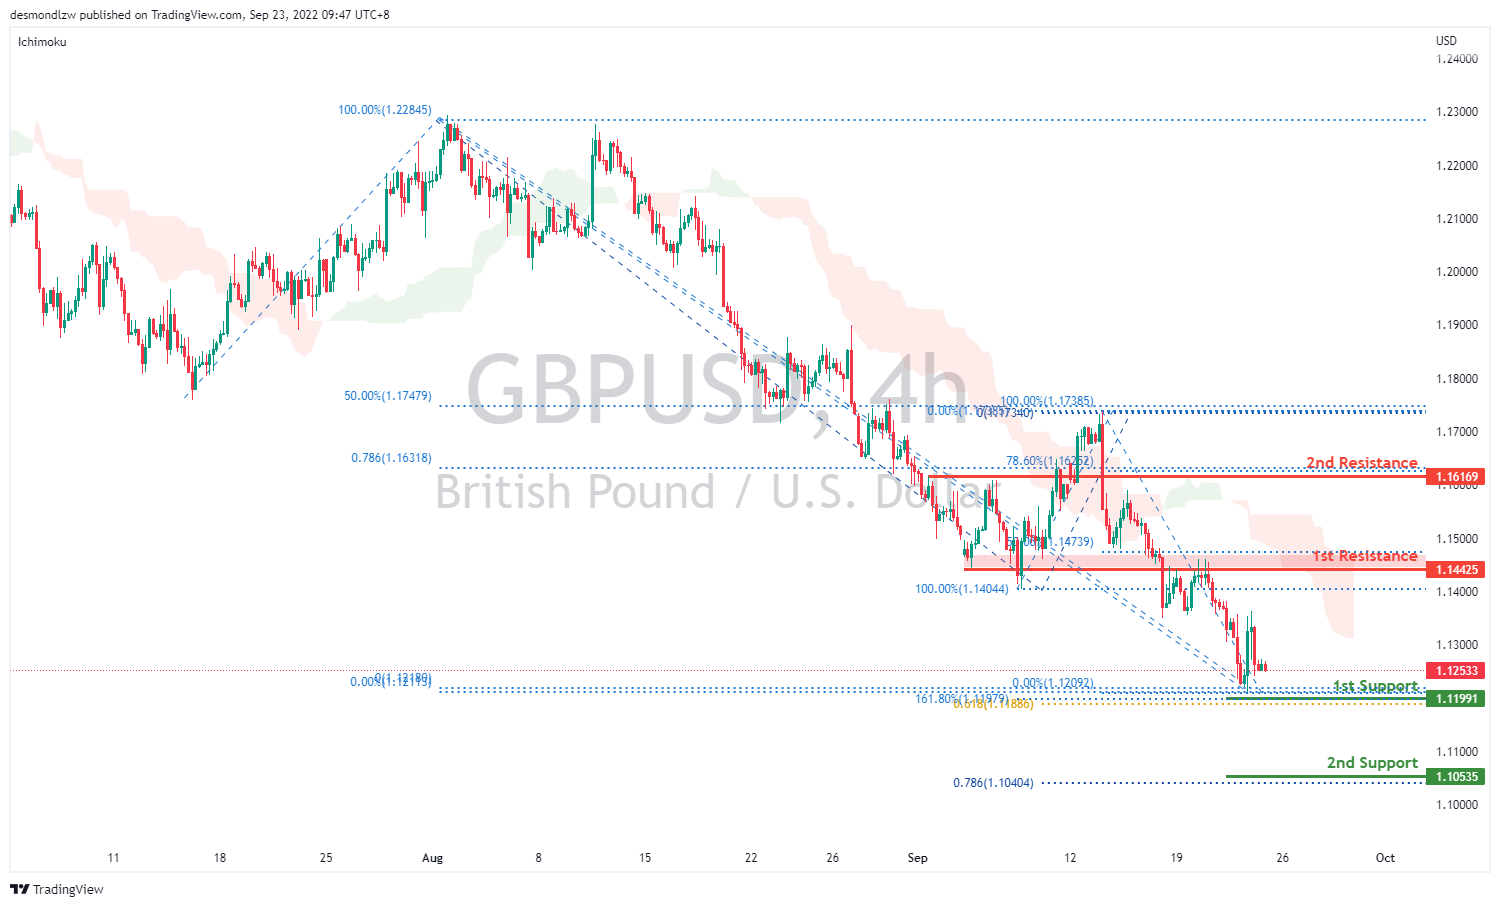
On the H4, prices are still moving in a bearish momentum hence we are bearish biassed. If bearish momentum continues, it should test the first support at 1.1199 levels where the 61.8% projection and 161.8% extension sits then the second support at 1.1053 where the 78.6% projection sits. Alternatively, price could pull back to test the first resistance at 1.1442 where the 50% retracement and overlapping resistance sits then the second resistance at 1.1616 where the 78.6% retracement, 78.6% projection and previous swing high sits
Areas of consideration:
- H4 1st resistance at 1.1442
- H4 1st support at 1.1199
USD/CHF:
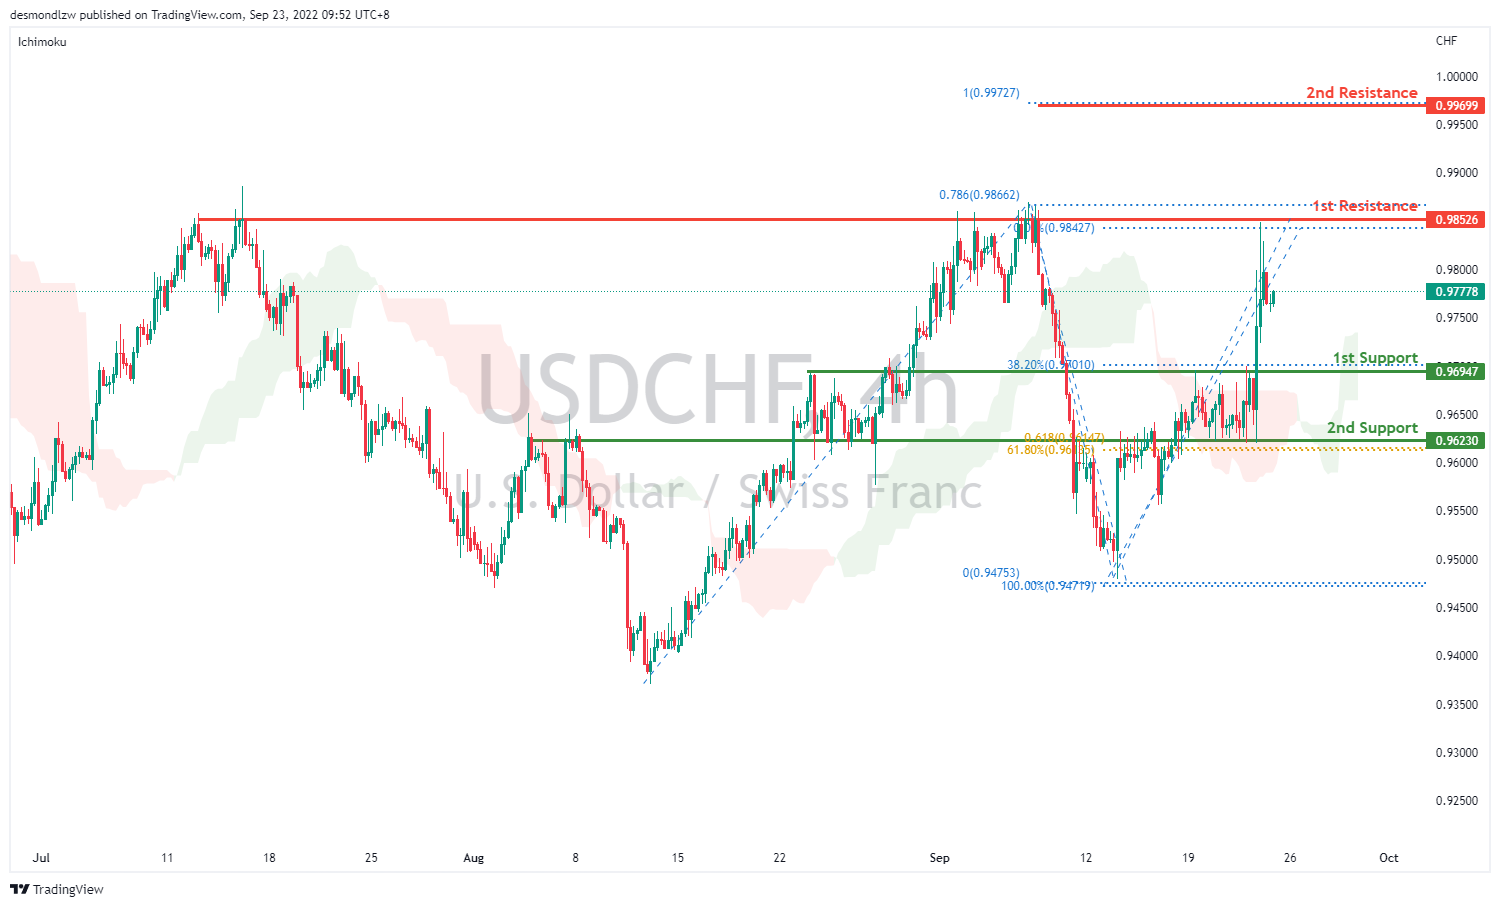
On the H4, prices have broken the descending channel and we are currently bullish biased. Price has broken the first support and is moving toward the first resistance at 0.9852 where the 78.6% projection and previous swing high sits. If bullish momentum continues, it should bring price to the second resistance at 0.9969 where the swing high and 100% projection sits. Alternatively, price could pull back to test the first support at 0.9694 where the 38.2% retracement and overlapping resistance sits. If it breaks the first support, it should bring price to the second support at 0.9623 where the 61.8% projection and 61.8% retracement sits.
Areas of consideration
- H4 1st support at 0.9694
- H4 1st resistance at 0.9852
XAU/USD (GOLD):
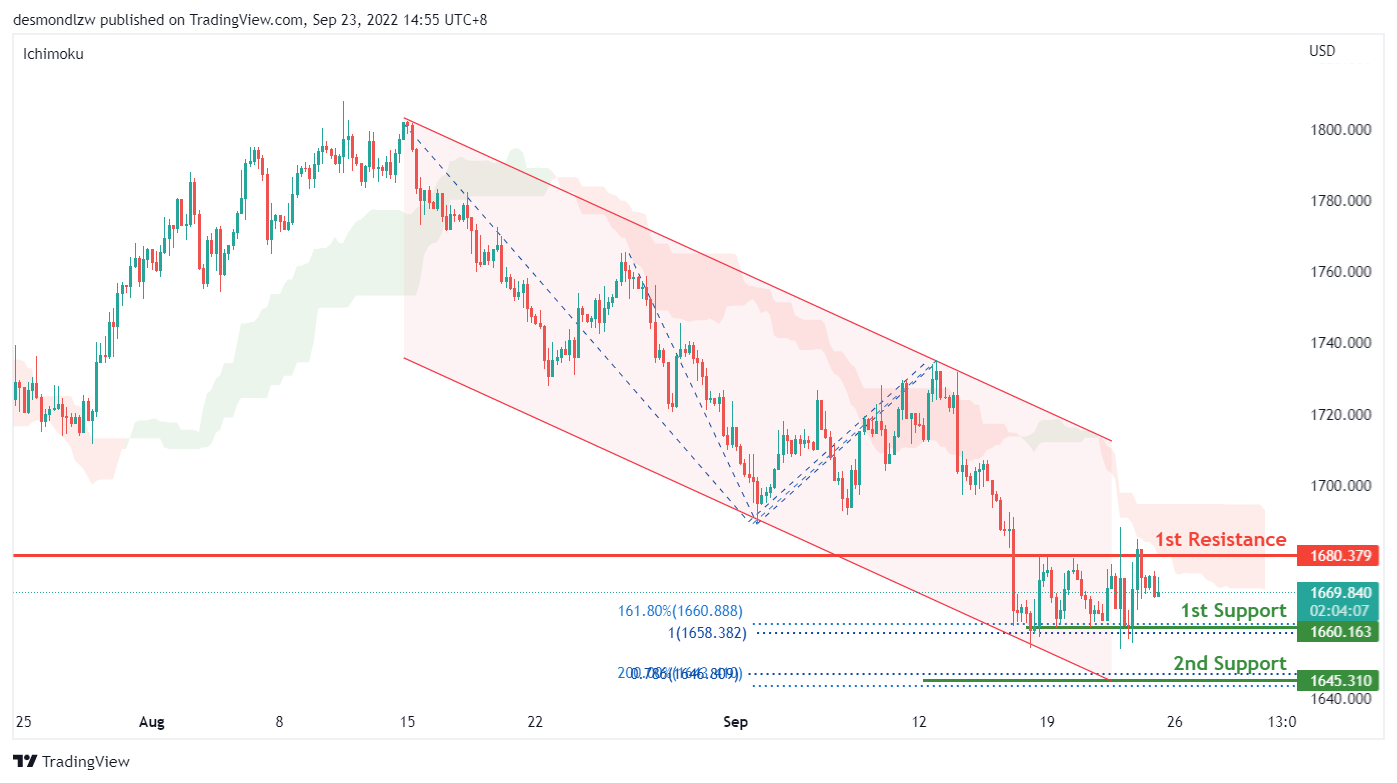
On the H4, with the price moving within the descending channel and below ichimoku cloud, we have a bearish bias that price may drop to the 1st support of 1660, which is in line with the 161.80% fibonacci extension and 100% fibonacci projection. Alternatively, the price may test the 1st resistance at 1680, which is in line with the overlap resistance and 38.2% fibonacci retracement.
Areas of consideration:
- H4 time frame, 1st resistance at 1680
- H4 time frame, 1st support at 1660
AUD/USD:
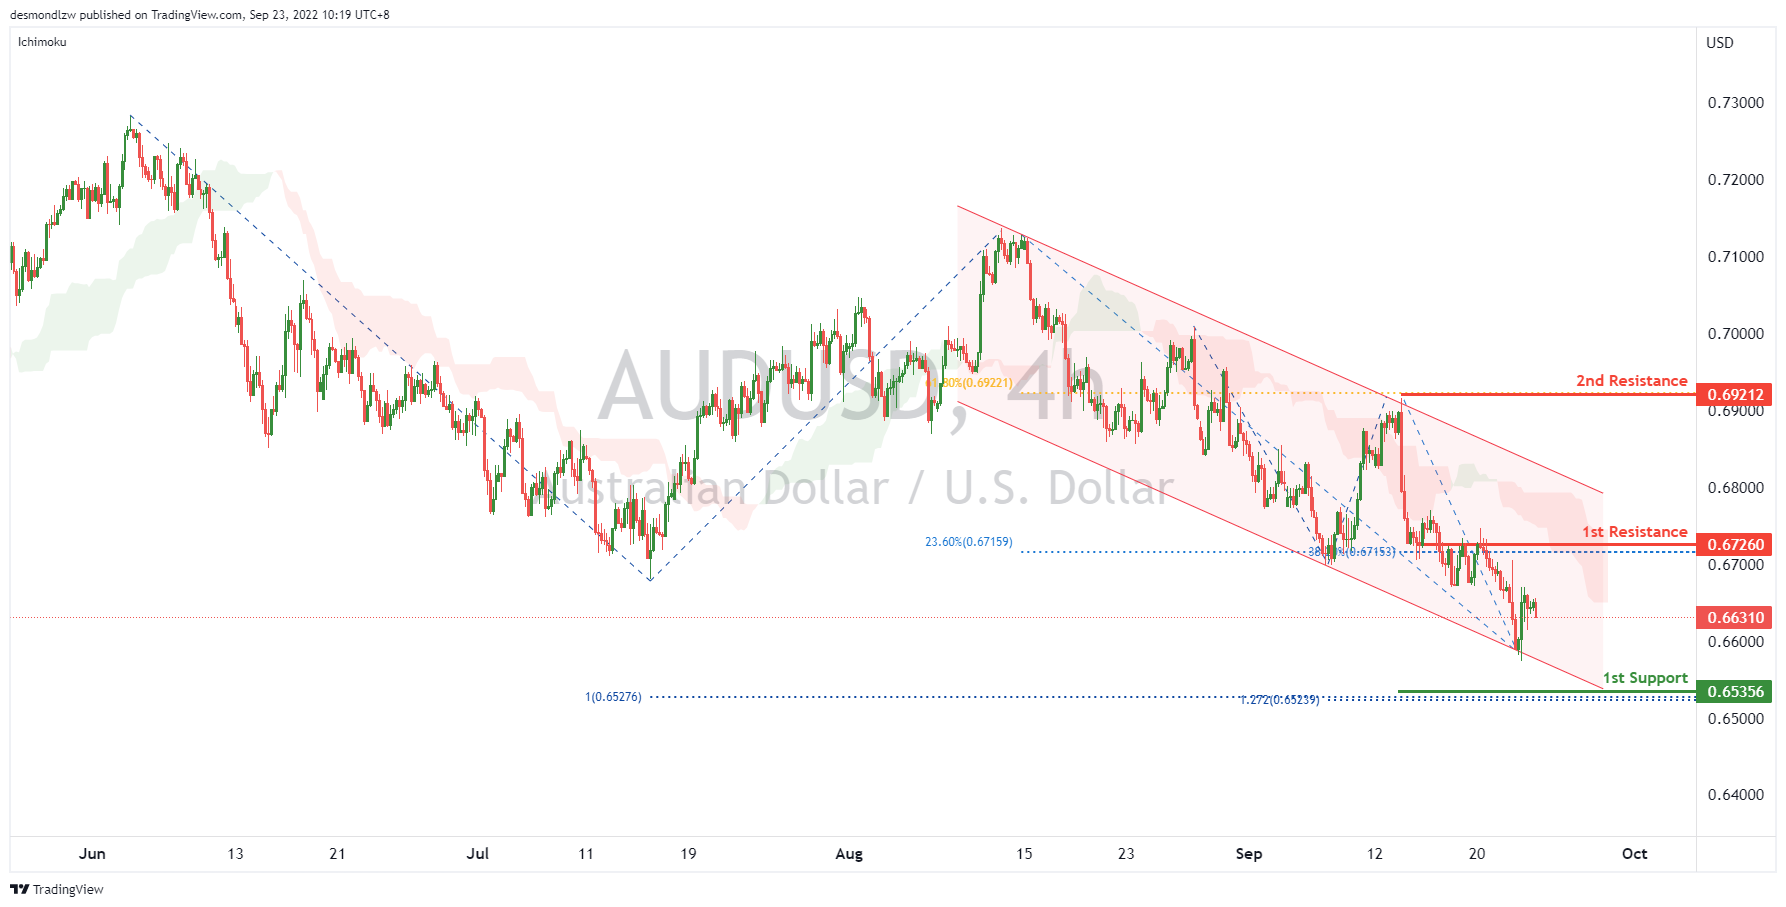
On the H4, with the price moving within the descending channel and reversing from the lower bound, we can expect the price to pull back to the 1st resistance at 0.67260, where the 23.6% fibonacci retracement and 38.2% fibonacci retracement are. If the 1st resistance is broken, the 2nd resistance could be at 0.69212, which is in line with the 61.8% fibonacci retracement. Alternatively, the price may drop to the 1st support at 0.65356, which is in line with the 127.2% fibonacci extension and 100% fibonacci projections.
Areas of consideration
- H4, current price
- H4, 1st resistance at 0.67260
NZD/USD:
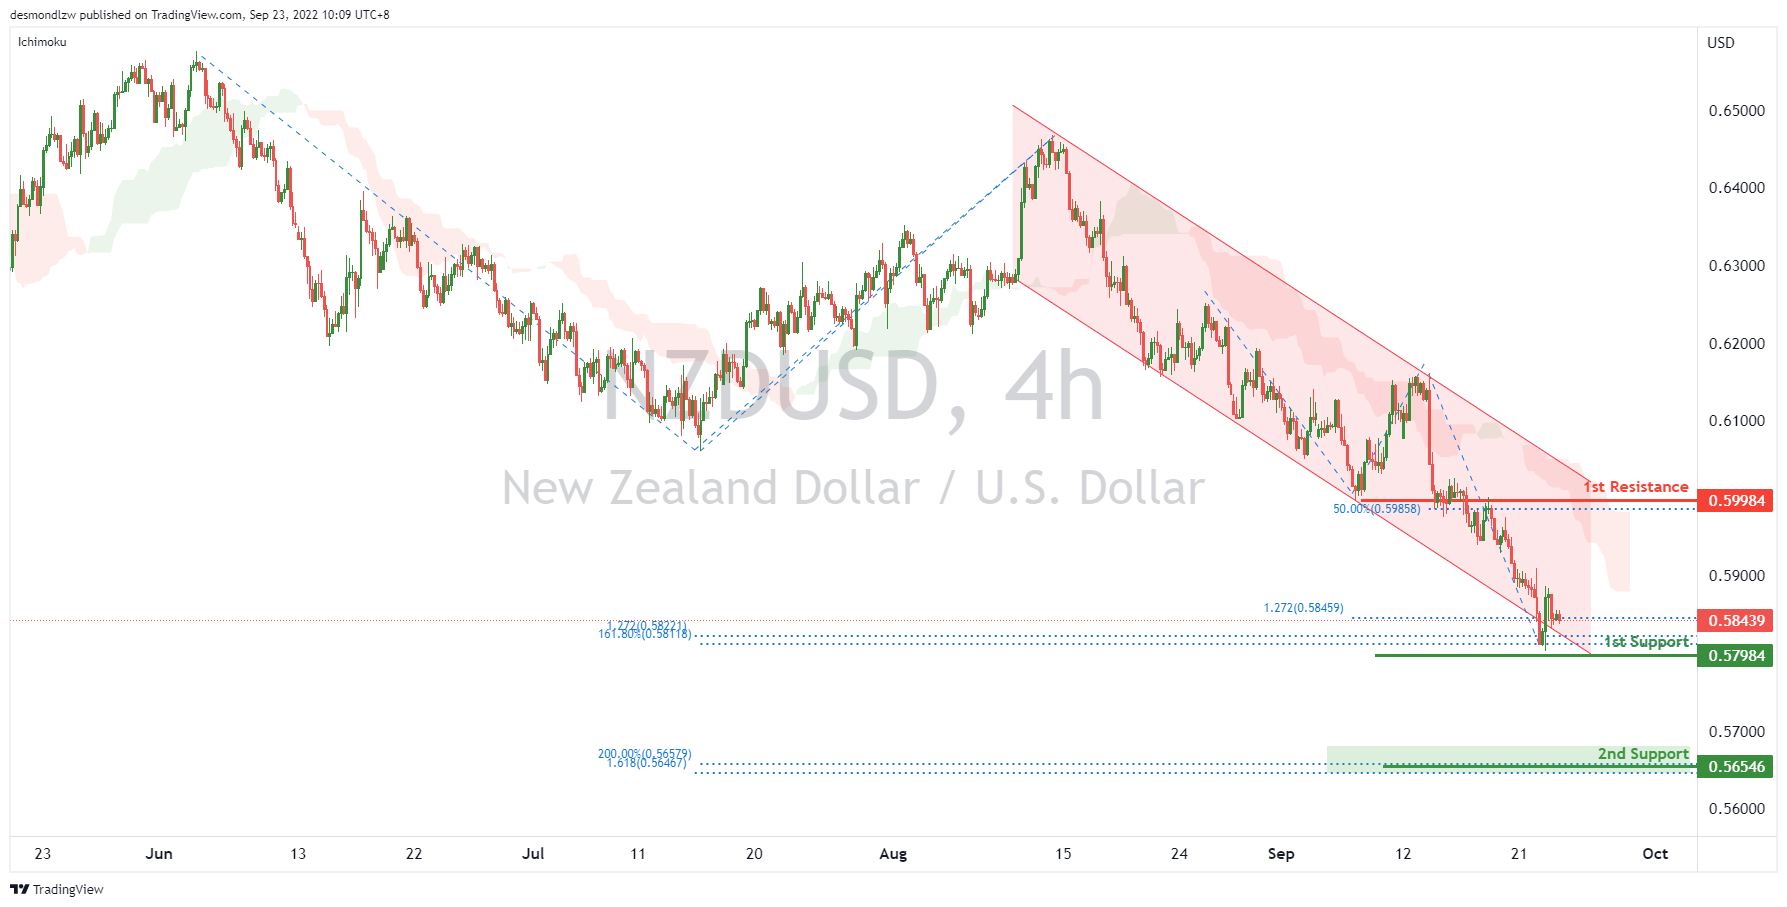
On the H4, with the price moving within the descending channel, below ichimoku cloud, If the price can break the 1st support at 0.57984, which is in line with the 78.6% fibonacci projection, 161.8% fibonacci extension, 127.2% fibonacci extensions successfully, we can expect the price drop to the 2nd support at 0.56546, which is in line with the 200% fibonacci extension and 161.8% fibonacci extension. Alternatively, the price may pull back to the 1st resistance at 0.59984, where the 50% fibonacci retracement and overlap resistance are.
Areas of consideration:
- H4 time frame, current price
- H4 time frame, 1st support at 0.57984
USD/CAD:
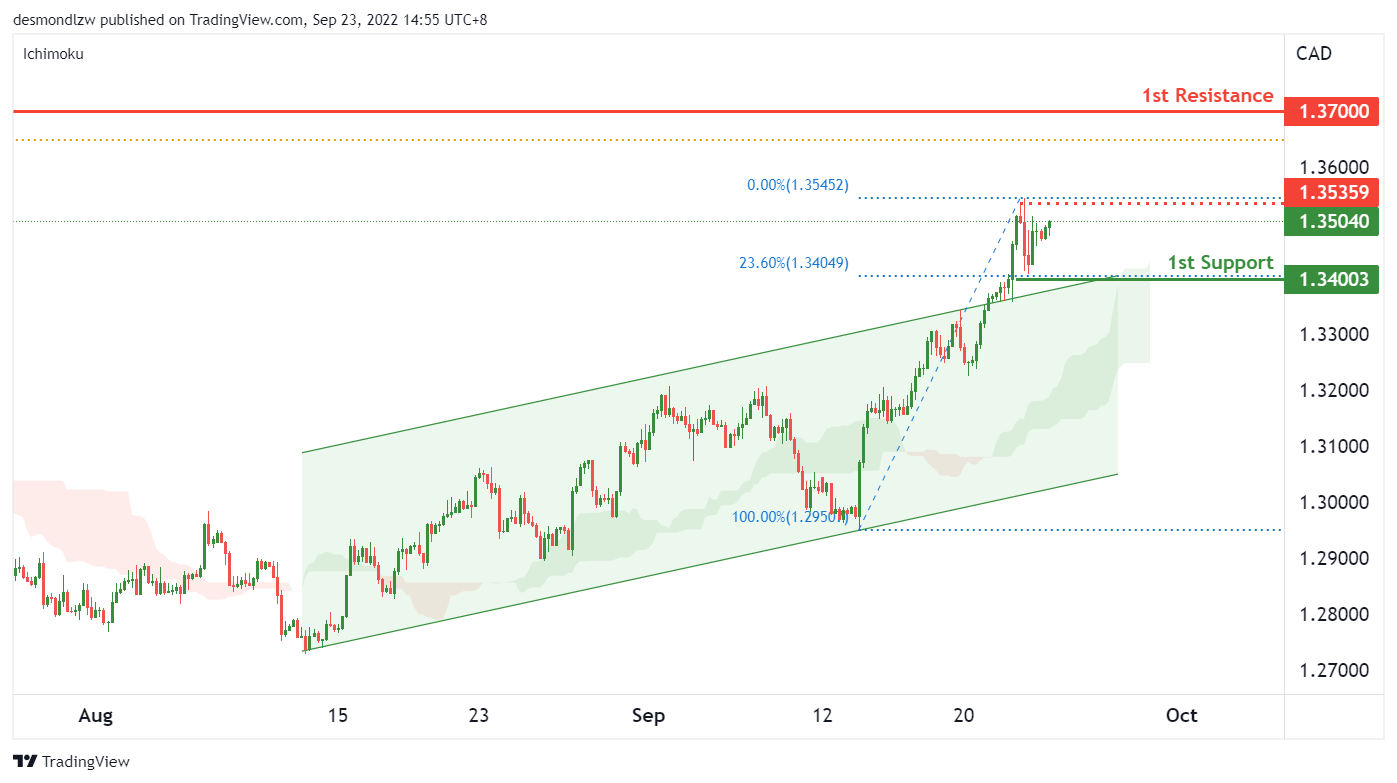
On the H4, with the price having broken above the ascending channel and staying above the ichimoku cloud, we have a bullish bias that the price may rise to the 1st resistance at 1.37, major swing high from June 2020 and also slightly above a major 61.8% fibonacci retracement. There is a risk level at 1.3535 which is where our intermediate resistance is, this level needs to be broken to trigger the next move up to our resistance level. The price may pull back to the 1st support at 1.34, which is in line with the 23.6% fibonacci retracement and the ascending channel.
Areas of consideration:
- H4 time frame, 1st resistance at 1.37
- H4 time frame, 1st support at 1.34
OIL:
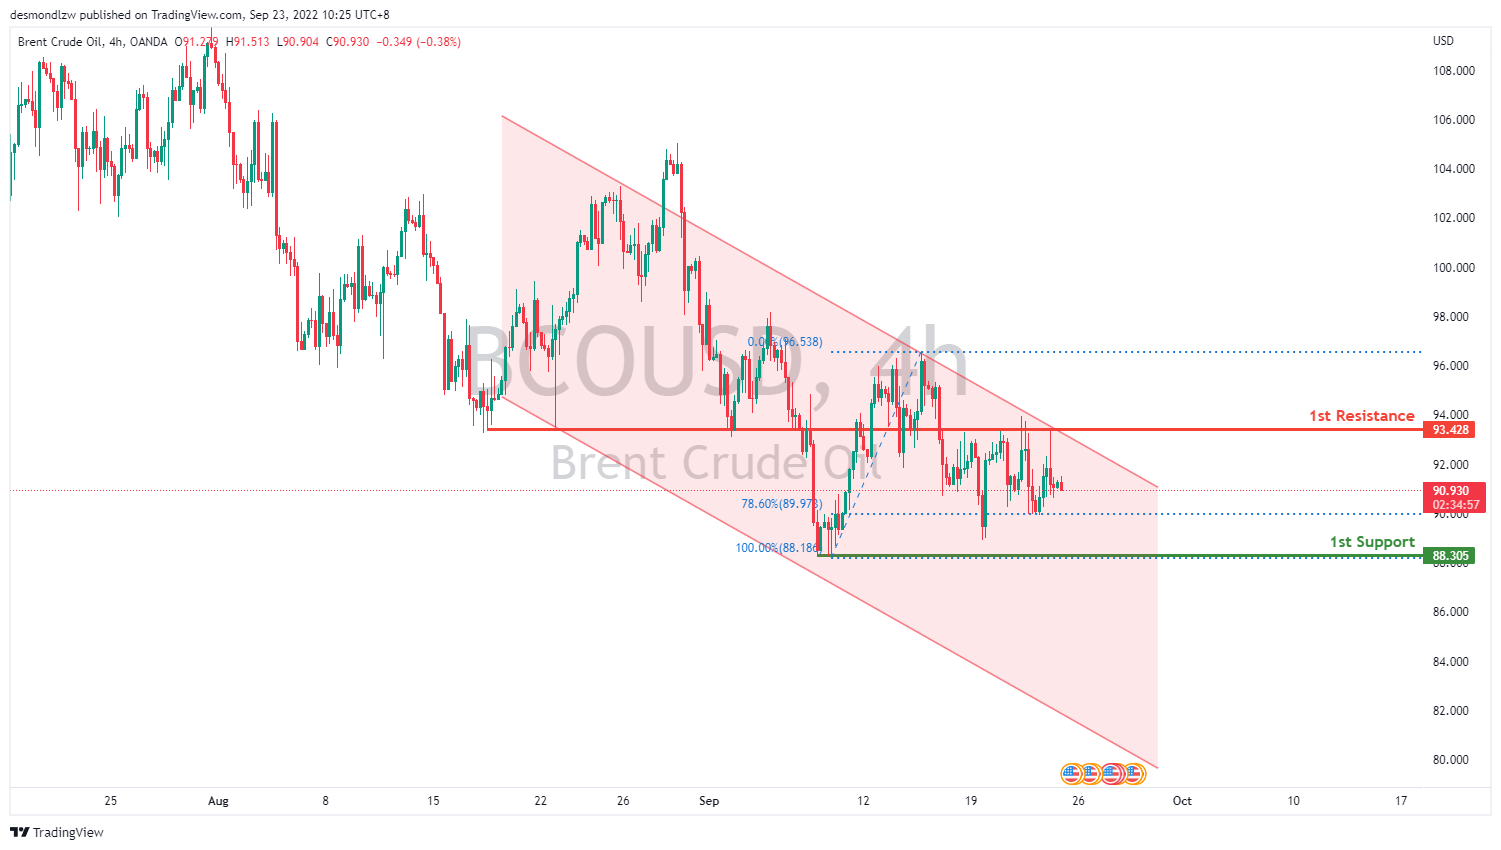
On the H4, the overall bias with oil is bearish since the price is moving within the bearish channel. Price broke through the 1st resistance at 93.428 where the 38.2% Fibonacci line and previous swing low are. Price has also reflected multiple times off it. Price is possible to continue bearish and head to wards the 1st support at 88.186 where the 100% Fibonacci line nad previous swing low lies.
Areas of consideration:
- H4 time frame, 1st resistance at 93.428
- H4 time frame, 1st support at 88.305
Dow Jones Industrial Average:
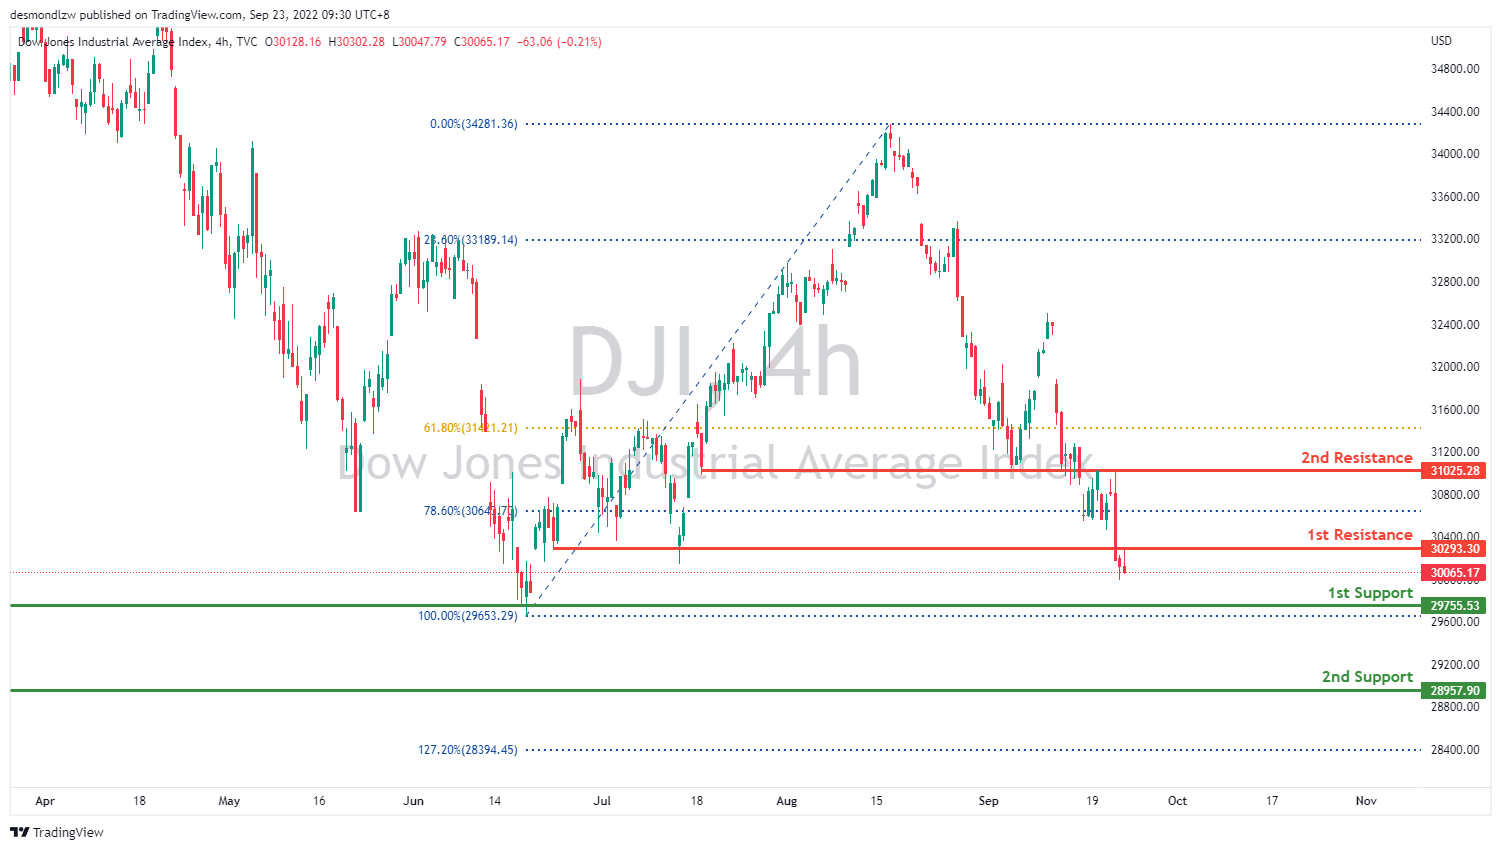
On the H4, price has broke through the 1st resistance at30293.30. Price might continue heading downwards towards the 1st support at 29755.53 where the previous swing low and 100% Fibonacci line is.
Areas of consideration:
- H4 time frame, 1st support at 29755.53
- H4 time frame, 1st resistance at 30293.30
DAX:
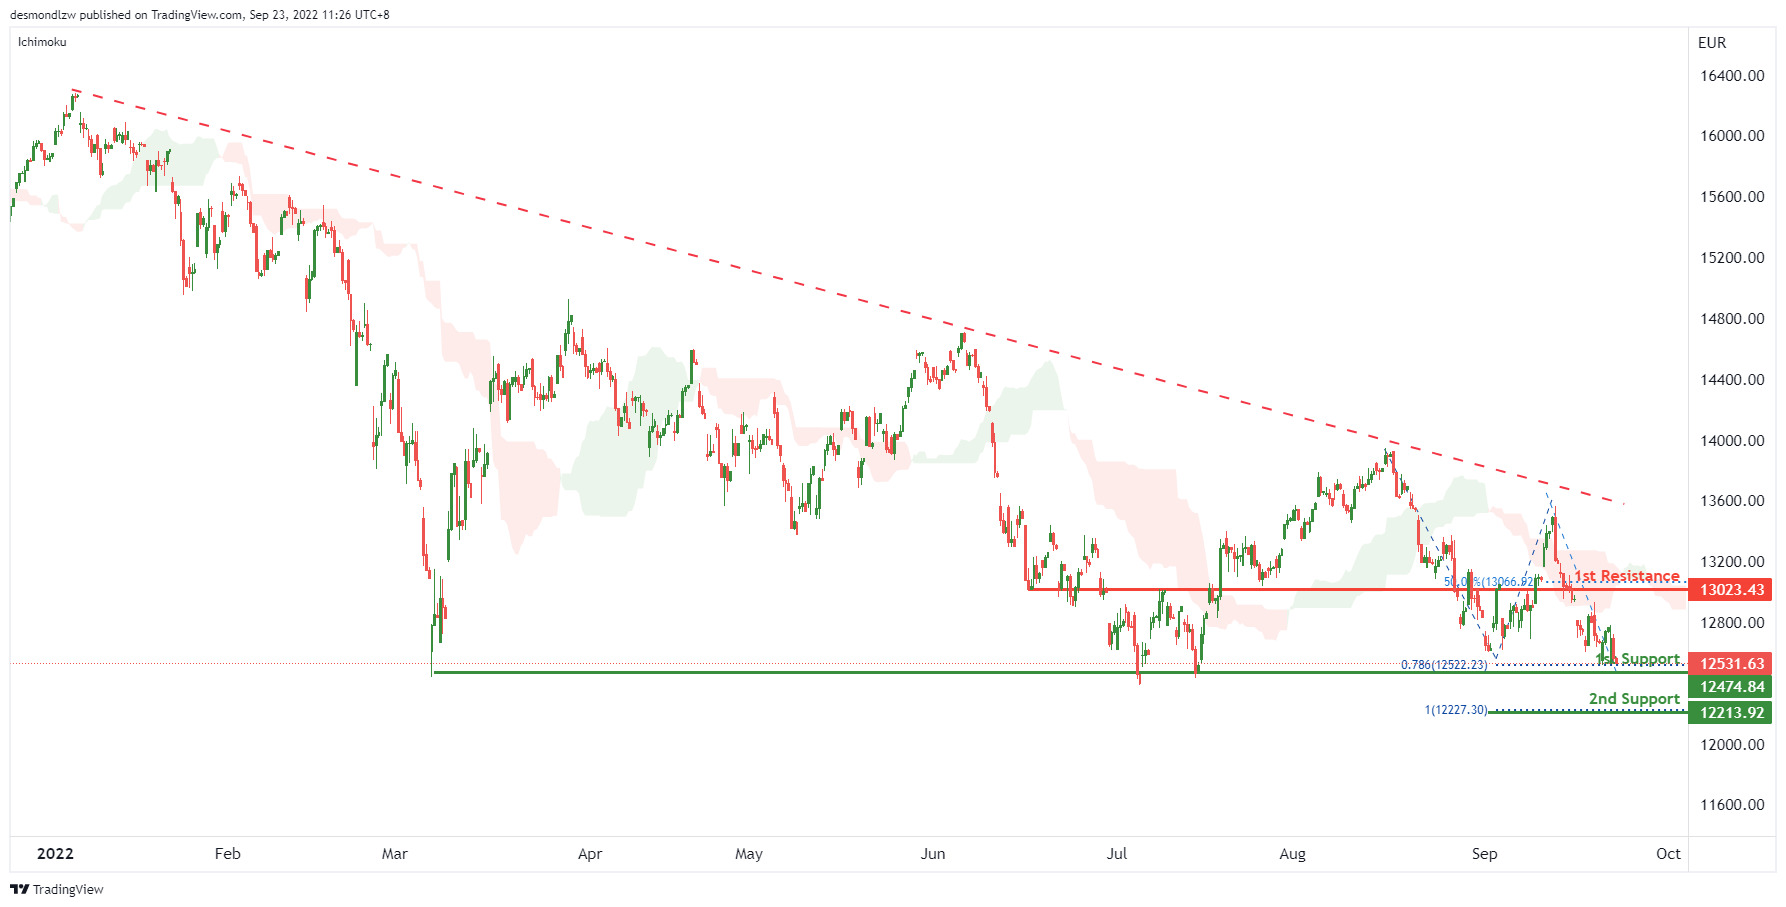
On the H4, with the price moving below the descending trendline and below ichimoku cloud, we have a bearish bias that the price may drop to the 1st support at 12474.84, which is in line with the swing lows and 78.6% fibonacci projection. If the 1st support is broken, the next support level could be at 12213.92, where the 100% fibonacci projection is. Alternatively, the price may rise to the 1st resistance at 13023.43, where the 50% fibonacci retracement and overlap resistance are.
Areas of consideration:
- H4 time frame, 1st support at 12474.84
- H4 time frame, 2nd support at 12213.92
ETHUSD:
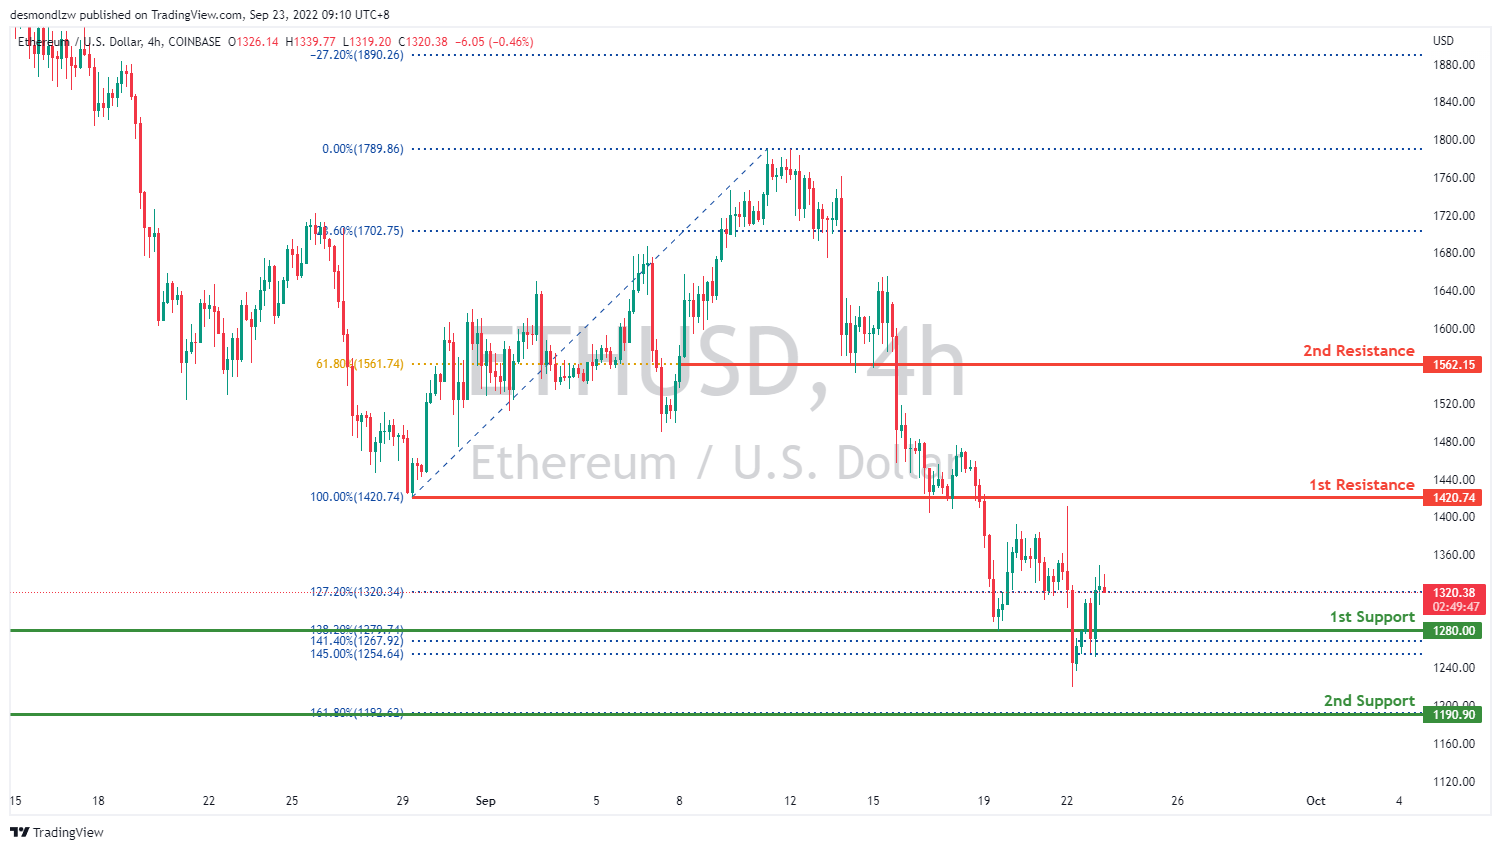
On the H4, price has reflected off the 1st Support at 1280.00 where the 138.2% Fibonacci extension line is. Price could possible head back up to the 1st resistance for retracement and then head lower back down towards the 2nd support area.
Areas of consideration:
- H4 time frame, 1st resistance of 1420.74
- H4 time frame, 1st support at 1280.00
BTCUSD:
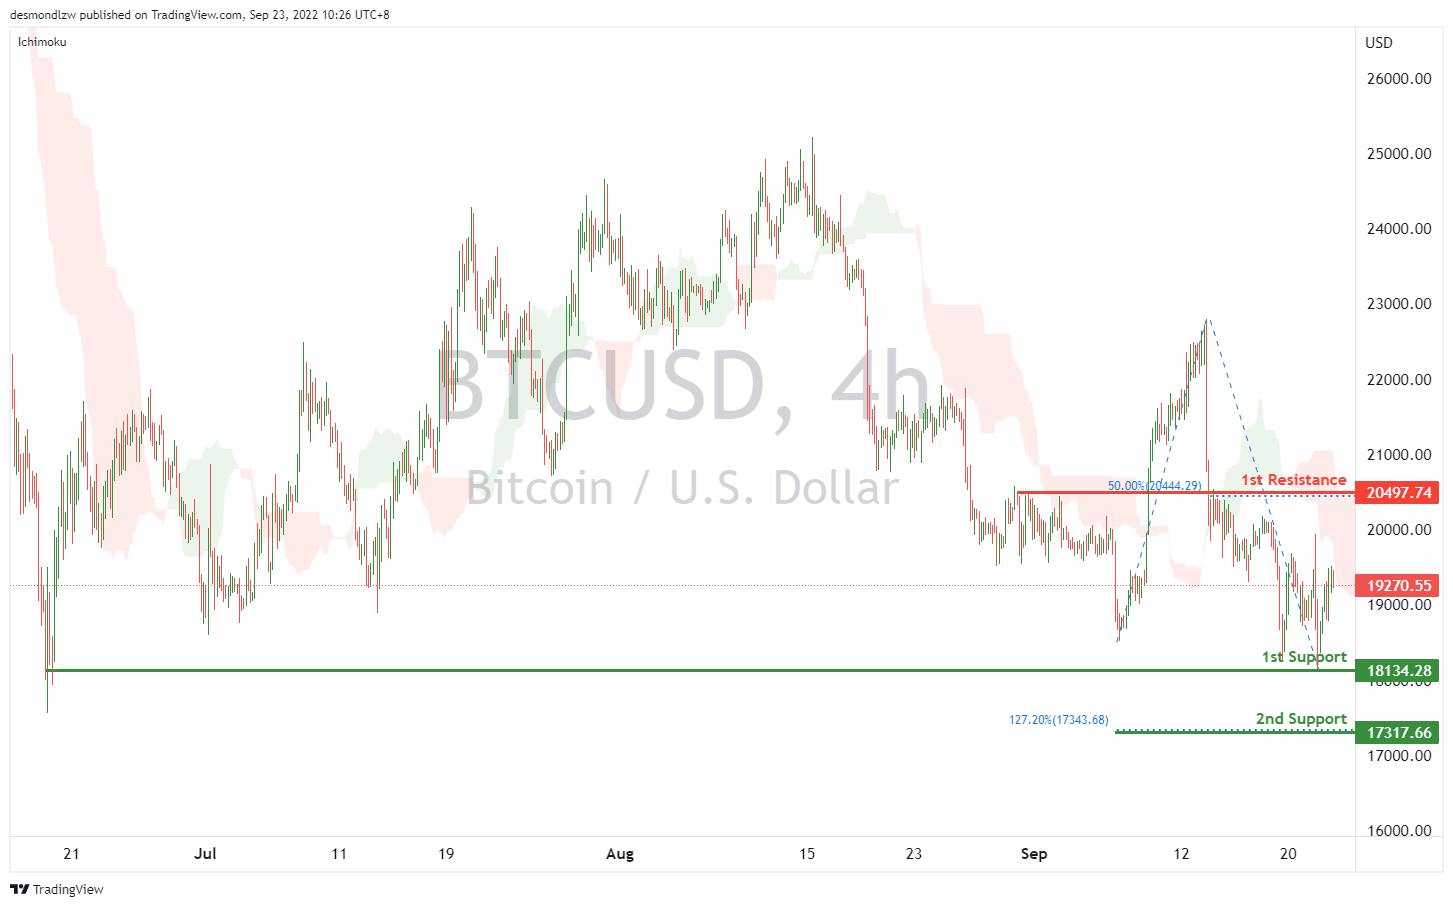
On the H4, price has reflected off the first support at 18134.28 where the previous swing low sits. Price could possibly head down to the first resistance area at 20497.74, where the 50% Fibonacci retracement is. Alternatively, the price may retest the 1st support at 18134.28, if the 1st support is broken, the 2nd support could be at 17317.66, where the 127.2% fibonacci extension is.
Areas of consideration:
- H4 time frame, current price
- H4 time frame, first resistance at 20497.74
S&P 500:
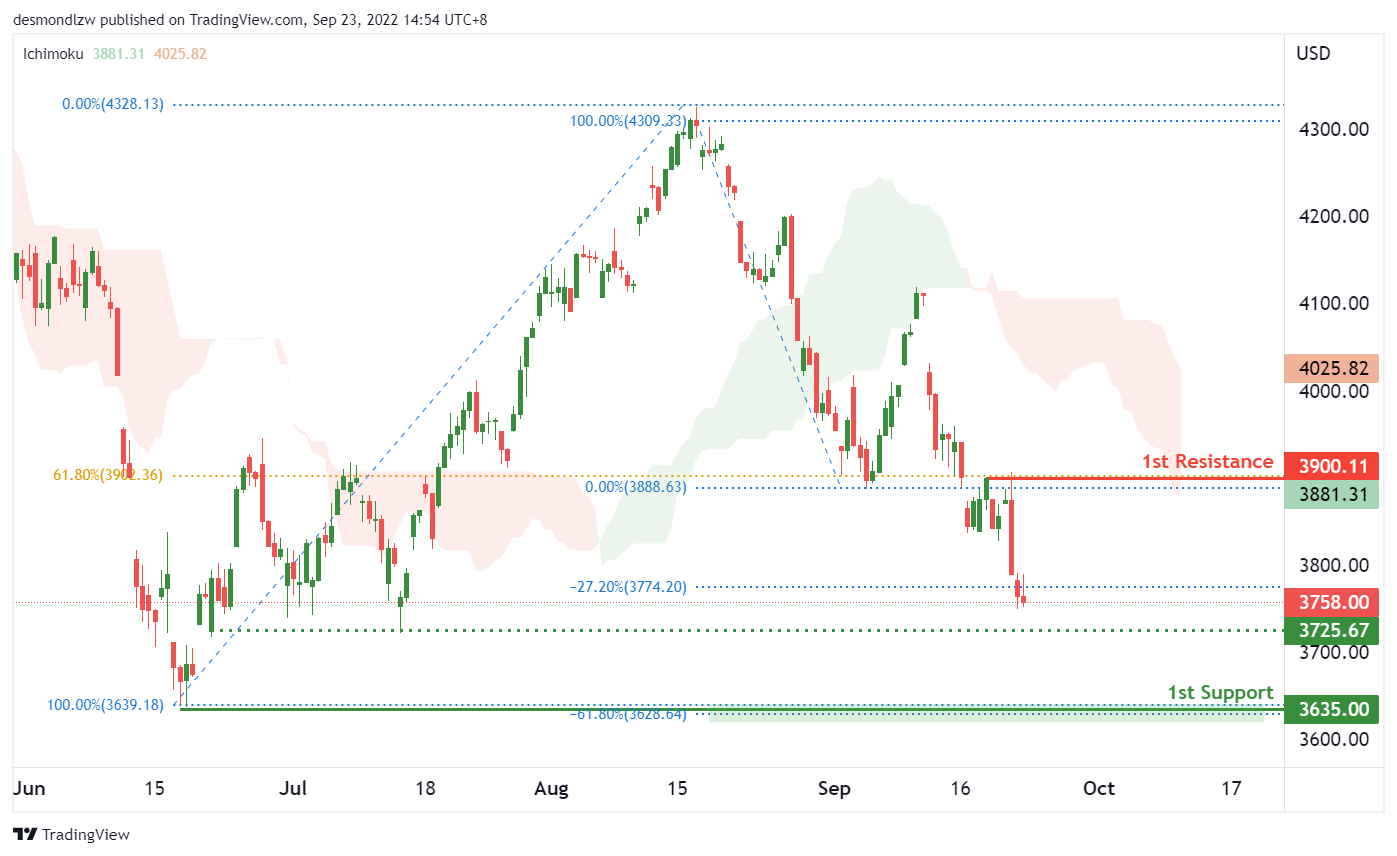
On the H4, with the price on a strong bearish trend and below the ichimoku cloud, we have a bearish bias that price may drop to the 1st support of 3635, which is in line with the -61.80% fibonacci expansion and previous swing low of June 2022. There is a risk level at 3725 which is where our intermediate support is, this level needs to be broken to trigger the next move down to our support level.
Areas of consideration:
- H4 time frame, 1st resistance at 3900
- H4 time frame, 1st support at 3635
Both US and European Indices Headed for a Retest of June Correction Low
Markets
Wednesday’s ‘hawkish’ 75 bps Fed rate hike only reinforced markets’ belief that tightening of global financial conditions still has some way to go. Other central banks including the Norges Bank (+ 50 bps), the Swiss national bank (+75%) or the Bank of England (+0.50%) mostly delivered as expected. Some in the market expected bolder BoE and/or SNB action. However, it for sure wasn’t enough to change the global interest rate dynamic. If they do less now, they probably have to do more next time… This might especially be the case for the Bank of England. The BoE in its statement indicated that at the November meeting, it will evaluate the combined fiscal measures of the new government. BoE member Haskel said that the BoE is in a difficult position with the government supporting demand in the context of a tight labour market and other supply-side constraints. UK interest rate jumped between 13.8 bps (2-y) and 18.6 bps (30-y).
Globally, it initially looked that the overall uptrend in yields could slow post-Fed, but instead it vigorously resumed as soon as US traders joined the fray. Persistent low US jobless claims weren’t the trigger, but confirmed the Fed’s view that the labour market remains tight and that it will take quite a prolonged effort to bring supply and demand in balance. US yields closed between 7.4 bps (2-y) and 18.4 bps!! (10-y) higher. The 10-y yield (3.715%) now decisively broke beyond the 3.50% area opening the way to 4.0%. The move was again driven by an impressive jump in the real yield (10-y + 14.7 bps, to 1.30%). German yields gained between 3.2 bps (30-y) and 9.7 bps (5-y). The 10-y German yield (1.96%) nears the 2.0% barrier. The sharp rise in real yields continues to hurt risk assets. The Eurostoxx lost 1.82%. The Nasdaq declined 1.37%. Both US and European indices are headed for a retest of the June correction low. On the FX market”z, the dollar took a flying start yesterday morning with the DXY setting a minor new cycle high and EUR/USD breaking below the YTD low of 0.9864. However, the USD rally was temporary blocked as the Japanese MOF stepped in to halt the free-fall of the yen. USD/JPY closed at 142 39 compared to an intraday peak of 145.9 before the intervention. USD/JPY sales temporary weighed on the USD overall, but the correction was mostly reversed later (DXY close 111.35 ; EUR/USD 0.9836). EUR/GBP closed marginally higher at 0.874.
Sentiment in Asian stays outright risk-off this morning. Japanese markets are closed. The dollar is again within striking distance of recent cycle peak levels (DXY, EUR/USD). UK GFK consumer confidence this morning was reported at new record low (-49). Later today, the EMU August preliminary PMI’s probably will drop further into contraction territory (composite expected at 48.2). Activity data, especially in Europe, recently had only limited impact on interest rate markets. Inflation prevails. We still don’t fight the trends, both in yields and in the dollar until there is a clear technical sign. EUR/USD dropping below the 0.98 handle might open the way to the 0.96 area.
News Headlines
Belgian consumer confidence plummeted from -11 to -27 in September, dropping below the Covid-lows of -26, to the weakest level since August 1985. Households expressed very serious concerns. The persistent rise in energy prices as winter approaches, galloping inflation and the geopolitical context brought about by the war in Ukraine are weighing heavily on consumer sentiment. The greatest pessimism prevails this month about how the Belgian economy as a whole will evolve over the next twelve months (-49 from -32). Expectations regarding the unemployment rate have also clearly deteriorated (36 from 16; a rise is a deterioration). On a personal front, households' expectations about their financial situation have never been so negative (-18 from -8).
GBP/JPY Daily Outlook
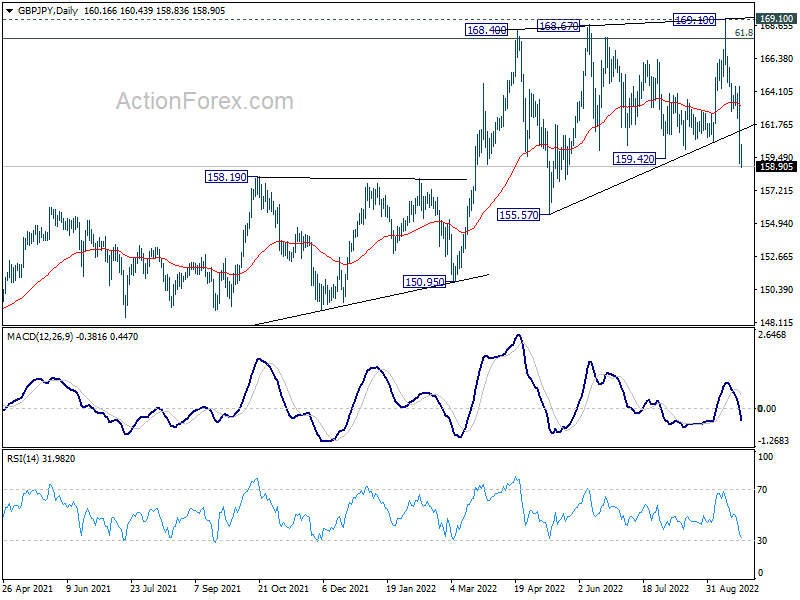
Daily Pivots: (S1) 158.13; (P) 161.29; (R1) 163.44; More...
GBP/JPY's break of 159.42 support is taken as a early sign of bearish trend reversal. Intraday bias stays on the downside for 155.57 support first. Decisive break there should confirm this bearish case. On the upside, above 162.28 minor resistance will turn intraday bias neutral first.
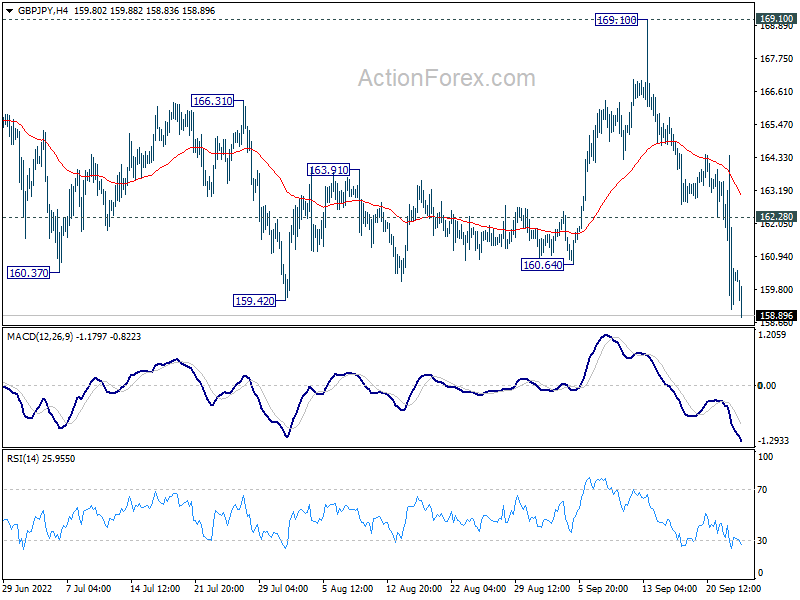
In the bigger picture, up trend from 123.94 (2020 low) is still in progress. Sustained break of 61.8% retracement of 195.86 (2015 high) to 122.75 (2016 low) at 167.93 will be a long term bullish signal, and could pave the way back to 195.86 high. However, firm break of 155.57 will confirm medium term topping, after rejection by 167.93. Outlook will be turned bearish for deeper decline.
EUR/JPY Daily Outlook
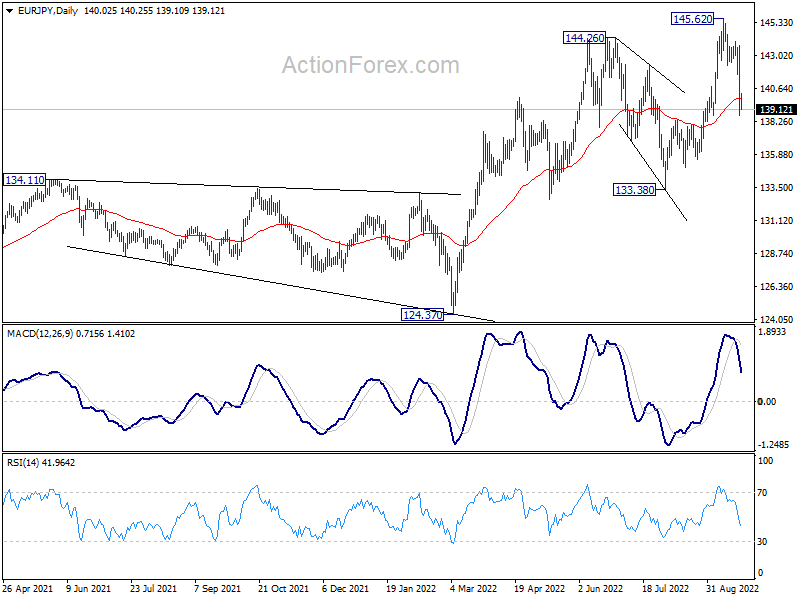
Daily Pivots: (S1) 137.93; (P) 140.82; (R1) 142.91; More....
Focus stays on 138.38 resistance turned support in EUR/JPY. Decisive break there will be an early indication of larger bearish reversal. Deeper fall would be seen to 133.38 support next. On the upside, above 142.28 minor resistance will turn bias back to the upside for retesting 145.62 high.
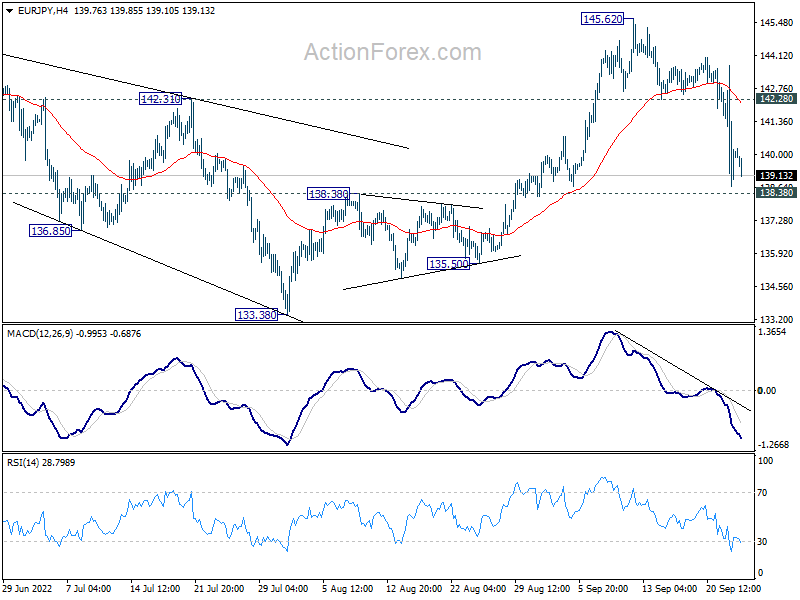
In the bigger picture, up trend from 114.42 (2020 low) is seen as the third leg of the pattern from 109.30 (2016 low). Further rally is in favor as long as 133.38 support holds. Next target is 149.76 (2015 high). However, sustained break of 133.38 will be a sign of medium term bearish reversal and turn focus to 124.37 support for confirmation.
EUR/GBP Daily Outlook
Daily Pivots: (S1) 0.8699; (P) 0.8729; (R1) 0.8767; More...
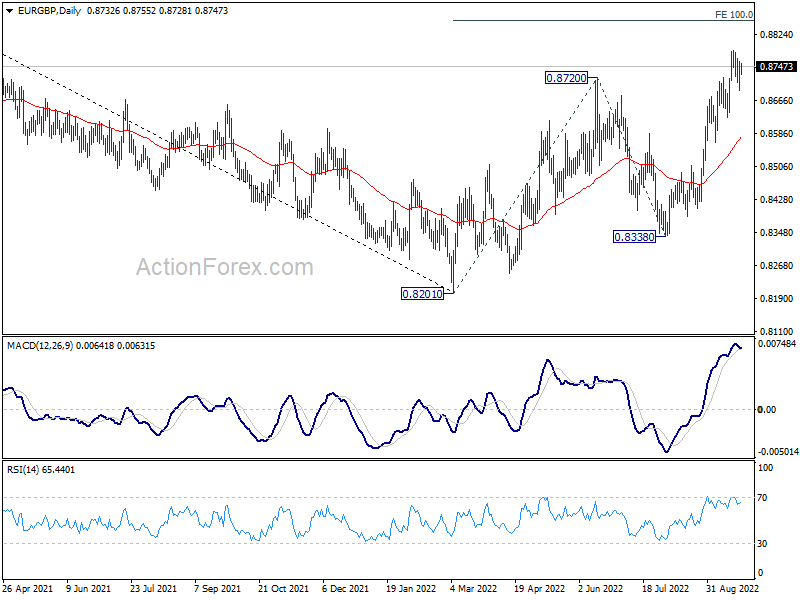
Intraday bias in EUR/GBP remains neural as consolidation from 0.8786 is still extending. Downside should be contained by 0.8624 support to bring another rally. On the upside, break of 0.8786 will resume larger rise from 0.8201 to 100% projection of 0.8201 to 0.8720 from 0.8338 at 0.8857.
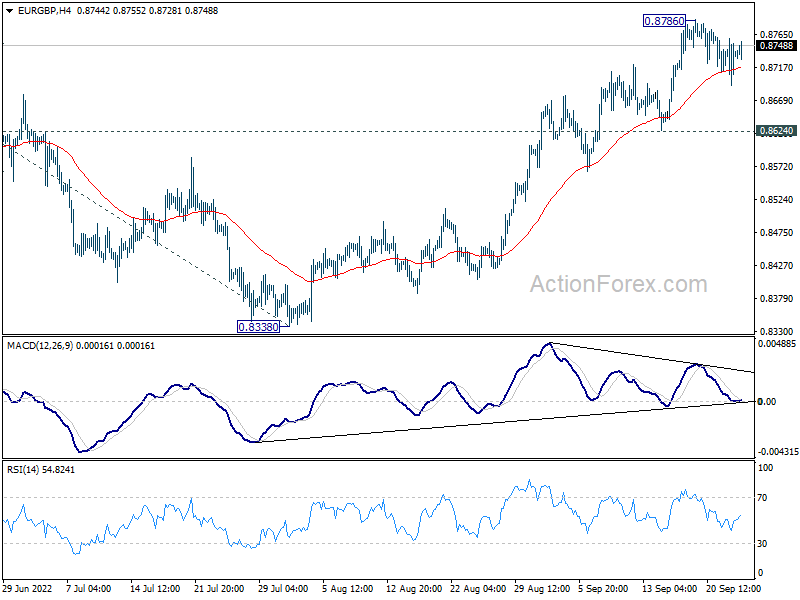
In the bigger picture, current development suggests that the down trend from 0.9499 has (2020 high) has completed at 0.8201. Rise from there is developing into a medium term up trend. Further rally would be seen to 61.8% retracement of 0.9499 to 0.8201 at 0.9003 next. This will now remain the favored case as long as 55 day EMA (now at 0.8545) holds.
EUR/AUD Daily Outlook
Daily Pivots: (S1) 1.4750; (P) 1.4846; (R1) 1.4901; More...
EUR/AUD is staying in consolidation from 1.4965 and intraday bias remains neutral first. Further rise is in favor as long as 1.4663 minor support holds. On the upside, break of 1.4965 will resume the rise from 1.4281 towards 1.5396 resistance. On the downside, however, break of 1.4663 minor support will turn bias back to the downside for retesting 1.4281 low.

In the bigger picture, down trend from 1.9799 is still in progress. Break of 1.4318 low will target 61.8% projection of 1.9799 to 1.5250 from 1.6434 at 1.3623, which is close to 1.3624 long term support (2017 low). This will remain the favored case now as long as 1.5396 resistance holds.

EUR/CHF Daily Outlook
Daily Pivots: (S1) 0.9479; (P) 0.9597; (R1) 0.9727; More....
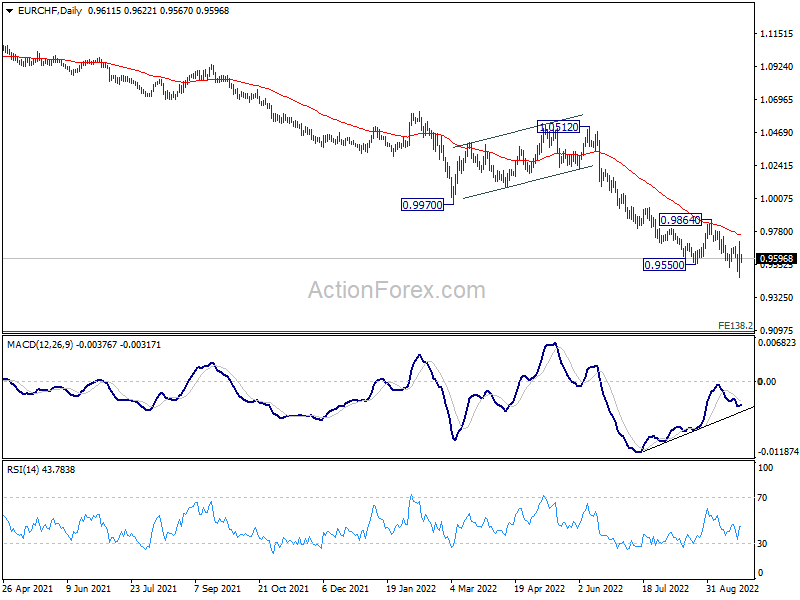
Despite edging higher to 0.9712, EUR/CHF quickly retreated. Intraday bias remains neutral first. On the upside, break of 0.94680 will bring stronger rise back to 0.9864 resistance. But overall, outlook will stays bearish as long as 0.9864 resistance holds. On the downside, below 0.9464 will resume larger down trend.
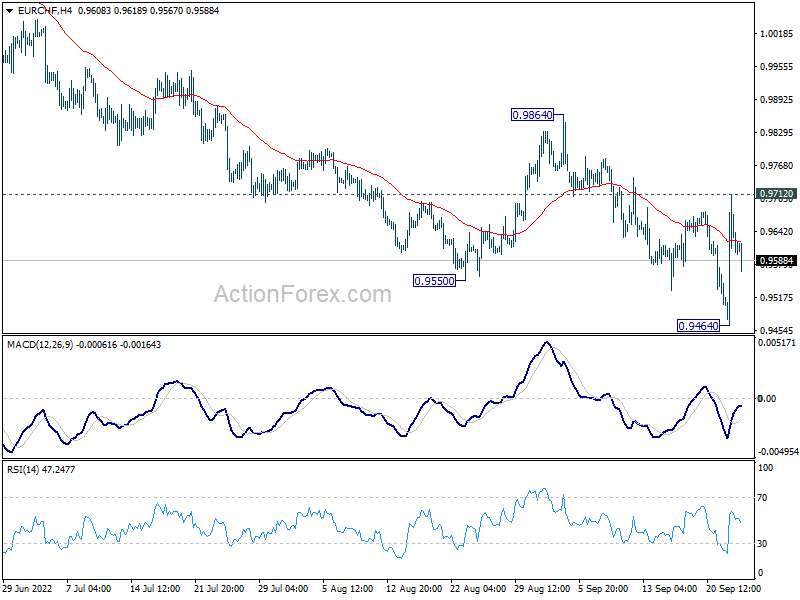
In the bigger picture, long term down trend from 1.2004 (2018 high) is still in progress. Next target is 138.2% projection of 1.2004 to 1.0505 to 1.1149 at 0.9033. On the upside, break of 0.9864 resistance is needed to be the first sign of medium term bottoming. Otherwise, outlook will stay bearish in case of strong rebound.
EUR/USD Daily Outlook
Daily Pivots: (S1) 0.9793; (P) 0.9850; (R1) 0.9891; More...
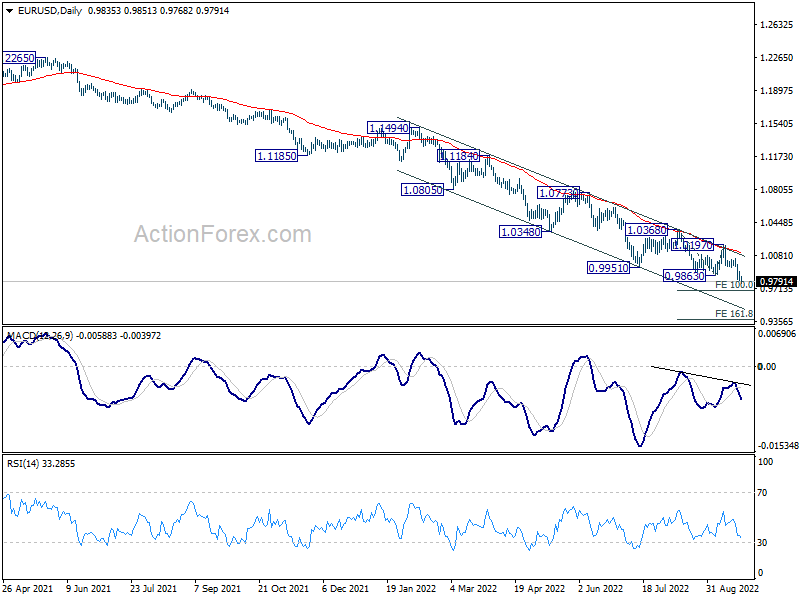
EUR/USD's decline is still in progress and intraday bias remains on the downside for 100% projection of 1.0368 to 0.9863 from 1.0197 at 0.9692. Firm break there could prompt downside acceleration and target 161.8% projection at 0.9380. On the upside, above 0.9906 minor resistance will turn intraday bias neutral first. But outlook will stay bearish as long as 1.0197 resistance holds, in case of recovery.
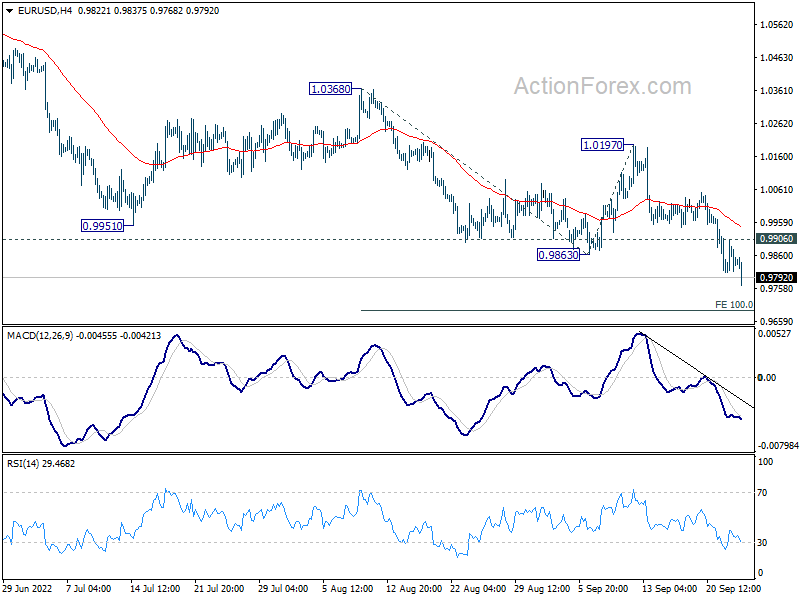
In the bigger picture, down trend from 1.6039 (2008 high) is still in progress. Next target is 100% projection of 1.3993 to 1.0339 from 1.2348 at 0.8694. In any case, break of 1.0197 resistance is needed to be the first sign of medium term bottoming. Otherwise, outlook will stay bearish even with strong rebound.
GBP/USD Daily Outlook
Daily Pivots: (S1) 1.1190; (P) 1.1277; (R1) 1.1342; More...
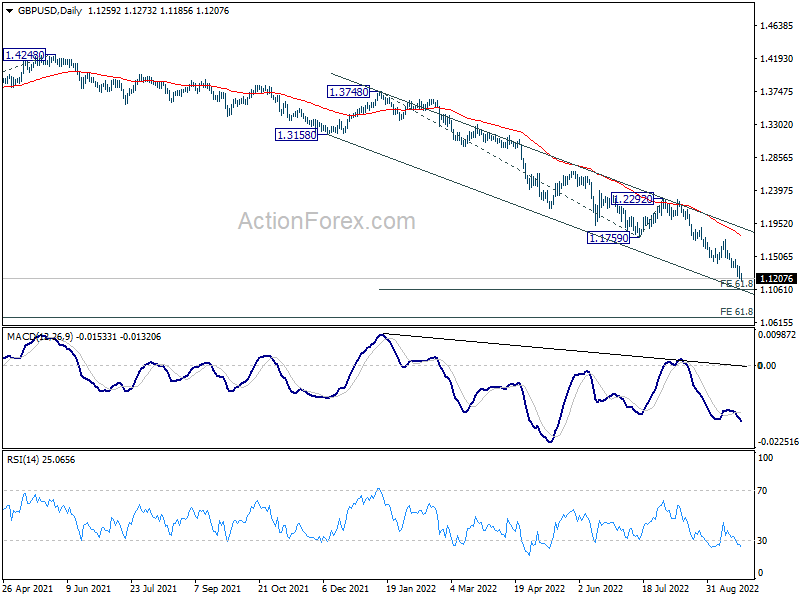
GBP/USD's decline resumed after brief recovery and intraday bias is back on the downside. Current down trend should target 61.8% projection of 1.3748 to 1.1759 from 1.2292 at 1.1063 next. On the upside, above 1.1363 minor resistance will turn intraday bias neutral again. But upside of recovery should be limited below 1.1737 resistance.
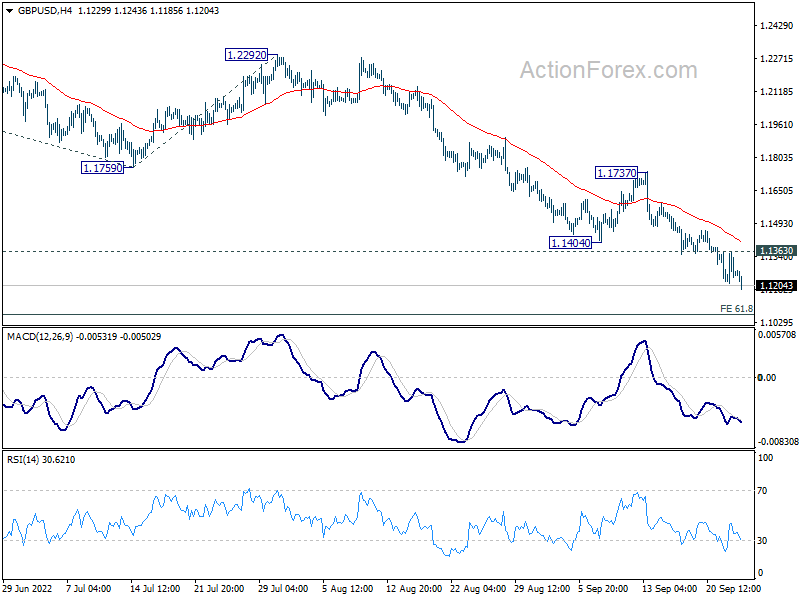
In the bigger picture, based on current momentum, fall from 1.4248 (2018 high) is probably resuming long term down trend from 2.1161 (2007 high). Sustained break of 1.1409 will target 61.8% projection of 1.7190 (2014 high) to 1.1409 (2020 low) from 1.4248 (2021 high) at 1.0675. This will remain the favored case for now as long as 1.2292 resistance holds.
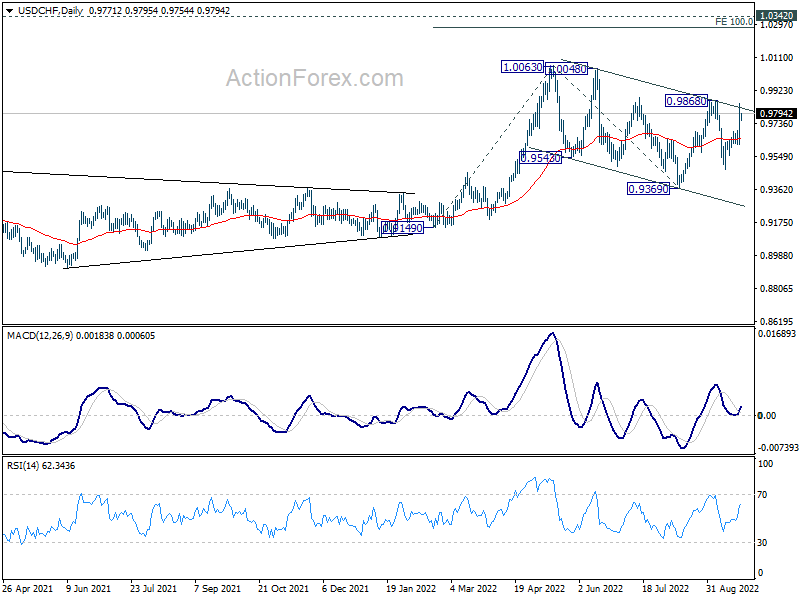
USD/CHF Daily Outlook
Daily Pivots: (S1) 0.9646; (P) 0.9748; (R1) 0.9875; More
Intraday bias in USD/CHF remains on the upside at this point. Firm break of 0.9868 resistance will argue that larger up trend is ready to resume through 1.0063. Overall, the corrective pattern from 1.0063 high could still extend. Below 0.9619 minor support will turn bias back to the downside for 0.9478 and below.
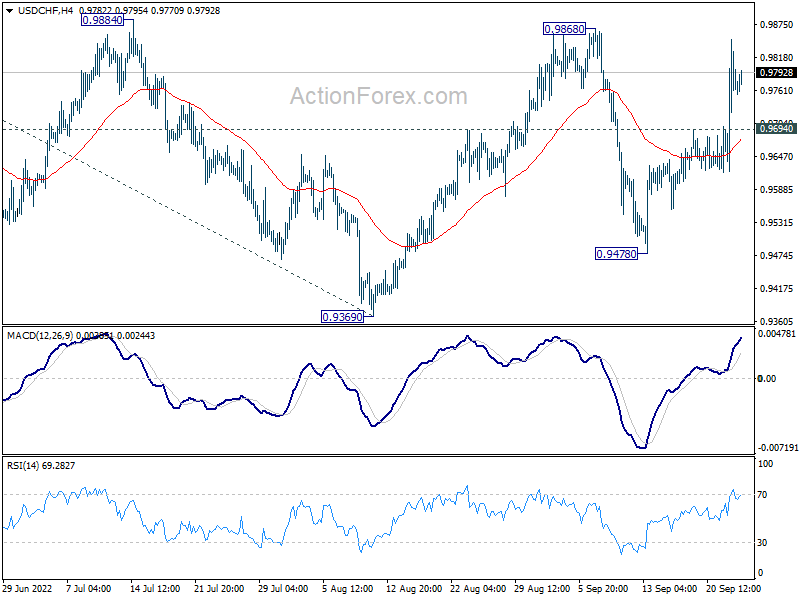
In the bigger picture, current development suggests that up trend from 0.8756 (2021 low) is still in progress. Sustained break of 1.0063 will target 100% projection of 0.9149 to 1.0063 from 0.9369 at 1.0283, and then 1.0342 (2016 high). For now, this will remain the favored case as long as 0.9369 support holds, even in case of deep pull back.