Sample Category Title
Dollar Losing Fans
- China is getting rid of US Treasury bonds.
- The president is actively promoting Kevin Warsh.
While the IMF is urging investors not to focus on the dollar's short-term weakness, EURUSD is posting its best daily gain since the end of January. According to the International Monetary Fund, the greenback will retain its power on the Forex market thanks to the size of the US economy, entrepreneurial spirit, and the depth and liquidity of the US capital market. However, confidence in the latter has been seriously shaken, which makes the outlook for the USD index bleak.
The threat to the independence of the Federal Reserve has not gone away. Donald Trump is so keen to promote his own candidate for the position of Fed chair that he is making some surprising statements. According to the president, Kevin Warsh will help boost the US economy by 15%. Over the past five decades, US GDP has grown by an average of 2.8% per year. A 15% growth rate has been extremely rare since the 1950s. The last time it happened was during the pandemic recovery, so he probably just means cumulative growth over several years.
Meanwhile, the strength of the US economy is no guarantee of a stronger dollar. The White House intends to accelerate GDP growth through aggressive rate cuts, which will undoubtedly weaken the US currency. At the same time, uncertainty surrounding Donald Trump's policies is prompting some countries to divest from Treasury bonds. Beijing's recommendation to Chinese banks not to buy these securities has catalysed a rally in Treasury yields and the EUR/USD.
Even the extremely vulnerable Pound Sterling took advantage of the dollar's weakness. The Bank of England could ease monetary policy as early as March, and a political scandal has erupted in Britain. As a result, Prime Minister Keir Starmer's position has once again become unstable. EURGBP has soared amid this political uncertainty. However, GBPUSD bulls are going on the offensive thanks to shaken confidence in the dollar.
Unlike the Pound, Gold has been unable to capitalise on the fall in the USD index. This is an alarming sign for the precious metal. This is especially true given that so-called smart money is currently on the side of the bears. Hedge funds and asset managers have reduced their net long Gold positions to their lowest since October.
Ethereum Stares into the Abyss
Market Overview
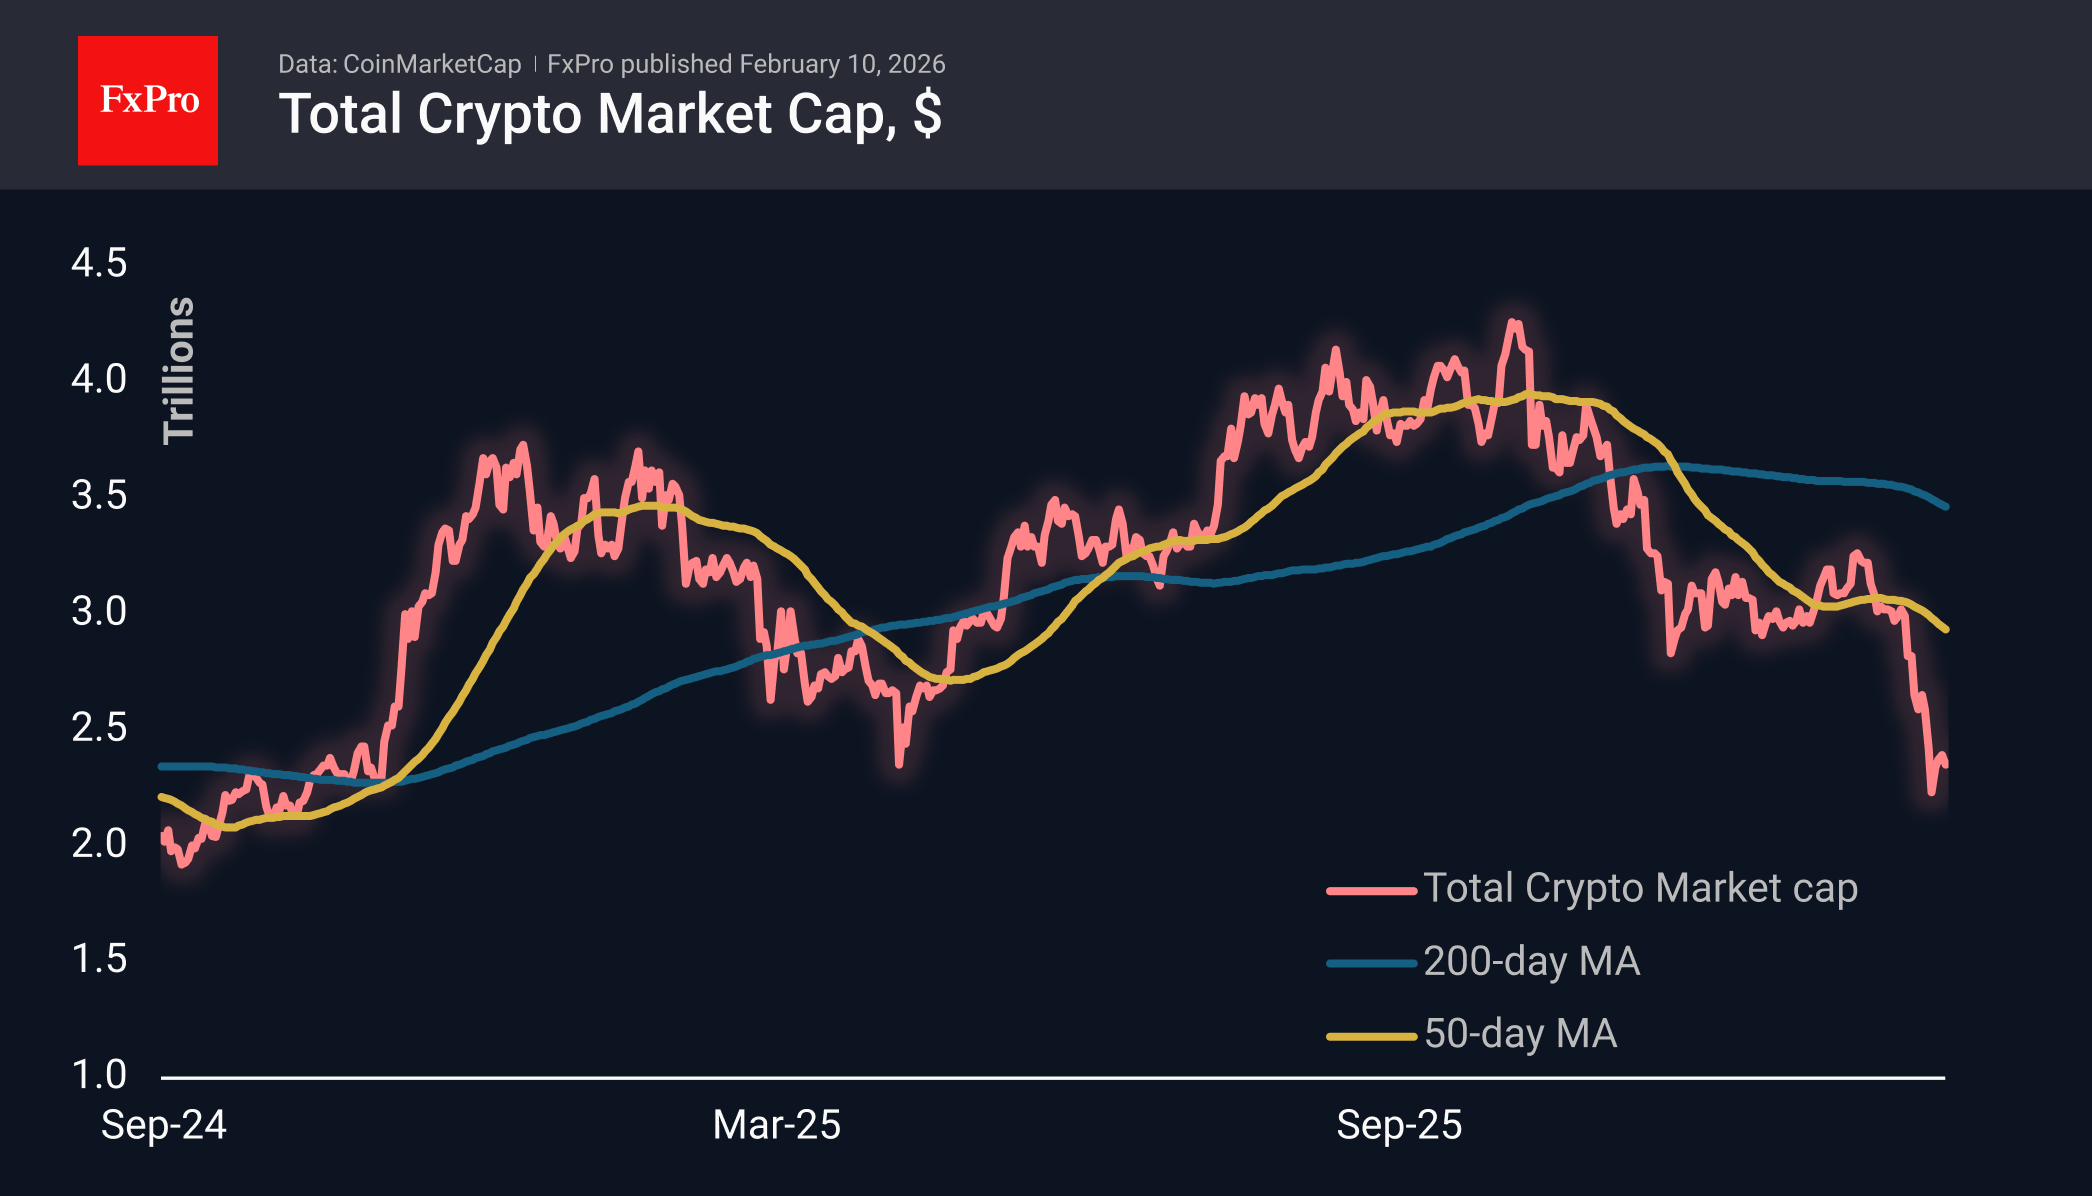
The crypto market cap fell by 1.7% to $2.35T, returning to the lower end of the range of the last three days. Cryptocurrencies remain under pressure with local resistance just above $2.40T, contrasting with the upward movement of stock indices. This divergence can be easily explained by the shift in leadership to the classic broad market economy instead of tech stocks, with which cryptocurrencies have a high correlation.
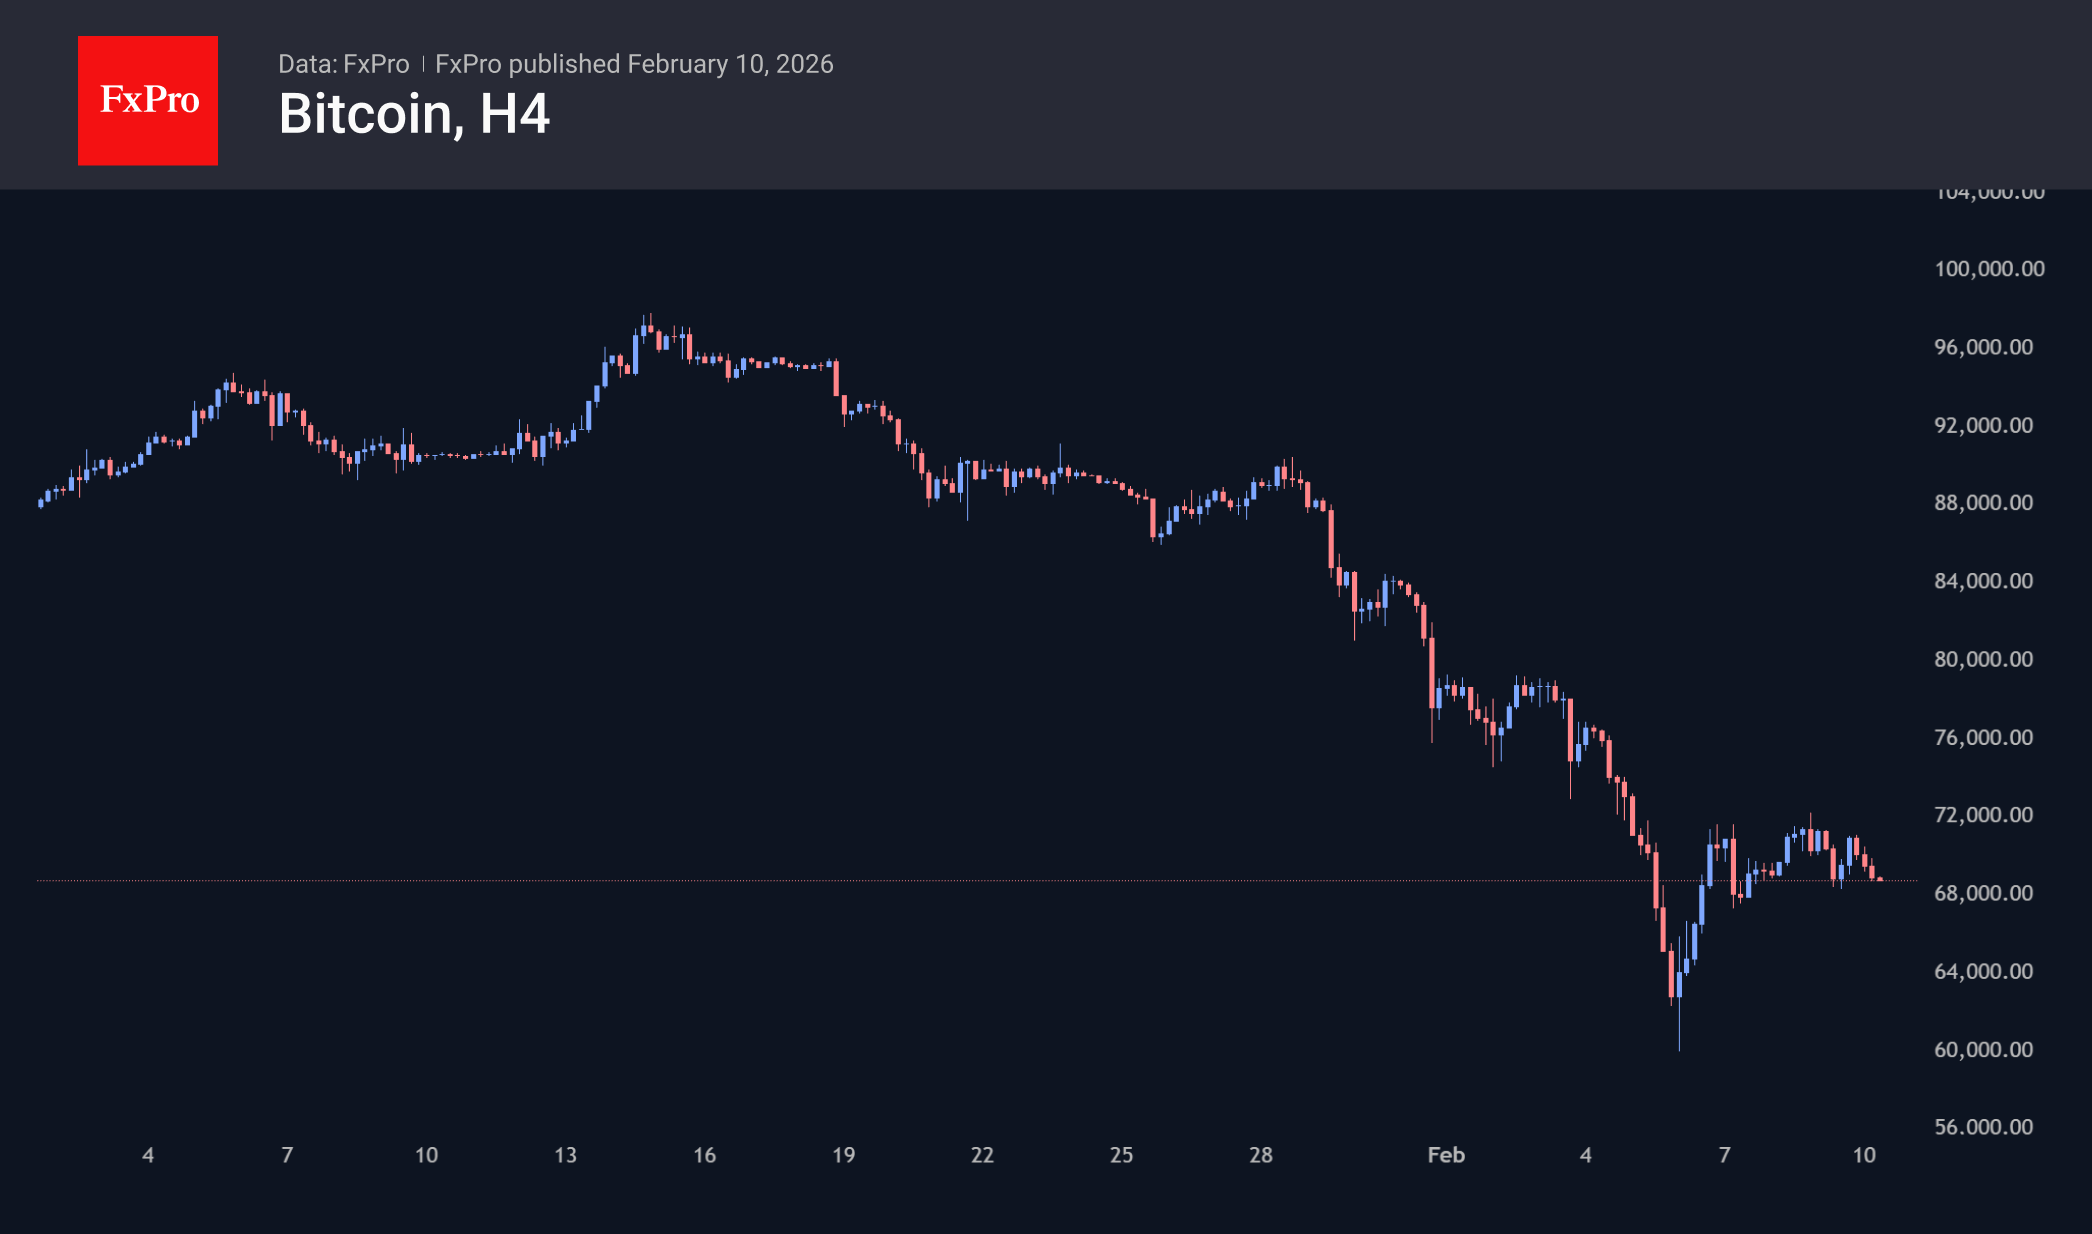
Bitcoin is losing over 2.2%, trading just below $69K. Intraday dynamics indicate a loss of recovery momentum. A possible failure below $68K will signal the end of consolidation after the rebound. Technically, this will open the way to local lows of $60-63K. At the same time, we still assume that the main scenario will be a prolonged consolidation in the $55-65K range, as this is an area of multiple extremes.
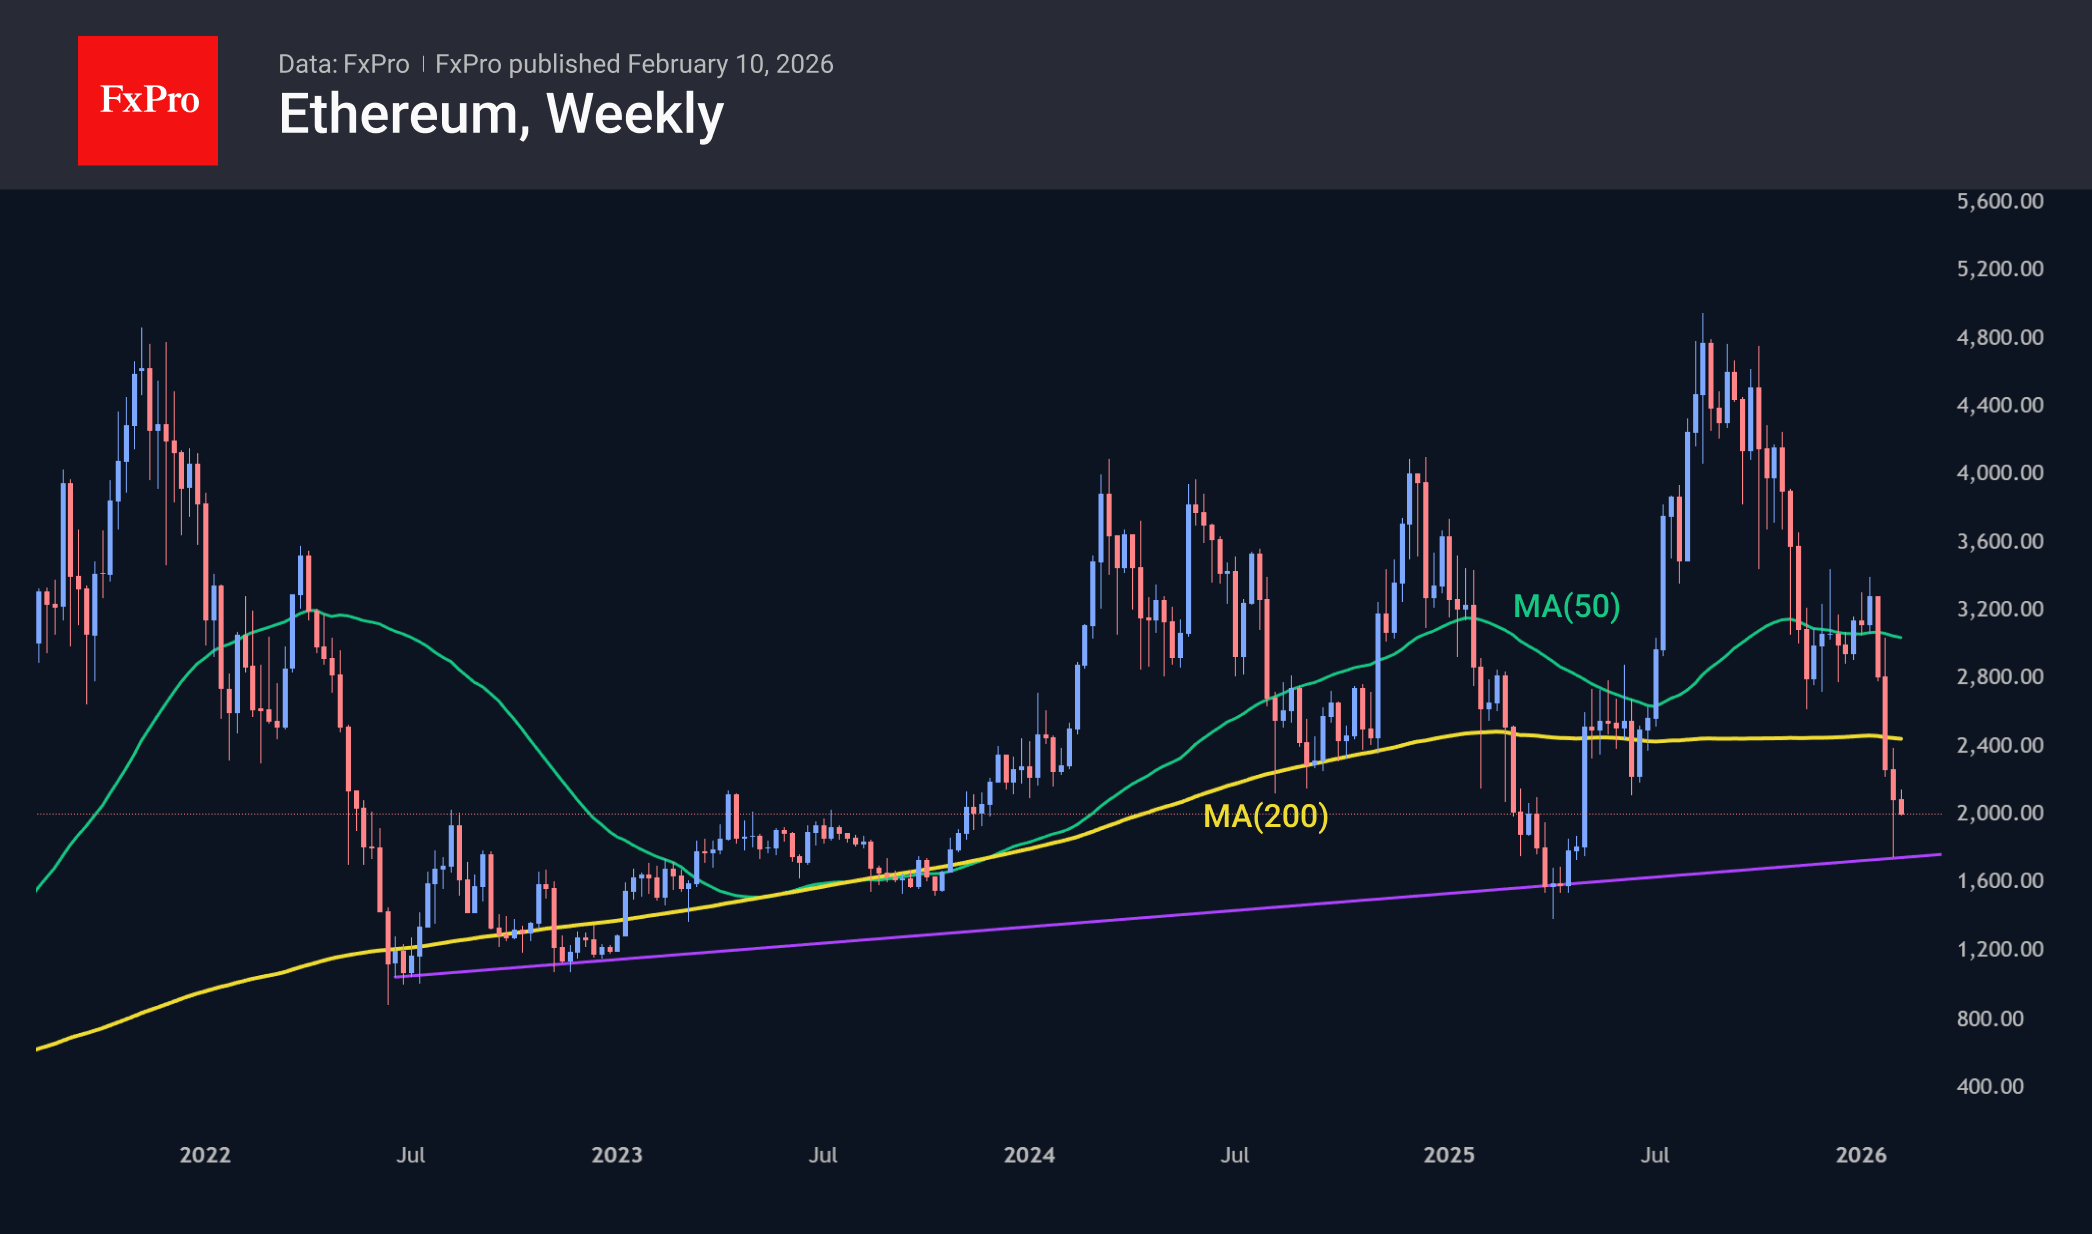
Ethereum is performing slightly worse than the market, losing about 3% and trying to hold on to levels above $2000. Over the past three weeks, the price has fallen below the 50- and 200-week moving averages, indicating a serious bearish sentiment. Last week, the second-largest cryptocurrency by market capitalisation touched the long-term support line of the last four years. A break below this line near $1,600 could trigger a dramatic capitulation of long-term buyers.
News Background
According to Google Trends, global user interest in cryptocurrencies has fallen to annual lows. Santiment describes the crowd sentiment as “fiercely bearish.”
The Sharpe ratio for Bitcoin fell to minus 10, to its lowest since March 2023, indicating the final stage of a bear market, according to CryptoQuant. Similar values were recorded at the bottom of the cycles at the end of 2018 and 2022. However, the final phase could last for several months.
Bitwise calls the recent drop in Bitcoin a chance for new investors to buy more coins.
The current drawdown is the weakest in the history of the bear market and reflects only a crisis of confidence among market participants, rather than fundamental problems with the asset, Bernstein notes. Analysts have confirmed their long-term forecast for Bitcoin, with a target price of $150K by the end of 2026.
According to Jefferies, Tether’s gold reserves reached 148 tons, with an estimated value of $23 billion. The issuer of the USDT stablecoin entered the top 30 largest gold owners in the world, purchasing 26 tons of the precious metal in the fourth quarter and adding another 6 tons in January.
USD/JPY Drops by More Than 1% At the Start of the Week
As the USD/JPY chart shows, the pair has been exhibiting bearish momentum since the beginning of the week. This move has been driven by a combination of factors:
- → Yen strength on political news. Prime Minister Sanae Takaichi secured a decisive victory in Sunday’s snap election (8 February), winning a parliamentary majority. Although Takaichi has pledged large-scale fiscal stimulus of around ¥21 trillion, the prospect of increased money printing has not weakened the currency, as the market may (a) welcome political stability and (b) believe that the Bank of Japan will be forced to respond to inflation by raising interest rates.
- → US dollar weakness ahead of economic data releases. This reflects market sentiment ahead of labour market data due on Wednesday and the CPI report scheduled for Friday. In addition, the dollar’s status has come under pressure after Chinese regulators reportedly recommended limiting investments in US Treasuries.
On 26 January, when analysing fluctuations in the dollar–yen exchange rate, we:
- → noted that the long-term ascending channel had been broken near the 157.700 level;
- → constructed a parallel channel below and suggested that, following the sharp drop in USD/JPY (triggered by the possibility of coordinated currency intervention by the Bank of Japan and the Federal Reserve), a rebound could occur.
Indeed, since then (as indicated by the arrow):
- → on 28 January, the market formed a low slightly below the lower boundary of the parallel channel;
- → the pair subsequently rebounded towards the 157.700 level.
Technical Analysis of the USD/JPY Chart
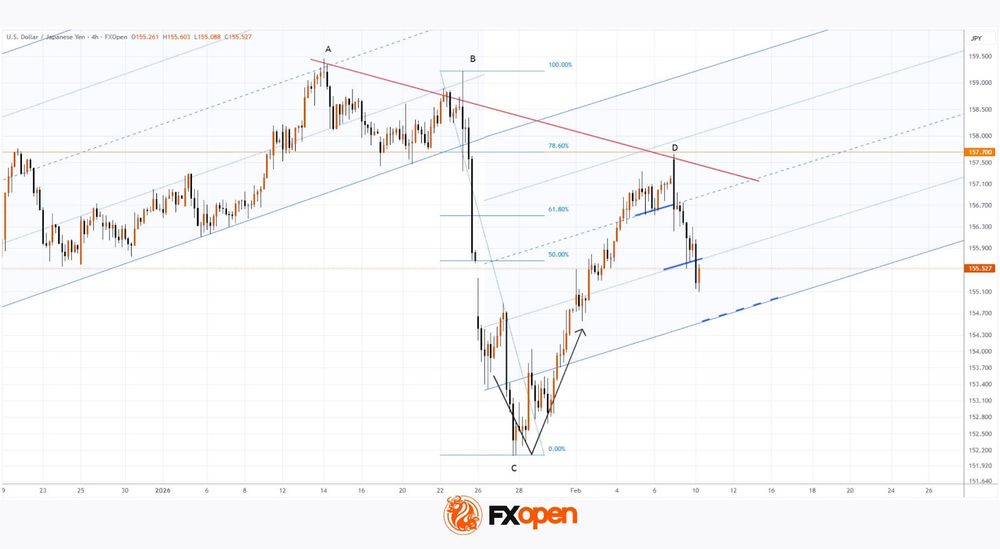
The bearish tone of the current week allows us to highlight the following:
- → local support levels of the parallel channel (shown by thick blue lines) have been broken, and bulls may now have to rely on its lower boundary;
- → lower highs A–B–D have formed on the USD/JPY chart, with a bearish trend line drawn through them.
In this context, it is reasonable to assume that:
- → the sharp B→C impulse has disrupted the market’s multi-month bullish structure;
- → the C→D recovery (towards the 78.6% Fibonacci level) was an interim move within a broader bearish reversal.
The ability of the red A–B–D trend line to remain relevant over time would further support this hypothesis.
Trade over 50 forex markets 24 hours a day with FXOpen. Take advantage of low commissions, deep liquidity, and spreads from 0.0 pips (additional fees may apply). Open your FXOpen account now or learn more about trading forex with FXOpen.
This article represents the opinion of the Companies operating under the FXOpen brand only. It is not to be construed as an offer, solicitation, or recommendation with respect to products and services provided by the Companies operating under the FXOpen brand, nor is it to be considered financial advice.
EUR/USD Set for Growth: Dollar Fears Demand Slump
EUR/USD rose to 1.1911 on Tuesday. Pressure on the USD increased amid concerns that external demand for dollar-denominated assets could decline significantly.
The reason behind this shift was reports suggesting that Chinese regulators have advised financial institutions to reduce their holdings of US government bonds. This move could help diversify risks and mitigate the impact of uncertain US economic policies.
Investors are awaiting delayed reports on the US labour market and inflation this week. These figures could adjust expectations regarding the Federal Reserve’s future policy direction.
White House economic adviser Kevin Hassett noted that the pace of US employment growth may slow in the coming months due to weaker labour and productivity growth.
The Fed is expected to leave interest rates unchanged in March, with markets still pricing in two rate cuts for the remainder of the year.
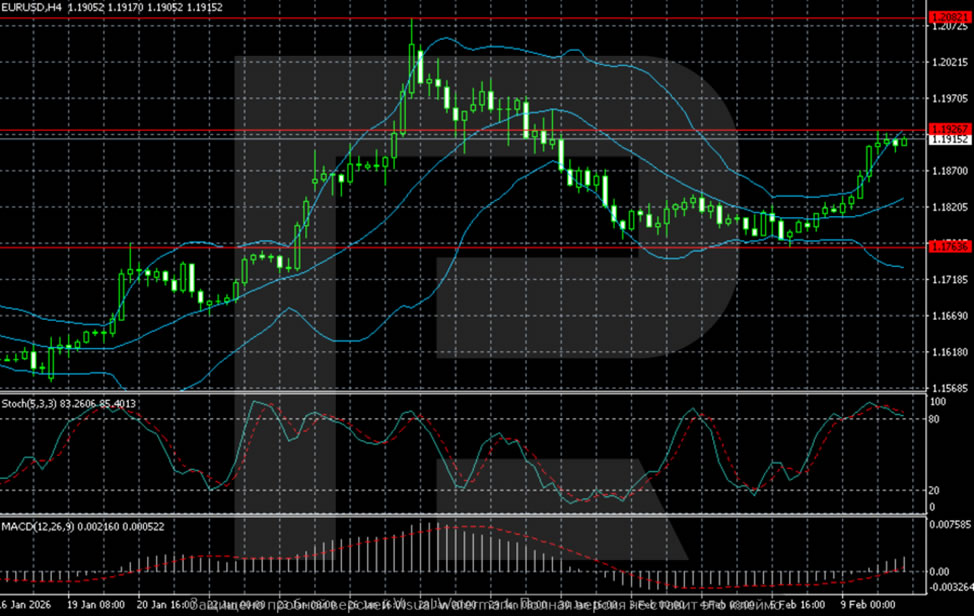
Technical Analysis
On the H4 chart for EUR/USD, after a momentum rally in late January, the pair entered a phase of correction and consolidation. The price has recovered above the 1.1760 support level and is now testing the 1.1920-1.1950 area. The Bollinger Bands are narrowing, indicating stabilisation and preparation for the next move. The medium-term structure remains moderately bullish as long as prices stay above 1.1760.
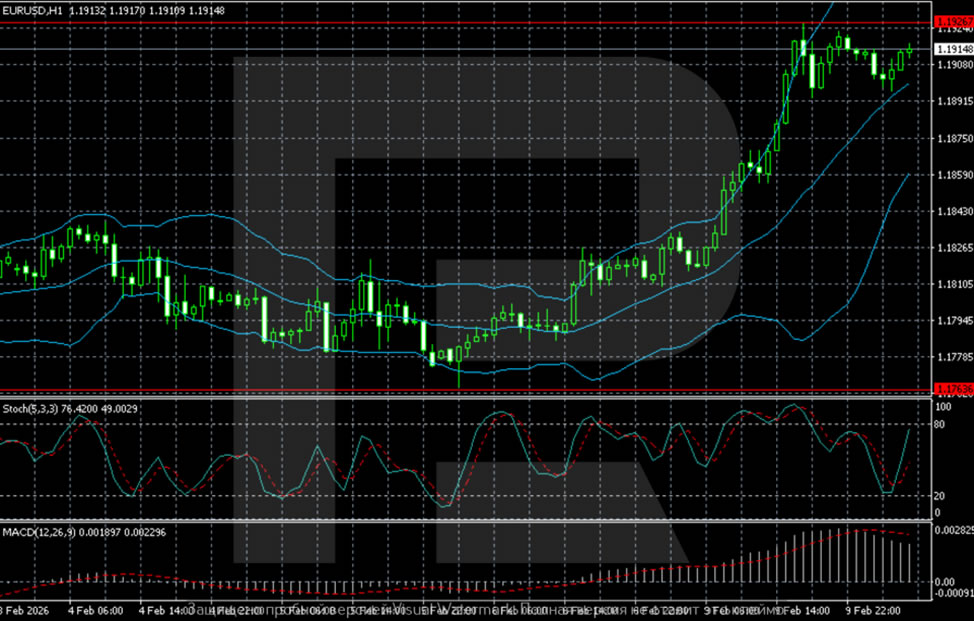
On the shorter-term H1 time frame, upward momentum remains confined to the short term. The price is moving along the upper Bollinger band after a sharp upward acceleration. It is now consolidating just below resistance at 1.1920-1.1950. Oscillators are in the overbought zone, raising the risk of a pause or shallow pullback, although the overall structure remains intact.
Conclusion
EUR/USD is poised for gains, driven by concerns about USD demand and a cautious outlook for US economic growth. While short-term fluctuations are expected, the medium-term trend remains bullish as long as key support levels hold. Investors will be closely watching upcoming data on inflation and employment, which could influence future Federal Reserve policy decisions.
Starmer Lives to Fight Another Day
Markets
Keir Starmer lives to fight another day. The embattled UK prime minister drew support from several key ministers yesterday and said he would not step away. Starmer resigning in the very short term, and thereby paving the way for a successor with unknown fiscal credentials, became less likely. Speculation rose to a high when the Scottish Labour leader Anas Sarwar called for Starmer’s exit. But calm returned in the pound and gilts after health secretary Wes Streeting said this was not necessary. Streeting has long been considered a contender for the Labour leadership. His name also emerged as the linchpin in late last year’s leadership plot. Long-term gilt yields pared gains (risk premia) of more than 9 bps to no more than 1.5 bps. EUR/GBP backed away from intraday highs around 0.874 to finish just shy of the 0.87 big figure. GBP/USD jumped to 1.37 from 1.36 with general dollar weakness helping the move higher. Greenback depreciation kicked in after reports from Chinese regulators instructing banks to trim US Treasury exposure, even though the officials made clear it had nothing to do with (geo)politics or a fundamental confidence loss. The director of the US National Economic Council Kevin Hassett extended the downleg by warning for slightly smaller jobs numbers in Wednesday’s delayed payrolls report. Him adding that this is consistent with higher GDP growth due to a productivity increase got lost in the market. DXY slid to sub 97 & EUR/USD rose beyond 1.19. USD/JPY fell from as high as 157.76 to 155.88 with markets taking the landslide victory of PM Takaichi’s LDP in snap elections well. Core bonds traded with a minor positive bias. The US curve bull steepened with net daily changes varying between -1.2 bps (2-yr) to +0.7 bps (30-yr). German Bunds marginally underperformed. Stock markets in the US and Europe started the week in good spirits.
Some of yesterday’s storylines are still setting the tone for Asian dealings today. Japanese long term bonds surge, pushing yields at the 30-yr and 40-yr tenor 6-8 bps lower. It follows a speech from Takaichi after Japanese closing hours yesterday in which she sought to ease fiscal concerns. The yen’s rebound stretches into a second day. USD/JPY further unwinds the pre-election rally by dropping to 155.37. We’re also seeing some more fall-out from the Chinese report on the USD/CNY cross rate. At 6.91 the pair is trading at the weakest level since April 2023. We remain cautious on the dollar today. Last week’s US economic data exposed vulnerability. Today’s batch (ADP, retail sales) is unlikely to change that going into the payrolls and with Fed’s Waller and Hassett’s comments in mind. The front-end of the US curve may outperform.
News and views
Earnings, job loss and job finding expectations improved modestly in the New York Fed’s January consumer expectations survey. Inflation expectations are easing short-term, while holding unchanged at medium- and longer-term horizons. For the one-year ahead inflation expectations declined 0.3 ppts to 3.1%. They remained stay at 3% for the three and five-year horizon. Median one-year-ahead earnings growth expectations increased 0.2% to 2.7%, driven by those with a household income under $50.000. The mean perceived probability of losing one’s job in the year ahead decreased 0.4% to 14.8%,but stays slightly above the trailing average. The perceived probability of finding a job in the next three months if one’s current job was lost, rose by 2.5 ppts to 45.6%, but also remained below the trailing 12-month average (48.6%). Perceptions about households’ current financial situations and expectations about households’ financial situations deteriorated, with a smaller share expecting to be better off a year from now and a larger share expecting to be worse off.
January retail sales data as published by the British Retail Consortium (BRC) showed an improvement in sales momentum at the start of the year. Total retail sales were up 2.7% Y/Y improving from a (disappointing) December performance (1.2%). The January figure was also a above the 12 month average (2.3%). Food sales improved from 3.1% to 3.8%, returning to the 12 month average. Non-Food sales gained 1.7% Y/Y from a 0.3% Y/Y decline in December. Same store sales also improved from 1.0% Y/Y to 2.3%, the best reading since August of last year.
GBP/JPY Daily Outlook
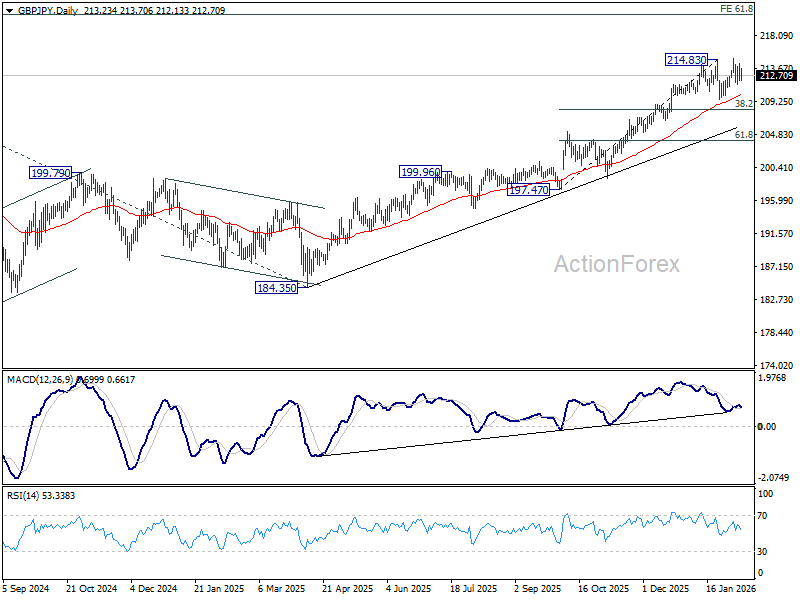
Daily Pivots: (S1) 212.26; (P) 213.37; (R1) 214.60; More...
Intraday bias in GBP/JPY remains neutral for the moment. Below 211.57 minor support will extend the corrective pattern from 214.83 with another downleg, towards 209.61 and below. But downside 38.2% retracement of 197.47 to 214.83 at 208.19 to bring rebound. Meanwhile, firm break of 214.83/98 will extend larger up trend to 220.90 projection level next.
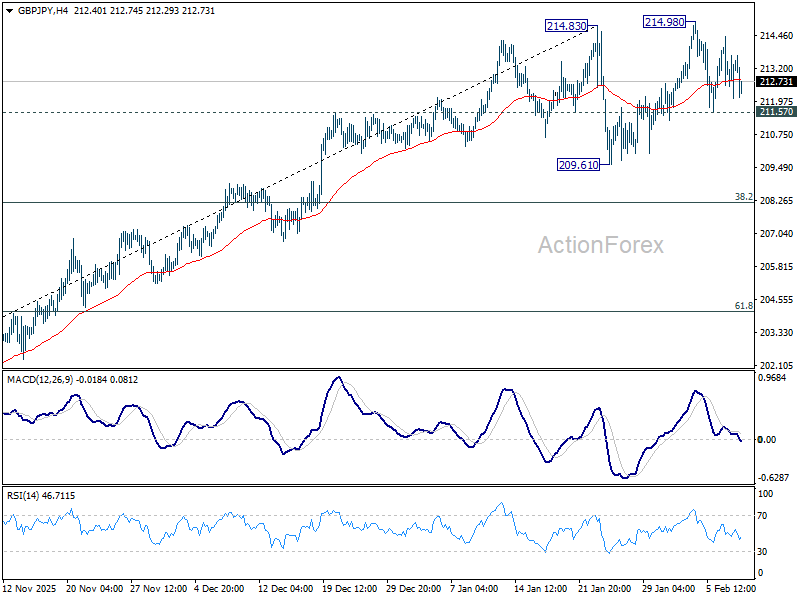
In the bigger picture, up trend from 123.94 (2020 low) is in progress. Next target is 61.8% projection of 148.93 (2022 low) to 208.09 (2024 high) from 184.35 at 220.90. On the downside, break of 205.30 resistance turned support is needed to indicate medium term topping. Otherwise, outlook will stay bullish even in case of deep pullback.
EUR/JPY Daily Outlook
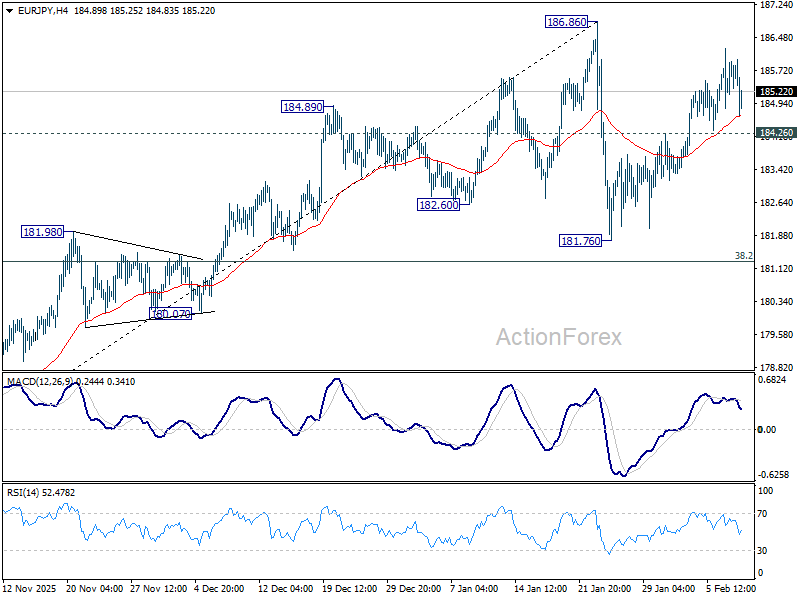
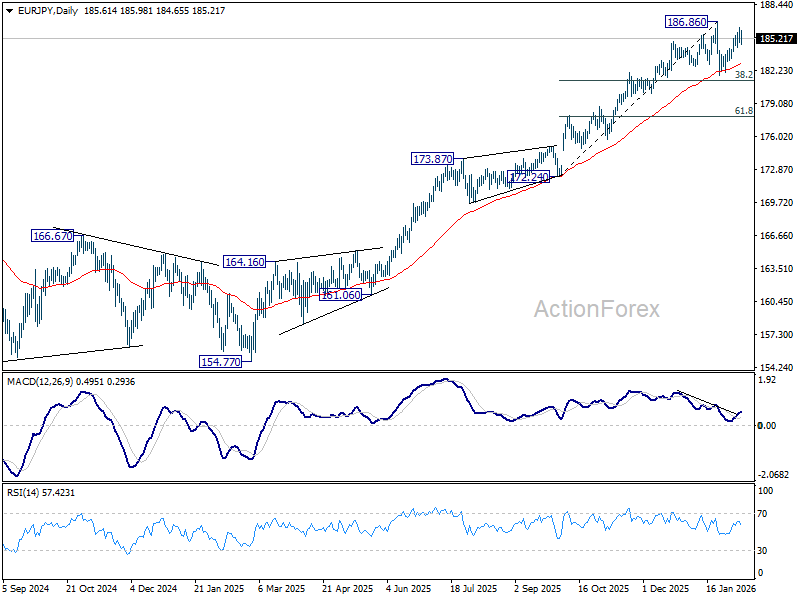
Daily Pivots: (S1) 185.00; (P) 185.63; (R1) 186.39; More...
EUR/JPY retreated ahead of 186.86 resistance and intraday bias remains neutral first. On the downside, below 184.26 minor support will extend the corrective pattern from 186.86 with another downleg, towards 181.76. But downside should be contained by 38.2% retracement of 172.24 to 186.86 at 181.27 to bring rebound. On the upside, decisive break of 186.86 will resume larger up trend.
In the bigger picture, up trend from 114.42 (2020 low) is in progress. Upside momentum has been diminishing as seen in bearish divergence condition in D MACD. But there is not clear sign of topping yet. On resumption, next target is 78.6% projection of 124.37 to 175.41 from 154.77 at 194.88 next. Meanwhile, outlook will stay bullish as long as 55 W EMA (now at 174.22) holds, even in case of deep pullback.
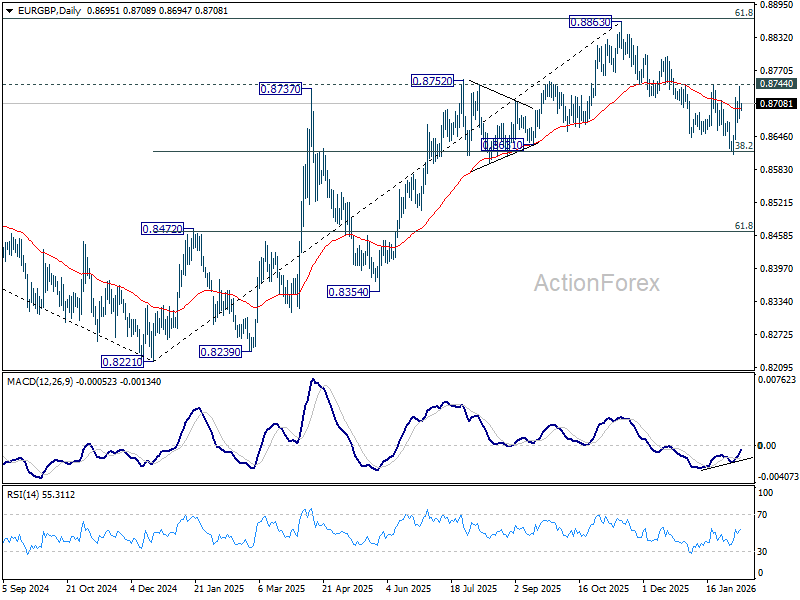
EUR/GBP Daily Outlook
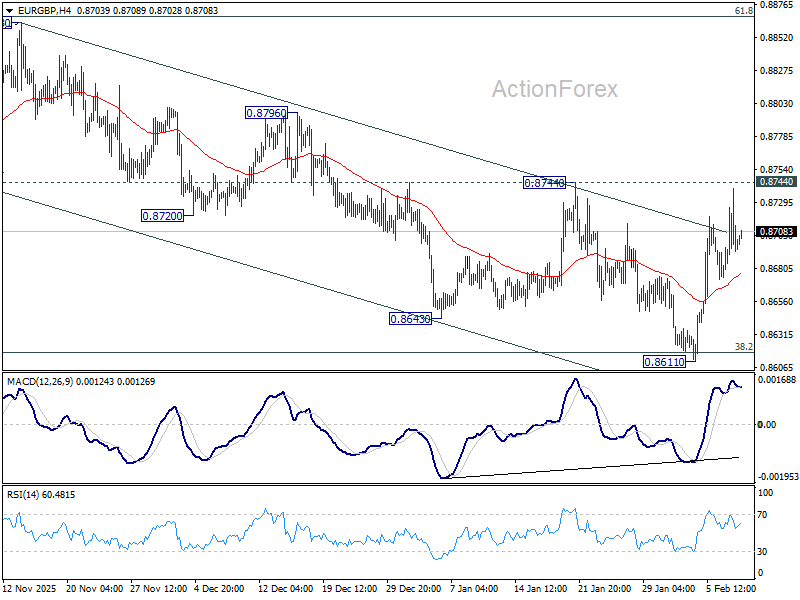
Daily Pivots: (S1) 0.8673; (P) 0.8708; (R1) 0.8733; More…
EUR/GBP is still limited below 0.8744 resistance despite extended rebound. Intraday bias remains neutral first On the upside, firm break of 0.8744 resistance will argue that fall from 0.8863 has completed at 0.8611 as a correction. Further rally should be seen back to retest 0.8863 high. On the downside, sustained break of 38.2% retracement of 0.8221 to 0.8663 at 0.8618 will carry larger bearish implications and turn outlook bearish.
In the bigger picture, rise from 0.8221 medium term bottom (2024 low) is seen as a corrective move. Upside should be limited by 61.8% retracement of 0.9267 to 0.8221 at 0.8867. Sustained trading below 55 W EMA (now at 0.8629) should confirm that this corrective bounce has completed. In this case, deeper fall would be seen back to 0.8201/21 key support zone. However, decisive break of 0.8867 will suggest that EUR/GBP is already reversing whole decline from 0.9267 (2022 high). That should pave the way back to 0.9267.
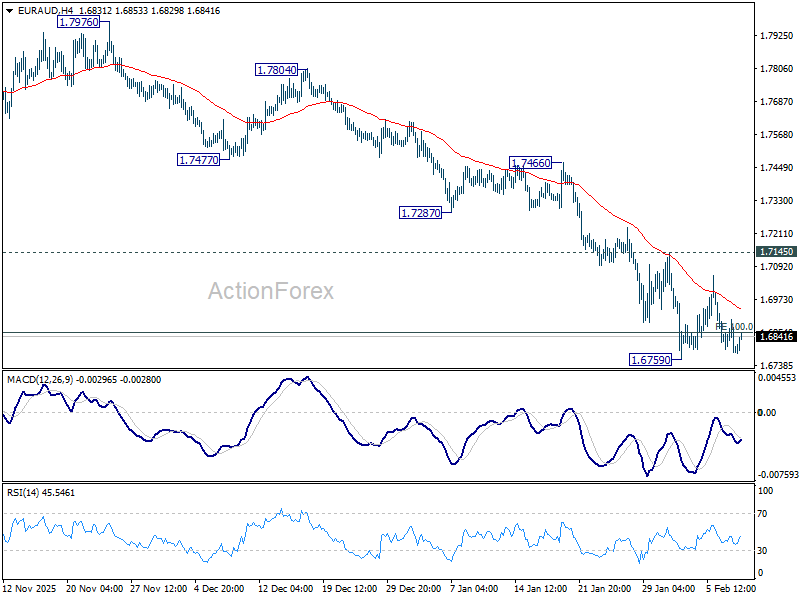
EUR/AUD Daily Outlook
Daily Pivots: (S1) 1.6759; (P) 1.6912; (R1) 1.7000; More...
EUR/AUD is staying in range above 1.6759 and intraday bias remains neutral. Near term outlook will stay bearish as long as 1.7149 resistance holds. On the downside, break of 1.6759 and sustained trading below 1.6851 will extend larger fall to 138.2% projection of 1.8554 to 1.7245 from 1.8160 at 1.6351 next. However, break of 1.7145 will confirm short term bottoming, and turn bias back to the upside for stronger rebound.
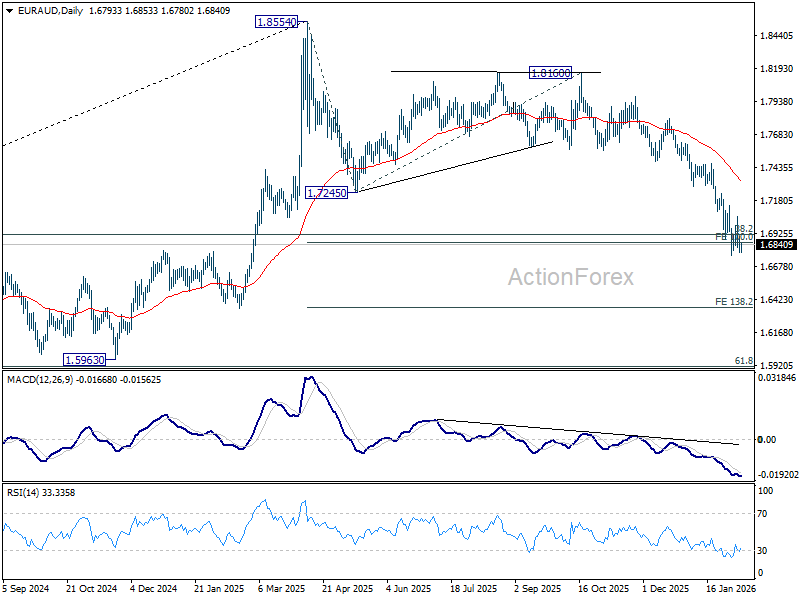
In the bigger picture, fall from 1.8554 medium term top is still in progress. Sustained break of 38.2% retracement of 1.4281 to 1.8554 at 1.6922 will argue that it's already reversing whole up trend from 1.4281 (2022 low). Deeper fall would be seen to 61.8% retracement at 1.5913. For now, risk will stay on the downside as long as 55 D EMA (now at 1.7344) holds even in case of strong rebound.
EUR/CHF Daily Outlook
Daily Pivots: (S1) 0.9111; (P) 0.9146; (R1) 0.9164; More....
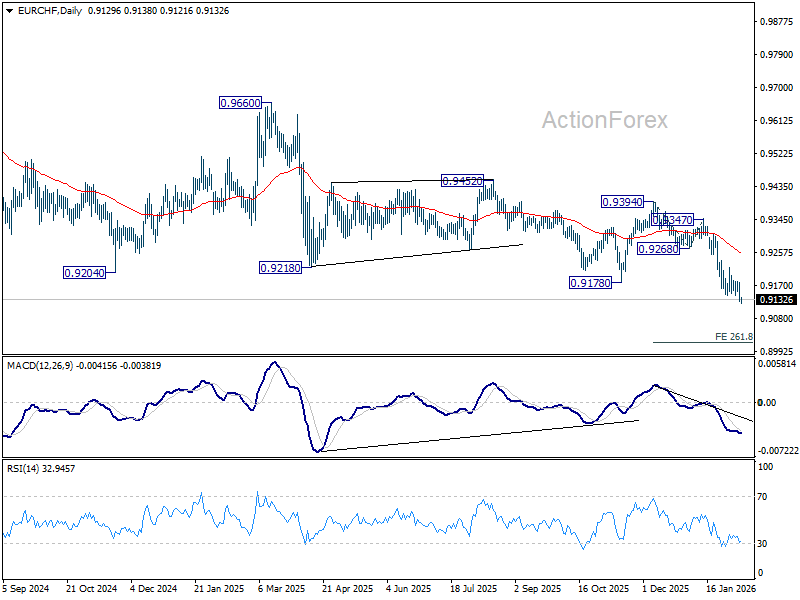
EUR/CHF's down trend resumed by breaking through 0.9141 support and intraday bias is back on the downside. Next target is 261.8% projection of 0.9394 to 0.9268 from 0.9347 at 0.9017. On the upside, however, break of 0.9180 resistance will now indicate short term bottoming, and bring lengthier consolidations.
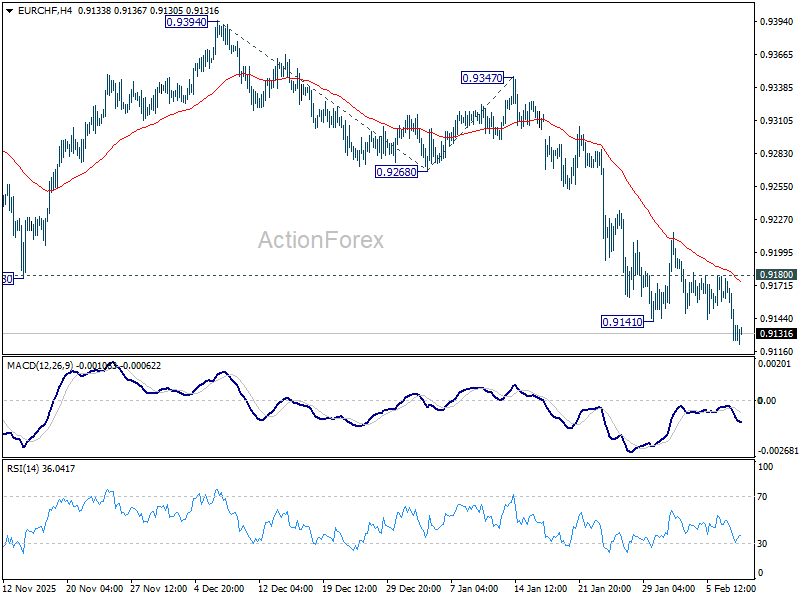
In the bigger picture, down trend from 0.9928 (2024 high) is still in progress with falling 55 W EMA (now at 0.9334) intact. Next target is 61.8% projection of 1.1149 to 0.9407 from 0.9928 at 0.8851. Outlook will stay bearish as long as 0.9394 resistance holds, in case of recovery.