Sample Category Title
Dollar Slips
European and US stocks followed Asian peers higher on Monday, with the notable exception of the FTSE 100, where NatWest shaved around 44 points off the index. That said, mining companies posted strong gains: Antofagasta rallied more than 6%, while Fresnillo and Endeavour added between 5% and 6% each, on a rebound in metal prices that sent gold past the $5’000 mark and silver to $84 per ounce. Both metals are trading lower this morning, despite a US dollar that remains under pressure.
Elsewhere in Europe, a 9% jump in STMicroelectronics stood out after news that Amazon’s cloud-computing arm is deepening its ties with the chipmaker to secure semiconductor technologies for its data centres. As I often say, for those with the patience — and the nerves — European technology stocks that can team up with US peers and ride the AI wave can pop on deals like this. And there should be more of this type of news ahead, as Europe also migrates towards AI-driven applications — eh oui — which will require the involvement of local technology players.
In the US, Nasdaq futures fluctuated between gains and losses into the open, but the bulls ultimately gained the upper hand, allowing the Nasdaq 100 to push above the 25,000 mark. Big Tech led the gains. In the absence of major headlines, however, the move did not mark a fresh direction but rather a correction following last week’s heavy selloff. Google’s announcement of a $20bn bond sale to finance additional spending — including a rare, pound-denominated 100-year bond — raised a few eyebrows. The index nevertheless closed above its 100-day moving average, also supported by a cheaper US dollar.
On the earnings front, roughly 60% of S&P500 companies, including most of the Magnificent Seven, have now reported. Around three-quarters of these companies — and almost all of the Mag 7, except Tesla — delivered positive earnings and revenue surprises. Nvidia has yet to report.
Overall, S&P 500 companies have posted earnings growth of around 13% so far. If this pace holds through the remainder of the season, it would mark the fifth consecutive quarter of double-digit earnings growth for the index. That alone deserves applause.
But there’s a catch.
A meaningful share of this strength can be attributed to Big Tech — and to a weaker US dollar. FactSet, for example, compared companies with higher international exposure to those that are more domestically focused. They split the S&P 500 into two groups: companies generating more than 50% of sales inside the US, and those generating more than 50% outside the US, using actual results where available and estimates for the rest. They found a clear divergence in Q4 performance.
Companies with predominantly domestic revenue exposure recorded blended earnings growth of around 10%. Those with greater international exposure posted 17.7% growth — meaning earnings grew roughly 77% faster for globally exposed firms, helped by dollar weakness.
Unsurprisingly, many of those companies are familiar names: Apple, Meta and other tech heavyweights with large overseas footprints.
So the verdict is clear: tech lifted earnings, and the weaker dollar amplified them.
And yet, investors appear to be losing patience with their Big Tech darlings — Microsoft, Google, Amazon and Meta — despite their strong results. At the very least, the knee-jerk reaction to fresh spending plans has made investors more uncomfortable than they already were going into earnings season. After three years of an breathless rally that pushed technology valuations to flashing levels, there is a slight smell of something burnt. Investors are no longer convinced there is much juice left to squeeze.
Meanwhile, value stocks have started to close the gap with tech — the widely anticipated rotation trade. The S&P 500 equal-weight index is narrowing the gap with the traditional, technology-heavy version. This has been the base-case scenario for many global investors and is expected to continue.
Still, I can’t help but wonder: if tech really falls out of favour, can non-tech sectors — the beneficiaries of the rotation trade — carry the market to fresh highs on their own?
Time will tell. According to recent Goldman Sachs data, short selling across single stocks last week hit a record high based on data collected since 2016. At the index level, short positions against the S&P 500 have also risen over the past three weeks, though they remain well below the December peak.
More broadly, the stress seen in technology and metals over the past two weeks — and the US 2-year yield trading near its lowest level in almost three and a half years — reflects expectations that the Fed will remain accommodative to support a weakening US jobs market, if inflation allows. That could help, but the question is: to what extent?
In FX, the dollar’s weakness was striking. The EURUSD surged from 1.18 to 1.1926 as traders positioned for a growing divergence between the Federal Reserve (Fed) and the European Central Bank (ECB). Cable jumped by a full figure despite the political turmoil surrounding Keir Starmer’s government. The USDJPY plunged below its 50-day moving average and extended losses today, despite a landslide victory for Takaichi — which could, in theory, have weighed on the yen. Some of the move can be attributed to relief and optimism around political certainty, but most of it was clearly driven by broad-based US dollar weakness.
So, the US dollar kicked off the week on the back foot, and upcoming US data from today through Friday will determine whether the pressure continues or whether the greenback finds some relief.
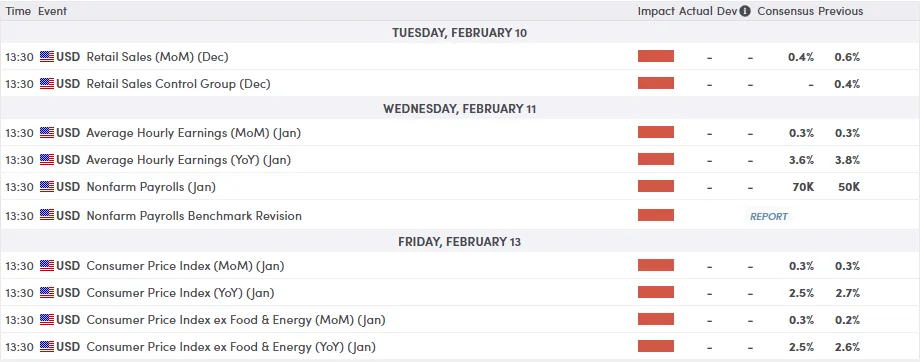
US retail sales today are expected to show slowing growth in December — not great news for the most festive month of the year. On Wednesday, the official jobs report is expected to come in soft, with around 70k non-farm job additions, a steady unemployment rate and slower wage growth at 3.6%. On Friday, CPI is seen easing to 2.5% from 2.7% previously. If soft labour data is combined with cooling inflation, US yields and the dollar could remain under pressure — supporting gold, other metals, Bitcoin and equities, particularly small-, mid-cap and value stocks. Indeed, the US mid-cap index hit a fresh record high yesterday, while the small-cap Russell 2000 is within touching distance of a record of its own.
Ethereum Bounce Looks Tired As Sellers Prepare Next Move
Key Highlights
- Ethereum started a recovery wave after a major drop to $1,750.
- ETH is now facing hurdles near $2,150 and $2,375 on the daily chart.
- Bitcoin price could continue lower unless there is a close above $73,500.
- XRP recovered above $1.35 but faces key resistance near $1.520.
Ethereum Technical Analysis
Ethereum started a recovery wave from $1,740. The bulls were able to push ETH above $1,850 and $2,000 before they faced hurdles.
Looking at the daily chart, the price even recovered above $2,100 and tested the 23.6% Fib retracement level of the downward move from the $3,399 swing high to the $1,739 low. However, the bulls are struggling to push the price above $2,150-$2,200.
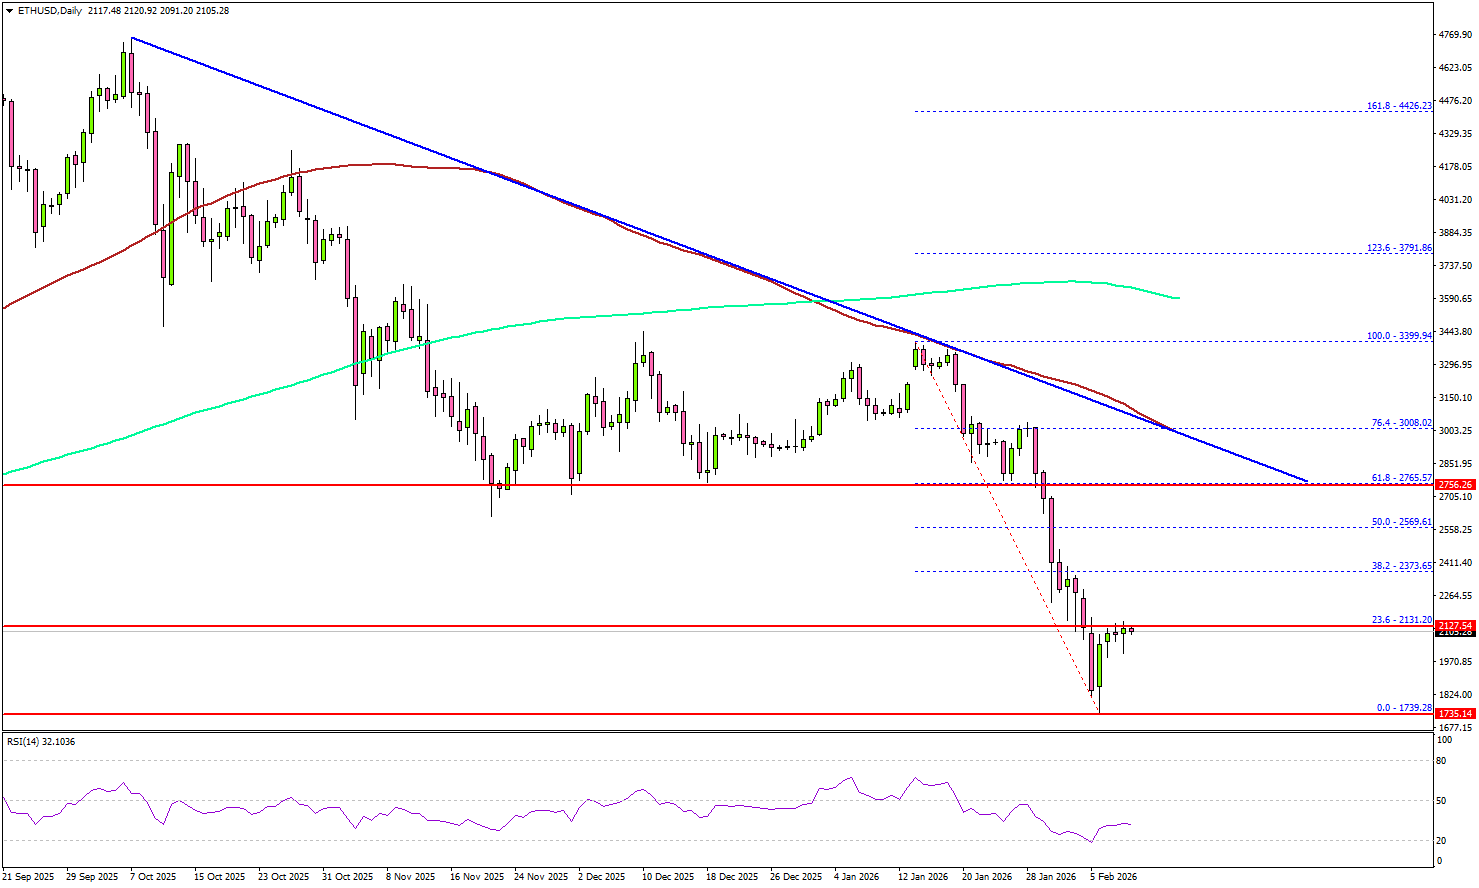
A close above $2,200 could send the price toward $3,375. The first key resistance could be near the $2,550 level or the 50% Fib retracement level of the downward move from the $3,399 swing high to the $1,739 low.
The main hurdle for the bulls sits near $2,765 and a connecting bearish trend line, above which ETH could revisit $3,000 and the 100-day simple moving average (red).
On the downside, the bulls might be active near $1,850 and $1,820. The main support is now forming near $1,750, below which the price could slide toward $1,660. Any more losses might call for a move toward $1,500.
Looking at Bitcoin, there was a decent recovery, but the bulls seem to be facing a key barrier near the $72,500-$73,500 zone.
Economic Releases
- US Import Price Index for Dec 2025 (MoM) – Forecast +0.2%, versus +0.4% previous.
- US Export Price Index for Dec 2025 (MoM) – Forecast +0.2%, versus +0.4% previous.
- US Retail Sales for Dec 2025 (MoM) – Forecast +0.4%, versus +0.6% previous.
Australia NAB business confidence rises to 3, costs ease as activity momentum holds
Australia’s NAB Business Conditions index slipped modestly from 9 to 7 in January, while Business Confidence edged up from 2 to 3. For the RBA, the report showed a clear easing in inflation pressures. Measures of labor and input costs both softened during the month, while quarterly growth in retail prices slowed sharply to 0.3%, down from 0.5% in December.
NAB economist Michael Hayes noted that cost and price indicators have now fallen to "new post-pandemic lows", reinforcing the view that underlying inflation dynamics are continuing to cool.
At the same time, the survey indicates that the broader economy has not lost much traction. Hayes highlighted that activity has "retained most of its momentum gained through the past year" , even as capacity utilization eased slightly.
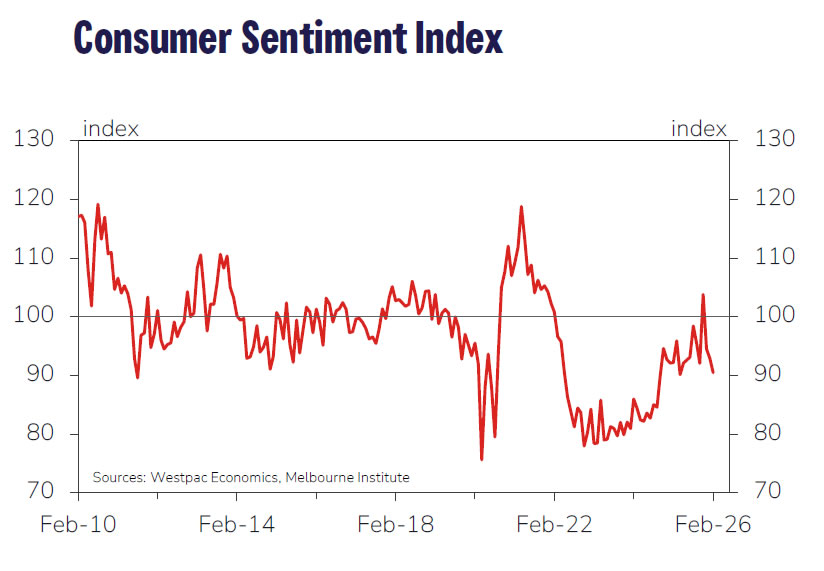
Australia Westpac consumer sentiment dips -2.6% mom after RBA hike, but impact contained
Australia’s Westpac Consumer Sentiment Index fell -2.6% mom to 90.5 in February, reflecting the immediate impact of the RBA’s first rate hike in more than two years. However, Westpac noted that the overall hit to confidence was "relatively mild" by historical standards. The February decline was smaller than the average fall typically seen after rate hikes, and sentiment remains well above the extreme lows recorded through much of 2022–2024.
Looking ahead, Westpac expects the RBA to remain cautious. While another hike at the March meeting cannot be ruled out, the more likely outcome is a pause as policymakers wait for additional data, particularly quarterly inflation updates.
With the RBA placing greater weight on trimmed-mean inflation and the next quarterly CPI report due in late April, Westpac continues to see May as the more probable window for a follow-up 25bp rate hike if inflation remains uncomfortably high.
Lagarde, Nagel reinforce ECB pause as medium-term inflation anchors hold
ECB President Christine Lagarde reiterated overnight that the Governing Council remains comfortable with its current policy stance, telling European lawmakers that inflation is still expected to stabilise at the 2% target over the medium term. In an environment marked by elevated uncertainty, Lagarde stressed that a "data-dependent, meeting-by-meeting approach to monetary policy serves us well."
That message was reinforced by Bundesbank President Joachim Nagel, who said “many factors” point to the current level of interest rates being appropriate. Nagel downplayed recent inflation softness, arguing that the shortfall is "small, temporary deviations", while medium-term inflation dynamics remain firmly aligned with the ECB’s target.
Nagel emphasised that policy action would only be warranted if medium-term inflation expectations deviated “sustainably and noticeably” from target — something he said is clearly not happening.
Eco Data 2/10/26
| GMT | Ccy | Events | Act | Cons | Prev | Rev |
|---|---|---|---|---|---|---|
| 23:30 | AUD | Westpac Consumer Confidence Feb | -2.60% | -1.70% | ||
| 23:50 | JPY | Money Supply M2+CD Y/Y Jan | 1.60% | 1.80% | 1.70% | |
| 00:01 | GBP | BRC Retail Sales Monitor Y/Y Jan | 2.30% | 1.20% | 1.00% | |
| 00:30 | AUD | NAB Business Confidence Jan | 3 | 3 | 2 | |
| 00:30 | AUD | NAB Business Conditions Jan | 7 | 9 | ||
| 11:00 | USD | NFIB Business Optimism Index Jan | 99.3 | 99.9 | 99.5 | |
| 13:30 | USD | Retail Sales M/M Dec | 0.00% | 0.40% | 0.60% | |
| 13:30 | USD | Retail Sales ex Autos M/M Dec | 0.00% | 0.40% | 0.50% | 0.40% |
| 13:30 | USD | Employment Cost Index Q4 | 0.70% | 0.80% | 0.80% | |
| 13:30 | USD | Import Price Index M/M Dec | 0.10% | 0.10% | 0.40% | |
| 15:00 | USD | Business Inventories Nov | 0.10% | 0.20% | 0.30% | 0.20% |
| 23:30 | AUD |
| Westpac Consumer Confidence Feb | |
| Actual | -2.60% |
| Consensus | |
| Previous | -1.70% |
| 23:50 | JPY |
| Money Supply M2+CD Y/Y Jan | |
| Actual | 1.60% |
| Consensus | 1.80% |
| Previous | 1.70% |
| 00:01 | GBP |
| BRC Retail Sales Monitor Y/Y Jan | |
| Actual | 2.30% |
| Consensus | 1.20% |
| Previous | 1.00% |
| 00:30 | AUD |
| NAB Business Confidence Jan | |
| Actual | 3 |
| Consensus | |
| Previous | 3 |
| Revised | 2 |
| 00:30 | AUD |
| NAB Business Conditions Jan | |
| Actual | 7 |
| Consensus | |
| Previous | 9 |
| 11:00 | USD |
| NFIB Business Optimism Index Jan | |
| Actual | 99.3 |
| Consensus | 99.9 |
| Previous | 99.5 |
| 13:30 | USD |
| Retail Sales M/M Dec | |
| Actual | 0.00% |
| Consensus | 0.40% |
| Previous | 0.60% |
| 13:30 | USD |
| Retail Sales ex Autos M/M Dec | |
| Actual | 0.00% |
| Consensus | 0.40% |
| Previous | 0.50% |
| Revised | 0.40% |
| 13:30 | USD |
| Employment Cost Index Q4 | |
| Actual | 0.70% |
| Consensus | 0.80% |
| Previous | 0.80% |
| 13:30 | USD |
| Import Price Index M/M Dec | |
| Actual | 0.10% |
| Consensus | 0.10% |
| Previous | 0.40% |
| 15:00 | USD |
| Business Inventories Nov | |
| Actual | 0.10% |
| Consensus | 0.20% |
| Previous | 0.30% |
| Revised | 0.20% |
NFP Preview: Benchmark Revisions, Fate of March Rate Cut & Implications for DXY and Dow Jones
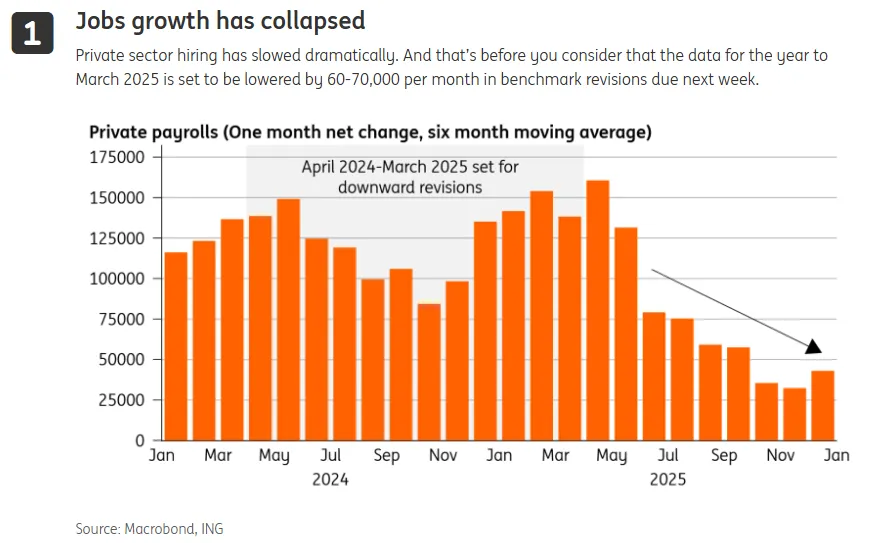
- The high-stakes January 2026 Non-Farm Payrolls (NFP) report, now set for release on February 11, 2026, has a consensus forecast of +70,000 jobs.
- The report includes annual benchmark revisions to 2025 data, which could be key.
- The result will determine short-term movement for the US Dollar Index (DXY) and the Dow Jones (DJIA), with a "Goldilocks" outcome (80k–100k) being ideal for equities.
The January 2026 Non-Farm Payrolls (NFP) report, originally scheduled for early February, was delayed due to a partial federal government shutdown and is now set for release on Wednesday, February 11, 2026.
This release is exceptionally high-stakes because it contains the annual benchmark revisions, which will recalibrate the entire trend of 2025. Markets are currently debating whether the labor market is in a "low-hire, low-fire" stabilization or a deeper, entrenched slowdown.
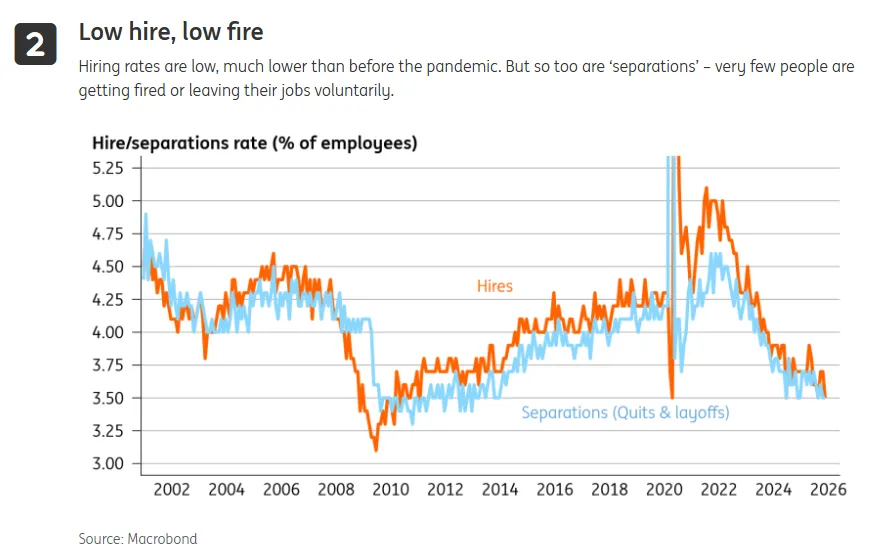
Source: ING, Macrobond
NFP Preview: The data to watch
Headline NFP Forecast: Consensus estimates center around +70,000 jobs. While this appears weak compared to historical averages, it reflects a "stabilizing" trend following late-2025 volatility.
The "March Cut" Bar: The Federal Reserve held rates steady at 3.50%–3.75% in January. For a March rate cut to become the "base case," this NFP report would likely need to see a significant miss (below 50k) or a jump in the unemployment rate toward 4.6%+.
Benchmark Revisions: Keep a close eye on the revisions to 2025 data. If previous months are revised sharply downward, it suggests the Fed may have stayed "too high for too long," increasing the urgency for a March cut.
There is also a growing expectation that we will get benchmark revisions lower by about 60000-70000.
Source: Macrobond, ING
Potential implications for the US Dollar Index (DXY) & Dow Jones
The DXY enters this week testing the 98.00 support level and appears technically oversold.
Bullish Scenario (Stronger Data): A print above 120k would likely spark a "violent short-covering bounce." As markets price out the March cut and converge with the Fed’s "one-cut" dot plot for 2026, the DXY could rally toward the 99.30 (200-day SMA) area.
Bearish Scenario (Weak Data): A print below 50k or negative growth would validate the dovish camp. This would likely drive the DXY through current support toward 97.60, as a March rate cut becomes nearly fully priced in.
US Dollar Index (DXY) Daily Chart, February 9, 2026
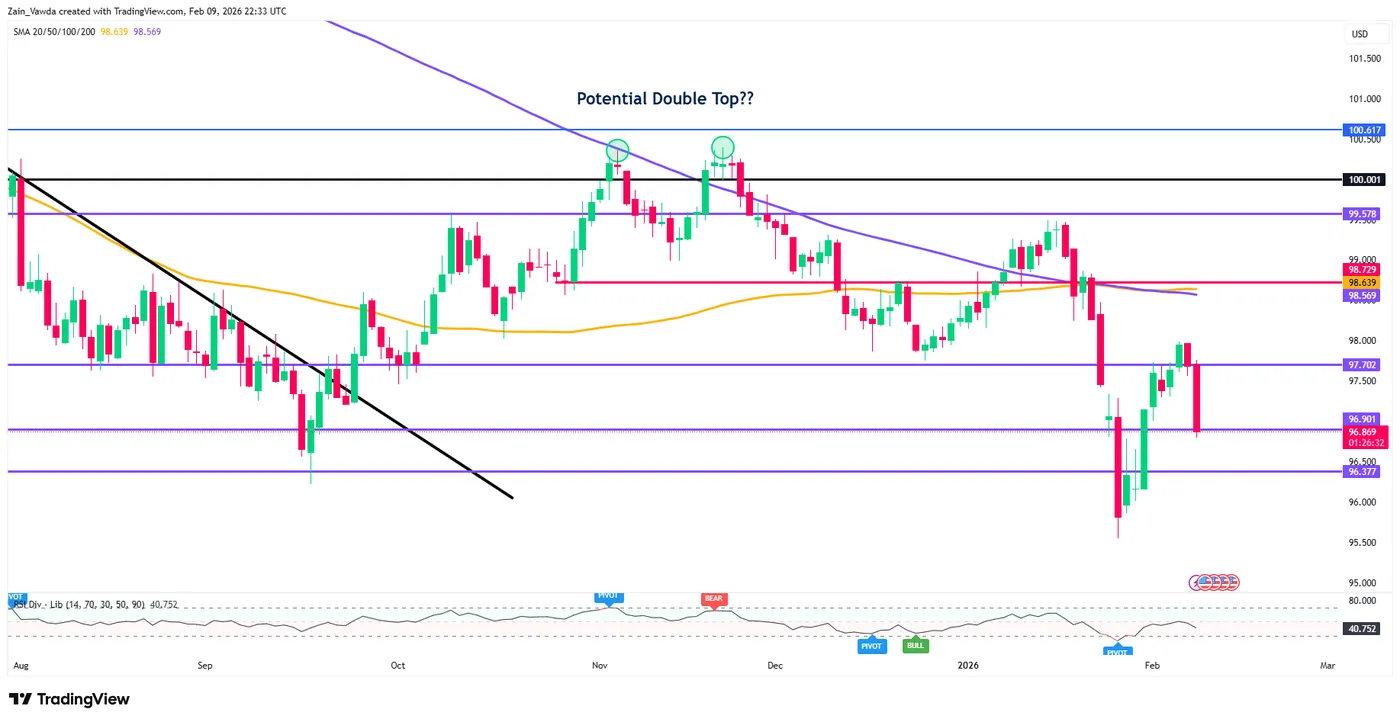
Source: TradingView (click to enlarge)
Dow Jones (DJIA)
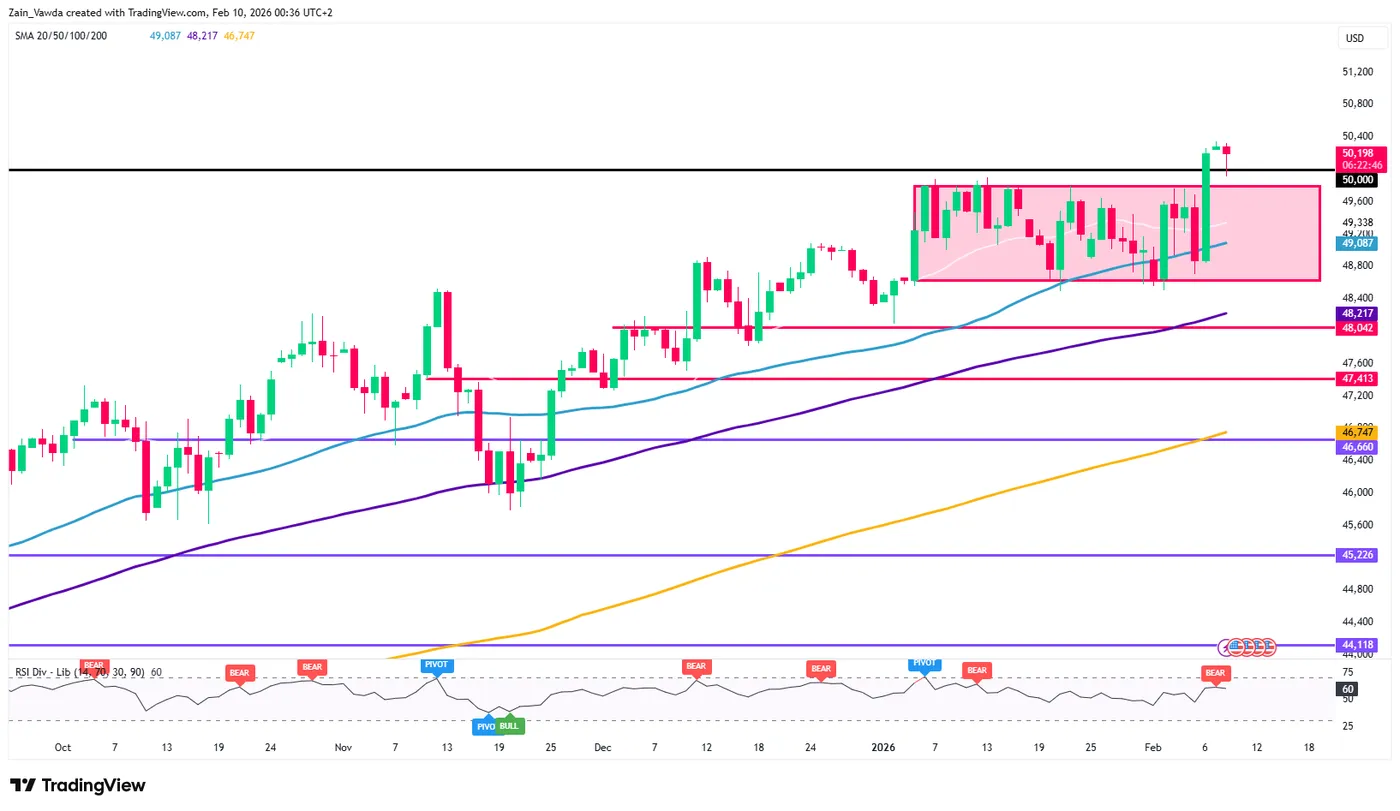
The Dow has recently hit all-time highs, but the delayed NFP creates a "good news is bad news" paradox.
The "Goldilocks" Outcome: A report near 80k–100k with moderate wage growth (0.3% m/m) would be ideal for equities. It suggests the economy isn't cratering, but isn't hot enough to stop the Fed from easing eventually.
The "Hard Landing" Fear: A significantly weak number (negative payrolls) might initially boost rate-cut hopes, but could quickly pivot into recession fears, leading to a "sell-the-news" event for the Dow as earnings growth expectations are slashed.
The Hawkish Shock: If payrolls surprise to the upside (200k+), the Dow could see a sharp pullback as the "higher-for-longer" narrative returns, putting pressure on high-valuation industrial and tech components.
Dow Jones Daily Chart, February 9, 2026
Source: TradingView (click to enlarge)
The transition to the Warsh era
Adding to the complexity is the pending transition in Fed leadership. With the nomination of Kevin Warsh to succeed Jerome Powell, the market is pricing in a shift toward a more "hawkish but pragmatic" Fed. Warsh is expected to prioritize price stability while being open to a "massive positive supply shock" strategy that aligns with the current administration's deregulation and tax-cut agenda.
This political context complicates the Fed's reaction function; the committee may be reluctant to cut rates aggressively if they believe the administration's fiscal stimulus will soon boost growth and potentially reignite inflation later in the year.
The risks to the outlook
Ongoing volatility within the AI and software sectors is sparking fresh concerns regarding the durability of "US exceptionalism," which currently leans heavily on aggressive AI investment and the wealth effect of surging stock prices on high-income consumers.
This anxiety has been further intensified by softening labor market data. In response, swap rates, a key indicator of Federal Reserve expectations, have dropped 12 basis points since the latest Fed meeting, effectively pricing in an additional half-cut for the year.
While a rate reduction in June is now considered a certainty by the markets, the probability of an April cut sits at a toss-up. For the moment, this shift in expectations may have reached its limit; barring significantly distressed employment figures, the Fed is unlikely to accelerate its easing cycle before the summer months.
NFP and CPI: The next major catalysts as Gold (XAU/USD) rallies 2% to $5060/oz
The price of gold has started the week on the front foot. It settled down after some big price swings at the end of last week, mostly because of renewed haven demand and strong fundamental support.
Right now, gold is trading at about $5,070/oz. That is an increase of roughly 1.45% today. At its highest point so far, the price reached nearly $5,080/oz.
US Dollar Index (DXY) vs Gold (XAU/USD)
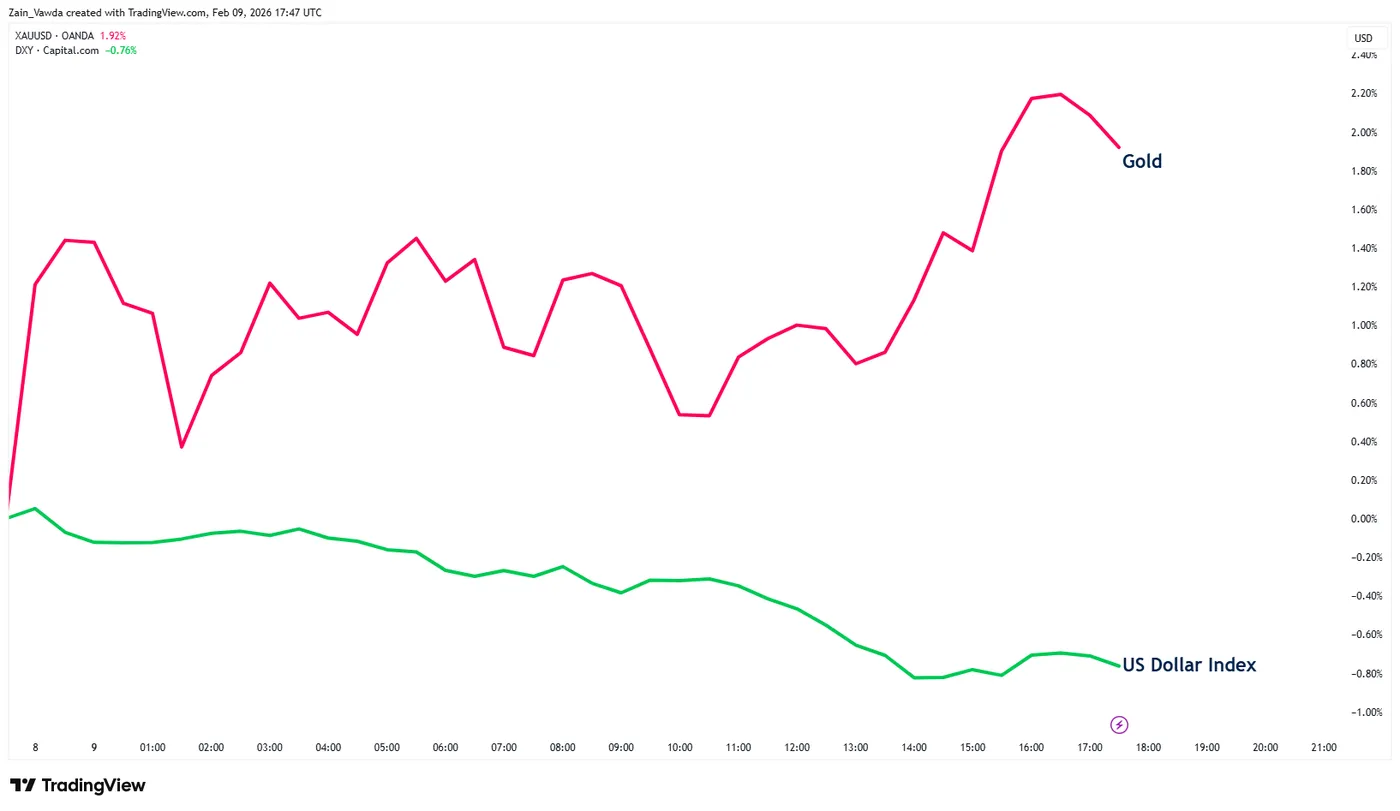
Source: TradingView
China buying spree continues
China’s central bank, the People’s Bank of China (PBOC), continued to grow its gold reserves for the 15th month in a row this January. By the end of the month, the country’s total holdings reached 74.19 million ounces.
Because gold prices fluctuated so much recently, the total value of these reserves jumped significantly, rising from about $319 billion to nearly $370 billion in just one month.
While gold is typically a "safe" investment during times of trouble, it had a very rocky start to the year. Prices hit a record high of nearly $5,600 per ounce in January due to heavy betting by investors.
However, this surge crashed quickly after Kevin Warsh was chosen to lead the US Federal Reserve, among other factors which sent prices tumbling down to around $4,403 by early February.
In terms of how people in China are using gold, the trends are mixed.
Overall gold use fell for the second year in a row in 2025, dropping about 3.75%. Despite this general decline, people are rushing to buy physical gold bars and coins as a way to protect their wealth.
Demand for these items spiked by over 35% last year, and they now make up more than half of all the gold bought in the country. This shows that while the PBOC has gone through phases of pausing and restarting its purchases, the general public remains very interested in gold as a safety net.
US Dollar faces headwinds at the start of the week
The US dollar has started the week on the back foot due to two main reasons. First, market participants are feeling more confident and are putting their money into "riskier" investments like stocks instead of holding onto the dollar. For example, big American tech companies recovered well last week, and stock markets around the world are doing great, which appears to be pulling money away from the dollar.
Second, things are not looking as strong back at home in the United States. Recent reports showed that the job market is weaker than people expected. Because of this, investors are waiting to see if the Federal Reserve will change its plans or worry more about unemployment.
This combination of better opportunities abroad and disappointing news at home is pushing the value of the dollar down with major data reports ahead.
US data ahead: NFP and CPI could provide a catalyst
A busy week for US data could be a catalyst for gold bulls or could prove to be a thorn in the side. The question on the mind of market participants is which will it be?
First, we will get the NFP and jobs report on Wednesday with unemployment also a key metric to keep an eye on. The recent uptick and recovery has given market participants something else to pay close attention to besides just job creation in the private sector.
A miss on the unemployment rate or NFP print could stoke significant US dollar volatility and thus impact gold trajectory.
The CPI report on (originally scheduled for Wednesday) will be another major data point to watch. Private sector reports show that inflation is slowing down quickly, there is still a concern that the official CPI might stay high. This is mainly because of the delayed effects of trade tariffs.
US companies are currently paying the taxes on imported goods, and while some of these businesses are trying to save money elsewhere to cover the extra costs, there is a strong chance they will eventually pass those costs on to shoppers.
On the positive side, cheaper energy prices and falling rent costs are helping to balance things out and keep overall inflation from rising too much.
Keep a close watch on geopolitical developments as well with the US-Iran-Israel situation a fluid and evolving risk to market sentiment. This could have major implications for haven demand this week as well.
For all market-moving economic releases and events, see the MarketPulse Economic Calendar. (click to enlarge)
Technical Outlook - Gold (XAU/USD)
Looking at the four-hour chart below, the technical picture is starting to lean toward further gains for Gold prices.
The rally since the February 2 low at 4402 has printed a higher high and higher low with a fresh higher high looking more likely.
The period-14 RSI broke above the 50 level which hints at bullish momentum.
A break and four-hour candle close above the $5100/oz may give bulls more cause for optimism as well and may lead to a speedy rally toward the $5200/oz mark.
A four-hour candle close below the $4760/oz would lead to a break in structure and the need to re-evaluate price action.
Gold (XAU/USD) Four-Hour Chart, February 9, 2026
Source: TradingView (click to enlarge)
Rout in US Dollar – A Warning for Non-Farm Payrolls?
The US Dollar is opening the week on a sharp descent, with few catalysts to show for it.
Are participants getting ready for dovish Non-Farm Payrolls? It could surely be the case.
Last week showed a startling turn in pre-NFP labor surveys. Jobless Claims reached their highest in since early December, Challenger layoffs sent out another 2008-2009 comparison, and even the previously rebounding ADP private payrolls surprised to the downside.
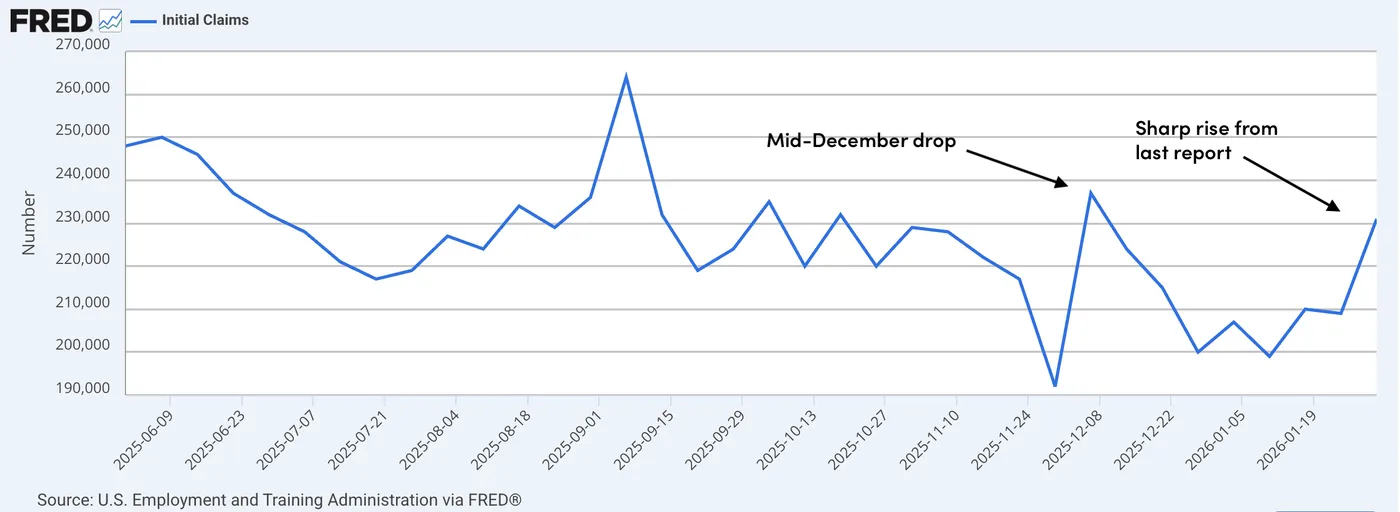
Jobless Claims Weekly Data since 2025 – Source: FRED
If it were only expectations of a soft number on Wednesday, however, that would traditionally translate into lower yields across the board.
The US yield curve is steepening (expecting lower Federal Reserve rates ahead), but bonds are broadly unchanged on the day.
US 10Y Yields Weekly Chart
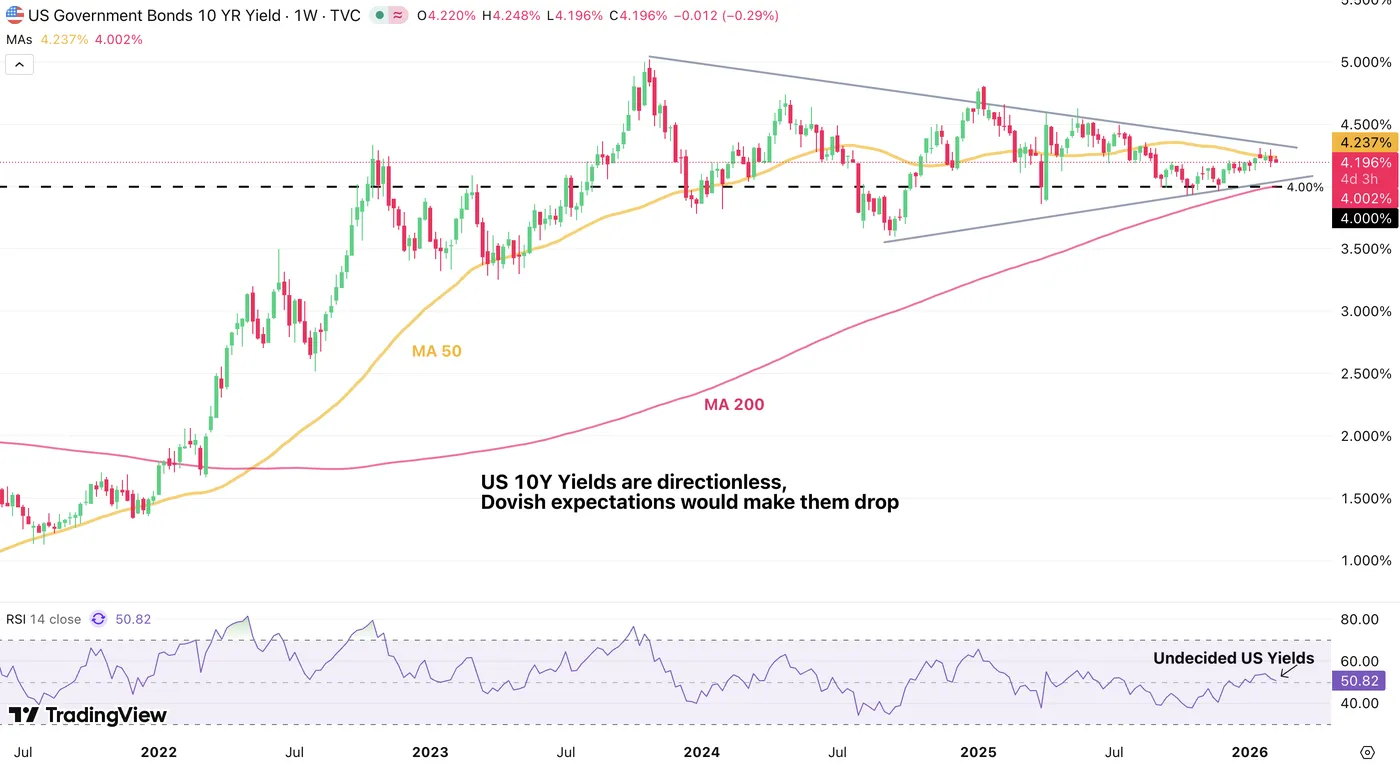
US 10-Year Yields Weekly Chart, Source: TradingView – February 9, 2026.
Apart from sell-the-fact news in the Yen after Sanae Takaichi’s landslide victory in the Japanese snap elections, taking USD/JPY back below 156.00, other FX currencies are also taking their turn on dollar weakness.
The Greenback is at the bottom of the Major currency board in today's session.
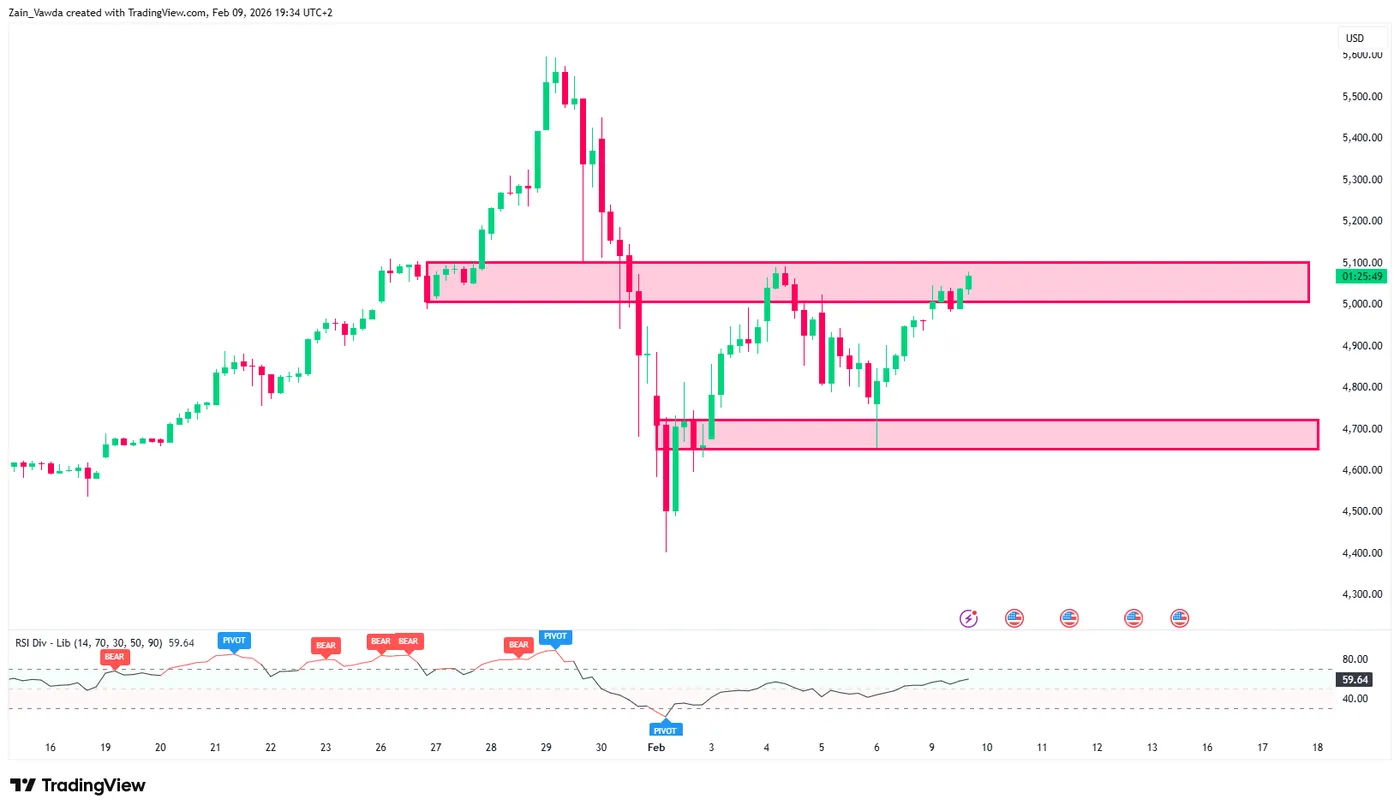
Dollar Index (DXY) 4H Chart
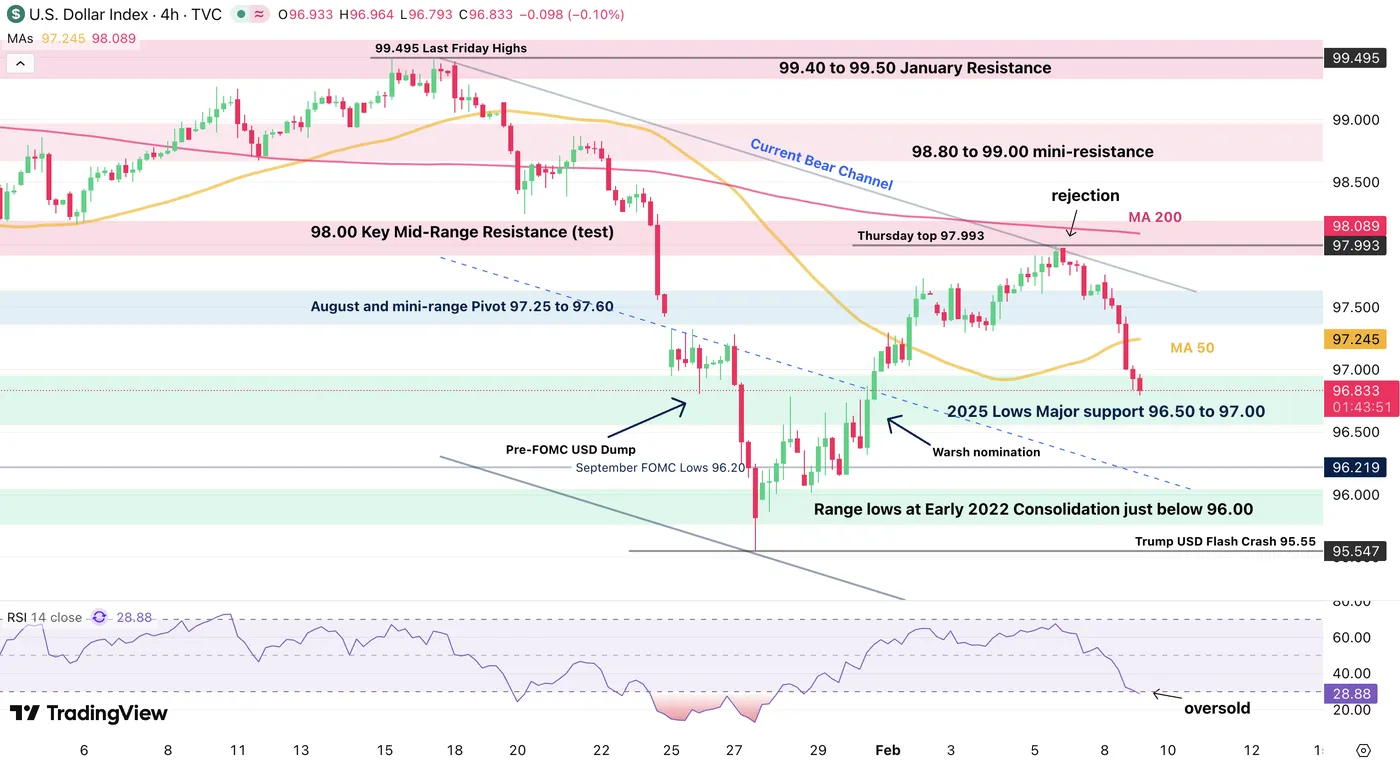
Dollar Index (DXY) 4H Chart, Source: TradingView – February 9, 2026.
The Dollar Index erased its February gains and will test a strong Support range (96.50 to 97.00) amid oversold RSI levels – is the reversal overextended?
Stocks and Commodities are also rebounding to start the week, with metals taking more than a breather, extending higher in their 3rd consecutive sessions of gains.
Gold is now back comfortably above $5,000 in today's rise (and even, $5,100!), indicating that the safe-haven is still far from being out of the picture for investors – China did reveal that January was their 15th month of acquisitions for the Bullion, reflecting their cautious stance with the US Dollar.
By the way, Chinese regulators recently demanded that Banks reduce their reliance on US Treasuries, marking a new turn in the financial Cold War.
Gold 4H Chart
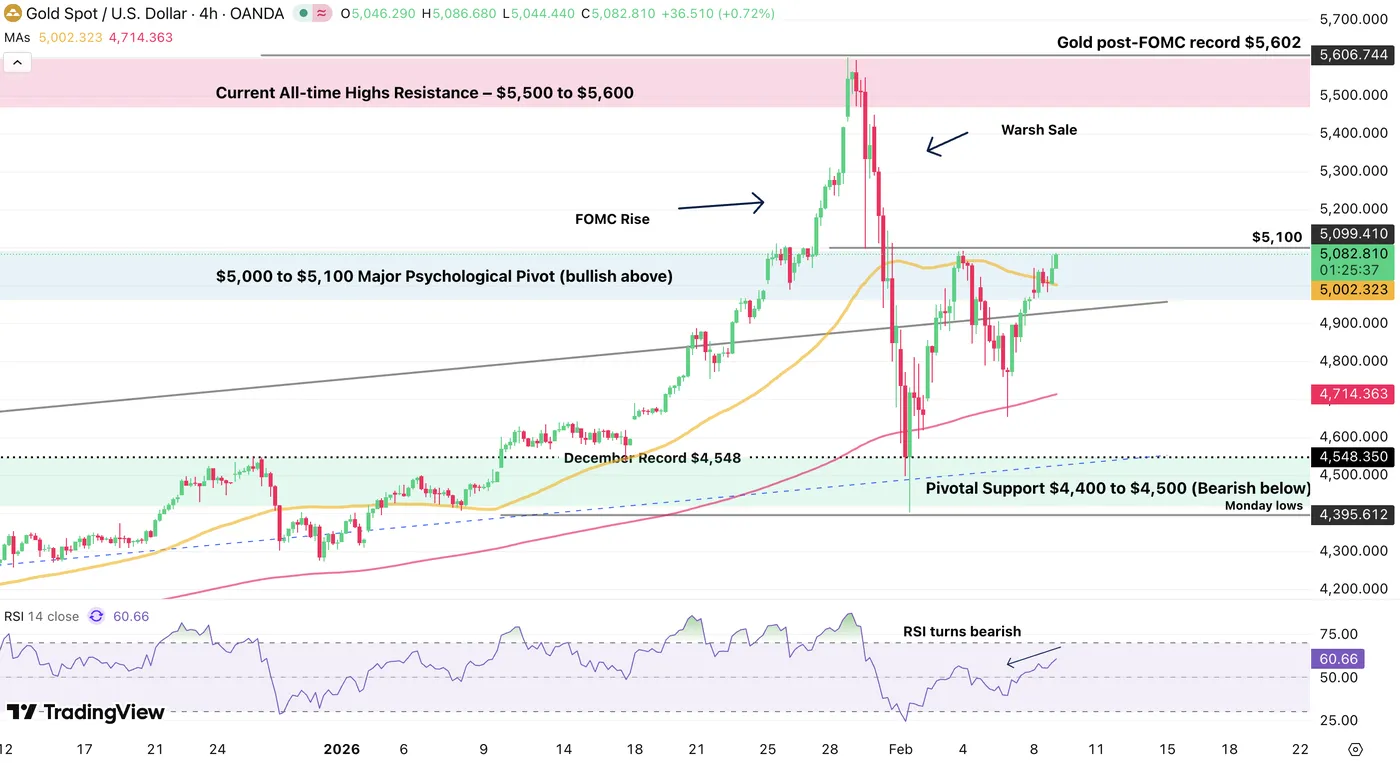
Gold (XAU/USD) 4H Chart, Source: TradingView – February 9, 2026.
Oil isn't gapping lower like in last week's open when WTI dropped 7% (actually up above 1% today).
US-Iran ongoing discussions are also a factor, maybe one for surprise as the world slowly turns its attention away from US military assets amassing in the region – Keep the latest news in check.
A large bull flag seems to be forming – It developing could point to $72 in Oil but will depend on Iran developments.
US Oil (WTI) 4H Chart
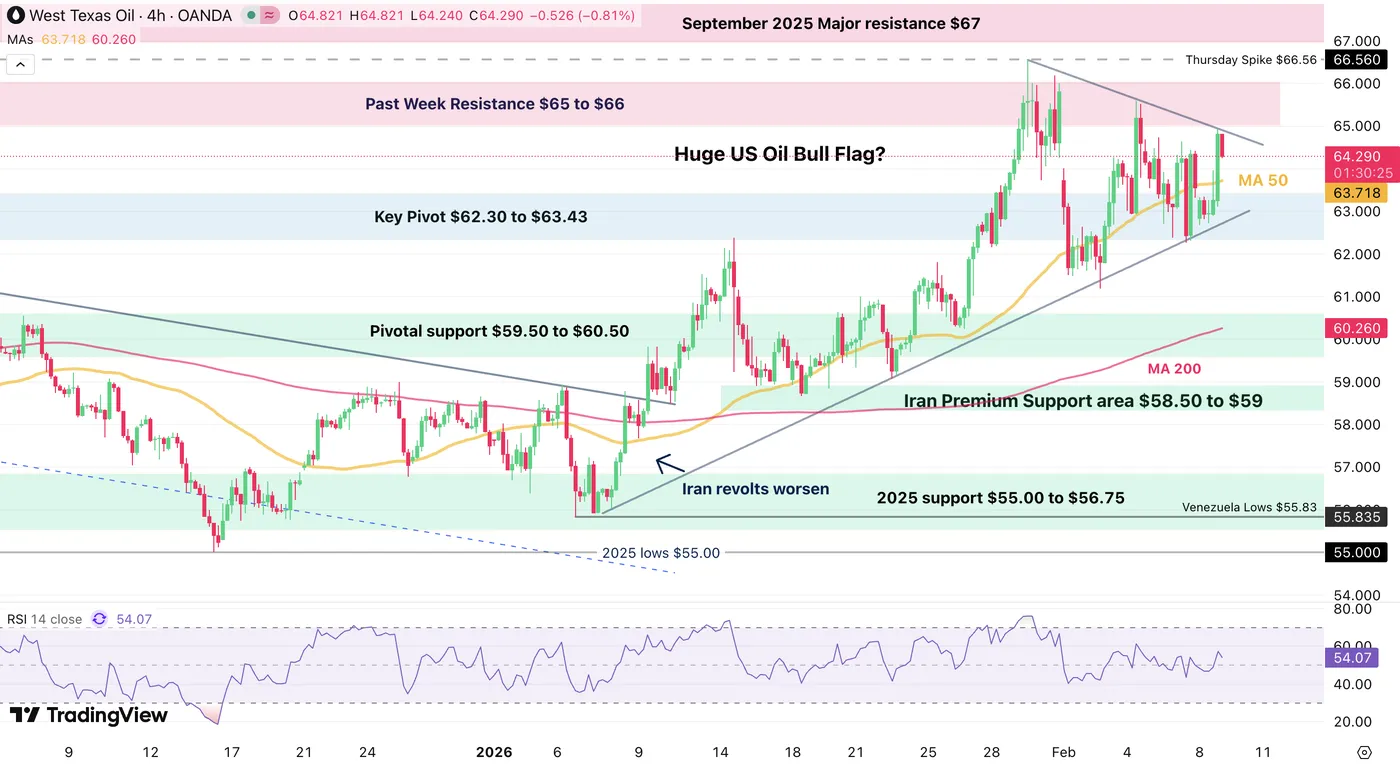
WTI US Oil 4H Chart, Source: TradingView – February 9, 2026.
With limited data, trends, or headlines, this session's drop in the US Dollar could provide interesting mean-reversion setups ahead of Wednesday's Non-Farm Payrolls report.
Keep a close eye on tomorrow's Retail Sales data (8:30 A.M.; +0.4% m/m exp) as any beat could stage a swift bounce.
And the same counts for Non-Farm Payrolls and Friday's inflation data.
Despite today's weakness in the dollar, the flows seem more like mean-reversion from early February flows than the start of a restarting Debasement Trade.
This week will be a massive test for Markets, so get ready!
Safe Trades!
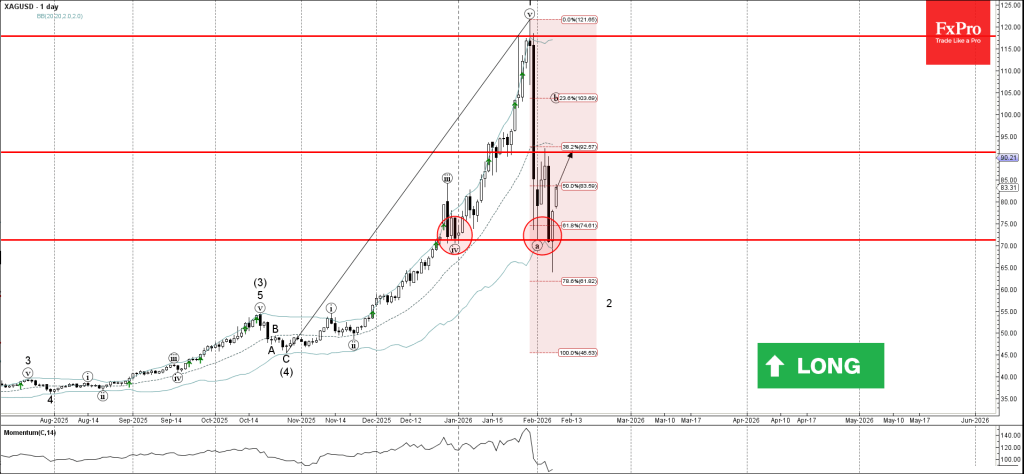
Silver Wave Analysis
Silver: ⬆️ Buy
- Silver reversed from strong support level 71.25
- Likely to test resistance level 91.30
Silver recently reversed from the support area between the strong support level 71.25 (which stopped previous corrections iv and a), lower daily Bollinger Band and the 61.8% Fibonacci correction of the upward impulse from December.
The upward reversal from this support zone continues the b-wave of the active ABC correction 2 from the end of January.
Given the strength of the support level 71.25 and the oversold daily Momentum, Silver can be expected to rise to the next resistance level 91.30.