
Sample Category Title
GBP/USD Daily Outlook
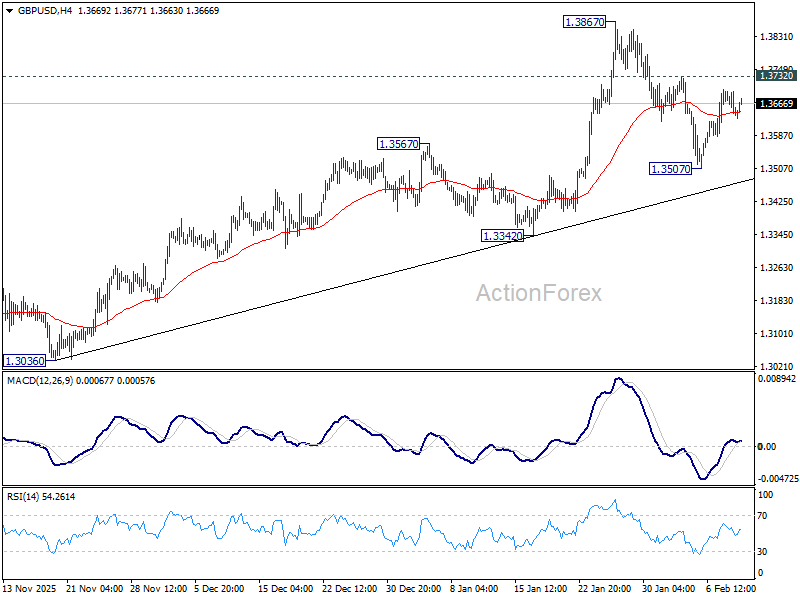
Daily Pivots: (S1) 1.3621; (P) 1.3660; (R1) 1.3682; More...
Intraday bias in GBP/USD remains neutral and outlook is unchanged. On the upside, firm break of 1.3732 resistance will suggest that pullback from 1.3867 has completed as a correction at 1.3507. Retest of 1.3867 should be seen first. Firm break there will resume larger up trend towards 1.4284 key resistance. On the downside, however, sustained trading below 55 D EMA (now at 1.3497) will raise the chance of larger scale correction, and target 1.3342 support for confirmation.
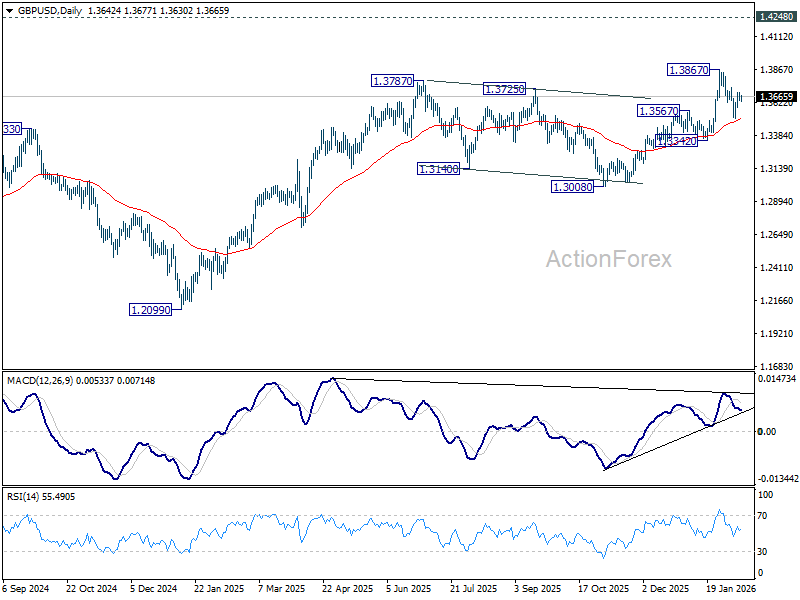
In the bigger picture, rise from 1.0351 (2022 low) is resuming by breaking through 1.3787 high. Further rally should be seen to 1.4284 key resistance (2021 high). Decisive break there will add to the case of long term bullish trend reversal. For now, outlook will stay bullish as long as 1.3008 support holds, even in case of deep pullback.
USD/CHF Daily Outlook
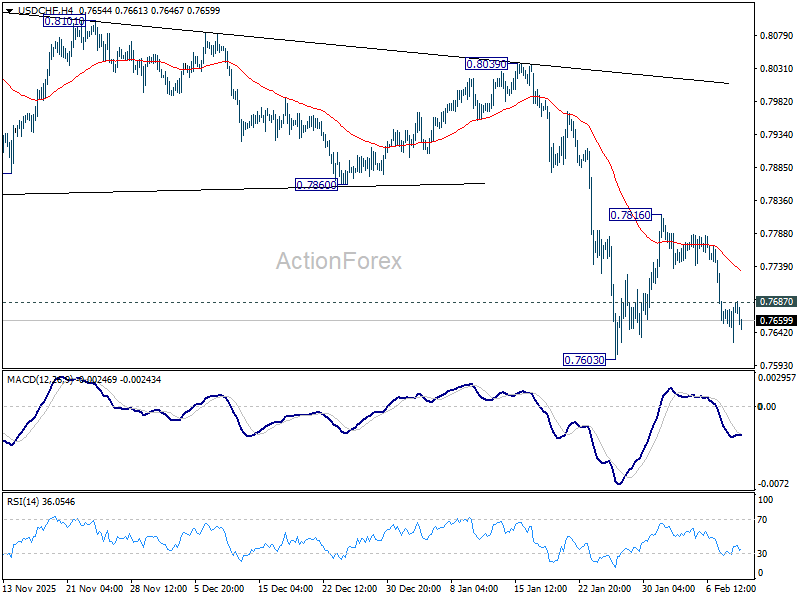
Daily Pivots: (S1) 0.7645; (P) 0.7666; (R1) 0.7704; More….
USD/CHF's fall is in progress and intraday bias stays on the downside for retesting 0.7603 low. Decisive break there will resume larger down trend to 0.7382 projection level next. On the upside, though, above 0.7687 minor resistance will delay the bearish case and extend the corrective pattern from 0.7603 with another leg.
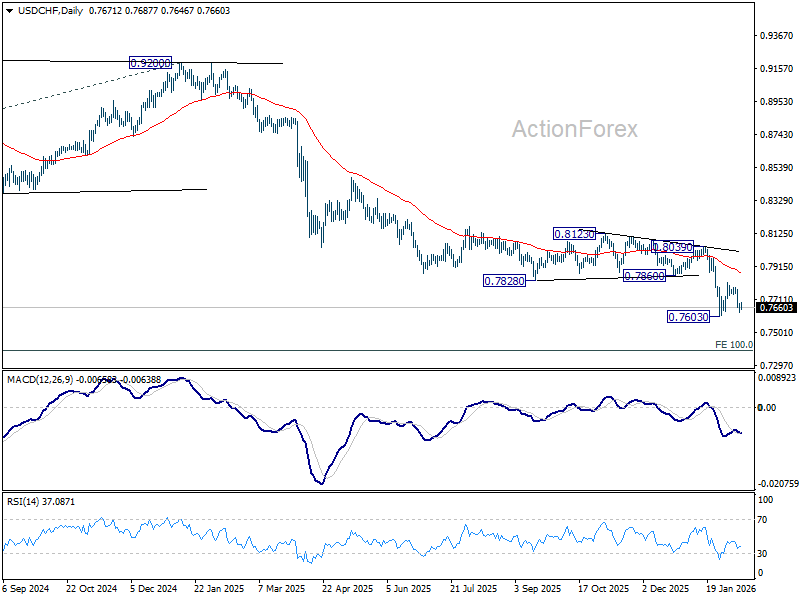
In the bigger picture, larger down trend from 1.0342 (2017 high) is still in progress. Next target is 100% projection of 1.0146 (2022 high) to 0.8332 from 0.9200 at 0.7382. In any case, outlook will stay bearish as long as 55 W EMA (now at 0.8152) holds.
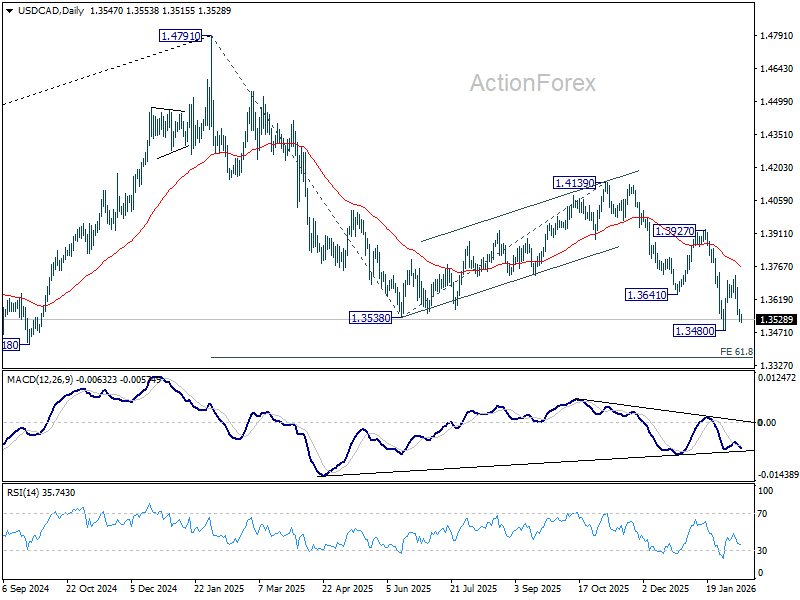
USD/CAD Daily Outlook
Daily Pivots: (S1) 1.3524; (P) 1.3552; (R1) 1.3582; More...
USD/CAD's fall is in progress and intraday bias stays on the downside for retesting 1.3480 low. Firm break there resume larger down trend from 1.4791 to 61.8% projection of 1.4791 to 1.3538 from 1.4139 at 1.3365. On the upside, above 1.3575 minor resistance will delay the bearish case, and extend the corrective pattern from 1.3480 with another leg.
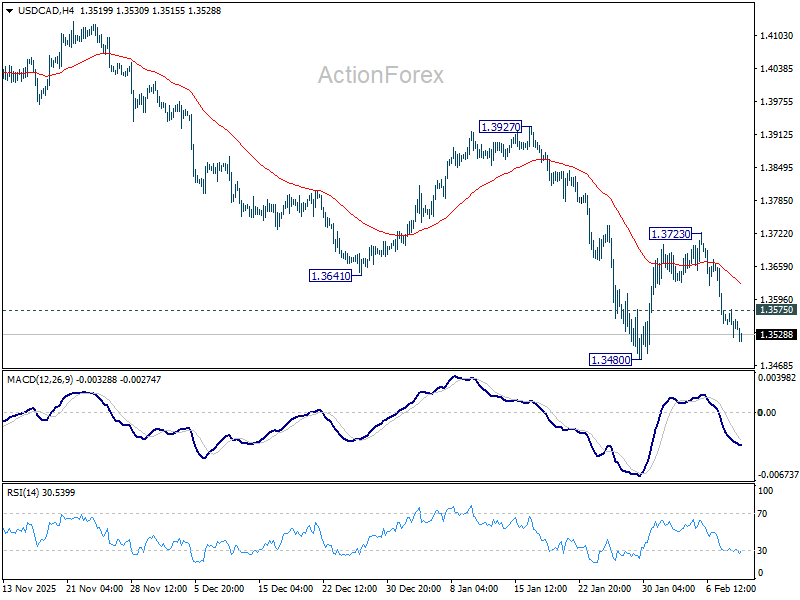
In the bigger picture, price actions from 1.4791 are seen as a corrective pattern to the whole up trend from 1.2005 (2021 low). Deeper fall could be seen as the pattern extends, to 61.8% retracement of 1.2005 to 1.4791 at 1.3069. For now, medium term outlook will be neutral at best, until there are signs that the correction has completed, or that a bearish trend reversal is confirmed.
When It Rains, It Pours
The US dollar weakened yesterday after retail sales data showed no growth in December on a monthly basis. The annual figure retreated to 2.43%, from around 3.6% printed a month earlier. That pulled the Atlanta Fed’s GDPNow forecast for Q4 down to 3.7%. The figure was hovering above 5% in early January.
There’s more: delinquency rates rose to the highest levels since the pandemic for some groups — in line with waning consumer confidence, weakening jobs data and growing complaints about the cost-of-living crisis — something the White House would rather not talk about.
But it may be happening. US consumer spending may be weakening for real this time. That is a major threat for an economy where consumer spending is the main pillar of growth. Massive AI investment will certainly continue to do the heavy lifting, but it won’t necessarily create jobs on a net basis, nor will it ease the cost of living overnight.
If that’s the case, the two-speed growth in the US will require the Federal Reserve’s (Fed) support to feel better. This is why we see the US 2-year yield — which best captures Fed expectations — falling to 3.5-year lows and the US dollar weakening. Softer yields and a cheaper dollar are positive for equities, but with a nuance. A softer Fed reinforces the rotation trade and fuels appetite for smaller and non-tech companies, rather than Big Tech — which ultimately benefits from a weaker dollar but is now being questioned by investors over ambitious AI investment plans, increasingly financed by debt.
And that’s a big deal. One of Big Tech’s bright spots — what made these companies relatively immune to rate cycles and global crises — was their strong balance sheets and ample free cash flow. But the past three years of heavy investment have eaten into that cash, forcing them to turn to debt markets. Google just issued a $20bn debt this week on top of $17.5bn issued last November, and it is not alone. Meta issued $30bn in debt in October, Oracle a whopping $43bn since last September, and Amazon $15bn. The problem is that rising debt changes their leverage profile and risk dynamics — and that should weigh on valuations.
Obviously, a softer rate environment would help. But for now, investors are focused on valuations. The S&P500 was offered near a record high yesterday, while its equal-weighted version hit a fresh record high. The Dow and the mid-cap index also extended gains to fresh records. Small caps looked more timid — likely reflecting the rapid deterioration in Main Street data.
Today, the US will release its latest jobs data — originally due last Friday but postponed to today due to a partial government shutdown. Expectations are weak. The US economy is expected to have added around 66K nonfarm jobs in January, with wage growth slowing to 3.6% year-on-year. The unemployment rate is seen steady near 4.4%.
If we dig deeper, however, unemployment among workers aged 16–24 stood above 10% in December. The struggle is real.
A soft data set would likely reinforce dovish Fed expectations, push short-term US yields and the dollar further lower, and support the rotation trade. Stronger-than-expected data may reduce expectations for earlier Fed cuts, but it won’t change the broader narrative that part of the US economy — excluding tech — is heading in the wrong direction. Main Street needs the Fed’s help. And softer spending could temper inflation, allowing the Fed to support the economy.
Fed funds futures are now tilting toward a possible rate cut by April instead of June. The probability of a June cut is approaching 80%, up from roughly 50-50 earlier this year. The probability of an April cut stands at 42%, moving closer to a coin toss.
The Japanese yen is one of the biggest beneficiaries of the softer dollar. The USDJPY slipped below 153 this morning in Japan, in a surprising move after Takaichi won the weekend’s snap election. The next key support is 152.18 — the 38.2% Fibonacci retracement of the April 2025-to-January 2026 rebound. A break below that level would signal the end of the yen’s nearly year-long debasement.
Elsewhere, the tech oscillated between promise and pressure. TSMC continues to extend gains into uncharted territory after announcing a 37% jump in revenue this January — partly flattered by the fact that last year’s Chinese New Year fell in January — though the figure remains consistent with its 30% growth target for this year. Asian tech stocks extend gains to ATHs, also fueled by rising Fed and PBoC support.
Software stocks are less enthusiastic - desperate, hit by a fresh wave of weakness after news that an AI startup called Altruist released a new tool to help financial advisers personalize investment and wealth management strategies for their clients. Charles Schwab, which had been gently grinding higher, suddenly tripped and fell more than 7%. The news interrupted a rebound in software stocks that were battered by similar developments from Anthropic last week.
The divergence between AI enablers and software stocks is striking, to the point where the software dip may start to look attractive for those who believe AI tools won’t replace all lawyers and all client advisers overnight.
But what do I know…
US January Jobs Report Takes Centre Stage
In focus today
In the US, the January Jobs Report, that was originally scheduled for last Friday, will be published today. We still forecast NFP growth at +60k, unemployment rate at 4.4% and the annual benchmark revisions at negative -1.1 million (early estimate was -919k).
Economic and market news
What happened overnight
In China, January CPI inflation eased sharply to 0.2% y/y (cons: 0.4%, prior: 0.8%), marking the lowest print since October. Food prices fell for the first time in three months (-0.7%), but also non-food inflation slowed (0.4%). Meanwhile, PPI fell 1.4% y/y (cons: -1.5%, prior: -1.9%), extending the contraction to a 40th consecutive month. The slower decline reflects Beijing's continued efforts to rein in excessive price competition. However, in monthly terms, the PPI rose 0.4% m/m in January, accelerating from a 0.2% rise in December.
In the US, the Treasury Department issued a general license to facilitate oil and gas exploration and production in Venezuela, allowing the use of US goods, technology, and services. The move aims to boost Venezuela's crude production. According to the US Energy Information Administration, output could rise by up to 20% in the coming months. Payments to sanctioned entities must be made into a US-overseen fund, and the license prohibits the formation of new joint ventures.
What happened yesterday
In the US, December retail sales excluding autos, gas, building materials and food services (SA) declined by 0.1% m/m (cons: 0.4%). Retail sales showed broad declines across categories, though the heavily seasonally adjusted December data should be interpreted with caution. On a non-seasonally adjusted basis, control group sales grew by 4.4% y/y, which remains a healthy pace in historical terms.
The Q4 Employment Cost Index also surprised to the downside. The ECI remains closely correlated with the JOLTs data, which suggests that wage growth will continue to slow down during H1 2026.
In Norway, January core inflation rose to 3.4% y/y (cons: 3.0%, NB: 2.9%), marking a hawkish surprise as domestic service price inflation, excluding rents, drove the increase. Higher municipality fees and insurance costs contributed to the upside, while few downside surprises were observed across subcomponents. The release came with higher-than-usual uncertainty due to annual reweightings and potential volatility in municipality fees.
In Denmark, January inflation fell to 0.8% y/y from 1.9% in December, driven mainly by the near removal of the electricity tax. Food prices rose 2.4% m/m, ending a five-month decline, with the increase being slightly above the seasonal norm. Overall, underlying inflation remains close to 2%.
In climate politics, President Trump is set to repeal the Obama-era endangerment finding that declared carbon dioxide a threat to human health, removing the legal basis for federal greenhouse gas regulations. The repeal targets vehicle emission standards but excludes stationary sources like power plants. Industry groups are cautious about supporting the move due to legal uncertainties, and critics warn it could harm global climate efforts while boosting China's clean energy industry. The repeal is expected to face significant legal challenges.
Equities: Equities finished broadly unchanged yesterday. Asia, led by Japan, outperformed, while both the US and Europe saw modest declines. Interestingly, the Dow Jones managed to close at a fresh all-time high. We didn't have big rotation yesterday. However, banks was among the weaker performers as yields ticked lower. In the US yesterday, Dow +0.1%, S&P 500 -0.3%, Nasdaq -0.6% and Russell 2000 -0.3%. This morning, the constructive tone in Asia continues, again with Japan leading gains, but with broad-based strength across the region. US and European futures are also trading higher at the time of writing.
FI and FX: In the US, yields declined across the curve following yesterday's weak December retail sales and ECI data, with the 2-year Treasury yield down 3bp and the 10-year falling 5bp. EUR/USD remains anchored around the 1.19 mark ahead of today's US jobs report. USD/JPY has continued to grind lower below 154, supported by a steady JGB market. CHF continues to be among the top performers this year with EUR/CHF and USD/CHF trading at the lowest level since the SNB removed removal of the floor in 2015. The Swedish krona had a constructive session yesterday, with EUR/SEK heading below 10.60 once again. Yesterday marked a very volatile session in Norwegian markets following the much higher-than-expected Norwegian core inflation print for January, with EUR/NOK dropping to the low 11.30s. EUR/DKK climbed to its highest level since mid-January yesterday, breaking above the 7.4700 level.
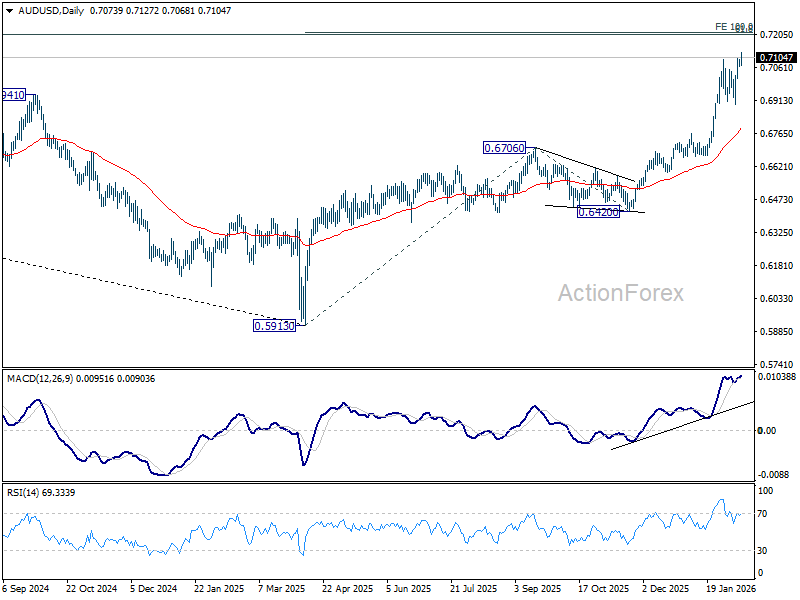
AUD/USD Daily Report
Daily Pivots: (S1) 0.7062; (P) 0.7079; (R1) 0.7093; More...
AUD/USD's up trend resumed by breaking through 0.7093 resistance. Intraday bias is now on the upside for 100% projection of 0.5913 to 0.6706 from 0.6420 at 0.7213. On the downside, below 0.7063 minor support will turn intraday bias neutral again. But retreat should be contained above 0.6896 support to bring another rally.
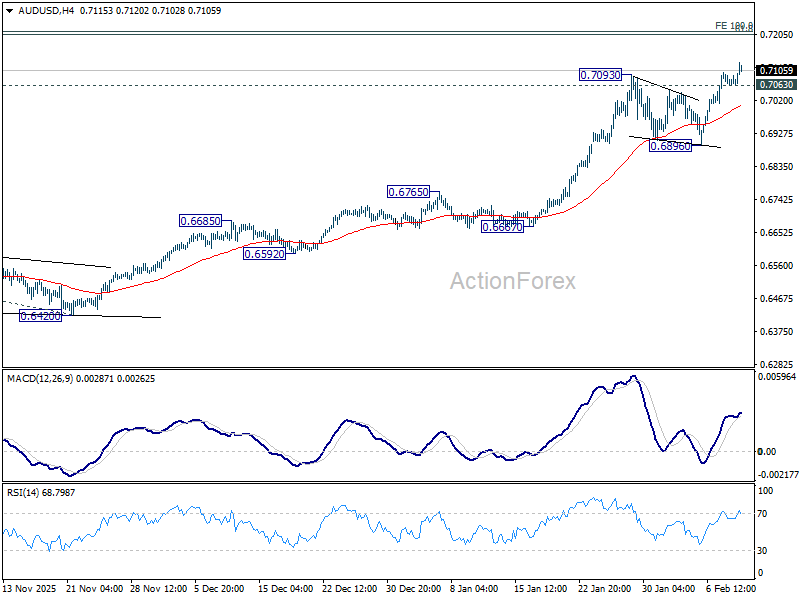
In the bigger picture, current development argues that rise from 0.5913 (2024 low) is reversing whole down trend from 0.8006 (2021 high). Further rally should be seen to 61.8% retracement of 0.8006 to 0.5913 at 0.7206. This will remain the favored case as long as 0.6706 resistance turned support holds, even in case of deep pullback.
Yen, Aussie Lead as Weak Dollar Faces Delayed NFP Test
Yen and Aussie are outperforming today as markets await the delayed US non-farm payroll report, while Dollar remains under pressure. Yen’s advance builds on momentum established after Japan’s election results. Investors believe Prime Minister Sanae Takaichi now has sufficient authority to pursue coherent fiscal strategy without accommodating a broad range of competing stimulus demands from oppositions.
Her pro-market approach is also expected to encourage renewed foreign participation in Japanese equities, strengthening capital inflow prospects. In that sense, Yen strength reflects both domestic political factors and external rate dynamics.
At the same time, Yen gains are being amplified by developments in US bond markets. US 10-year Treasury yields have fallen sharply this week and extended losses overnight, providing a clear tailwind for the currency through narrower yield differentials.
The precise catalyst for the yield decline remains debated. Yet, the technical setup points to scope for further downside in yields. That brings today’s NFP report into sharper focus. A weak print could push yields lower and accelerate downside in USD/JPY.
Meanwhile, Aussie strength reflects hawkish rhetoric from RBA Deputy Governor Andrew Hauser, who reiterated that inflation remains unacceptably high and pledged that policy will stay restrictive if needed. Hauser noted that renewed price pressures may reflect stronger demand meeting supply constraints, warning that persistent inflation cannot be tolerated. Markets now imply roughly a 70% probability of another hike to 4.10% in May, pending first-quarter inflation data.
For the week to date, Yen leads performance, followed by Aussie and Swiss franc. Dollar sits at the bottom of the pack, trailed by Sterling and Kiwi. Euro and Loonie are positioning in the middle.
In Asia, Japan was on holiday. Hong Kong HSI is up 0.30%. China Shanghai SSE is up 0.13%. Singapore Strait Times is up 0.39%. Overnight, DOW rose 0.10%. S&P 500 fell -0.33%. NASDAQ fell -0.59%. 10-year yield fell -0.051 to 4.147.
Low-bar NFP to set up yield-driven USD/JPY reaction
The delayed January US non-farm payroll report finally lands today, but expectations are already deeply tempered. Markets are braced for just 66k job growth, with unemployment seen holding at 4.4%. While hiring is seen slow, wage pressure is expected to remain firm. Average hourly earnings are forecast to rise 0.3% mom. Labor demand may be cooling, but without translating into meaningful disinflation pressure.
Meanwhile, officials from the US administration appeared keen to talk down expectations around job creation. National Economic Council Director Kevin Hassett said this week that tighter immigration enforcement and rapid productivity gains driven by artificial intelligence are suppressing demand for new workers. Those dynamics, he argued, could keep payroll growth low even as output remains strong.
Despite that, Hassett struck an upbeat tone, suggesting the economy could still deliver a powerful mix of lagging job creation alongside surging productivity, profits, and GDP. That framing implies that slower hiring should not automatically be read as economic stress.
Markets, however, are unlikely to to put too much attention on rhetoric. The more immediate focus remains on Treasuries. US 10-year yields have fallen sharply this week, extending losses after yesterday’s retail sales miss. The question now is whether bonds are genuinely front-running a more aggressive Fed easing path, or whether investors are simply reassessing “Sell America” narrative as overstated once hard data failed to confirm it. Today’s reaction to payrolls release could help resolve that ambiguity.
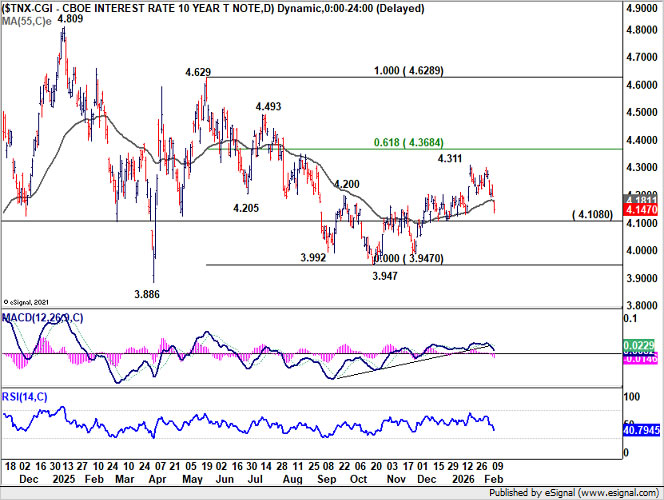
Technically, 10-year yield's strong break below 55 D EMA suggests the rebound from the 3.947 low may already have completed at 4.311 as a corrective bounce. Decisive break below 4.108 support would solidify that view and reopen downside toward the 3.947 area.
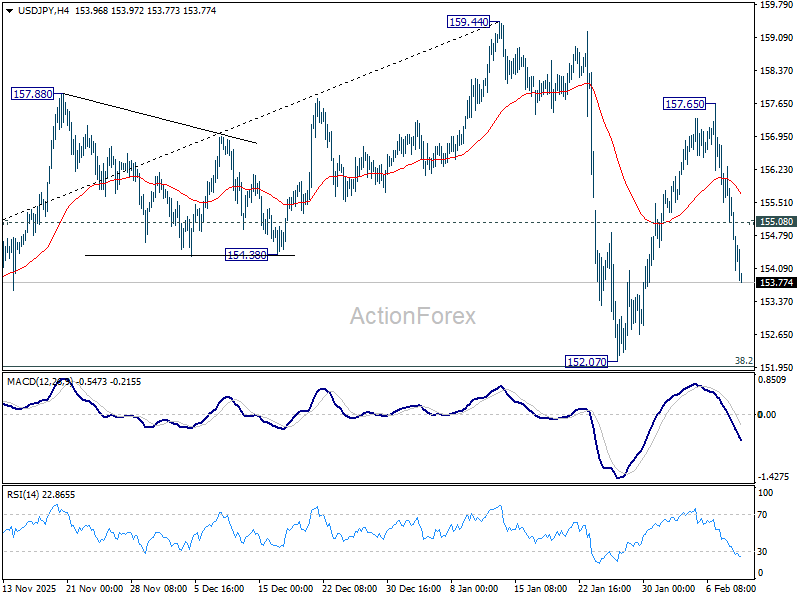
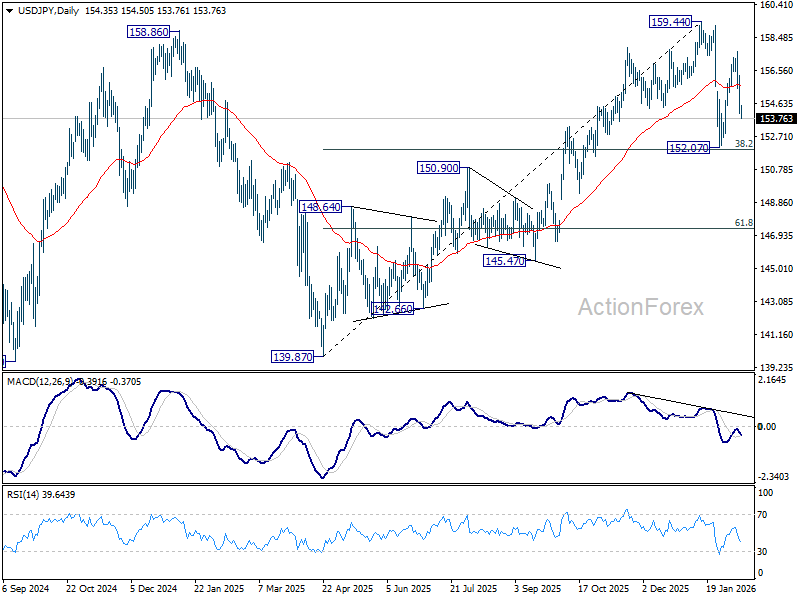
In the currency markets, the corresponding pair to watch is USD/JPY. The pair initially dives this week as reaction to Japan's election results. But the last leg was clearly driven by the fall in US yields. Decline from 157.65 is seen as part of the corrective pattern from 159.44. While deeper fall could be seen to 152.07, strong support is expected from 38.2% retracement of 139.87 to 159.44 at 151.96 to bring rebound. However, decisive break of 151.96 would argue that USD/JPY is already in bearish trend reversal.
Fed’s Logan says inflation, not jobs, now bigger risk
Dallas Fed President Lorie Logan struck a cautious tone on further easing, arguing that downside risks to the US labor market "appear to have meaningfully dissipated" following last year’s three interest-rate cuts. Speaking overnight, Logan said those moves had helped stabilize employment conditions but had also introduced fresh risks on the inflation side.
While she expects inflation to make progress this year, Logan laid out a series of concerns that argue against complacency. She pointed to pending tariff effects, supportive fiscal policy, buoyant financial conditions, and the possibility that deregulation and new technologies could add to price pressures rather than dampen them.
Against that backdrop, Logan said she is “cautiously optimistic” that the Fed’s current policy stance can steer inflation back toward its 2% target without destabilizing the labor market. The next few months of data, she stressed, will be critical in determining whether that balance is being achieved.
For now, her bias is clearly toward holding steady. If inflation slows while the labor market weakens materially, further cuts could become appropriate. But as things stand, Logan said, "I am more worried about inflation remaining stubbornly high."
Fed’s Hammack signals extended hold, favors patience
Cleveland Fed President Beth Hammack signalled little urgency to adjust policy, saying the Fed is in a good position to hold rates steady and let recent easing work through the economy. "we could be on hold for quite some time”, she added.
Hammack said she prefers to "err on the side of patience" rather than attempt to fine-tune the funds rate, noting that a steady policy stance would itself reflect a healthy economic backdrop. With rates close to a neutral level, she argued that holding steady allows policymakers to better judge how growth and inflation evolve.
She expects economic activity to pick up modestly this year, supported by easier financial conditions, recent interest rate reductions, and fiscal support, among other factors." Labour market conditions also appear broadly stable. Hammack described current dynamics as “low-hire, low-fire,” with businesses reluctant to expand payrolls aggressively but also avoiding large-scale layoffs.
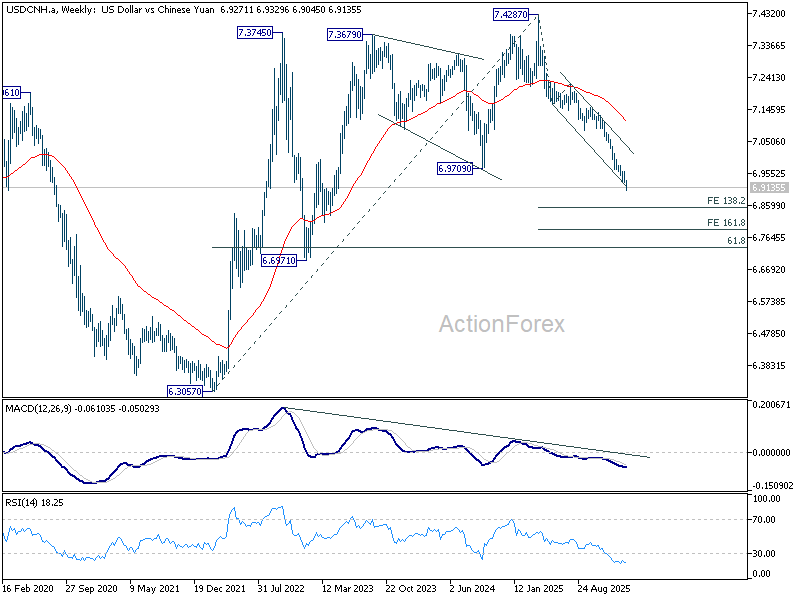
China CPI at 0.2% misses, but CNH breaks higher on Dollar weakness
The offshore Chinese yuan surged to its strongest level against Dollar in more than 33 months, with upside momentum showing signs of acceleration. However, the move has been driven far more by broad-based Dollar weakness than by any material improvement in China’s domestic fundamentals.
Today's Chinese data continue to highlight persistent deflationary pressure. January inflation slowed sharply from a three-year high of 0.8% yoy to just 0.2%, undershooting expectations of 0.4% and reinforcing doubts that the economy has decisively turned the corner on pricing power. Underlying details offered little reassurance. Core CPI rose 0.8% from a year earlier, easing from 1.2% in December.
At the producer level, prices remained firmly in deflation, with PPI improving from -1.9% to -1.4% yoy, extending a factory-gate deflation streak that has now lasted more than three years.
Despite efforts to curb destructive price wars across industries plagued by overcapacity, excess supply continues to weigh on margins and pricing.
Policy signals offer little near-term support for the currency. The PBoC reiterated this week that it will maintain a moderately loose monetary stance, prioritizing growth support and gradual price recovery. That guidance reinforces the view that Yuan strength is unlikely to be domestic policy-driven.
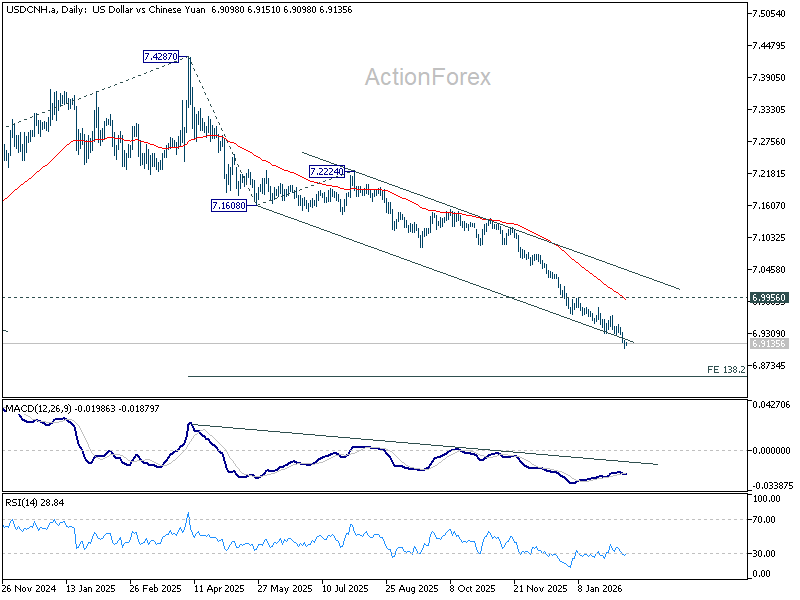
Technically, the break below the medium-term falling channel floor suggests USD/CNH’s decline from the 2025 high at 7.4287 is entering a renewed acceleration phase. Near-term outlook remains bearish as long as 6.9956 resistance caps rebounds, with the next downside target seen at 138.2% projection of 7.4287 to 7.1608 from 7.2224 at 6.8522.
AUD/USD Daily Report
Daily Pivots: (S1) 0.7062; (P) 0.7079; (R1) 0.7093; More...
AUD/USD's up trend resumed by breaking through 0.7093 resistance. Intraday bias is now on the upside for 100% projection of 0.5913 to 0.6706 from 0.6420 at 0.7213. On the downside, below 0.7063 minor support will turn intraday bias neutral again. But retreat should be contained above 0.6896 support to bring another rally.
In the bigger picture, current development argues that rise from 0.5913 (2024 low) is reversing whole down trend from 0.8006 (2021 high). Further rally should be seen to 61.8% retracement of 0.8006 to 0.5913 at 0.7206. This will remain the favored case as long as 0.6706 resistance turned support holds, even in case of deep pullback.
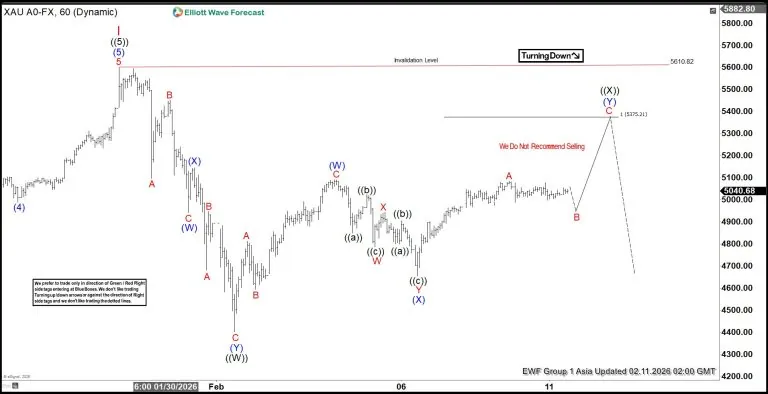
Gold (XAUUSD) Elliott Wave Outlook: Eyeing 5610 Retest
Gold (XAUUSD) reached an all-time high of $5610.8 on 29 January 2026, marking the completion of wave I. Since then, the metal has been correcting a larger cycle that began from the September 2022 low, unfolding within wave II. The correction is developing as a double three Elliott Wave structure, reflecting a complex adjustment in price action.
From the wave I peak, wave (W) ended at $4941.61, followed by wave (X) at $5145.73. The decline continued with wave (Y), which terminated at $4402.06. This sequence completed wave ((W)) of the higher degree. The market has since entered a rally in wave ((X)), which is also subdividing as another double three.
Within this advance, wave (W) ended at $5091.4. A pullback in wave (X) followed, reaching $4654.35. The current move higher is unfolding as wave (Y) in a zigzag formation. From the wave (X) low, wave A advanced to $5086.53. A corrective wave B is expected before the market resumes higher in wave C, with potential to retest the $5610.82 peak.
Completion of this rally would finalize wave (Y) of ((X)). As long as the pivot at $5610.82 remains intact, gold retains scope to turn lower again in wave ((Y)). This level is therefore critical, serving as a decisive reference point for traders assessing the next stage of the cycle.
Gold (XAUUSD) 60 minute chart
XAUUSD Elliott Wave Video
https://www.youtube.com/watch?v=zIdLtmrwMKA
Low-bar NFP to set up yield-driven USD/JPY reaction
The delayed January US non-farm payroll report finally lands today, but expectations are already deeply tempered. Markets are braced for just 66k job growth, with unemployment seen holding at 4.4%. While hiring is seen slow, wage pressure is expected to remain firm. Average hourly earnings are forecast to rise 0.3% mom. Labor demand may be cooling, but without translating into meaningful disinflation pressure.
Meanwhile, officials from the US administration appeared keen to talk down expectations around job creation. National Economic Council Director Kevin Hassett said this week that tighter immigration enforcement and rapid productivity gains driven by artificial intelligence are suppressing demand for new workers. Those dynamics, he argued, could keep payroll growth low even as output remains strong.
Despite that, Hassett struck an upbeat tone, suggesting the economy could still deliver a powerful mix of lagging job creation alongside surging productivity, profits, and GDP. That framing implies that slower hiring should not automatically be read as economic stress.
Markets, however, are unlikely to to put too much attention on rhetoric. The more immediate focus remains on Treasuries. US 10-year yields have fallen sharply this week, extending losses after yesterday’s retail sales miss. The question now is whether bonds are genuinely front-running a more aggressive Fed easing path, or whether investors are simply reassessing “Sell America” narrative as overstated once hard data failed to confirm it. Today’s reaction to payrolls release could help resolve that ambiguity.
Technically, 10-year yield's strong break below 55 D EMA suggests the rebound from the 3.947 low may already have completed at 4.311 as a corrective bounce. Decisive break below 4.108 support would solidify that view and reopen downside toward the 3.947 area.
In the currency markets, the corresponding pair to watch is USD/JPY. The pair initially dives this week as reaction to Japan's election results. But the last leg was clearly driven by the fall in US yields. Decline from 157.65 is seen as part of the corrective pattern from 159.44. While deeper fall could be seen to 152.07, strong support is expected from 38.2% retracement of 139.87 to 159.44 at 151.96 to bring rebound. However, decisive break of 151.96 would argue that USD/JPY is already in bearish trend reversal.
WTI Crude Oil Eyes Breakout While US NFP Sets Stage For Volatility Surge
Key Highlights
- WTI Crude Oil prices started a decent increase above $63.50.
- A key bullish trend line is forming with support at $63.70 on the 4-hour chart.
- Gold started a fresh increase above $4,950 and $5,000.
- EUR/USD found support near 1.1780 and corrected some losses.
WTI Crude Oil Price Technical Analysis
WTI Crude Oil price started a decent increase above $61.50 against the US Dollar. The price settled above $62.50 to enter a positive zone.
Looking at the 4-hour chart of XTI/USD, the price tested the $65.25 zone before there was a downside correction. The price retested the $62.50 support and recently recovered some losses. It remained well above the 100 simple moving average (red, 4-hour) and the 200 simple moving average (green, 4-hour).
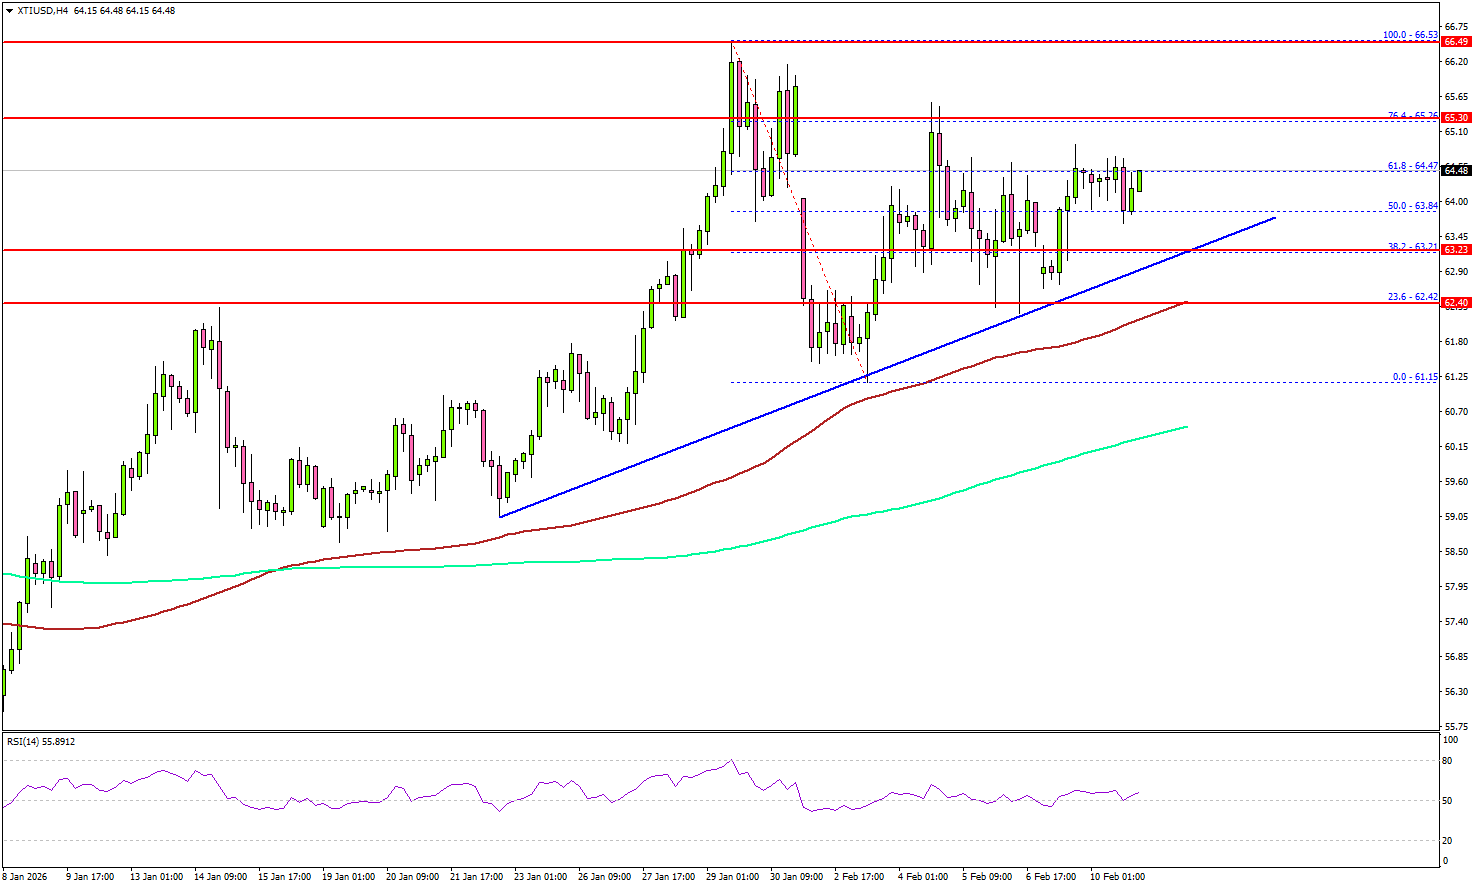
On the upside, immediate resistance is near the $65.30 level. The first key hurdle for the bulls could be $66.50. A close above $66.50 might send Oil prices toward $68.00. Any more gains might call for a test of $70.00 in the near term.
On the downside, the first major support sits near the $63.70 zone. There is also a key bullish trend line forming with support at $63.70. The next support could be $62.40 and the 100 simple moving average (red, 4-hour).
A daily close below $62.40 could open the doors for a larger decline. In the stated case, the bears might aim for a drop toward $60.50 and the 200 simple moving average (green, 4-hour).
Looking at Gold, the bulls remained in action, and the price started a fresh increase above the $5,000 resistance.
Economic Releases to Watch Today
- US nonfarm payrolls for Jan 2026 – Forecast 70K, versus 50K previous.
- US Unemployment Rate for Jan 2026 - Forecast 4.4%, versus 4.4% previous.