
Sample Category Title
Fed’s Logan says inflation, not jobs, now bigger risk
Dallas Fed President Lorie Logan struck a cautious tone on further easing, arguing that downside risks to the US labor market "appear to have meaningfully dissipated" following last year’s three interest-rate cuts. Speaking overnight, Logan said those moves had helped stabilize employment conditions but had also introduced fresh risks on the inflation side.
While she expects inflation to make progress this year, Logan laid out a series of concerns that argue against complacency. She pointed to pending tariff effects, supportive fiscal policy, buoyant financial conditions, and the possibility that deregulation and new technologies could add to price pressures rather than dampen them.
Against that backdrop, Logan said she is “cautiously optimistic” that the Fed’s current policy stance can steer inflation back toward its 2% target without destabilizing the labor market. The next few months of data, she stressed, will be critical in determining whether that balance is being achieved.
For now, her bias is clearly toward holding steady. If inflation slows while the labor market weakens materially, further cuts could become appropriate. But as things stand, Logan said, "I am more worried about inflation remaining stubbornly high."
RBNZ to Hike More Quickly in 2027
- Our first Economic Overview of 2026 includes a revised view on the shape of the RBNZ’s tightening cycle.
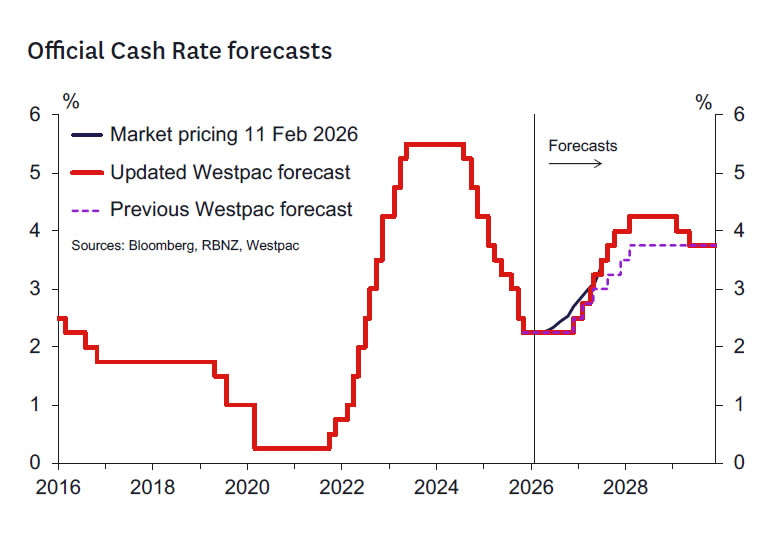
- We continue with our longstanding view of a first hike in the OCR to 2.50% in December 2026.
- But in 2027 the RBNZ will pick up the pace and tighten at each meeting from February to September 2027. The OCR is expected to reach 4% by end-2027 and peak at 4.25% in early 2028.
- Excess capacity will likely be exhausted by early 2027 implying a need for the RBNZ to return the OCR to neutral levels more quickly in 2027.
- But the RBNZ will take time in 2026 to be sure the recovery takes hold and as headline inflation falls towards 2%.
- Interest rates will remain stimulatory for all of 2026 and early 2027 and will drive a need for modestly restrictive conditions over 2028.
- We continue to assume a neutral OCR of 3.75%. Hence to achieve restrictive levels, the OCR will need to peak at 4.25% in early 2028.
Picking up speed.
Westpac’s inaugural 2026 Economic Overview will be released early Thursday morning. These forecasts depict an improved economic outlook for 2026 and beyond as the combination of low interest rates, strong commodity returns and a supportive exchange rate drive above trend growth in 2026 and 2027.
It now appears that, if recent growth trends are sustained, excess capacity in the economy will be exhausted more quickly and that the output gap will be closed by early 2027. The unemployment rate should accordingly be noticeably lower and below 5%.
Inflation remains too high but should fall over 2026 as factors that boosted inflation in 2025 – especially higher food and petrol prices – rise more slowly in 2026. But underlying inflation pressures remain persistent and should leave the RBNZ progressively less comfortable in maintaining stimulatory interest rates as 2026 wears on.
We think the prospect of declining headline inflation will give the RBNZ cover to leave the OCR on hold for most of 2026 so they can take the maximum time to assess the strength and durability of the economic recovery. But once they have achieved confidence that above trend growth will endure through 2026, it will be time to act and return the OCR to more neutral levels.
The RBNZ sees the neutral OCR in the 3-3.5% range while Westpac sees a 3.75% neutral OCR. Hence any way you cut it, there will be quite a bit of action required to even achieve neutral levels from December 2026. Fast action will be required given excess capacity should be exhausted by then.
Hence, we have revised up our view of how quickly the RBNZ will lift the OCR over 2027. We expect a standard cycle where the OCR is raised by 25bp at each meeting from February to September 2027, by which time the OCR will have reached our view of the neutral OCR.
From September 2027 we see a slower pace of OCR increases as at this stage policy will be moving into restrictive territory. We think at this point just modestly restrictive interest rates of around 4.25% will be ultimately required to keep inflation close to 2%. We see the OCR remaining at 4.25% over 2028 before returning to a neutral 3.75% setting in 2029.
More details on our new macroeconomic outlook will be available in our February Economic Overview, which will be released at 5am Thursday 12 February NZT.
Dow Hits New Record: Can S&P 500 Breakout Pass 7000 and Gain Acceptance?
- The Dow Jones Industrial Average achieved a third consecutive record high, while the S&P 500 and Nasdaq closed in the red.
- Market anxiety increased due to flat US retail sales data and massive projected capital expenditures for AI infrastructure.
- The S&P 500 shows signs of a potential breakout above 7000.
- Caution is advised in the near term, with the Fear and Greed Index in "extreme greed" territory and significant volatility expected from upcoming US jobs and CPI data.
Market performance was mixed on Tuesday as the Dow Jones Industrial Average secured its third consecutive record high, while the S&P 500 and Nasdaq ended the session in the red.
Market participants were primarily focused on flat retail sales data and the anticipation of an upcoming labor market report.
The communication services sector suffered the most significant decline, largely due to a 1.8% drop in Alphabet shares following the company’s $20 billion bond sale. This move intensified broader market anxieties regarding the massive capital expenditures required for AI infrastructure, with industry giants like Amazon, Alphabet, Meta, and Microsoft projected to spend hundreds of billions of dollars collectively throughout 2026.
S&P 500 Heatmap
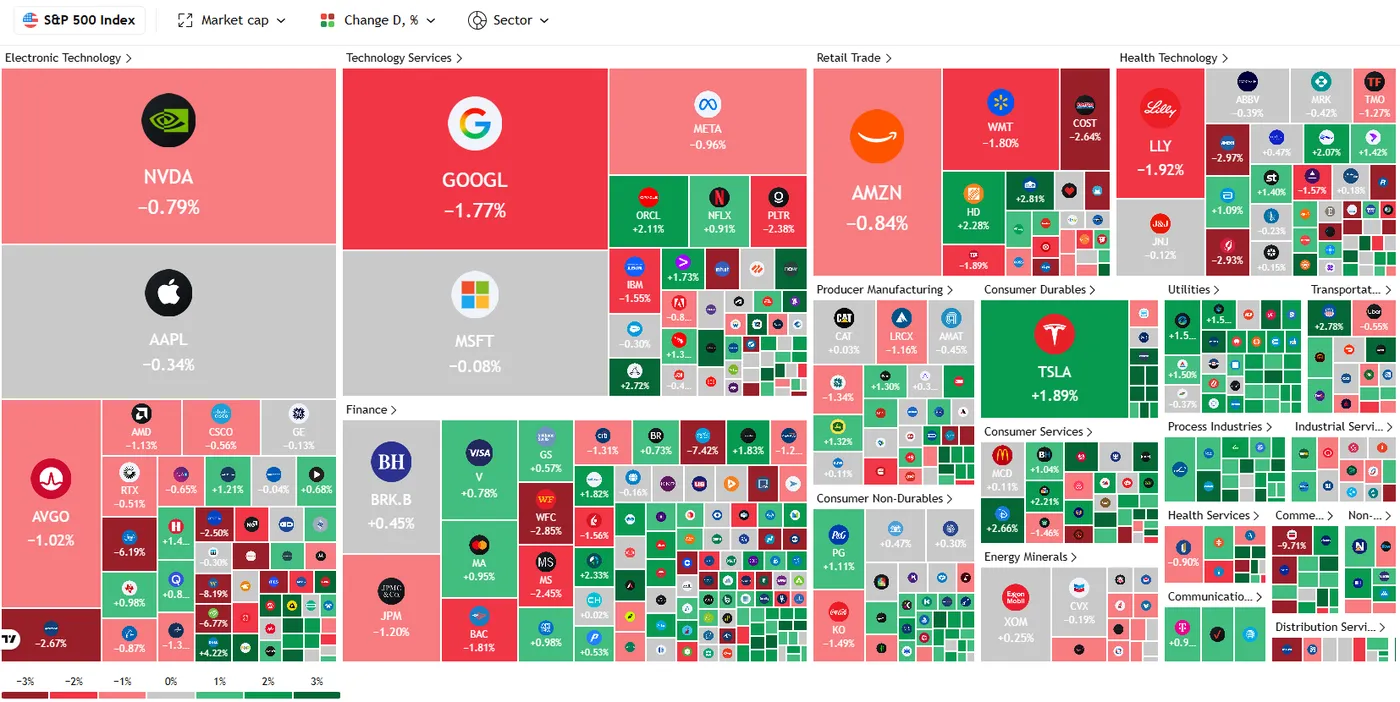
Source: TradingView
Economic indicators added to the cautious sentiment, as US retail sales remained stagnant in December, missing the 0.4% growth forecasted by economists. This lack of growth, driven by reduced spending on big-ticket items like vehicles, suggests a cooling economy as the new year begins. Despite the sluggish data, expectations for a dovish shift from the Federal Reserve increased, with the probability of an April rate cut rising to 36.9% from Monday's 32.2%.
Nevertheless, the consensus remains that rates will hold steady until June, coinciding with the potential leadership transition to Fed chair nominee Kevin Warsh, pending Senate approval.
The Dow Jones Industrial Average rose to 50609, an intraday record high earlier in the day before a pullback to close the session around the 50348 handle.
Is the S&P 500 poised for a breakout beyond 7000?
The S&P 500 has all but recovered from the selloff which began on February 3 and culminated in a low print of 6735 on February 5.
There are signs from both a technical and fundamental perspective which hint at a potential upside breakout.
First we have the technical picture where we have a golden cross pattern which hints at further upside.
The period-14 RSI remains above the 50 handle, hinting at the bullish momentum still in play.
Price does need to hold above the swing low at 6905 to keep the bullish structure intact. A four-hour candle close below this level could open up a deeper correction.
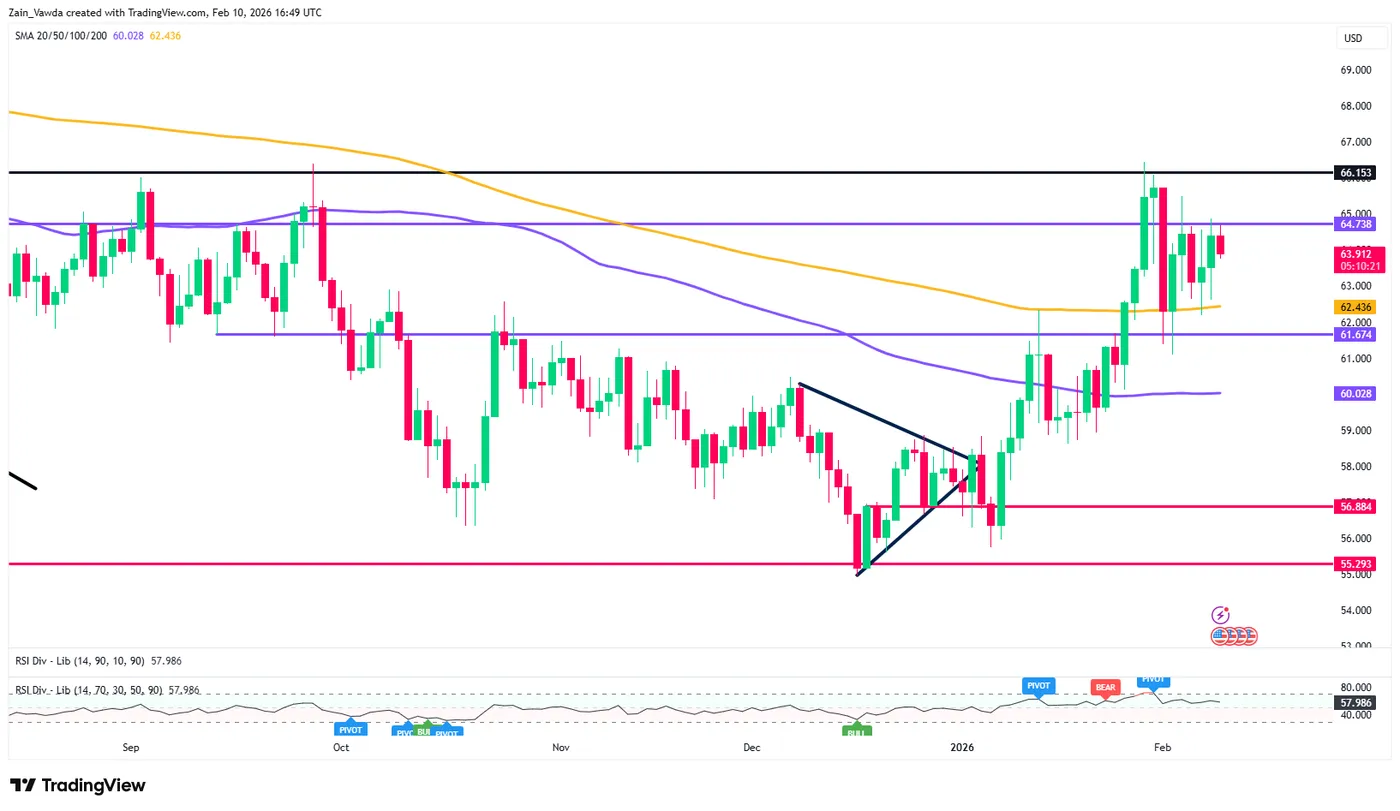
SP 500 Four-Hour Chart, February 10, 2026
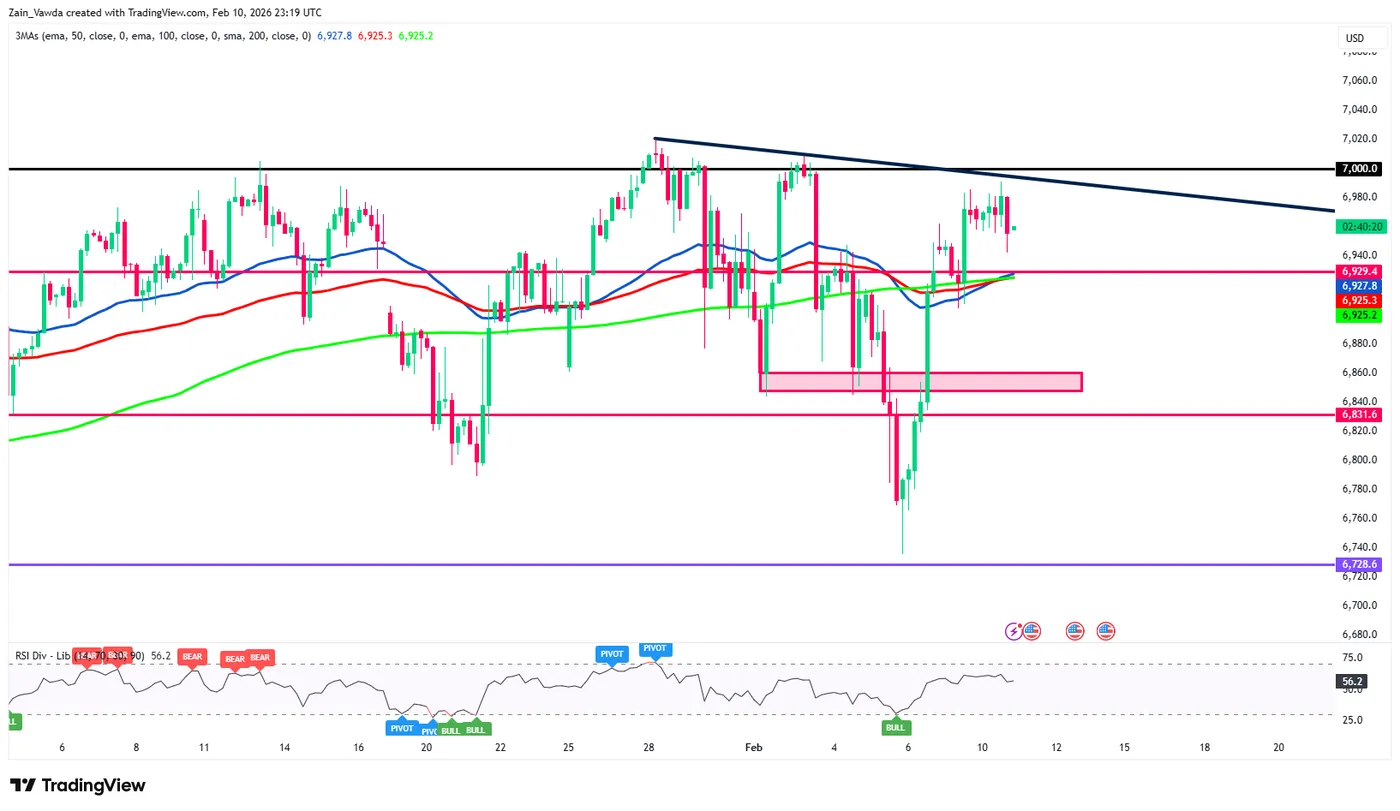
Source: TradingView (click to enlarge)
Looking at other factors that hint at more upside and Goldman Sachs' US Equity Sentiment Indicator is stuck at 0.0, a neutral reading that in the past has tended to precede gains in the S&P 500 over the following month.
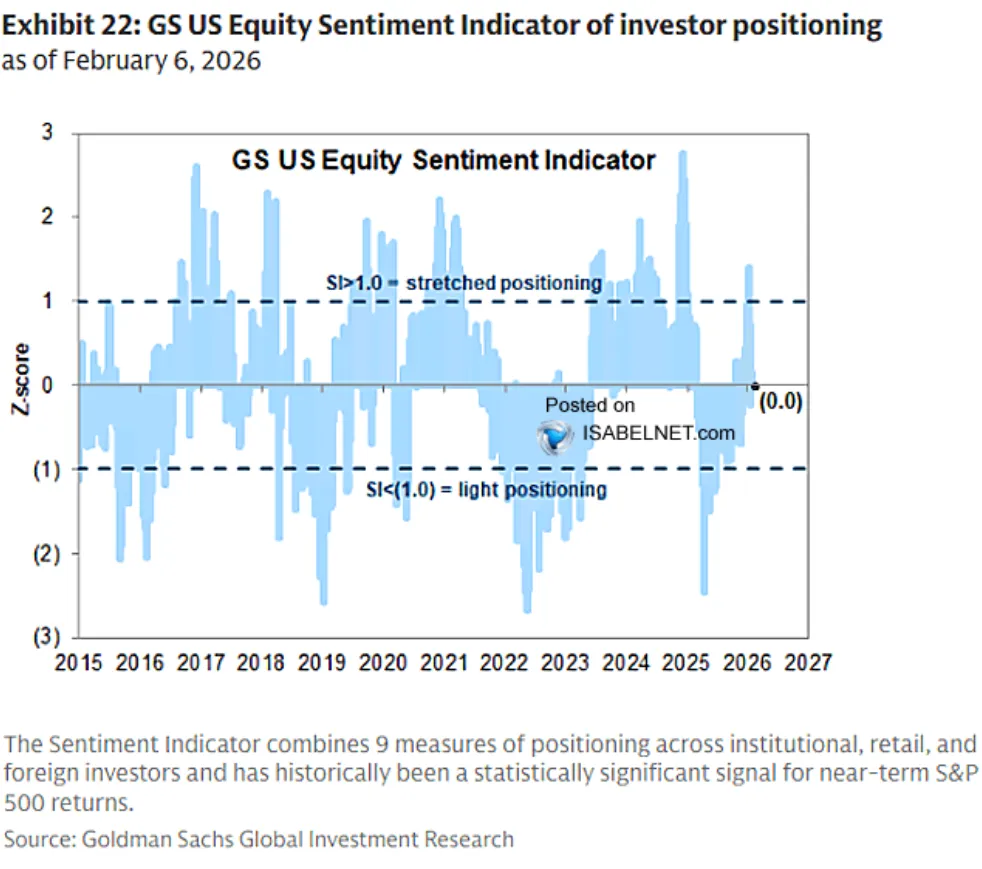
Source: Isabelnet
If history is to repeat itself, the S&P 500 could be setting up for another rally with hopes of consolidation above the 7000 handle.
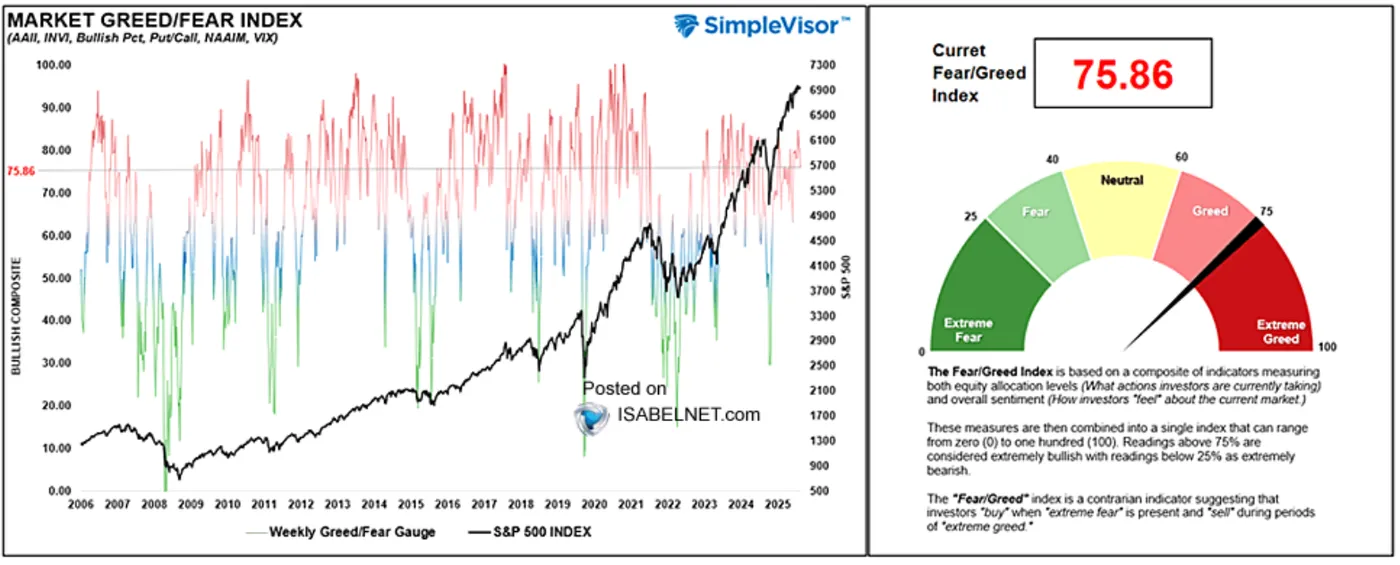
In the near-term though there could be a temporary pause. The fear and greed index is currently in extreme greed territory, around the 75.86 mark. The bulls appear to be holding their ground as it looks like the rally still has its fans.
Source: Isabelnet
Up next we have US data which could have significant implications for US equity markets. The jobs data and CPI print could both influence rate cut expectations and thus drive significant volatility.
The Oil Tug-of-War: Geopolitics vs. Global Glut Continues. Will Bulls or Bears Prevail?
- Oil prices are in a "tug-of-war" between short-term geopolitical risk (US-Iran tensions) and a long-term global supply surplus.
- A bullish spike for WTI is possible if tensions escalate, potentially breaking above $65.
- A massive 4 mb/d supply glut forecasted for 2026 acts as a ceiling, with a bearish correction below $62.40 exposing $55.00.
The crude oil market is characterized by a delicate balancing act between escalating geopolitical risk premiums and a looming global supply surplus at present.
Prices for both West Texas Intermediate (WTI) and Brent crude have remained steady near six-month highs, even as the market faces conflicting signals from diplomatic channels and maritime warnings.
The global benchmarks are trading in a tight, consolidated range as investors weigh the potential for supply disruptions against a bearish long-term fundamental outlook
What is moving oil prices at the moment?
The market's current "coiling" behavior where prices trade in a narrowing range and is being driven by three primary factors:
The US-Iran Geopolitical Risk Premium: The most immediate driver is the "tug-of-war" between Washington and Tehran. While indirect nuclear talks in Oman have been described as a "good start," significant friction remains.
The US Department of Transportation recently issued a maritime advisory for American-flagged vessels to stay clear of Iranian territorial waters in the Strait of Hormuz. Because nearly 20% of global oil consumption passes through this strait, any threat of interception or military escalation keeps a "fear premium" embedded in the price.
The "India-Russia" Factor and Sanctions: Markets are closely monitoring a potential shift in global trade flows. Recent US-India trade discussions have reportedly been linked to New Delhi freezing or reducing its imports of Russian crude. As India is a top buyer of Russian oil, any significant disruption to this flow would force a massive reshuffling of global supply, likely tightening the market and pushing prices higher in the short term.
Long-term Supply Surplus vs. Short-term Tensions: Acting as a ceiling on prices is the fundamental reality of 2026: a massive supply glut. The International Energy Agency (IEA) and the EIA have forecast that global production driven by OPEC+ output hikes and record production from the US, Canada, and Brazil is outstripping demand. The IEA estimates a surplus of nearly 4 million barrels per day (mb/d) this year, which is preventing geopolitical spikes from turning into a sustained bull run.
Forward Outlook - bulls or bears to prevail?
Market analysts suggest that crude is at a technical crossroads. Here is the outlook for the coming weeks:
- The Bullish Breakout Scenario: If US-Iran tensions escalate further or if Iranian forces intercept a tanker in the Strait of Hormuz, Oil prices could be in for a spike. For WTI, a clean close above $65 could open the door for a run toward $66.60.
- The Bearish Correction Scenario: If diplomacy in Oman yields a concrete breakthrough or if the focus shifts back to the global supply surplus, prices could retreat sharply.
Technical support for WTI sits at $62.40 (200-day MA), with a break below that level potentially exposing a decline toward $55.00 the lower bound of the long-term trending channel.
- Long-term Forecast: Most major agencies, including the EIA, maintain a bearish outlook for the remainder of 2026. However, thus far the geopolitical situation continues to cast a shadow over oil markets.
Brent Crude Oil Daily Chart, February 9, 2026
Source: TradingView (click to enlarge)
Silver (XAG/USD) Tests $80 Ahead of NFP – What’s Next?
Silver is the only precious metal trading higher in today's session, leaving traders with a sense of urgency: Is it time to enter at a discount, or is it better to stay away?
With tricky times ahead, it is essential to step back and develop a game plan to avoid traps.
The metals run was gigantic, spanning from mid-2024 to February, and it could still be early to call its end, with Gold back above $5,000.
The craziest part, however, is realizing that Silver was just around $32 a year ago, quite a change in value when we see $30 moves in just one volatile session these days.
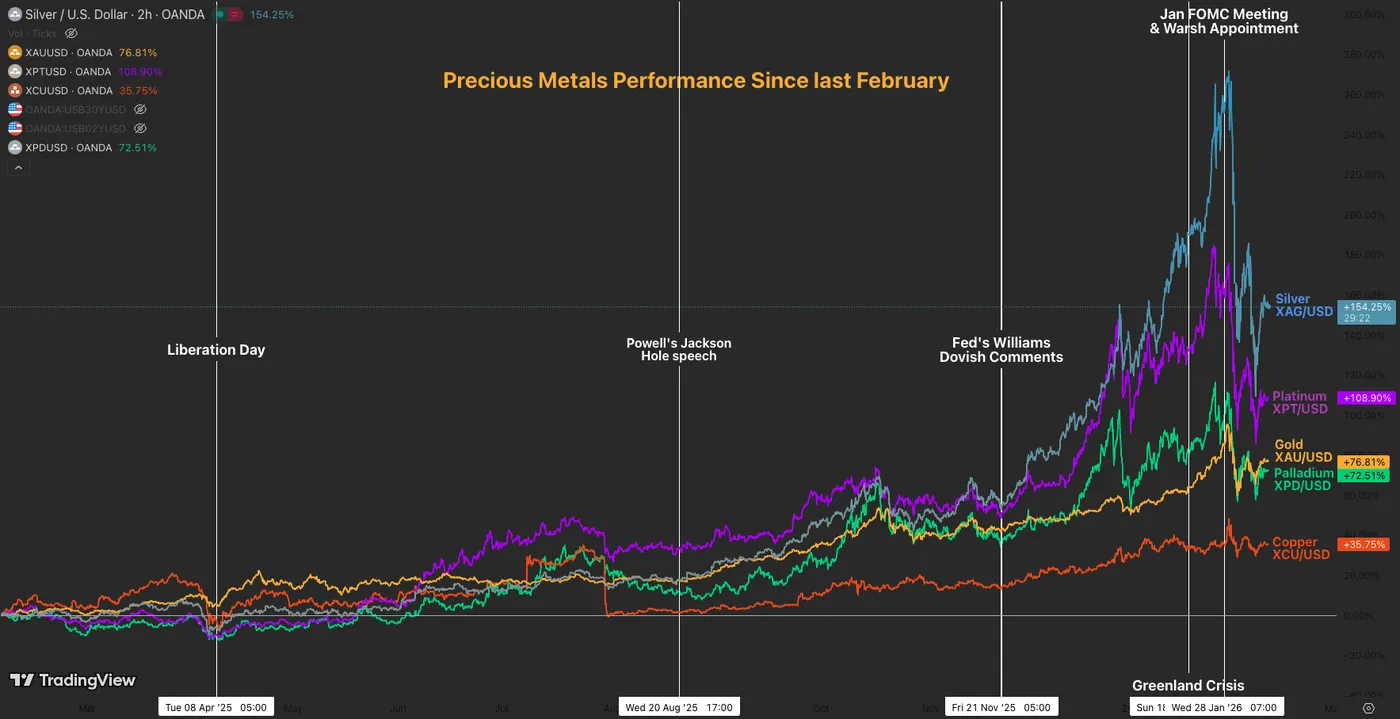
Metals performance since last February – Source: TradingView. February 10, 2026
Volatility is toning down with uncertainty still running high, and traders are looking to solve at least a few pieces of the puzzle throughout this week's US Data.
Metals rebounded in the past session, benefiting from the dollar's struggling denominator and participants' reluctance to liquidate their safe-haven assets while the geopolitical picture remains blurry.
After this morning's miss in US Retail Sales (0% vs 0.4% exp), Markets remain cautious ahead of tomorrow's Non-Farm Payrolls and Friday's CPI report before moving their pieces further.
If the data takes a dovish turn (missing expectations), the pricing for a Fed cut in March can change swiftly. It is currently priced around 20%.
Another tricky part will be the waiting between tomorrow's release and Friday's inflation report, but with latest Fed communications, there seems to be a certain tilt towards employment so NFP could lead the next trend in Metals.
We will dive into a Silver multi-timeframe analysis to prepare for Non-Farm Payrolls, with a few scenarios depending on tomorrow's data. Let's get right into it.
Silver (XAG/USD) Multi-timeframe Technical Analysis
Daily Chart
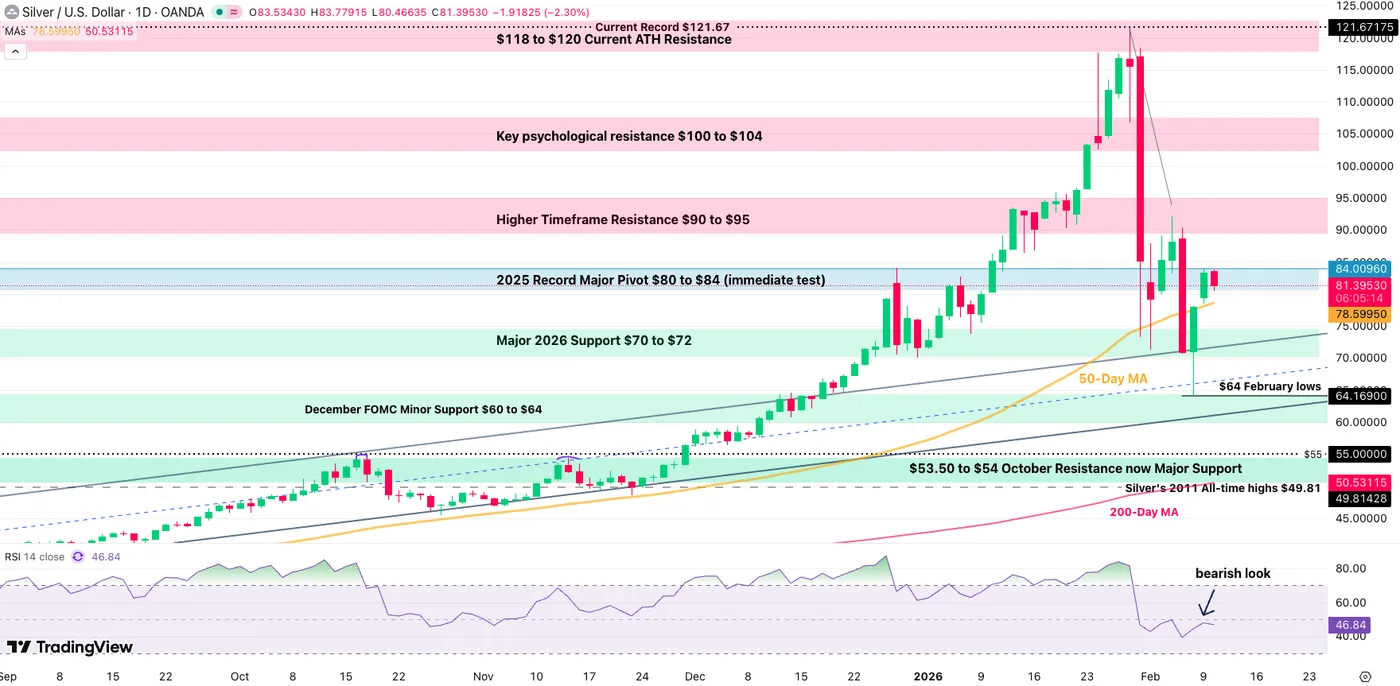
Silver Daily Chart, February 10, 2026 – Source: TradingView
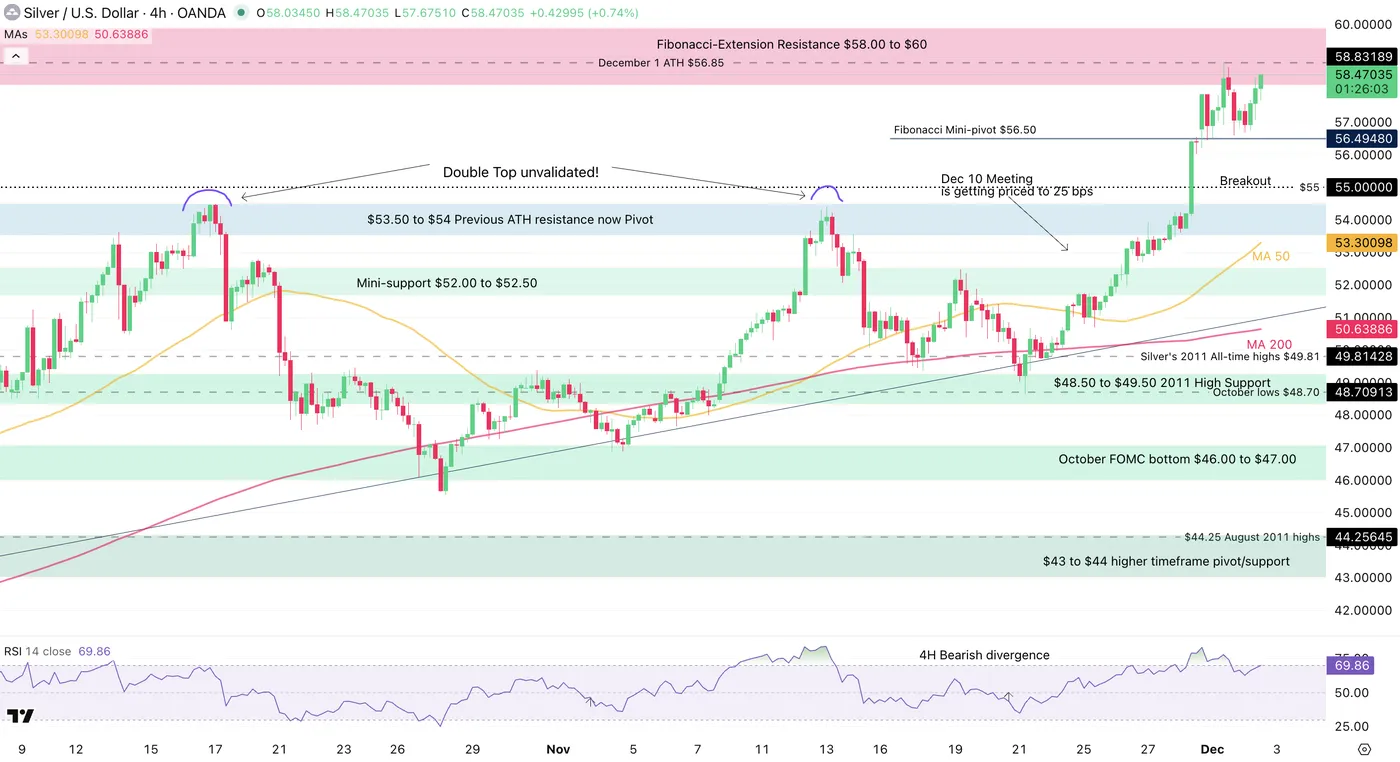
The action on the daily is not showing much certainty, with Silver trading back above its 50-Day Moving Average but the RSI showing opposite, bearish rejection signs. Nevertheless, the past sessions bring prices back to interesting levels ahead of upcoming action.
Having troughed at $64, Silver is trading close to $20 higher in the establishment of a new intermediary trading range.
The higher timeframe $80 to $84 pivot serves as a guide for upcoming action.
- A dovish Non-Farm payrolls (anything below 40K, exp 70K) should fuel a rally above as traders price cuts: A session close above $84 should see continuation .
- Any as-expected release or higher than expected should see rejection of current levels. Any push below $80 should see continuation back towards the $70 to $72 Support zone. Depending on the extent of a beat, the price could even break the $64 lows.
- A risk-off event could push Silver higher, but flows would go more towards Gold in such scenario.
4H Chart and Technical Levels
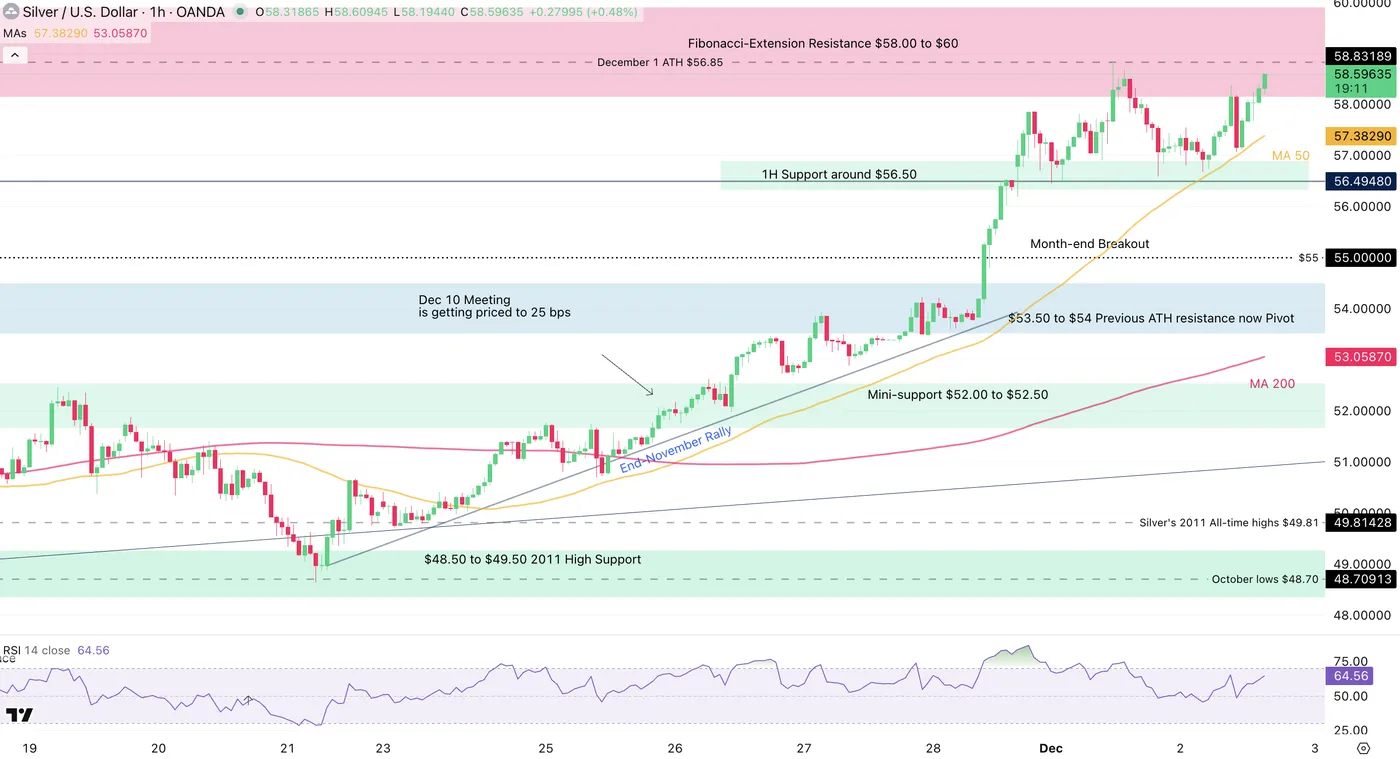
Silver 4H Chart, February 10, 2026 – Source: TradingView
Despite the rebound last week, it would be early to call for a resumption of the rally.
The 4H RSI is also pointing to a rejection ahead of the Non-Farm payroll, but the movement could stay calm before – Keep a close eye on the descending trendline.
Any break of the $70 support hints first at a retest of the $60 to $64 support.
Any move below would require an updated analysis, but traders can look at the $50 to $54 Major Support.
Levels to watch for Silver (XAG) trading:
Resistance Levels:
- 2025 Record Major Pivot $80 to $84 (immediate rejection)
- Session Highs $84
- Higher Timeframe Major Resistance $90 to $95
- Feb 4 highs $92.20
Support Levels:
- Major 2026 Support $70 to $72
- December FOMC Minor Support $60 to $64 (Feb Lows)
- $50 to $54 Major Support
- October FOMC bottom $46.00 to $47.00
- $45.55 October 28 lows
1H Chart
Silver 1H Chart, February 10, 2026 – Source: TradingView
The immediate action looks toppy but to be even more realistic, looks like there won't be much action this afternoon.
Except for a small intraday Head & Shoulders forming, pointing to $77 Silver throughout the session (first need to breach the 50H MA), the wisest position to take is to wait for tomorrow before looking for direction.
In the meantime, the most impatient can expect a $77 to $83 range ahead of tomorrow's NFP release (8:30 A.M. ET)
Safe Trades and Happy 10th of February (it's my birthday)!
CADJPY Wave Analysis
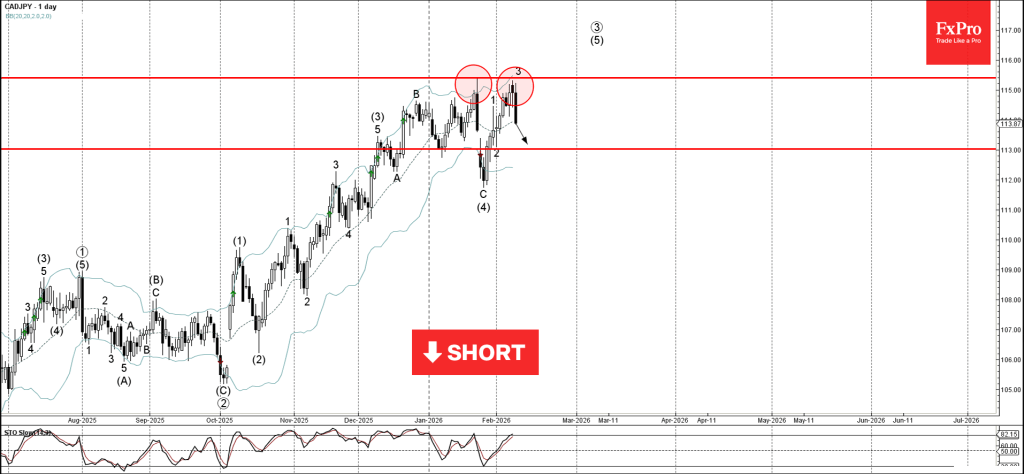
CADJPY: ⬇️ Sell
- CADJPY reversed from resistance area
- Likely to fall to support level 113.00
CADJPY currency pair recently reversed from the resistance area between the key resistance level 115.40 (former monthly high from January) and the upper daily Bollinger Band.
The downward reversal from this resistance zone stopped the previous minor impulse wave 3 of the intermediate impulse wave (5) from last month.
Given the strength of the resistance level 115.40 and the overbought daily Stochastic, CADJPY currency pair can be expected to fall to the next support level 113.00.
USD/JPY: Yen Extends Strong Post-Election Advance Through Key Technical Levels
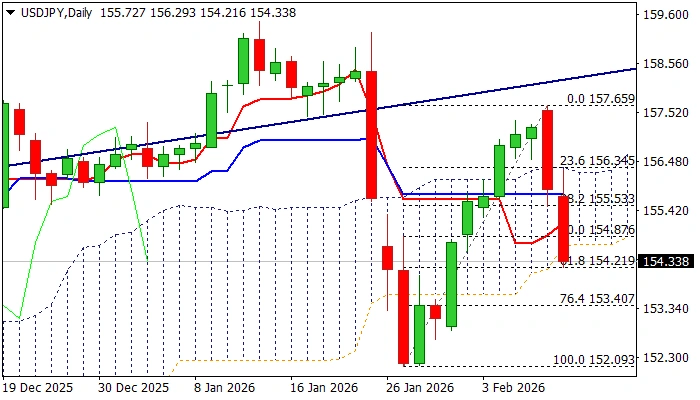
USDJPY extends steep fall (from 157.65 lower top of Feb 9) into second straight day, as Japanese currency rallied after PM Takaichi’s election victory boosts prospects for stronger economic growth as well as brightens outlook for more hawkish stance on monetary policy.
Revived talks about potential intervention also contributed to yen’s fresh strength.
The pair was down 2% since Monday’s opening, with growing prospects for further weakness after the latest acceleration lower broke some important technical levels.
Fresh weakness surged through ascending daily Ichimoku cloud (spanned between 156.34 and 154.68), while today’s action emerged below cloud and dented Fibo support at 154.26 (61.8% retracement of 152.10/157.65 upleg), reinforced by 100DMA).
Strengthening negative momentum and most of MA’s being in bearish setup on daily chart, support negative scenario.
Close below cloud base is needed to validate signal, with firm break of 154.26 pivot to further weaken near-term structure for attack at 153.40 (Fibo 76.4%) and unmask key support at 152.10 (Jan 27/28 higher base).
Res: 154.68; 155.00; 155.53; 155.77
Sup: 154.21; 153.40; 152.86; 152.10
Eco Data 2/11/26
| GMT | Ccy | Events | Act | Cons | Prev | Rev |
|---|---|---|---|---|---|---|
| 01:30 | CNY | CPI Y/Y Jan | 0.20% | 0.40% | 0.80% | |
| 01:30 | CNY | PPI Y/Y Jan | -1.40% | -1.50% | -1.90% | |
| 13:30 | CAD | Building Permits M/M Dec | 6.80% | 4.90% | -13.10% | -13.20% |
| 13:30 | USD | Nonfarm Payrolls Jan | 130K | 66K | 50K | 48K |
| 13:30 | USD | Unemployment Rate Jan | 4.30% | 4.40% | 4.40% | |
| 13:30 | USD | Average Hourly Earnings M/M Jan | 0.40% | 0.30% | 0.30% | 0.10% |
| 15:30 | USD | Crude Oil Inventories | 8.5M | -0.2M | -3.5M | |
| 18:30 | CAD | BOC Summary of Deliberations |
| 01:30 | CNY |
| CPI Y/Y Jan | |
| Actual | 0.20% |
| Consensus | 0.40% |
| Previous | 0.80% |
| 01:30 | CNY |
| PPI Y/Y Jan | |
| Actual | -1.40% |
| Consensus | -1.50% |
| Previous | -1.90% |
| 13:30 | CAD |
| Building Permits M/M Dec | |
| Actual | 6.80% |
| Consensus | 4.90% |
| Previous | -13.10% |
| Revised | -13.20% |
| 13:30 | USD |
| Nonfarm Payrolls Jan | |
| Actual | 130K |
| Consensus | 66K |
| Previous | 50K |
| Revised | 48K |
| 13:30 | USD |
| Unemployment Rate Jan | |
| Actual | 4.30% |
| Consensus | 4.40% |
| Previous | 4.40% |
| 13:30 | USD |
| Average Hourly Earnings M/M Jan | |
| Actual | 0.40% |
| Consensus | 0.30% |
| Previous | 0.30% |
| Revised | 0.10% |
| 15:30 | USD |
| Crude Oil Inventories | |
| Actual | 8.5M |
| Consensus | -0.2M |
| Previous | -3.5M |
| 18:30 | CAD |
| BOC Summary of Deliberations | |
| Actual | |
| Consensus | |
| Previous | |
Sunset Market Commentary
Markets
US retail sales injected more momentum to the dovish repositioning that originated from last week’s disappointing set of labour market data (job cuts, JOLTS, jobless claims). American consumers tightened the belt in the final month of 2025 with both the headlines series as well as the core gauges (ex. auto & ex. auto and gas) showing no growth compared to the (downwardly revised) month before. The control group series, used in GDP calculations for private consumption of goods, even declined by 0.1% m/m. All of the measures missed the common consensus bar of 0.4%. 8 out of the 13 categories printed declines, including the only services-related one (restaurants and bars, -0.1% m/m). Building materials (1.2%) along with sporting goods (0.4%) were among the sole risers. The retail sales are not adjusted for inflation so some of the traditional steep holiday discounts may have had an impact. But that’s a nuance markets are not really picking up, especially with separate data on labor cost growth only reinforcing the current dovish bias. The Employment Cost Index rose 0.7% in Q4 of 2025, a deceleration from the 0.8% in Q3 and the slowest pace since 2021. Fading wage pressures support the case for cutting rates on further subsiding upside inflation risks. ADP’s weekly employment indicator showed encouraging signs. The NER pulse climbed for three weeks straight now, to a weekly average of 6.5k in the four weeks to January 24. With tomorrow’s payrolls and 2025 annual revision on tap it carries too little weight though. US Treasuries extended earlier gains with the long end outperforming the front. Net daily changes currently vary between -3.5 to -7 bps. A Fed rate cut in June is now more than fully priced in. The 10-yr tenor risks losing the 4.2% support. European rates lose ground in sympathy with Bund yields dropping 1-3.5 bps in a bull flattener. Attention of European investors should gradually turn to the informal summit on Thursday. Macron seized the moment and championed Eurobonds again in interviews published by six (!) European media outlets. The French president is a fan of common debt to finance what he calls three innovation battles: AI and quantum computing, the energy transition and defense. The dollar holds steady with DXY only losing marginal ground due to back-to-back JPY strength after PM Takaichi’s landslide election victory. USD/JPY falls below 155 to test the 100dMA. Other signs of market approval emerged from a strong JGB session. Long-term yields shed between 6-8 bps. EUR/USD is going nowhere near yesterday’s +1.19 close. US stock markets open mixed, tech underperforms.
News & Views
January inflation data published by Statistics Norway surprised sharply to the upside. Headline inflation jumped 0.6% M/M and 3.6% Y/Y (3.2% in December). Underlying CPI-ATE inflation (excluding energy and tax changes) accelerated to 0.3% M/M and 3.4% Y/Y (from 3.2%). Strong monthly price increases were reported a.o. for food (1.4% M/M), housing, water electricity, gas and other fuels (+1.3%), transport (+1.2%) and insurance and financial services (2.1%). The Norges Bank (NB) back in December forecasted January headline inflation at 2.7% Y/Y and CPI-ATE at 2.9%. The upward inflation surprise comes after solid Q4 growth reported yesterday. At its January 21 policy meeting the NB left its policy rate unchanged (4%) as it considered inflation staying too high, but flagged that, if the economy would evolve broadly as expected it might cut the policy rate later this year (one or two 25 bps steps). This condition is now in question. The 2-y swap yield jumped 20 bps (4.43%). Markets priced out a rate cut by end Q2. The Norwegian krone appreciated from the EUR/NOK 11.425 area to currently trade near 11.34, testing the strongest levels since early April last year and nearing the EUR/NOK 11.26 support (2024/2025 strongest for the NOK).
Brazilian inflation rose by 0.33% M/M and 4.44% Y/Y (was 4.26% in December), data published by Statistics Agency IBGE showed today. The outcome was close to expectations. This keeps inflation near the top, but within the 3% +/- 1.5% target range of the Brazilian central bank. The central bank left its Selic policy rate unchanged at 15% at the January policy meeting. However, in the meeting Minutes published last week, the bank indicated that it was ‘appropriate to signal the beginning of an interest-rate easing cycle in its next meeting’ even as it remains necessary to ‘maintain interest rates at restrictive levels until not only the disinflation process is consolidated but also expectations are anchored to the target, given the resilience of factors pressuring both current and expected prices, particularly the dynamism still observed in the labor market’. Today’s data still support the scenario to start easing in March. The Brazilian real, after a strong performance at the start of the year today holds near USD/BRL 5.2.
US: Retail Sales Take a Breather in December
Retail sales remained flat in December, taking a break after a solid gain in November. The headline figure came in weaker than the consensus forecast, which called for sales to increase by 0.4% month-over-month (m/m).
Sales of autos and parts edged lower by 0.2% m/m, while sales at gasoline stations were slightly higher on the month (+0.3% m/m). Meanwhile, sales at building and garden retailers posted a solid gain (+1.2% m/m), advancing for the second consecutive month.
Sales in the "control group", which excludes the three above categories, edged lower (-0.1%). November's gain was also revised lower to 0.2% m/m (from 0.4% m/m). Sales declined at furniture & home furnishing stores (-0.9%) and miscellaneous store retailers (-0.9% m/m), but the pullback in the latter followed three months of strong gains. Ditto for clothing and accessory stores (-0.7% m/m). Sales where little changed elsewhere.
Following a solid gain in November, spending at bars and restaurants was soft in December (-0.1% m/m). This is the only service category in the report.
Key Implications
Retail sales ended the year on a softer footing. After rising for two consecutive months, core sales took a breather in December, while the negative revisions to the previous two months suggest that retail spending had a bit less bounce in its step than previously reported. Still, consumer spending remained resilient through the final quarter of 2025, which was marked by a lengthy government shutdown. According to our tracking, consumer spending likely increased by around 3.0% (annualized) in Q4 2025, only slightly lower than the 3.5% gain in the previous quarter.
As we wrote in our recent report, although consumers at different income levels are experiencing diverging economic outcomes, overall consumer spending is expected to remain robust through 2026. Households are expected to benefit from OBBBA-related fiscal support via higher tax refunds and lower income taxes. Tax refunds, expected between February and April are likely to average $800-$1,000 more than usual, helping to temporarily boost income and spending. Easier financial conditions, previous wealth gains, and some stabilization in the labor market will also help.