Sample Category Title
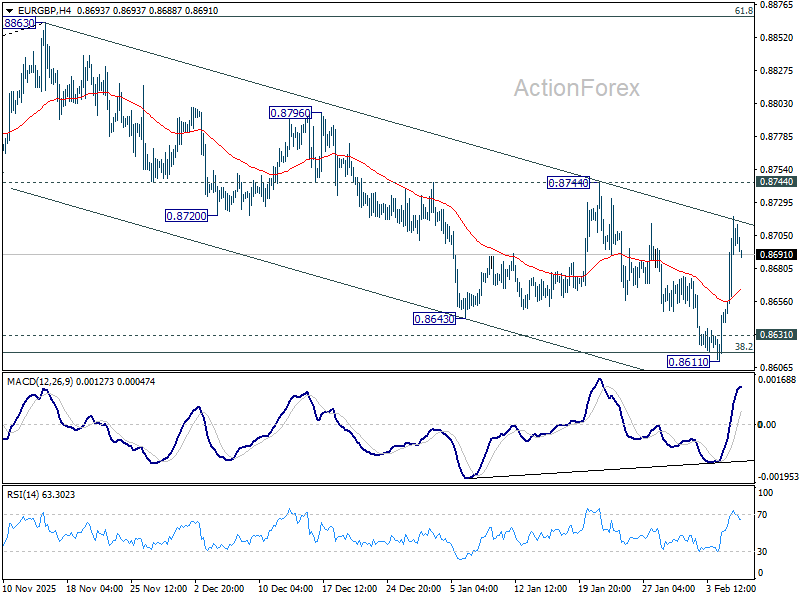
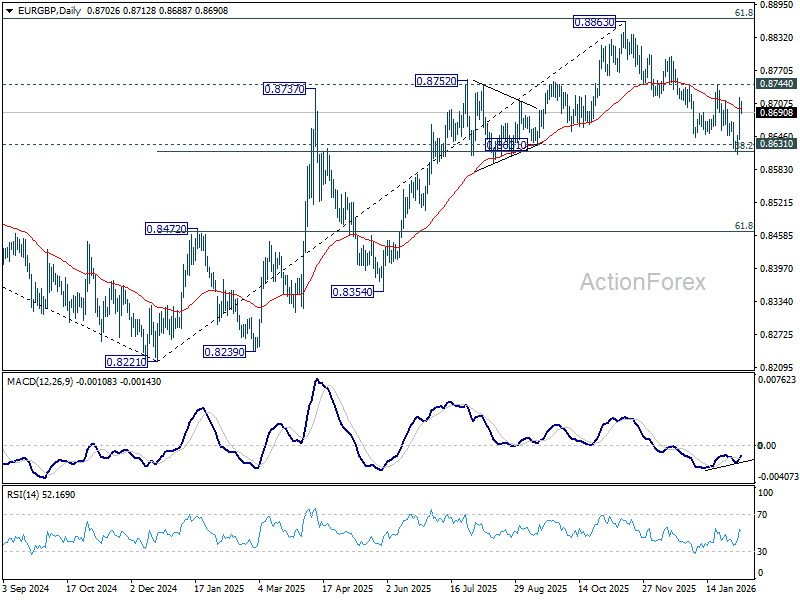
EUR/GBP Daily Outlook
Daily Pivots: (S1) 0.8651; (P) 0.8686; (R1) 0.8741; More…
Intraday bias in EUR/GBP remains neutral first as it's still bounded in range of 0.8611/8744. On the upside, firm break of 0.8744 will argue that fall from 0.8863 has completed as a correction. Intraday bias will be back to the upside for retesting 0.8863, with prospect of resuming larger up trend. Nevertheless, on the downside, decisive break of 0.8631 cluster support (38.2% retracement of 0.8221 to 0.8663 at 0.8618) will carry larger bearish implications.
In the bigger picture, rise from 0.8221 medium term bottom (2024 low) is seen as a corrective move. Upside should be limited by 61.8% retracement of 0.9267 to 0.8221 at 0.8867. Sustained trading below 55 W EMA (now at 0.8625) should confirm that this corrective bounce has completed. In this case, deeper fall would be seen back to 0.8201/21 key support zone. However, decisive break of 0.8867 will suggest that EUR/GBP is already reversing whole decline from 0.9267 (2022 high). That should pave the way back to 0.9267.
EUR/AUD Daily Outlook
Daily Pivots: (S1) 1.6896; (P) 1.6950; (R1) 1.7057; More...
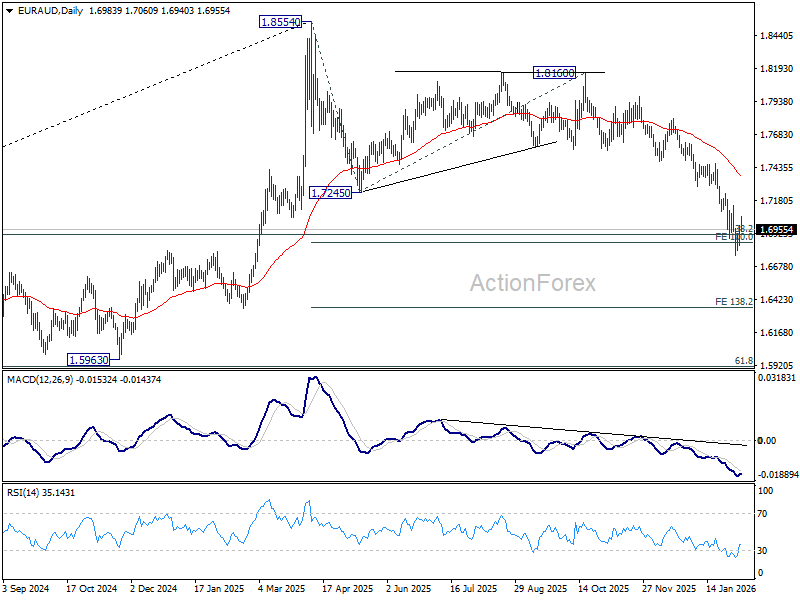
Intraday bias in EUR/AUD is turned neutral first with current recovery. But risk stays on the downside with 1.7145 resistance intact. On the downside, sustained trading below 100% projection of 1.8554 to 1.7245 from 1.8160 at 1.6851 will pave the way to 138.2% projection at 1.6351 next. However, break of 1.7145 will confirm short term bottoming, and turn bias back to the upside for stronger rebound.
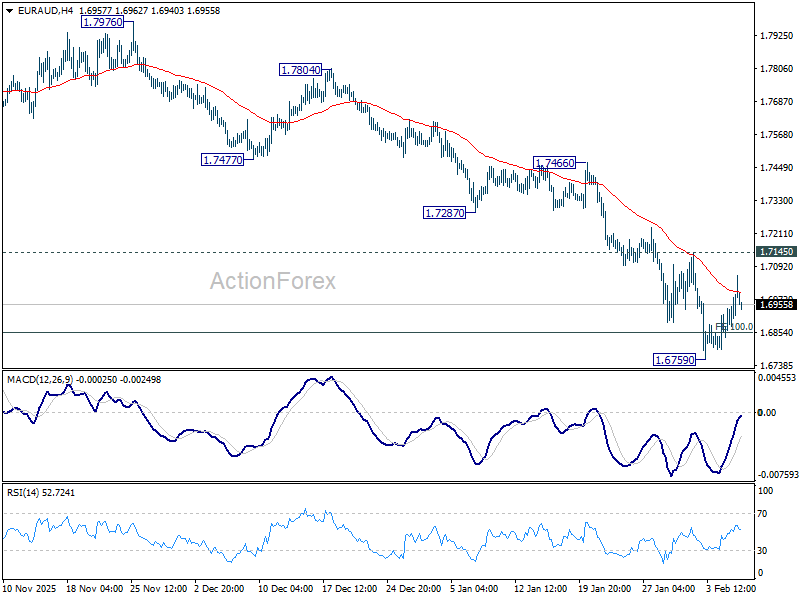
In the bigger picture, fall from 1.8554 medium term top is still in progress. Sustained break of 38.2% retracement of 1.4281 to 1.8554 at 1.6922 will argue that it's already reversing whole up trend from 1.4281 (2022 low). Deeper fall would be seen to 61.8% retracement at 1.5913. For now, risk will stay on the downside as long as 55 D EMA (now at 1.7396) holds even in case of strong rebound.
EUR/CHF Daily Outlook
Daily Pivots: (S1) 0.9146; (P) 0.9166; (R1) 0.9186; More....
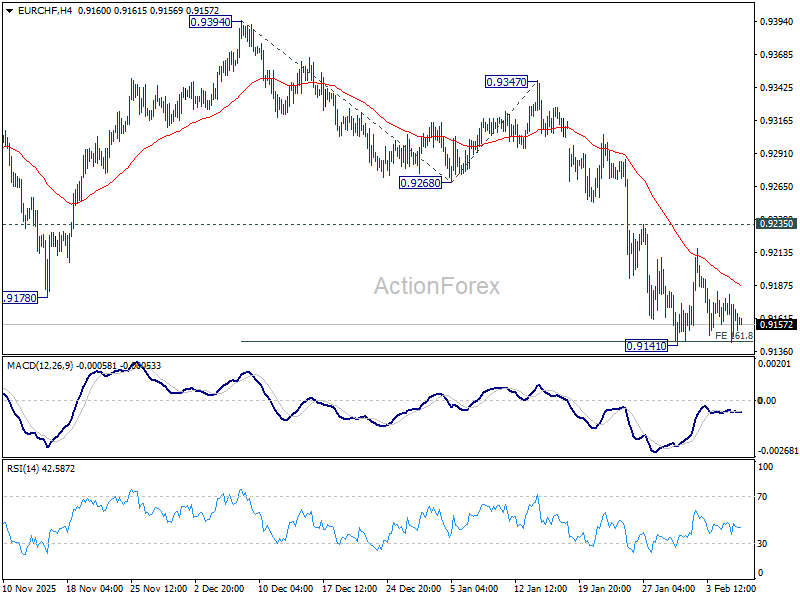
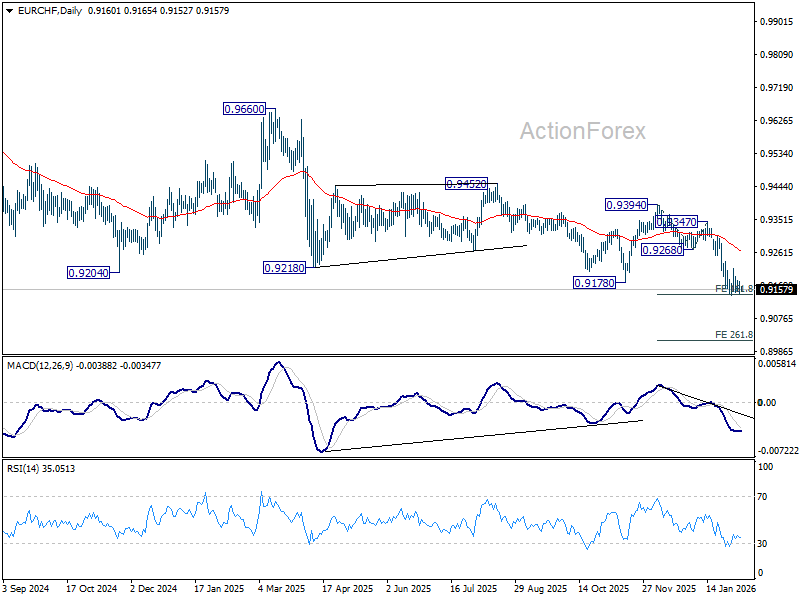
Intraday bias in EUR/CHF remains neutral at this point, and consolidations could continue above 0.9141. In case of another recovery, upside should be limited by 0.9235 resistance. On the downside, decisive break of 0.9141 will extend larger down trend to 261.8% projection of 0.9394 to 0.9268 from 0.9347 at 0.9143. However, firm break of 0.9235 resistance will suggest short term bottoming and bring stronger rebound to 55 D EMA (now at 0.9263).
In the bigger picture, another rejection by 55 W EMA (now at 0.9350) keeps outlook bearish. Downtrend from 1.2004 (2018 high) is still in progress. Firm break of 0.9178 will target 61.8% projection of 1.1149 to 0.9407 from 0.9928 0.8851. Outlook will stay bearish as long as 0.9394 resistance holds, in case of recovery.
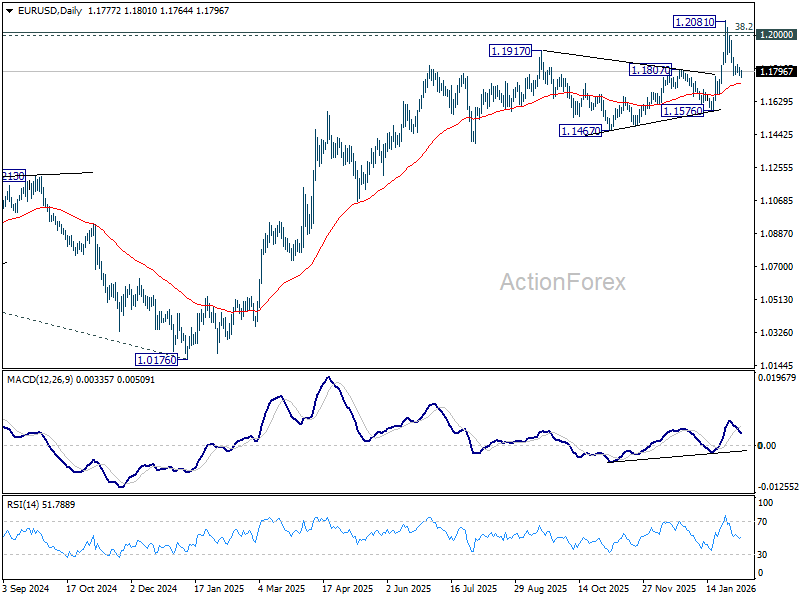
EUR/USD Daily Outlook
Daily Pivots: (S1) 1.1761; (P) 1.1792; (R1) 1.1808; More….
Intraday bias in EUR/USD is mildly on the downside with breach of 1.1774 temporary low. Sustained trading below 55 D EMA (now at 1.1731) will raise the chance of reversal on rejection by 1.2 psychological level, and target 1.1576 support. On the upside, above 1.1870 minor resistance will bring stronger rebound to retest 1.2081. Decisive break above 1.2 will carry larger bullish implications.
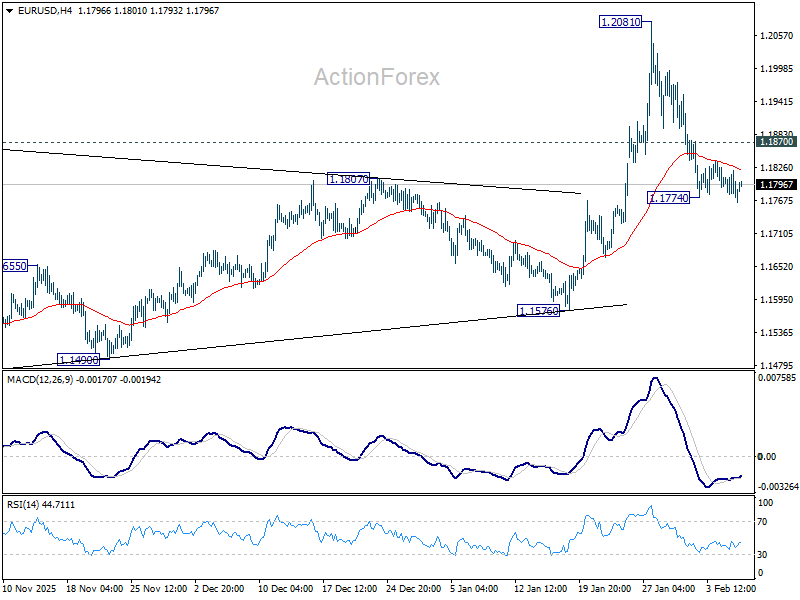
In the bigger picture, as long as 55 W EMA (now at 1.1458) holds, up trend from 0.9534 (2022 low) is still in favor to continue. Decisive break of 1.2 key psychological level will add to the case of long term bullish trend reversal. Next medium term target will be 138.2% projection of 0.9534 to 1.1274 from 1.0176 at 1.2581. However, sustained trading below 55 W EMA will argue that rise from 0.9534 has completed as a three wave corrective bounce, and keep long term outlook bearish.
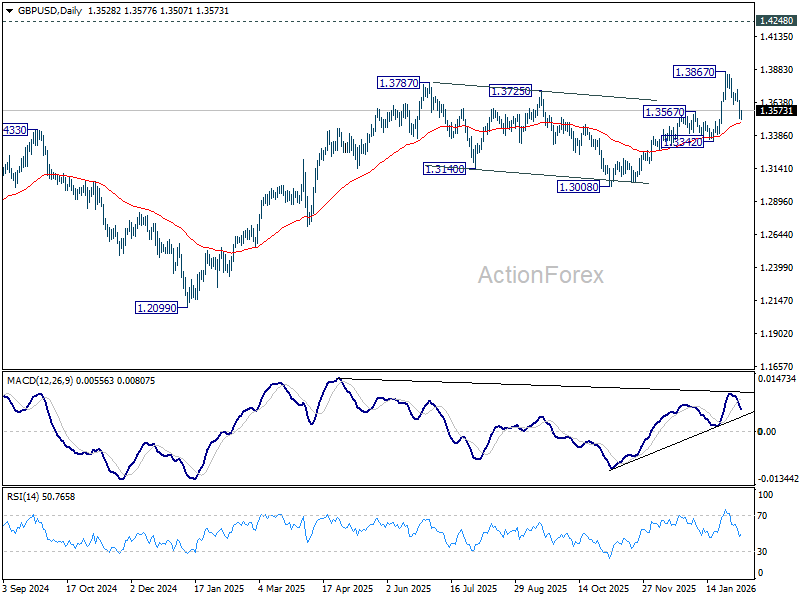
GBP/USD Daily Outlook
Daily Pivots: (S1) 1.3472; (P) 1.3575; (R1) 1.3631; More...
Intraday bias in GBP/USD remains on the downside at this point. Fall from 1.3867 is in progress for 55 D EMA (now at 1.3483). Sustained break there will raise the chance of larger scale correction, and target 1.3342 support for confirmation. On the upside, above 1.3732 minor resistance will bring retest of 1.3867. Firm break there will resume larger up trend towards 1.4284 key resistance.
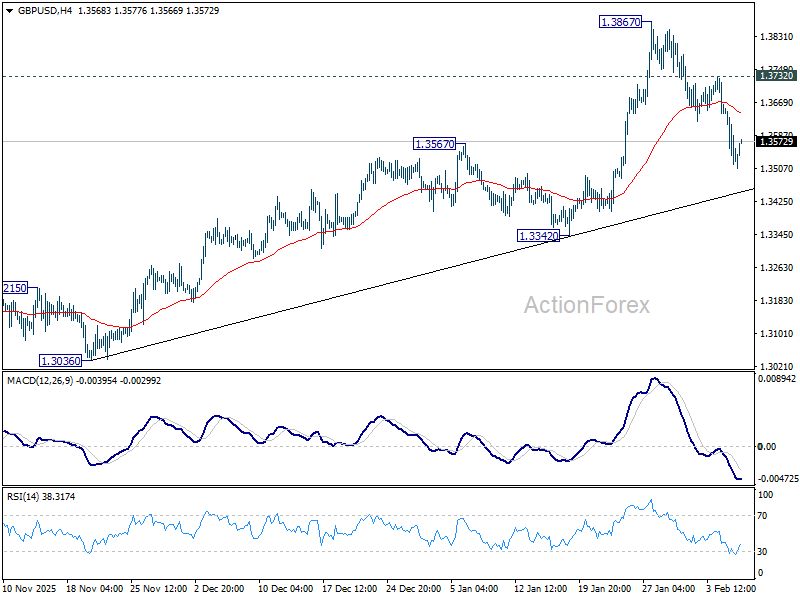
In the bigger picture, rise from 1.0351 (2022 low) is resuming by breaking through 1.3787 high. Further rally should be seen to 1.4284 key resistance (2021 high). Decisive break there will add to the case of long term bullish trend reversal. For now, outlook will stay bullish as long as 1.3008 support holds, even in case of deep pullback.
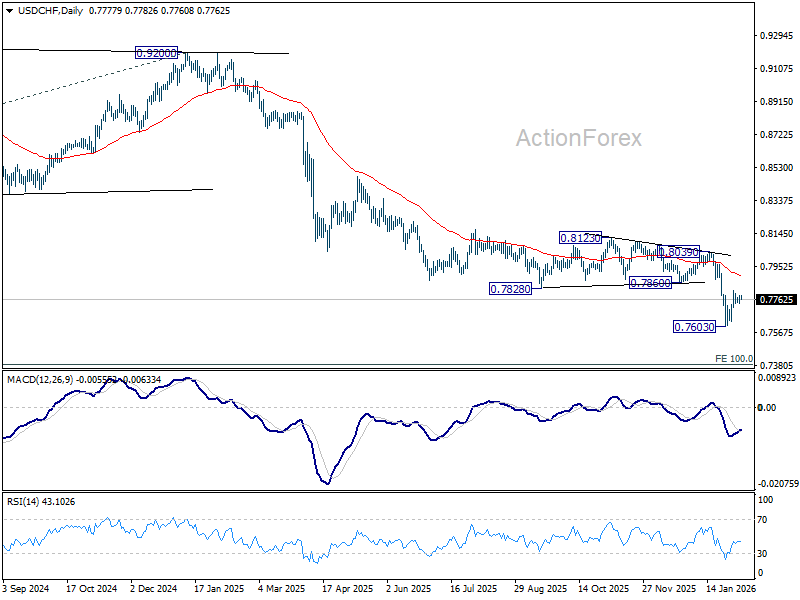
USD/CHF Daily Outlook
Daily Pivots: (S1) 0.7753; (P) 0.7771; (R1) 0.7799; More….
No change in USD/CHF's outlook and intraday bias stays neutral at this point. On the upside, above 0.7816 will resume the rebound from 0.7603 short term bottom to 55 D EMA (now at 0.7896). But strong resistance should be seen there to limit upside. On the downside, below 0.7713 minor support will bring retest of 0.7603. Firm break there will resume larger down trend to 0.7382 projection level next.
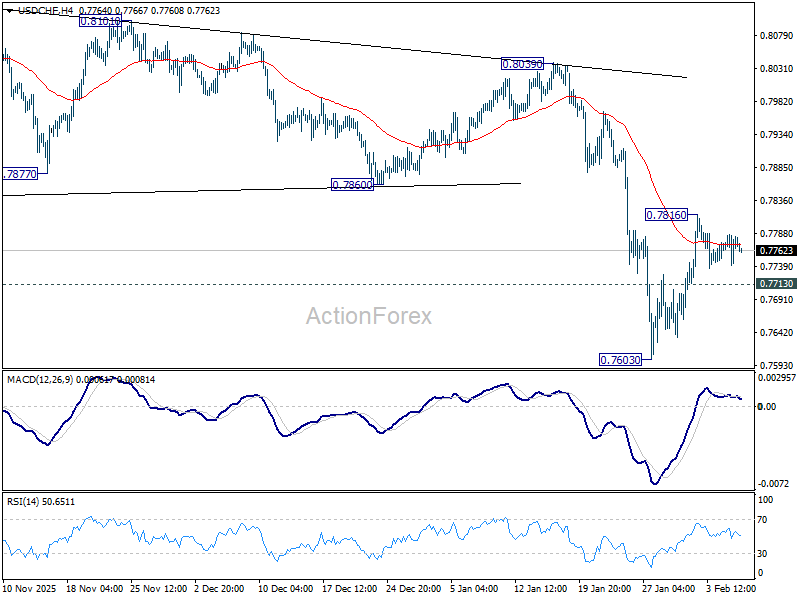
In the bigger picture, larger down trend from 1.0342 (2017 high) is still in progress and resuming. Next target is 100% projection of 1.0146 (2022 high) to 0.8332 from 0.9200 at 0.7382. In any case, outlook will stay bearish as long as 55 W EMA (now at 0.8166) holds.
USD/JPY Daily Outlook
Daily Pivots: (S1) 156.60; (P) 156.97; (R1) 157.41; More...
Intraday bias in USD/JPY remains mildly on the upside at this point. Rise from 152.07 is seen as the second leg of the corrective pattern from 159.44. Further rebound should be seen to retest 159.44 next. On the downside, below 155.51 minor support will turn intraday bias neutral first. But overall outlook will stay bullish as long as 38.2% retracement of 139.87 to 159.44 at 151.96, in case of another dip.
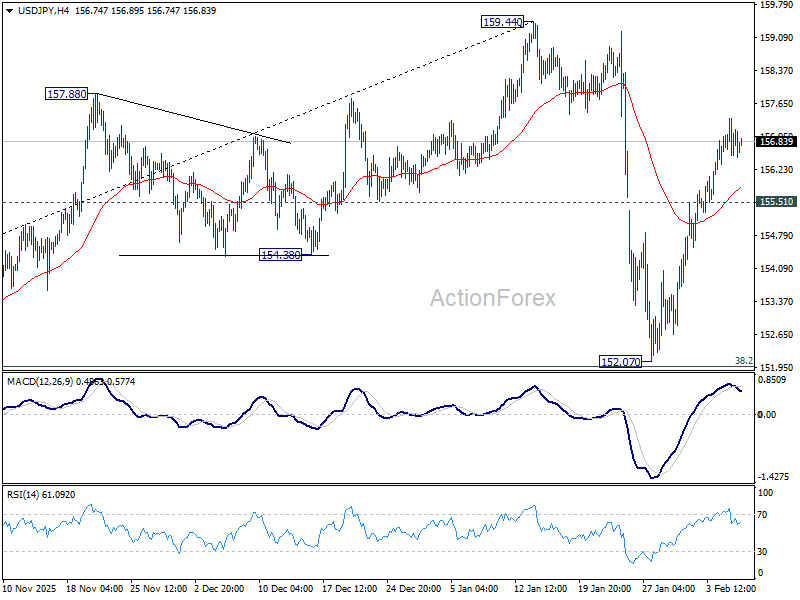
In the bigger picture, outlook is unchanged that corrective pattern from 161.94 (2024 high) should have completed with three waves at 139.87. Larger up trend from 102.58 (2021 low) could be ready to resume through 161.94. This will remain the favored case as long as 55 W EMA (now at 151.59) holds. However, sustained break of 55 W EMA will argue that the pattern from 161.94 is extending with another falling leg.

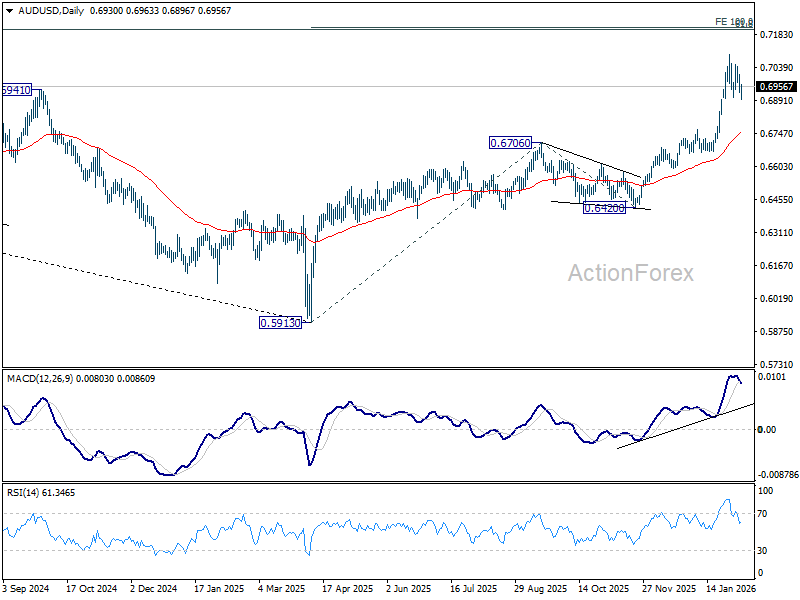
AUD/USD Daily Report
Daily Pivots: (S1) 0.6898; (P) 0.6953; (R1) 0.6981; More...
AUD/USD's corrective pattern from 0.7093 extended with another dip and intraday bias remains neutral. Lengthier consolidation would likely be seen, with risk of deeper pullback to 38.2% retracement of 0.6420 to 0.7093 at 0.6836. But downside should be contained there to bring rebound. On the upside, break of 0.7093 will extend larger up trend to 100% projection of 0.5913 to 0.6706 from 0.6420 at 0.7213 next.
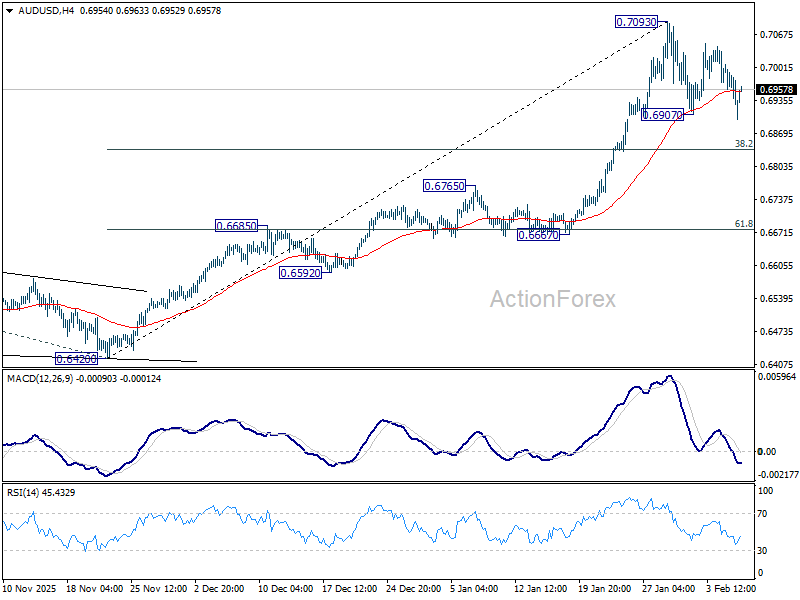
In the bigger picture, current development argues that rise from 0.5913 (2024 low) is reversing whole down trend from 0.8006 (2021 high). Further rally should be seen to 61.8% retracement of 0.8006 to 0.5913 at 0.7206. This will remain the favored case as long as 0.6706 resistance turned support holds, even in case of deep pullback.
Silver Elliott Wave View: Correction Phase or Final High?
Silver has entered a significant corrective phase after reaching an all‑time high of $121.6 on January 29. The decline from this peak reveals an incomplete bearish sequence, unfolding with internal subdivisions that align with a double three Elliott Wave structure. From the January 29 high, wave ((A)) concluded at $106.76, followed by a rally in wave ((B)) that terminated at $118.46. The metal then resumed its downward trajectory in wave ((C)), which developed into a clear five‑wave structure.
Within this decline, wave (1) ended at $107.94, while wave (2) retraced to $112.48. The subsequent drop in wave (3) reached $95.06, and a corrective rally in wave (4) lifted prices to $104.05. Finally, wave (5) extended lower to $74.32, completing wave w at a higher degree. The subsequent recovery unfolded as wave x, which took the form of an expanded flat correction.
From wave w, wave ((A)) advanced to $87.92, before a pullback in wave ((B)) drove prices down to $71.31. A final push higher in wave ((C)) ended at $92.19, completing wave x. The market has since turned lower in wave y, which is subdividing into a zigzag pattern. Wave ((A)) of y is projected to extend toward the $53.7–$61.1 region. This target corresponds to the 61.8–76.4 Fibonacci extension of wave w, reinforcing its technical significance.
Silver (XAG/USD) 60 minute chart
In the near term, traders should anticipate that any short‑lived rallies will fail within either three or seven swings, paving the way for further downside pressure. The structure suggests that silver remains vulnerable, and the corrective cycle is not yet complete.
Silver Elliott Wave video
https://www.youtube.com/watch?v=XZaNhMVa9kI
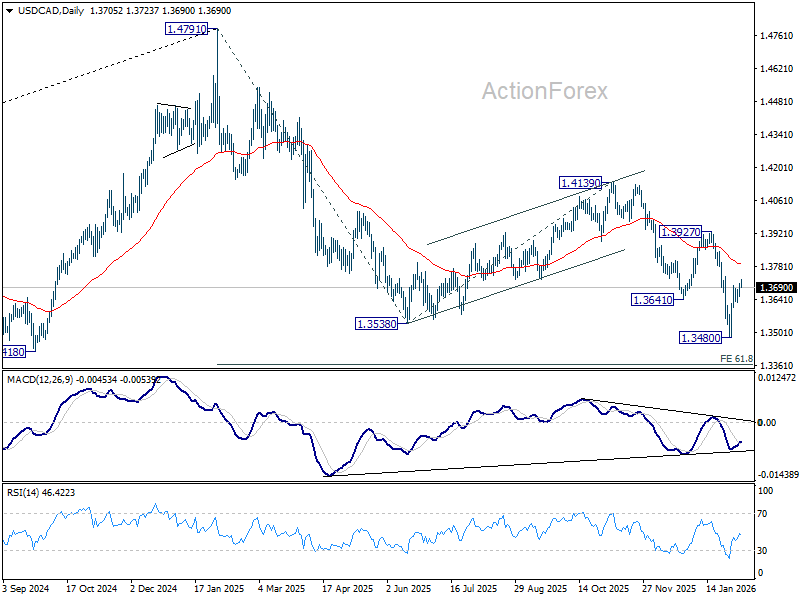
USD/CAD Daily Outlook
Daily Pivots: (S1) 1.3673; (P) 1.3693; (R1) 1.3733; More...
Intraday bias in USD/CAD is back on the upside as rebound from 1.3480 is resuming for 55 D EMA (now at 1.3788). Strong resistance could be seen there to complete the corrective bounce. On the downside, below 1.3625 support will bring retest of 1.3480 low. Firm break there will resume larger fall to 61.8% projection of 1.4791 to 1.3538 from 1.4139 at 1.3365. However, sustained trading above 55 D EMA will raise the chance of near term bullish reversal, and target 1.3927 resistance for confirmation.
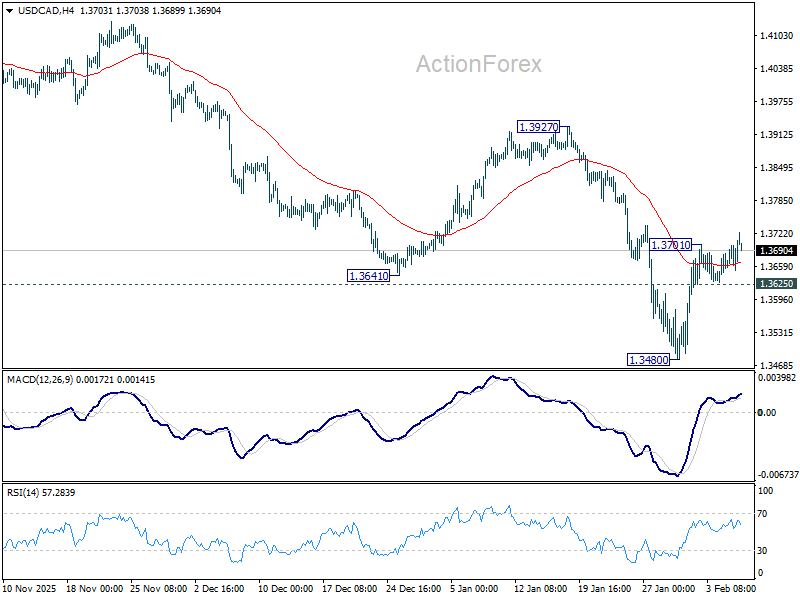
In the bigger picture, price actions from 1.4791 are seen as a corrective pattern to the whole up trend from 1.2005 (2021 low). Deeper fall could be seen as the pattern extends, and break of 1.3538 will target 61.8% retracement of 1.2005 to 1.4791 at 1.3069. For now, medium term outlook will be neutral at best, until there are signs that the correction has completed, or that a bearish trend reversal is confirmed.