Sample Category Title
Canada employment falls -25k, participation drop drives unemployment rate down to 6.5%
Employment in Canada fell by -25k in January, a sharp miss versus expectations for a modest 7k gain and a clear sign of near-term labor market softness. The decline was driven by a steep drop in part-time jobs (-70k), which more than offset gains in full-time employment (45k).
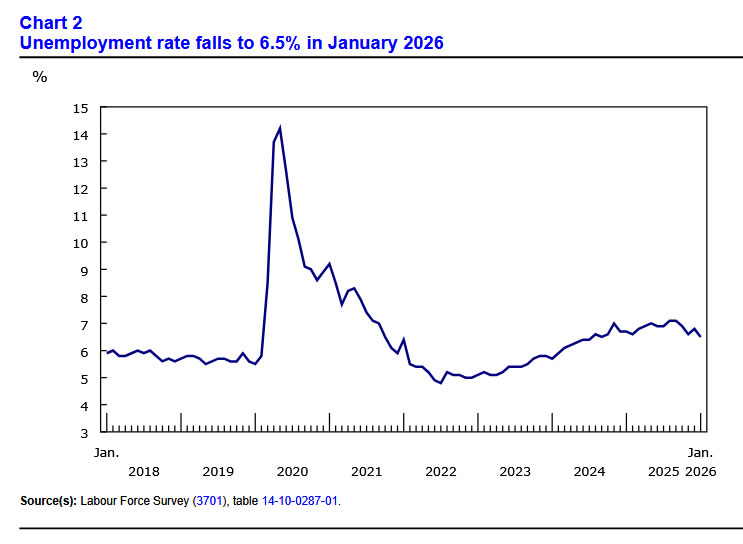
Meanwhile, Headline unemployment fell sharply from 6.8% to 6.5%, beating expectations of 6.8%, and marking its lowest level since September 2024. However, the improvement was driven by a sizeable drop in labor force participation rather than stronger hiring, with the participation rate falling 0.4ppt to 65.0%. Employment rate slipped from 60.9%. to 60.8%, its first decline since August.
Wage pressures continued to ease at the margin. Average hourly wages rose 3.3% yoy, down slightly from December's 3.4% yoy.
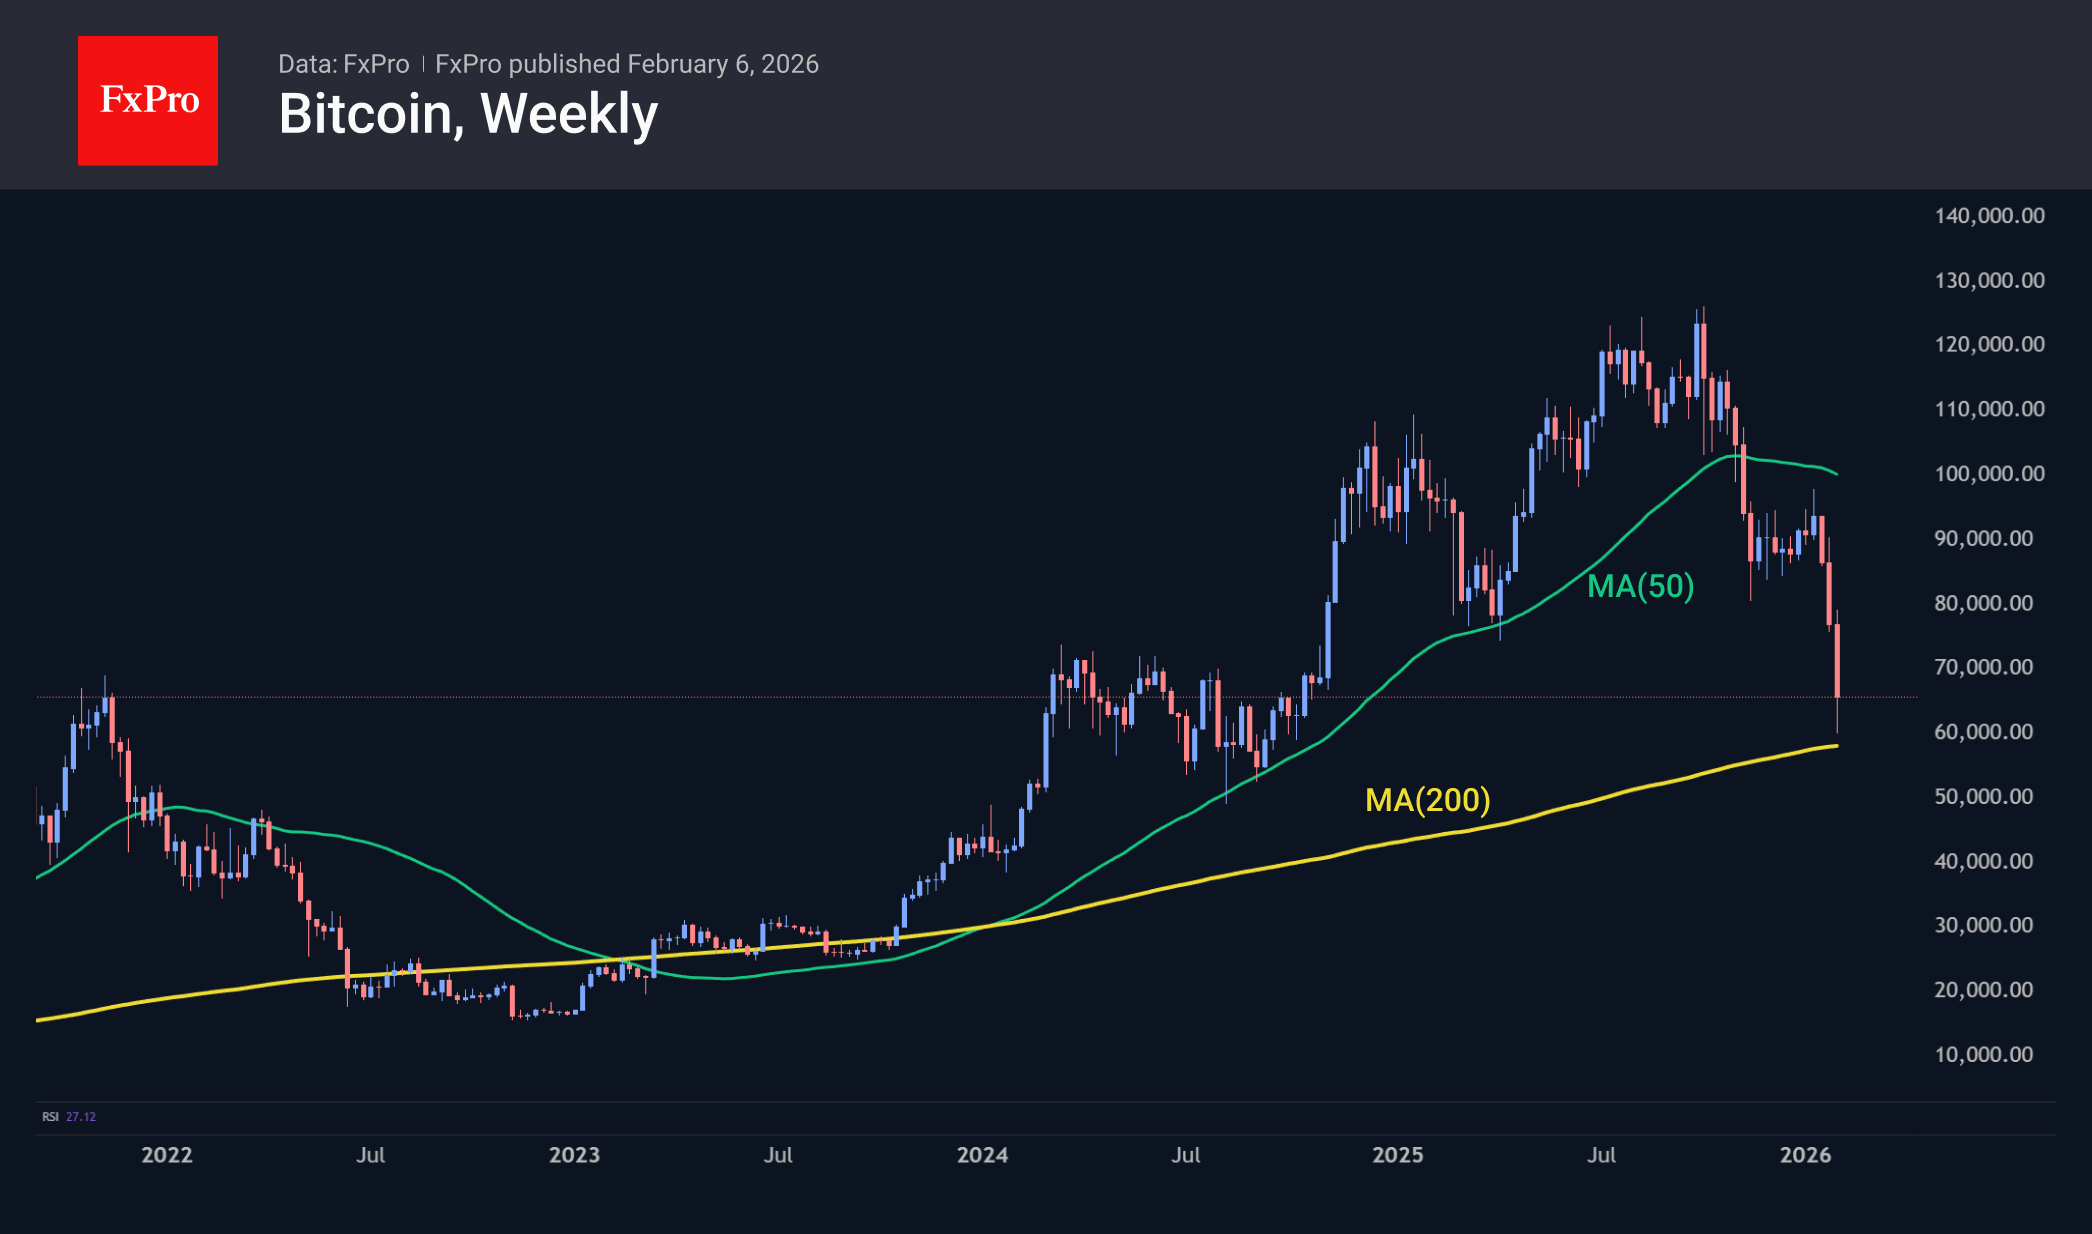
Crypto: Too Early to be Greedy
Market Overview
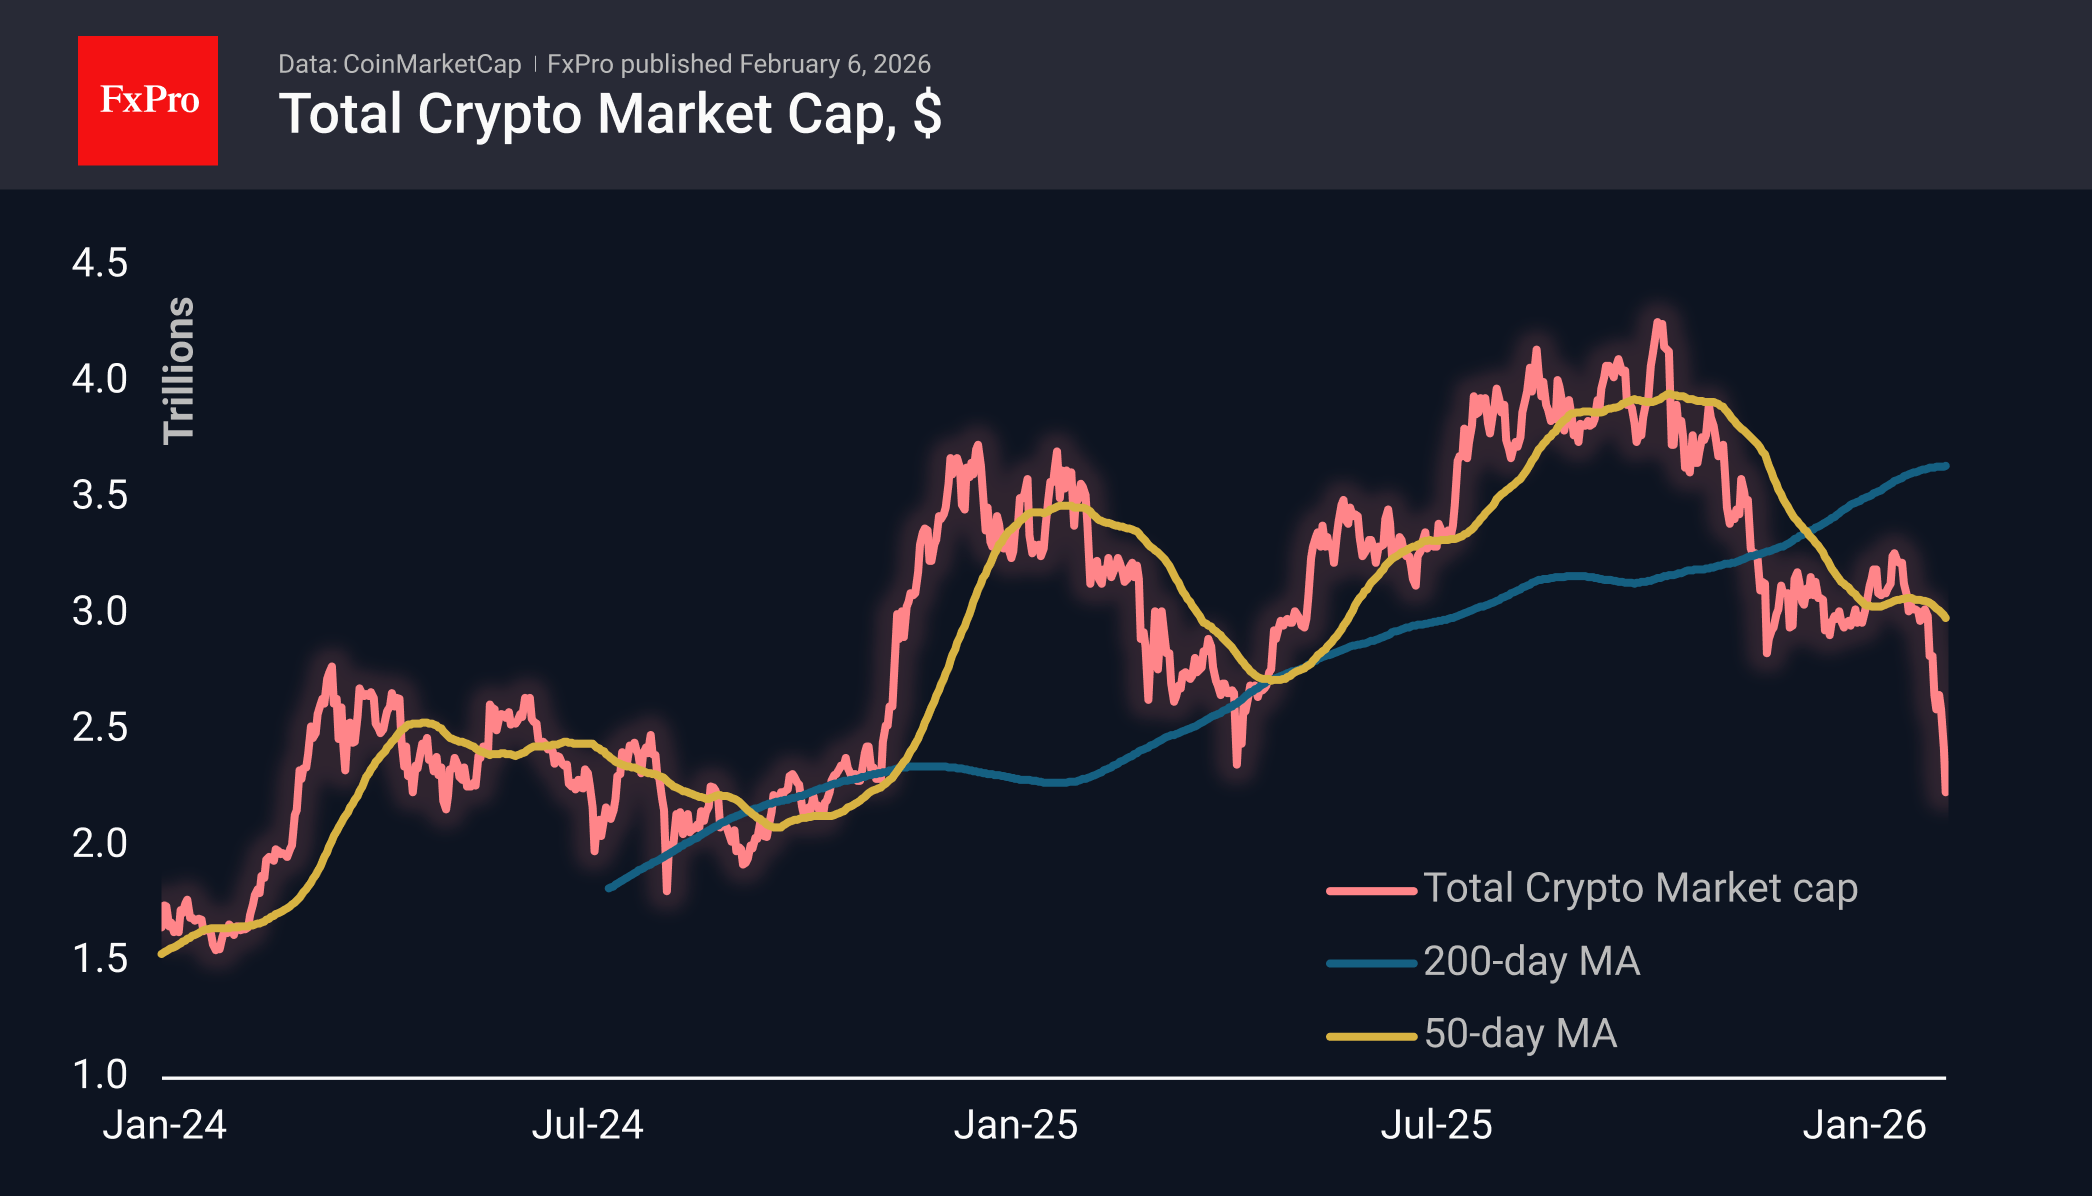
The crypto market cap has lost more than 8% in the last 24 hours to $2.22T, dropping to $2.09T at its lowest point. The Crypto fell below last April’s lows and rolled back to levels last seen in September 2024. The market did not hold on to the strong line that had served as support and resistance for more than two years. Either this is a switch to panic mode, or we saw a short-term overreaction during a period of reduced liquidity, and cryptocurrencies will partially rebound in the coming days.
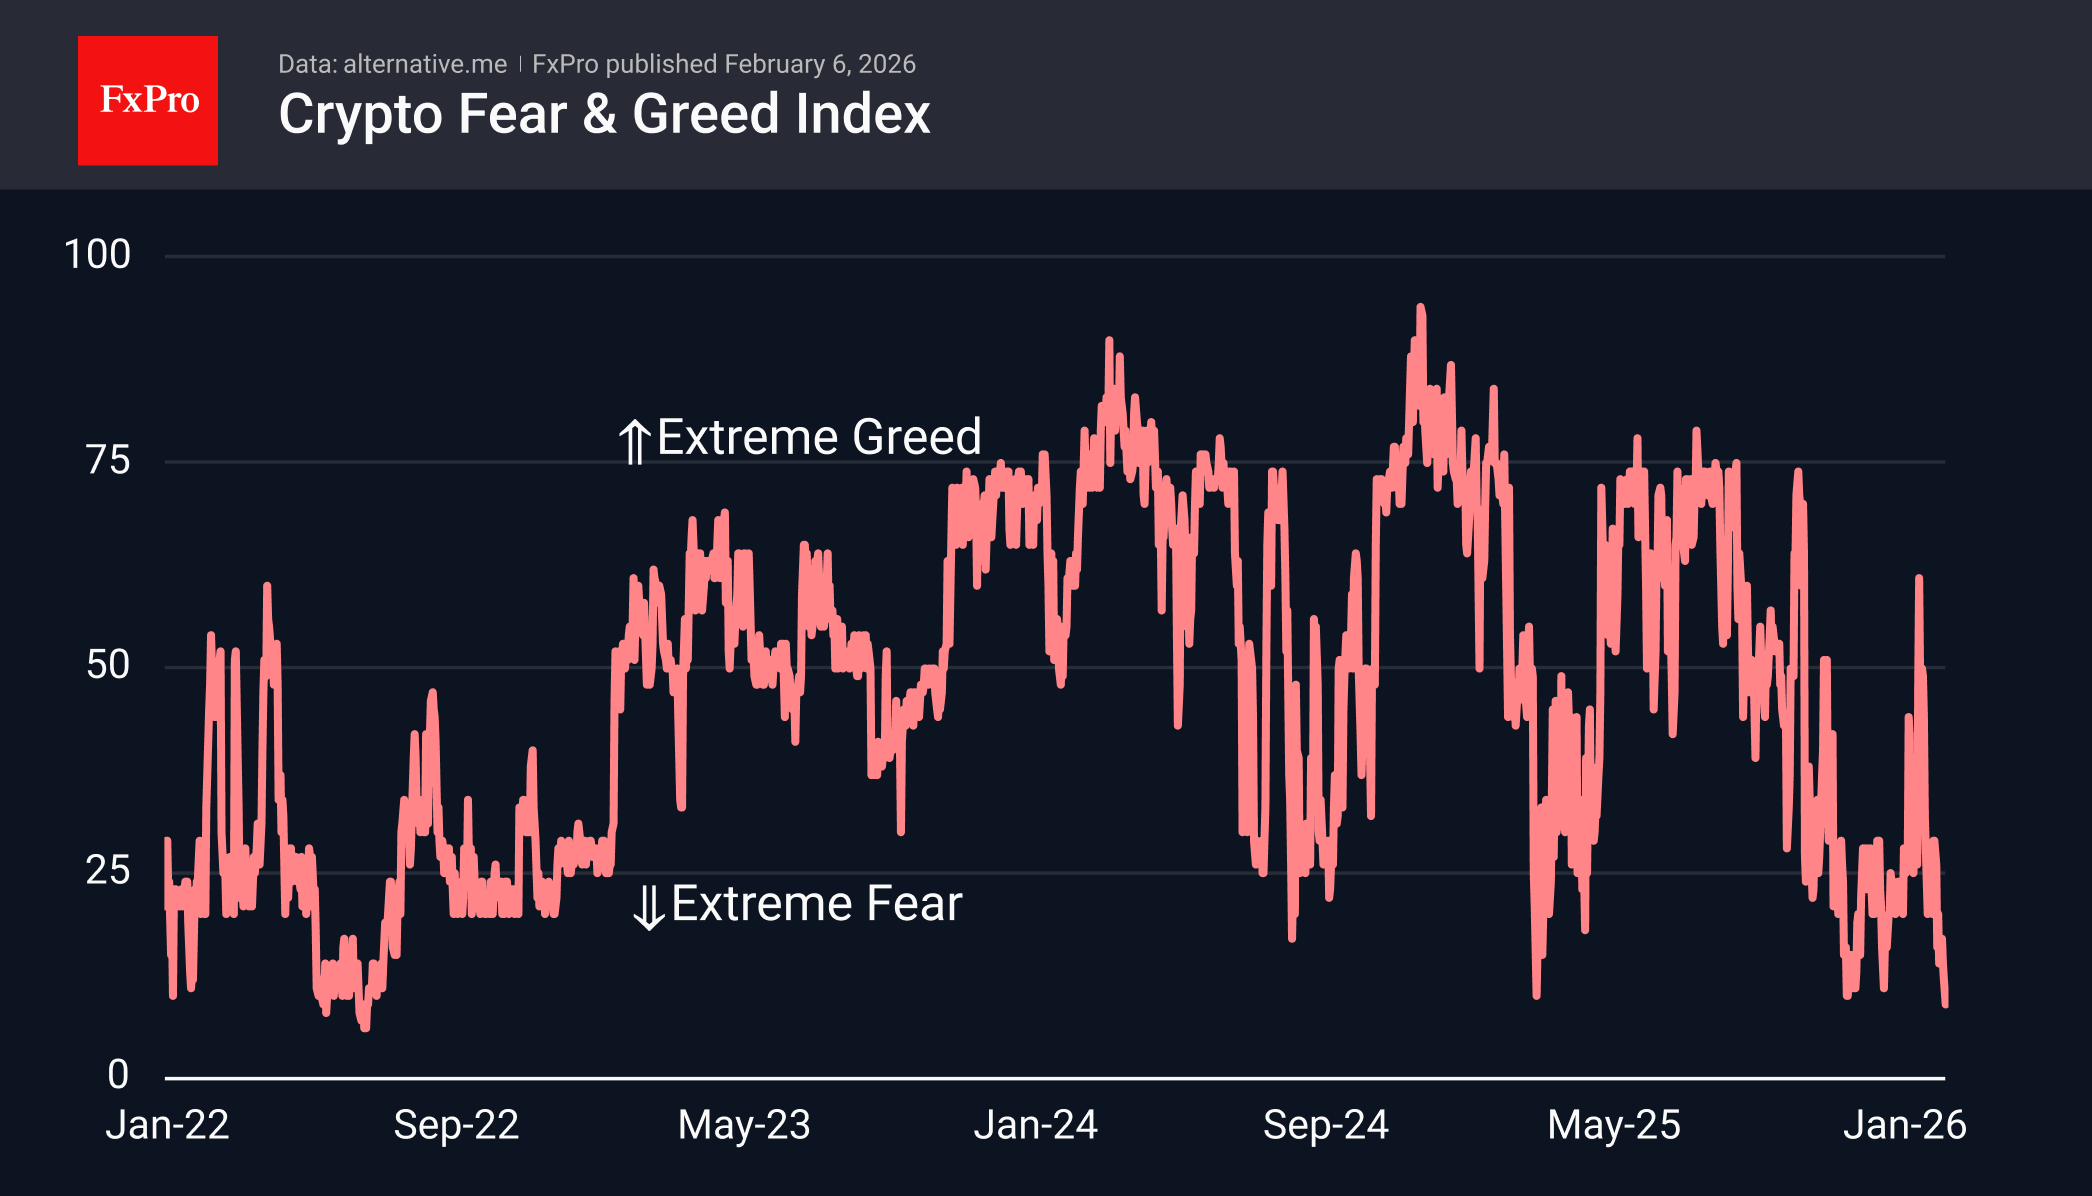
The sentiment index fell to 9, where it was last seen in June 2022. In general, reaching single-digit levels is a very rare occurrence. At the same time, we warn again that such oversold conditions may be followed by months of consolidation or bottoming out. Thus, in 2022, the market only bottomed out in November, falling by about a quarter, and the momentum for growth only appeared in January.
Bitcoin, at its lowest point at the start of trading on Friday, fell to $60K, ending up just one step away from its 200-week moving average, which is just below $58K. Bitcoin only fell below this line in 2022 and the following year, 2023. Before that, in 2015, 2019, and 2020, touching this line effectively stopped the sell-off, attracting buyers.
News Background
The collapse of the crypto market reflects a decline in interest in digital assets at the institutional and regulatory levels, according to Deutsche Bank. Three factors are putting pressure on Bitcoin: a steady outflow of institutional investor funds, changes in traditional Bitcoin market relationships, and the loss of regulatory momentum that previously supported liquidity and reduced volatility.
The collapse of Bitcoin was caused by the actions of large market participants, not panic among private investors, said technical analyst Peter Brandt. In his opinion, the nature of the movement, when BTC updated its lows for eight days in a row, has all the signs of a “planned sell-off.”
Tension was heightened by unconfirmed rumours of a $9 billion sale of bitcoins by a Galaxy Digital client.
Stifel admits that Bitcoin could collapse to $38K due to the high correlation of cryptocurrencies with the falling US tech sector.
According to DeFiLlama, the net inflow of funds to Binance over the past 24 hours amounted to almost $700 million. The data refuted rumours circulating on social media about mass withdrawals and account closures after Binance reported technical problems with withdrawals on February 3rd.
According to Bloomberg, there is still disagreement in the US over the Clarity Act. The current version of the document prohibits the accrual of interest for staking. Crypto companies are making new concessions to US banks, but the parties have not yet reached an agreement.
GBP/USD Declines After Bank of England Decision
Yesterday’s decision by the Bank of England came as a surprise to forex traders. While the Official Bank Rate was left unchanged at 3.75%, markets were caught off guard by the notably dovish signals regarding future policy.
According to media reports, four out of nine Monetary Policy Committee members voted for an immediate rate cut. This has brought forward expectations of easing by the Bank of England, making the pound less attractive to hold and triggering its weakness yesterday.
Technical Analysis of GBP/USD
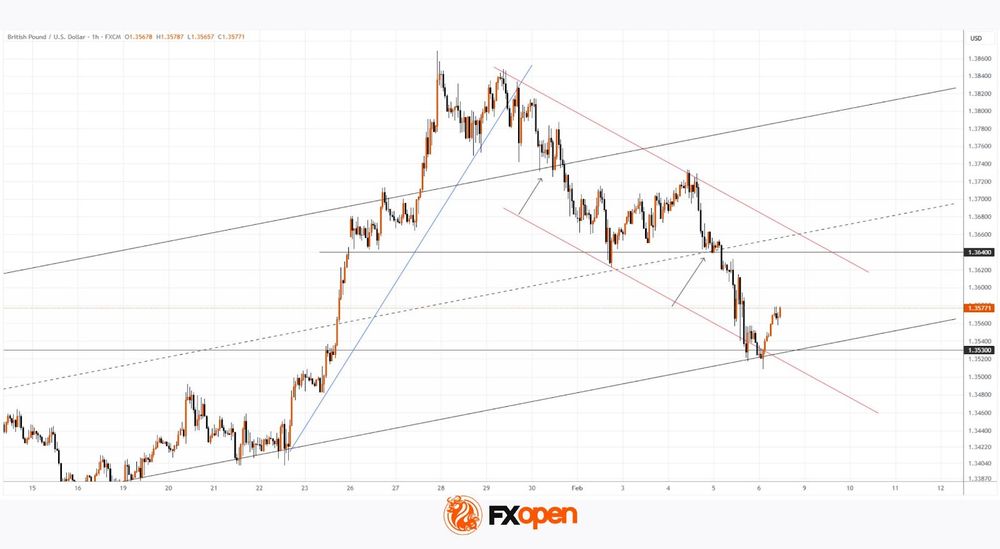
Price action in GBP/USD has been forming an upward trend (outlined by a channel) since November last year. However, yesterday’s move has put this channel at risk of a downside break.
It is worth noting that the market had only recently been in a very strong bullish phase. GBP/USD was advancing along the blue support line and even pushed above the upper boundary of the ascending channel.
Sentiment then shifted abruptly. Bears stepped in aggressively, driving the pair lower and breaking through several technical levels in sequence:
- → the blue trendline;
- → the upper boundary of the channel;
- → the channel median, reinforced by the 1.3640 level.
As a result, the price fell towards the lower boundary of the channel, strengthened by the 1.3530 level, which had acted as resistance in late December and early January.
Almost all of the bullish gains made in late January have now been erased. It cannot be ruled out that today’s rebound in GBP/USD is merely a technical recovery — a pause that allows bears to regroup before attempting a break below the lower boundary of the ascending channel, potentially steering the market into a downward trajectory (shown in red).
Trade over 50 forex markets 24 hours a day with FXOpen. Take advantage of low commissions, deep liquidity, and spreads from 0.0 pips (additional fees may apply). Open your FXOpen account now or learn more about trading forex with FXOpen.
This article represents the opinion of the Companies operating under the FXOpen brand only. It is not to be construed as an offer, solicitation, or recommendation with respect to products and services provided by the Companies operating under the FXOpen brand, nor is it to be considered financial advice.
ECB’s Kazaks: Current Euro l baked in, but further sharp appreciation could trigger response
Latvian ECB Governing Council member Martins Kazaks said a “sizeable and pacey” strengthening of Euro could materially lower the inflation outlook, "potentially triggering a policy response". A stronger currency, he argued in a blog post, would weigh on competitiveness and economic activity, feeding through to weaker price pressures.
Kazaks noted that EUR/USD has traded in a relatively narrow 1.15–1.20 range in recent months. The last meaningful appreciation occurred in the second quarter of 2025, a move he described as appearing largely "permanent".
Because of policy lags, the full disinflationary impact of that earlier appreciation has yet to be felt and is expected to emerge later this spring. Importantly, Kazaks stressed that these effects are already “baked into” the ECB’s baseline forecast, limiting the need for near-term policy adjustment.
With that backdrop, Kazaks said monetary policy is “in a good place” and not the main lever at present. Instead, he argued that urgent progress on structural reforms is needed to strengthen Europe’s economic fundamentals, resilience, and global standing in an increasingly volatile geopolitical environment.
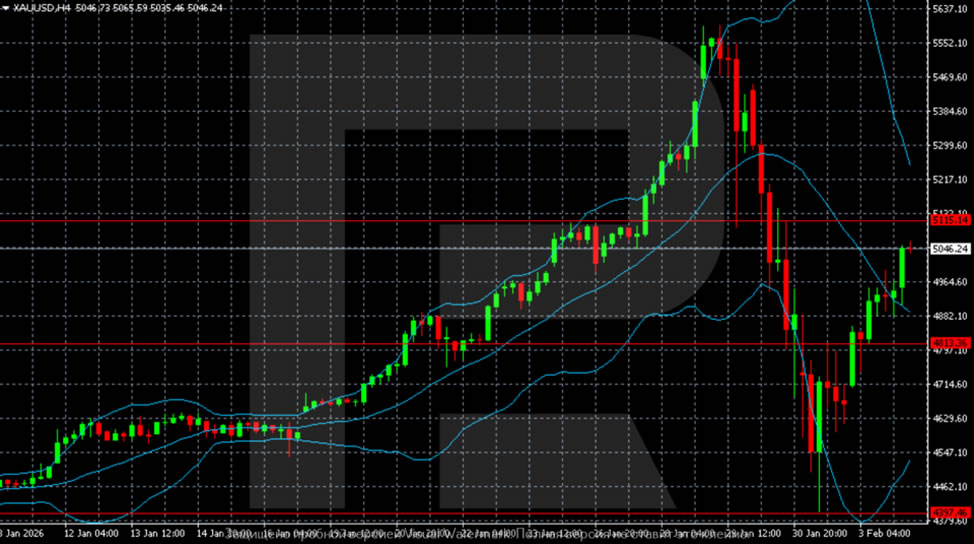
Gold Closes with a Decline for the Second Week in a Row: Fewer Risks
Gold on Friday was at 4800 USD per troy ounce. It remains in a vulnerable position after declining 3.8% the day before and is moving towards its second consecutive weekly drawdown. This comes amid high selling pressure.
The correction follows a series of updates to historic highs in January. The rise in prices was initially driven by heightened geopolitical risks, concerns about the Fed's independence, and speculative demand from China. The tension has since decreased, while the protective attractiveness of gold has diminished. Representatives of Iran and the US confirmed that negotiations are taking place in Oman, and the market is closely following their progress.
An additional factor was weak data on the US labour market. In January, the number of layoffs rose to 108.4 thousand, the maximum for this month since 2009. Initial claims for unemployment benefits rose to 231 thousand, and the ADP report on private-sector employment was weaker than expected. A series of these data has increased expectations of a Fed rate cut later this year. At the same time, the market still considers June as a possible time for the first step.
Technical Analysis
The H4 chart shows completed pulse growth with a peak above 5500, followed by an aggressive correction. The decline went to the 4450–4500 zone. From there, the rebound began. The price moved up to the 5000–5050 area but remains below the key 5100–5150 resistance and the Bollinger median line. The structure indicates a phase of high volatility and redistribution after an overheated uptrend.
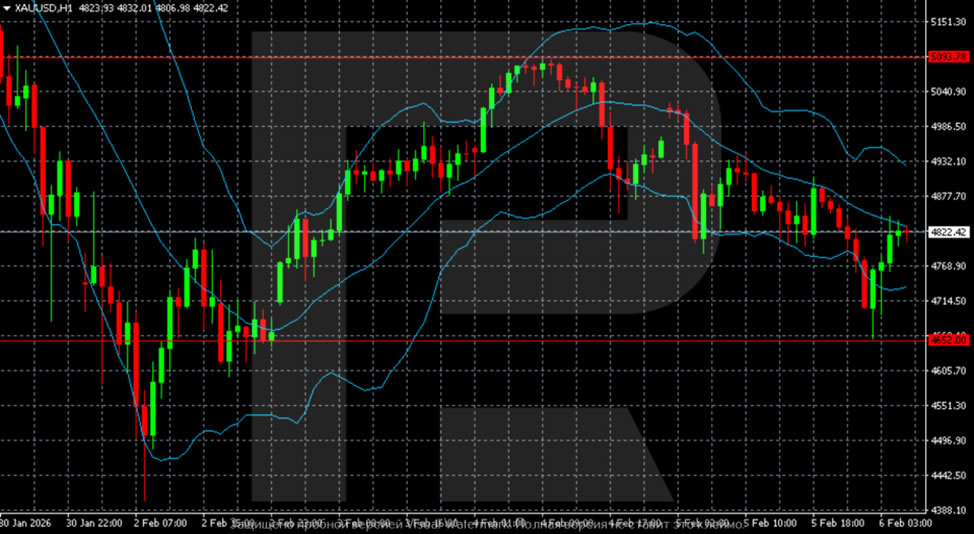
After a sharp collapse, gold on the H1 chart formed a local bottom in the 4650–4700 range and began to recover. The price is back within the Bollinger Bands and is consolidating near the median line at around 4820–4850. The movement looks corrective, volatility is declining, and the balance of power is still neutral.
Conclusion
In summary, gold's decline reflects a market reassessment, where receding geopolitical fears and a shift towards anticipating Fed easing have removed key pillars of its recent speculative rally. Technically, the sell-off appears to be a volatile but natural correction following an overheated uptrend. While a short-term stabilisation is underway, the price remains vulnerable below critical higher-timeframe resistance. The near-term direction will likely depend on the tone of upcoming US economic data, which will either reinforce or undermine the market's dovish Fed expectations, and further developments in Middle East diplomacy.
Global Risk Positioning Probably Remains the Focal Point
Markets
Yesterday’s trading session was expected to be an interlude for global trading, with policy decisions of the likes of the ECB and the Bank of England to provide some welcome distraction. US labour market data (Claims, Challenger layoffs, Jolts) were interesting, but not supposed to have the same weight as drivers for (bond) markets as is the case for the ISM’s or the payrolls. However, this ‘preview’ didn’t take into account the ongoing AI-related repositioning, questioning valuations and business models in a wide range of affected sectors and triggering a broader risk-off.
The ECB policy meeting did develop according to script. The central bank left the policy rate at 2% and reconfirmed that it expects inflation to stabilize around target. It sounded optimistic on resilient growth. Risks both related to growth and inflation are seen as broadly balanced. On the euro, Chair Lagarde said that the ECB’s assessment already incorporates the weaking of the dollar since March and downplayed the impact of recent swings (on inflation). The ECB is in a good place to wait-and see. German yields finished the day between unchanged (2-y) and -2.3 bps (30-y).
Interesting intraday price action in the UK: the curve move evolved from a bear steepening to a bull steepening. During the morning session UK risk premia jumped as uncertainty on the political fate of UK PM Starmer rekindled the debate on fiscal sustainability. At some point the UK 30-y added 7 bps. Later, BoE policy took over as a driver for trading. The BoE as expected left its policy rate unchanged at 3.75%, but 4 out of the 9 MPC members already voted for a 25 bps rate cut. Inflation is seen returning to the 2% target around April and is expected to stay there. The central bank also remains highly sensitive to an easing of the labour market. UK yields nosedived during Governor Baileys press conference, but closed off the intraday lows. UK yields changed between -5.1 bps (2-y) and +4.2 bps (30-y). Markets now see a 60% chance for a 25 bps rate cut in March. None of both drivers (politics or BoE) was good news for sterling. EUR/GBP jumped from the 0.8650 are to close at 0.8705.
In the US, weak labour data (claims from 209k to 231K, higher Challenger layoffs, lower job openings) kickstarted quite an impressive rally in US Treasuries. It has been different of late, but as the session proceeded, US Treasuries for once fully played their safe haven role. Uncertainty on AI spending, on its impact on a broad range of other sectors and stretched market positioning in several corners of the market, triggered a broad-based risk-off move. US equity indices dropped between 1.2% (Dow) and 1.59% (Nasdaq). However, also (precious) metals (gold, silver, copper) this time didn’t provide any shelter. The run to Treasuries pushed US yields between 11.1 bps (5-y) and 7.6 bps (30-y) lower. The impact on FX was limited, with slightly US outperformance (DXY 97.82, EUR/USD 1.1777).
Asian equity markets (ex Japan) mostly trade in red this morning as investors assess yesterday’s AI driven risk-off. The global risk positioning probably remains the focal point for markets going into the weekend. We are keen to see whether the safe haven rally in (US) bonds can continue. The eco calendar contains ECB survey of professional forecasters and U. of Michigan consumer confidence (including inflation expectations). Markets also look forward to the outcome of the Japanese parliamentary elections and the reaction of Japanese bond markets and the yen.
News & Views
The US administration yesterday hosted a critical minerals summit with 55 countries. Vice President JD Vance pitched the idea of a “preferential trade center for critical minerals protected from external disruptions”. The EU and the US committed to sign a Memorandum of Understanding to bolster supply-chain security. Similar agreements are set up with Japan and Mexico with the concept of coordinated price floors being openly discussed. Earlier this week, US President Trump announced plans for a nearly $12bn critical minerals stockpile. The heavy concentration of these minerals (China) is the main problem with the US fearing they could be used as a tool of leverage and geopolitics.
US President Trump raised the stakes for today’s diplomatic talks between the US and Iranian foreign minister Araghchi in Muscat, Oman. He warned that Iran’s leaders should be very worried. Talks center around Iran’s nuclear programme with the violent suppression of mass protests being put on a sidetrack. The US has been cumulating military assets in the region, having to down an Iranian drone earlier in the week. Oil prices trade volatile the past couple of days, but remain elevated at currently $68/b...
Amazon’s Turn to Slide
It’s just another day, another Big Tech earnings announcement, another set of revenue beats, another pledge to invest massively in AI and infrastructure — and another negative market reaction.
This time, it was Amazon’s turn to get refused by investors. The company’s revenue grew 14% year-over-year — better than expected — with AWS revenue up 24%, reaching about $35.6 billion for the quarter - the fastest growth in about 13 quarters. Profit came a touch below expectations. But what triggered the 11% slump in after-hours trading was the pledge of a huge $200 billion spending plan, roughly $50 billion more than expected, which will weigh on profits.
As such, Amazon joins the list of Big Tech companies that don’t get the approval to spend this much. The market says no — this is too much spending.
At the open today, Amazon could be pushed below the 200-DMA, and maybe below the $200-per-share level. Microsoft is down almost 30% since its November peak; investors particularly disliked slower growth in its cloud unit amid massive capital being thrown at AI tools. Meta is down more than 12% despite revealing that its AI efforts are leading to higher revenue. In vain, investors dislike the huge investment plans here as well.
Google is the only company that stands out in this crowd. Its stock fell as much as 7% in the hours following its earnings announcement — the selloff was also triggered by a massive $175–185 billion spending target for 2026. But investors rushed to buy the dip, and the stock closed the session just 0.60% lower than it started. That was an amazing performance. Likely, this was due to the 48% growth in Google Cloud, seen as early proof that their TPU chips will make a difference — potentially diverting revenue from chip sector heavyweights — and that Gemini will grow market share with big and PAID partnerships, starting with Apple.
Nasdaq futures are down again this morning. The US dollar is licking its wounds after a slump in Asia. Silver rebounded off the $64-per-ounce mark, almost a 50% slump since last Thursday’s peak at $121 — remember, that was just a week ago. Gold retreated to $4’655 before rebounding, and Bitcoin — oh dear — is getting hammered along with tech stocks, dropping to levels many thought impossible. It briefly plunged below $60’000 per coin overnight, well below the $70’000 support many experts cited — the average cost of mining Bitcoin. That theory, that Bitcoin’s price wouldn’t fall below mining costs, is being tested in this selloff. There’s no convincing answer to what the bottom might be. It will be determined by appetite for this highly speculative asset with limited use cases. Michael Burry warns this selloff could lead to a “death spiral,” though he is known for dramatic statements — and he likely closed his hedge fund before this tech selloff began. Realistically, this selloff reminds investors that Bitcoin’s multi-year one-sided trend is over. Bitcoin is volatile and risky, and institutional investors may get cold feet. Technical levels suggest the coin is in a bearish consolidation zone, under pressure below the $80–82k range.
Elsewhere, the US dollar was surprisingly better bid yesterday despite ugly job numbers. US companies announced the highest number of job cuts for any January since the post-GFC recession of 2009, according to Challenger. More than 180’000 jobs were lost — a 118% increase from a year earlier — and hiring intentions fell 13%, the weakest in the company’s 17-year record. Amazon, UPS and Dow are responsible for almost half of the job cuts — AI is a factor, but not the main driver.
In all cases, this week’s incomplete jobs figures continue to point in the same direction: the US jobs market is weakening. It would be interesting to see the official jobs data — but alas, a partial government shutdown prevents us from getting another perspective on the darkening picture. What’s sure, however, is that the US labour market is calling for Federal Reserve (Fed) support, if inflation allows. The next CPI update is due next Friday.
Elsewhere in FX, the EURUSD failed to reverse losses and could not hold above the 1.18 mark, despite the European Central Bank (ECB) leaving rates unchanged yesterday. Lagarde said the euro area economy remains ‘resilient’ and the outlook broadly balanced. She offered no guidance, downplayed the euro’s latest strength, but warned that tariff risks persist.
Across the Channel, the Bank of England (BoE) also maintained rates untouched, though the vote was very tight, prompting traders to ramp up bets that the BoE will cut rates — 60% probability in March, 90% in April. Cable fell and is now testing a major Fibonacci support, the 38.2% retracement of the November–January rise, which could determine whether the positive trend continues or the pair returns to the bearish consolidation zone. At this point, only waning appetite could keep Cable afloat.
Last but not least, Japan heads into a snap election this Sunday. The USDJPY is stabilizing just below 157. Stakes are high for Sanae Takaichi: she is willing to consolidate her political power and clear the way for aggressive fiscal spending — partly in defence and tech — to boost growth. A victory would likely boost equities (especially defence and tech), weigh on JGBs and weaken the yen. But here’s the catch: any move toward 160 sharply raises the risk of FX intervention, which could quickly kill the rally.
If Takaichi loses, however, the story flips. Fiscal ambitions stall, equities will likely lose momentum, JGBs catch a bid and the yen may strengthen, with USDJPY potentially drifting back toward the low 150s.
Swedish Inflation Figures Conclude the Week
In focus today
In Sweden, flash estimates for the Swedish January inflation will be released today. We expect a decrease in core inflation from 2.3% y/y in December to 1.9% y/y in January, which would mark the first month in four years with core inflation below the Riksbank's 2.0% target. At the same time, we foresee an increase in headline inflation due to elevated electricity prices in January with CPIF expected at 2.4% y/y (2.1% y/y in December).
Also in Sweden, the Swedish Debt Office will publish the outcome of central government payments for January. Since the latest borrowing report from November the outcomes have so far been in line with their prediction.
Note that the US Jobs Report, including nonfarm payrolls, that was up for release today has been postponed to Wednesday next week due to past weekend's government shutdown.
Economic and market news
What happened overnight
In Japan, President Trump announced his endorsement of current Prime Minister Takaichi, the first female premier, ahead of the election on Sunday. Takaichi's coalition shows strong results in opinion polls and are expected to win on Sunday.
What happened yesterday
In the euro area, the ECB decided to leave its key policy rates unchanged with the deposit facility rate at 2.00%, as widely expected by markets and consensus. Lagarde accentuated the positive factors of the economy such as low unemployment while downplaying the role of the inflation undershooting and strengthened euro. We maintain our call that the ECB will leave the deposit rate unchanged at 2.00% throughout both 2026 and 2027. For further information, see ECB Review - Accentuate the positive, 5 February.
In the UK, the Bank of England kept the interest rate unchanged at 3.75% in an unexpectedly narrow vote split of 5-4, which was a dovish surprise. In their report, they concluded that the economic outlook for the UK involves less growth and inflation than previously anticipated. This also entails that we continue to aim for the next rate cut in April but also pencil in another cut in November.
In the US, there was a big downside surprise as the JOLTs job openings came in at 6.542m in December (Cons: 7.200m, Nov: 6.928m). Hence, the US ratio of job openings to unemployed fell to just 0.87 in December. Such cooling is usually a good predictor for weakening wage growth and may be a concern for the private consumption outlook and, all else equal, supports the case for earlier cuts from the Fed.
In the US, the Challenger report also came in weaker than expected with job cuts totalling 108,435 in January. Generally, layoffs always pick up in January when seasonal holiday workers are laid off, but this was the largest number of layoffs announced for any given January since 2009. Amazon's 16k announced job cuts explained part of the uptick, but otherwise layoffs were broad-based across sectors.
Finally, the US state department has unveiled a programme to fund MAGA-aligned think-tanks and charities across Europe. The funding is expected to channel money into programs that promote American values and is connected to the 250-year celebration of American independence. The funding comes amid a general pullback of US foreign aid.
Bitcoin fell to its lowest level since October 2024 with a decline of 7% on Wednesday and a total decline so far this week of 11%. The fall comes amid higher volatility in markets and sell-off in tech stocks but could also be linked to Trump's nomination of Kevin Warsh as Fed Chair.
Equities: Global equities were markedly lower yesterday at -1.2%, with the majority of the move happening upon US open. Unlike the previous trading days this week, where one could pinpoint idiosyncratic drivers, the sell-off within equities were more like a classic risk-off with materials, consumer discretionary and IT with the biggest declines. S&P ended the day -1.2%, while Nasdaq was 1.6% lower, and Russell 2000 1.8% lower.
Overnight, Asian equities are weaker, as well as US futures. Alongside Amazon's earnings report they hiked their AI capex plans and announced a USD 200bn capex plan. Similar boost to capex was also seen from Microsoft and Alphabet when they reported. Amazon communicated that the money "predominantly" would go to its cloud services, reigniting the software vs hardware theme discussed in a previous morning espresso. Amazon dropped about 10% in the aftermarket.
FI and FX: Despite a slight softening of broad USD yesterday, the week has been characterised by a broad-based dollar rebound. EUR/USD has stabilised around 1.18 and could well remain in consolidation mode in the coming weeks. GBP had a rough session yesterday, as the Bank of England delivered an array of dovish signals at their policy meeting, although rates were left unchanged. Softer US labour market data sent US Treasury yields clearly lower yesterday, whereas European yields held mostly steady on ECB's firm hold. Scandies have had a couple of tough sessions, as the SEK suffers from the slightly dovish Riksbank minutes from earlier this week, whereas the NOK finds headwinds in global factors.
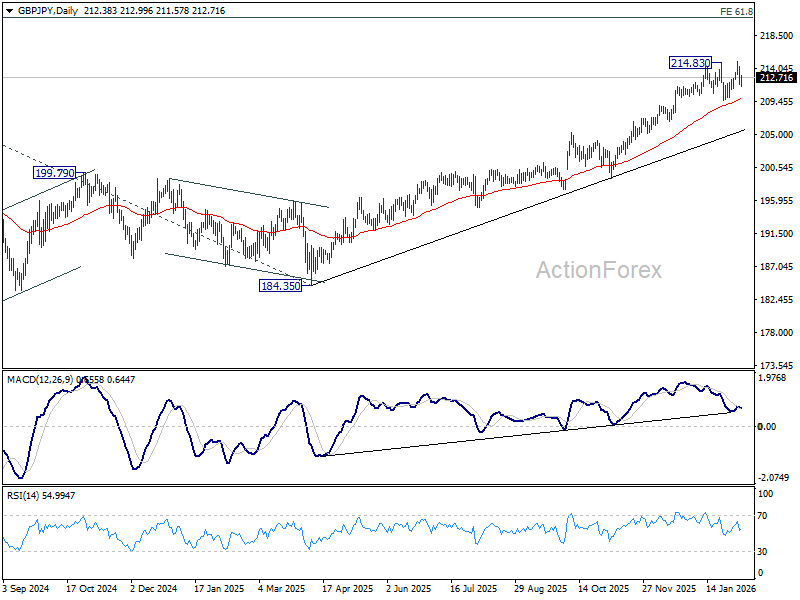
GBP/JPY Daily Outlook
Daily Pivots: (S1) 211.35; (P) 212.95; (R1) 214.10; More...
Intraday bias in GBP/JPY remains neutral as consolidations pattern from 214.83 is extending with another leg. On the upside. firm break of 214.83 will resume larger up trend to 220.90 projection level next. Rejection by 214.83 will bring more consolidations first. But in case of another dip, downside should be contained by 55 D EMA (now at 209.79) to bring rally resumption.
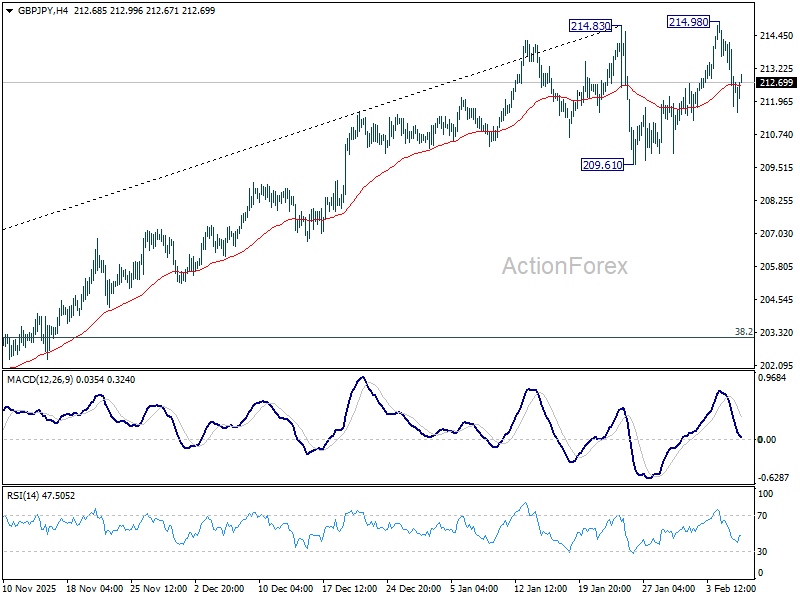
In the bigger picture, up trend from 123.94 (2020 low) is in progress. Next target is 61.8% projection of 148.93 (2022 low) to 208.09 (2024 high) from 184.35 at 220.90. On the downside, break of 205.30 resistance turned support is needed to indicate medium term topping. Otherwise, outlook will stay bullish even in case of deep pullback.
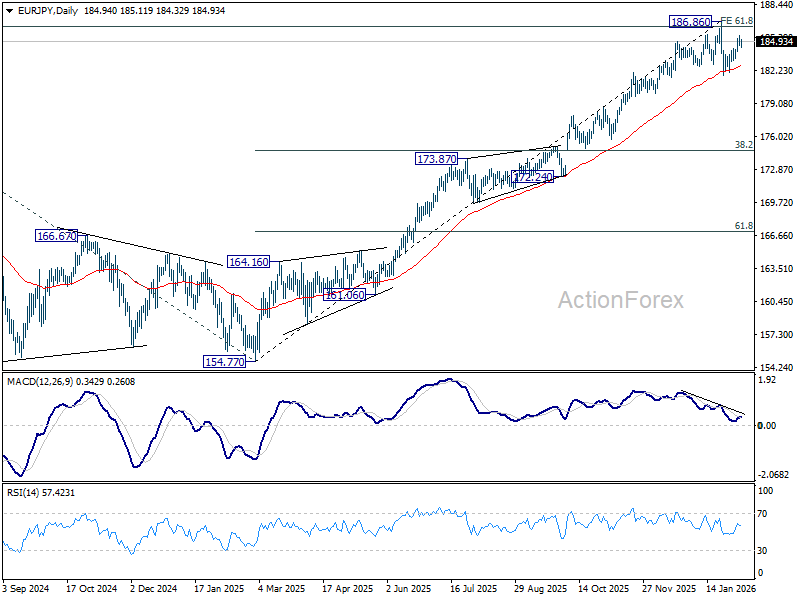
EUR/JPY Daily Outlook
Daily Pivots: (S1) 184.54; (P) 185.02; (R1) 185.49; More...
Intraday bias in EUR/JPY remains neutral at this point. On the downside, below 183.33 will bring retest of 181.76. Sustained trading below 55 D EMA (now at 182.56) should solidify the case that fall from 186.86 medium term top is correcting whole rise from 154.77. Deeper decline should then be seen to 38.2% retracement of 154.77 to 186.86 at 174.60. Nevertheless, firm break of 186.86 will resume larger up trend.
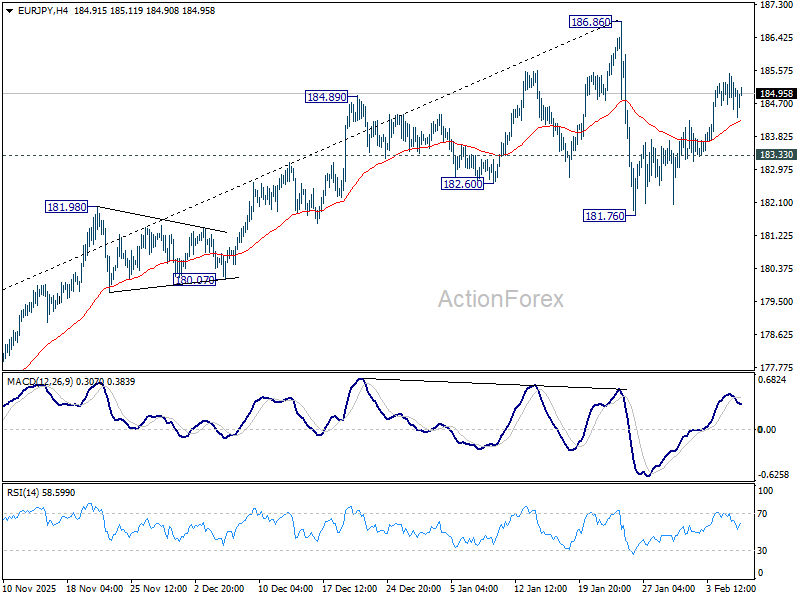
In the bigger picture, up trend from 114.42 (2020 low) is in progress and and met 61.8% projection of 124.37 to 175.41 from 154.77 at 186.31. Considering bearish divergence condition in D MACD, upside could be capped by 186.31 on first attempt. Still, outlook will stay bullish as long as 55 W EMA (now at 173.32) holds, even in case of deep pullback. Sustained break of 186.31 will pave the way to 78.6% projection at 194.88 next.