Sample Category Title
Yen Ticks Higher after BoJ Inflation
Inflation is slowly moving higher
The phrase “surging inflation” is in the financial press on a daily basis, as the major economies grapple with what has become public enemy number one. Japan, however, does not come to mind as a country dealing with high inflation, and indeed inflationary pressures there are much more modest than what we’re seeing elsewhere. Still, given that Japan was dealing with deflation for decades, the fact that inflation has moved above the Bank of Japan’s target of 2% is a significant development.
Last week, Japan’s Core CPI for May came in at 2.1% YoY, matching the April reading. The last time Core CPI was above 2.0% was back in 2015. Earlier today, BOJ Core CPI, the central bank’s preferred inflation gauge, came in at 1.5% in May, up a notch from the 1.4% in April. Next up is Tokyo Core CPI on Friday, which is expected to rise to 2.1%, up from 1.9%. The inflation sands have dramatically shifted – just 13 months ago, Tokyo Core CPI was in negative territory.
The BoJ wants to see higher inflation, but has argued that the current cost-push inflation is temporary, since it is driven by higher food and fuel prices. Governor Kuroda has insisted that the BoJ’s ultra-loose policy will not change until inflation is boosted by increased domestic demand and stronger wage growth. As part of this stance, the BoJ has vigorously defended its yield curve control and capped the yield on the 10-year JGB at 0.25%.
The BoJ’s yield curve control has come at a steep price for the Japanese yen, which has plunged around 17% in 2022 and recently fell to a 24-year low. The burning question facing investors is will the BoJ retreat and abandon its 0.25% cap in order to stabilize the currency. On a broader level, the BoJ finds itself out of line with other major central banks, which have embarked on an aggressive rate-hike cycle in order to curb inflation. Will the BoJ make adjustments to its ultra-loose policy? If so, the long-suffering yen could get a boost.
USD/JPY Technical
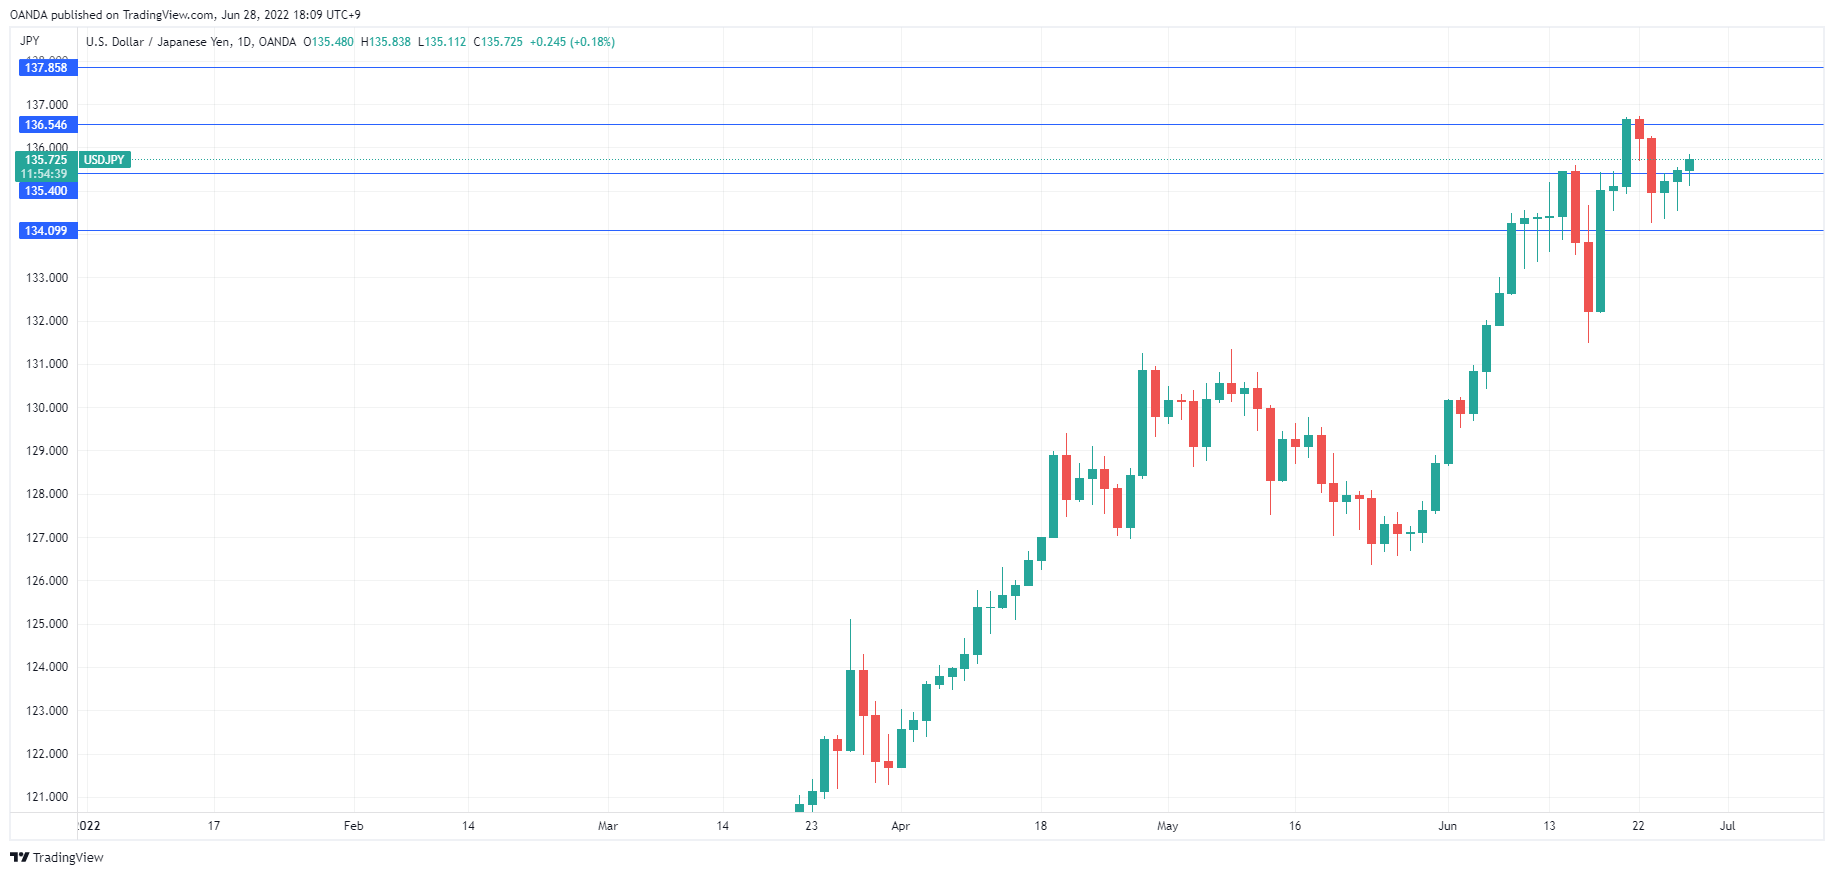
- USD/JPY tested resistance at 1.3540 earlier in the day. Above, there is resistance at 1.3654
- USD/JPY has support at 1.3409 and 1.3295
ECB Lagarde: Policy normalization will continue in a determined and sustained manner
ECB President Christine Lagarde said in a speech, "based on the overall outlook, the process of normalizing our monetary policy will continue in a determined and sustained manner." However, given the uncertainty, "the pace of interest rate normalization cannot be defined ex ante." She emphasized that the appropriate policy stance has to incorporate the "principles of gradualism and optionality".
As for policy moves ahead, Lagarde reiterated that ECB will end net asset purchases on July 1, then hike the three interest rates by 25bps at next meeting on July 21. Also, "a larger increment" would be appropriate at the September meeting, "if the medium-term inflation outlook persists or deteriorates".
Beyond September, the Governing Council has agreed that a "gradual but sustained" path of further rate increases will be appropriate. "The starting point at each meeting will be an assessment of the evolution of the shocks, their implications for the outlook and the degree of confidence we have in inflation converging to our medium-term target," she said.
ECB Kazaks: Frontloading rate hike a reasonable choice
ECB Governing Council member Martins Kazaks told BloombergTV today that if the central bank hikes by 25bps in July, then a 50bps hike might be needed in September. He argued that ECB might need to considering a 50bps hike in July instead.
"If we see that the situation has worsened, that inflation is high and we see negative news in terms of inflation expectations, then in my view front-loading the increase would be a reasonable choice," he said.
EURUSD Breaks Above Ascending Triangle after Lagarde Statement
The US dollar retreated slightly after strong economic data from the United States. Data by the commerce department showed that durable goods orders rose from 0.4% to 0.7%. That was a bigger increase than the median estimate of 0.1%. Core durable goods rose from 0.2% to 0.7%. Meanwhile, surprise data showed that pending home sales rose by 0.7% in May after falling by 4% in the previous month. Other housing numbers published last week like new and existing sales dropped in May. The next key data to watch will be the upcoming American consumer confidence. Expectations are that confidence dropped to 100 as the cost of doing business rose.
The Dow Jones, Nasdaq 100, and S&P 500 indices moved sideways as last Friday’s rally fizzled. The three indices were little changed as some investors took profits. Investors are also assessing the recent statements by the Federal Reserve. The bank has committed to hike interest rates in the coming months in a bid to fight inflation. Stocks also wavered after a relatively weak report by JP Morgan. The survey of 1,500 companies with revenues of between $50 million and $500 million shows that only 19% of them were optimistic about the economy.
The price of crude oil rose as the G7 members continued their meeting. The leaders agreed to increase forces on high alert to 300,000 in response to the Russia’s invasion of Ukraine. Most of these reserves will be stationed near Russia while countries will dramatically increase their defense spending. The members also decided to impose new sanctions on technology used to manufacture weapons. These new sanctions and posture by NATO could push Russia to influence the oil market since most NATO members are struggling with high gas prices.
XBRUSD
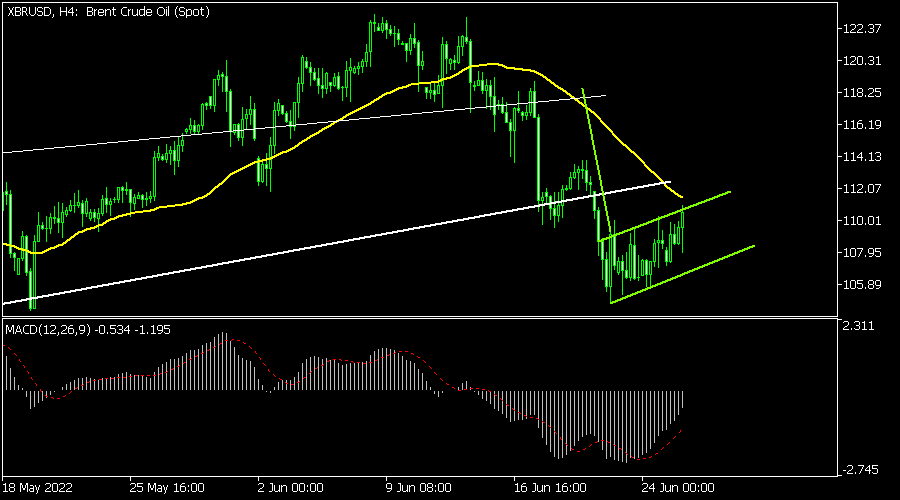
The XBRUSD pair has been in a bullish trend for the past few days. It is trading at 110.55, which was the highest point since June 27. On the four-hour chart, the pair has formed a bearish flag pattern, which is usually a bearish sign. It also remains slightly below the 25-day moving average. Also, it has moved below the lower side of the ascending channel shown in white. Therefore, the pair will likely resume the downward trend as bears target the lower side of the flag at 107.
EURUSD
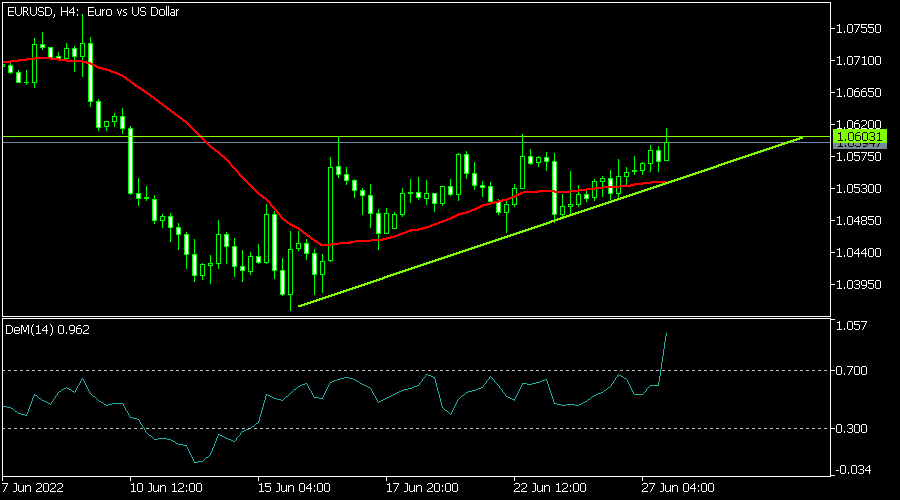
The EURUSD pair rose after a hawkish statement by Christine Lagarde. The pair rose to a high of 1.0618, which was the highest level since June 13. On the four-hour chart, it moved above the upper side of the ascending triangle pattern. It has also moved above the 25-day moving average while the DeMarker indicator moves above the overbought level. Therefore, the pair will likely continue rising now that it has formed a bullish breakout.
USDJPY
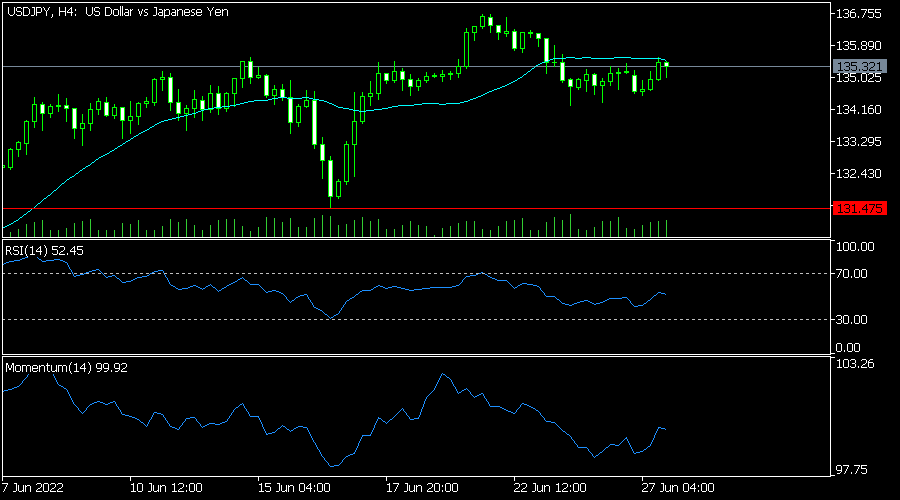
The USDJPY pair moved sideways and is hovering near its highest point in over 24 years. It is trading at 135.33, which was lower than the year-to-date high of 136.70. It has moved slightly below the 25-day moving average while the momentum indicator has tilted upwards. The Relative Strength Index has moved to the neutral point. It will likely remain in this range for a while.
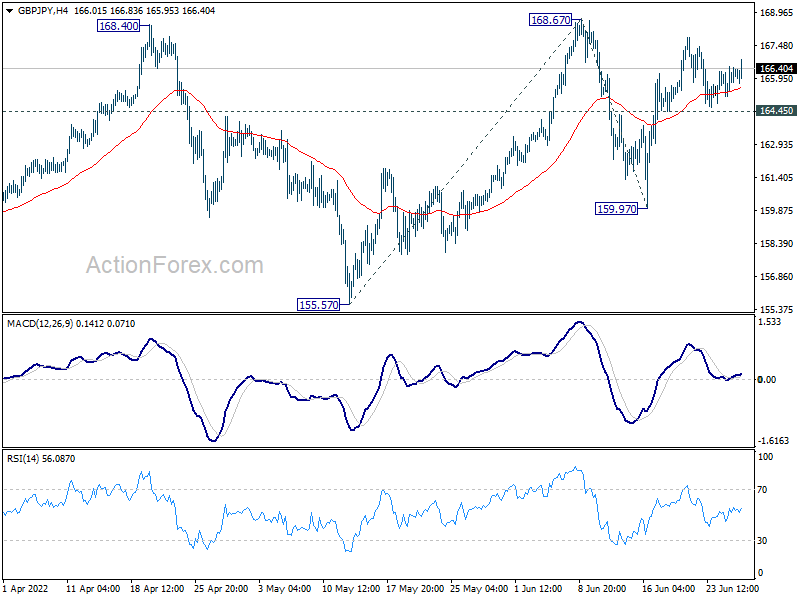
GBP/JPY Daily Outlook
Daily Pivots: (S1) 165.06; (P) 165.68; (R1) 166.56; More...
Range trading continues in GBP/JPY and intraday bias remains neutral. On the upside, decisive break of 168.67 resistance will resume larger up trend. Next near term target is 100% projection of 155.57 to 168.67 from 159.97 at 173.07. On the downside, below 164.45 minor support will turn bias back to the downside for 159.97 support instead.
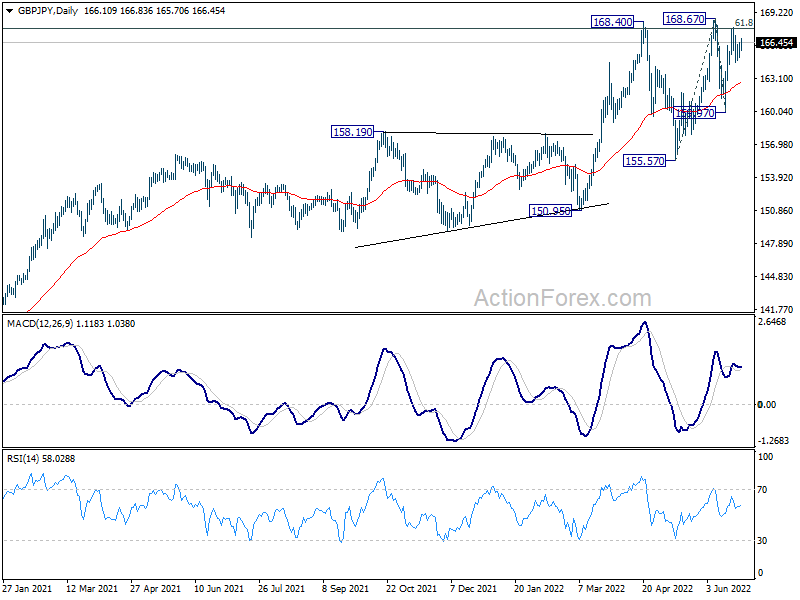
In the bigger picture, up trend from 123.94 (2020 low) is still in progress. Sustained break of 61.8% retracement of 195.86 (2015 high) to 122.75 (2016 low) at 167.93 will be a long term bullish signal, and could pave the way back to 195.86 high. This will now remain the favored case as long as 155.57 support holds, even in case of deep pull back.
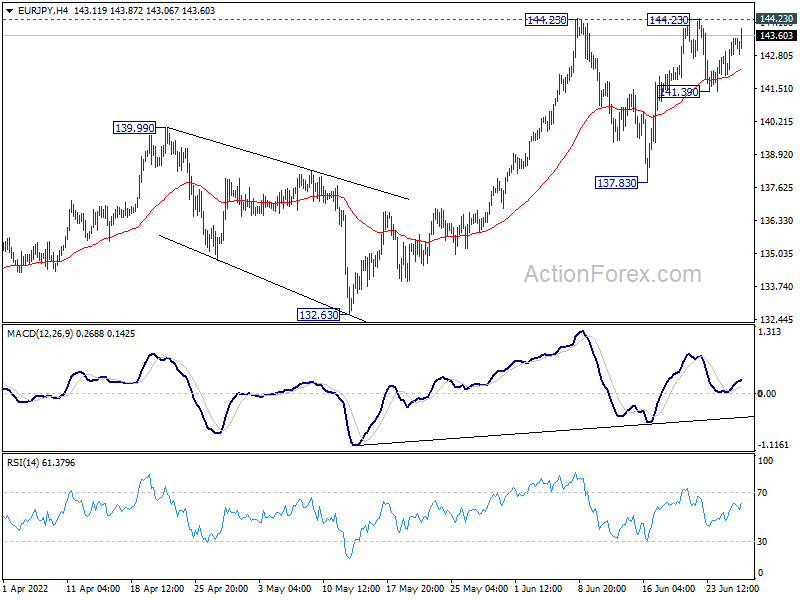
EUR/JPY Daily Outlook
Daily Pivots: (S1) 142.45; (P) 142.97; (R1) 143.91; More....
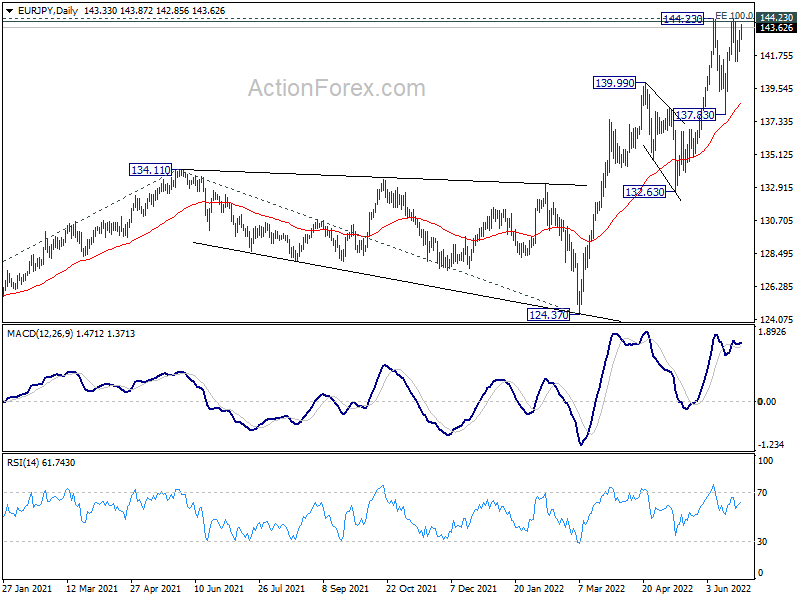
EUR/JPY is still staying in range below 144.23 and intraday bias remains neutral. On the upside, decisive break of 144.23 will resume larger up trend. On the downside, below 141.39 minor support will bring deeper fall, to extend the corrective pattern from 144.23.
In the bigger picture, up trend from 114.42 (2020 low) is in progress. Such rise is seen as the third leg of the pattern from 109.30 (2016 low). Sustained trading above 100% projection of 114.42 to 134.11 from 124.37 at 144.06 will indicate upside acceleration and target 149.76 long term resistance (2014 high). In any case, outlook will now remain bullish as long as 132.63 support holds, in case of deep pull back.
EUR/GBP Daily Outlook
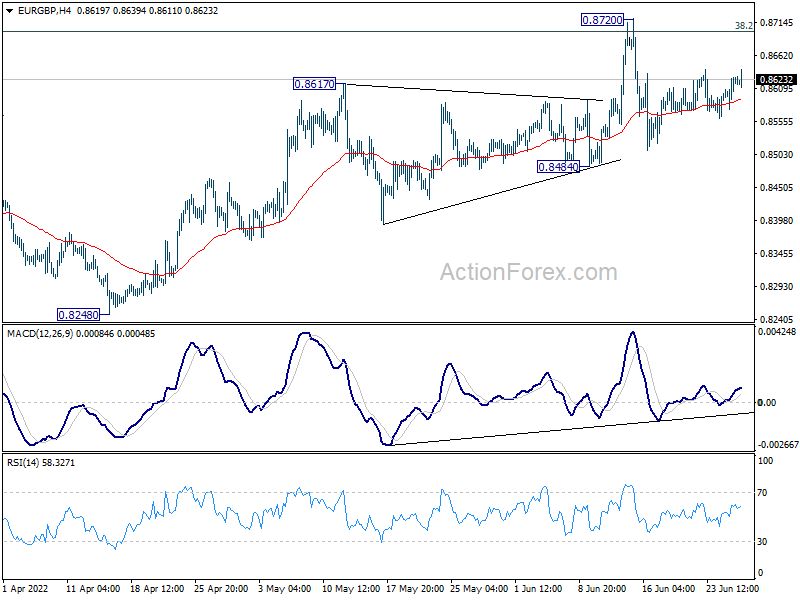
Daily Pivots: (S1) 0.8595; (P) 0.8611; (R1) 0.8645; More...
Range trading continues in EUR/GBP and intraday bias remains neutral. Further rally is expected with 0.8484 support intact. On the upside, break of 0.8720 and sustained trading above 0.8697 medium term fibonacci level will carry larger bullish implication. Next target is 0.9003 fibonacci level. However, break of 0.8484 will indicate rejection by 0.8697 and turn near term outlook bearish.
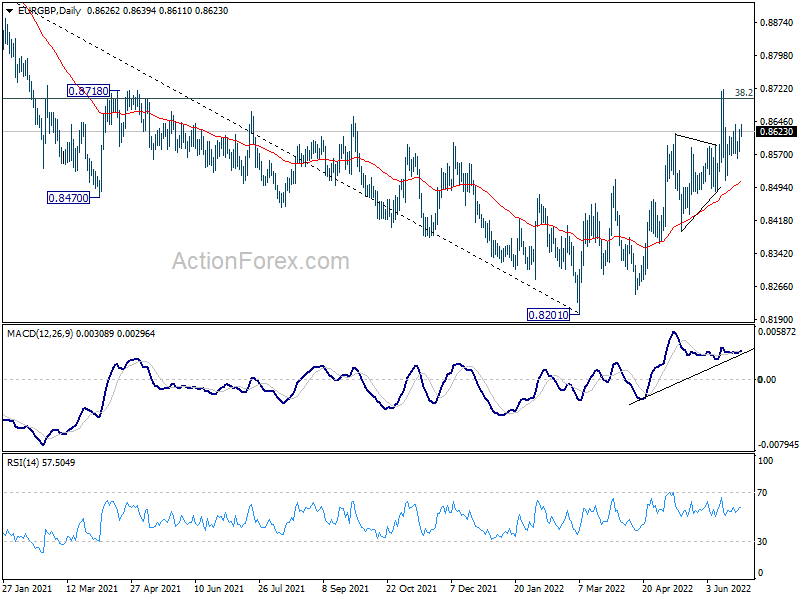
In the bigger picture, rise from 0.8201 medium term bottom could could either be a correction to the down trend from 0.9499 (2020 high), or a medium term up trend itself. Sustained break of 38.2% retracement of 0.9499 to 0.8201 at 0.8697 will affirm the latter case, and pave the way to 61.8% retracement at 0.9003. However, rejection by 0.8697 will maintain medium term bearishness.
EUR/AUD Daily Outlook
Daily Pivots: (S1) 1.5215; (P) 1.5257; (R1) 1.5330; More...
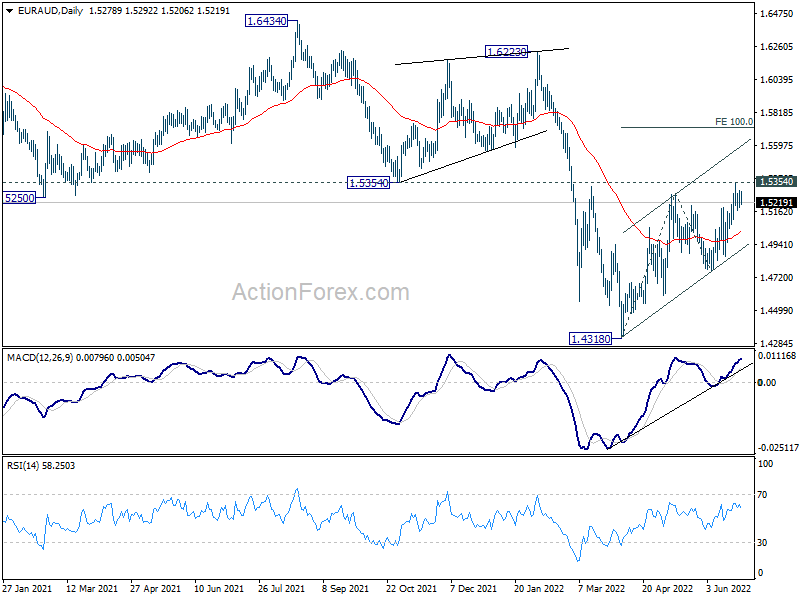
Intraday bias in EUR/AUD stays neutral for the moment. On the upside, sustained break of 1.5354 support turned resistance will indicate medium term bottoming at 1.4318. Stronger rally would be seen back to 100% projection of 1.4318 to 1.5277 from 1.4759 at 1.5718. On the downside, however, break of 1.5083 minor support will retain medium term bearishness, and turn bias back to the downside for 1.4759 support instead.
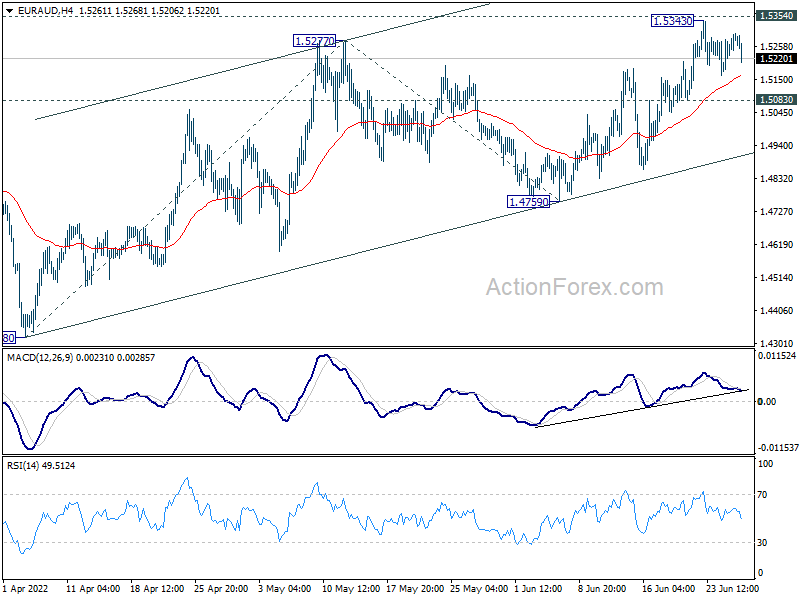
In the bigger picture, as long as 1.5354 support turned resistance holds, larger down trend from 1.9799 (2020 high) is still expected to continue. On resumption, next target is 61.8% projection of 1.9799 to 1.5250 from 1.6434 at 1.3623, which is close to 1.3624 long term support (2017 low). However, firm break of 1.5354 will indicate medium term bottoming and bring stronger rally back to 1.6434 key resistance.
EUR/CHF Daily Outlook
Daily Pivots: (S1) 1.0092; (P) 1.0125; (R1) 1.0153; More....
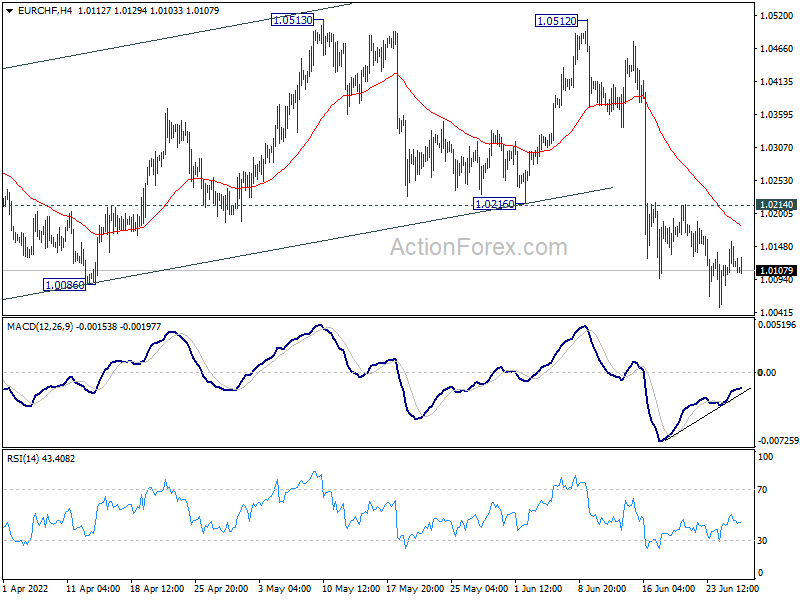
EUR/CHF is losing some downside momentum. But further decline is still expected with 1.0214 resistance intact. Further fall would be seen to retest 0.9970 low. Decisive break there will resume larger down trend. On the upside, however, above 1.0214 minor resistance will delay the bearish case, and turn bias back to the upside for stronger rebound.
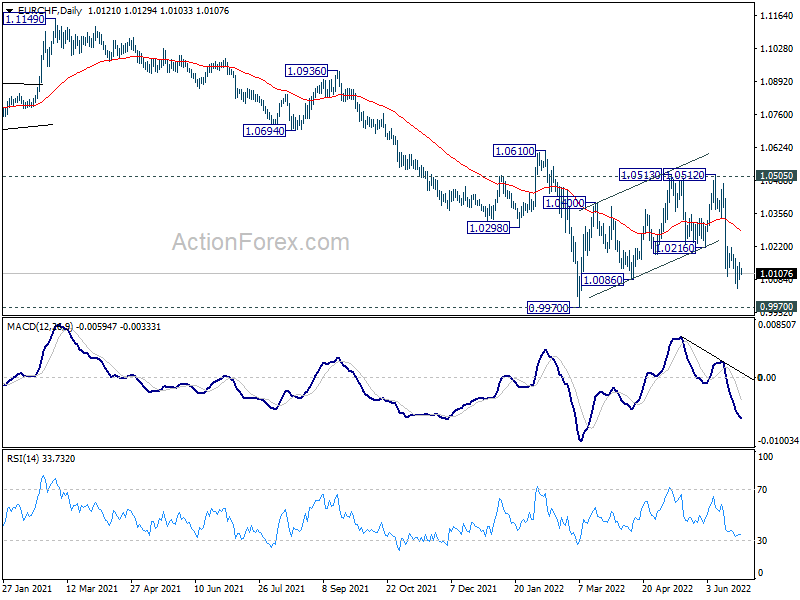
In the bigger picture, as long as 1.0505 support turned resistance (2020 low) holds, long term down trend from 1.2004 (2018 high) is expected to continue. Next target is 100% projection of 1.2004 to 1.0505 to 1.1149 at 0.9650. However, firm break of 1.0505 will suggest medium term bottoming, and bring stronger rebound towards 1.1149 structural resistance.
EUR/USD Daily Outlook
Daily Pivots: (S1) 1.0550; (P) 1.0583 (R1) 1.0614; More...
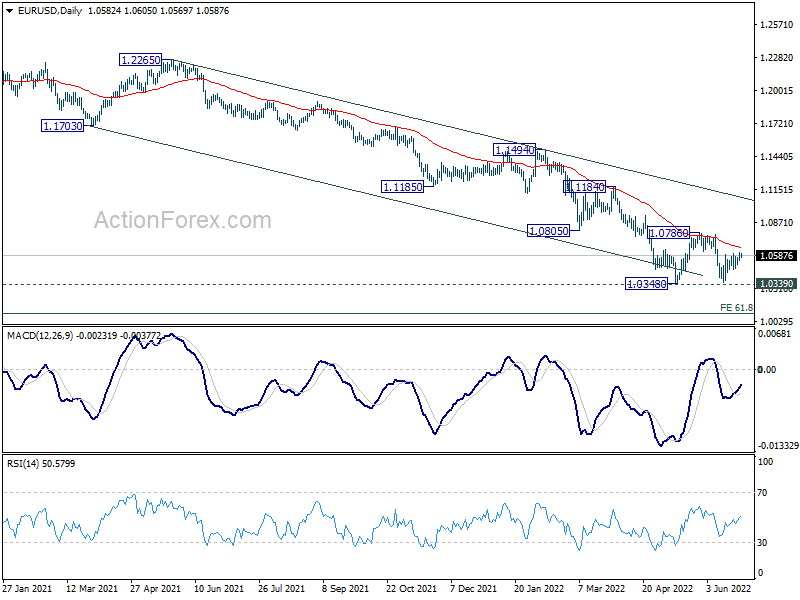
Sideway trading continues in EUR/USD and intraday bias remains neutral. Further fall is in favor with 1.0786 resistance intact. On the downside, sustained break of 1.0339/48 will resume larger down trend. Next target is long term projection level at 1.0090.
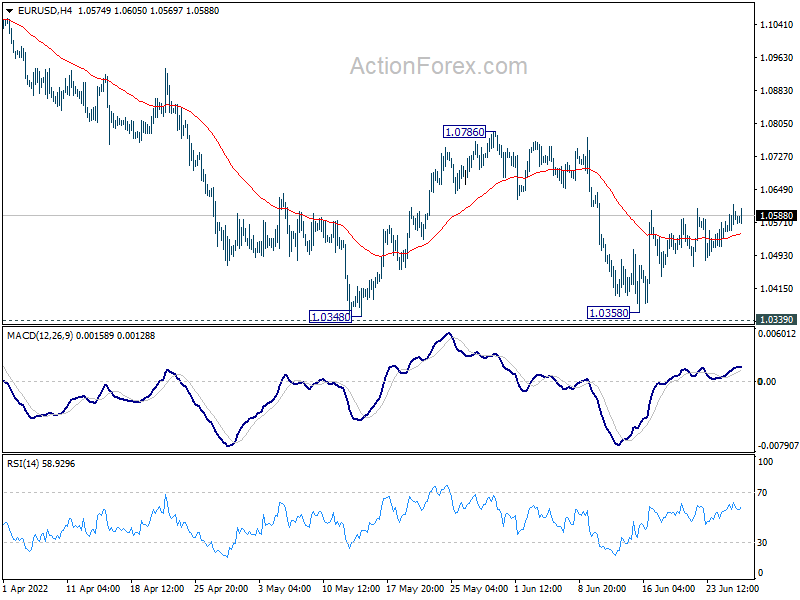
In the bigger picture, focus stays on 1.0339 long term support (2017 low). Decisive break there will resume whole down trend from 1.6039 (2008 high). Next target is 61.8% projection of 1.3993 to 1.0339 from 1.2348 at 1.0090. However, firm break of 1.0805 support turned resistance will delay this bearish case, and bring stronger rebound first.