Sample Category Title
USD/CHF Mid-Day Outlook
Daily Pivots: (S1) 0.9531; (P) 0.9575; (R1) 0.9608; More...
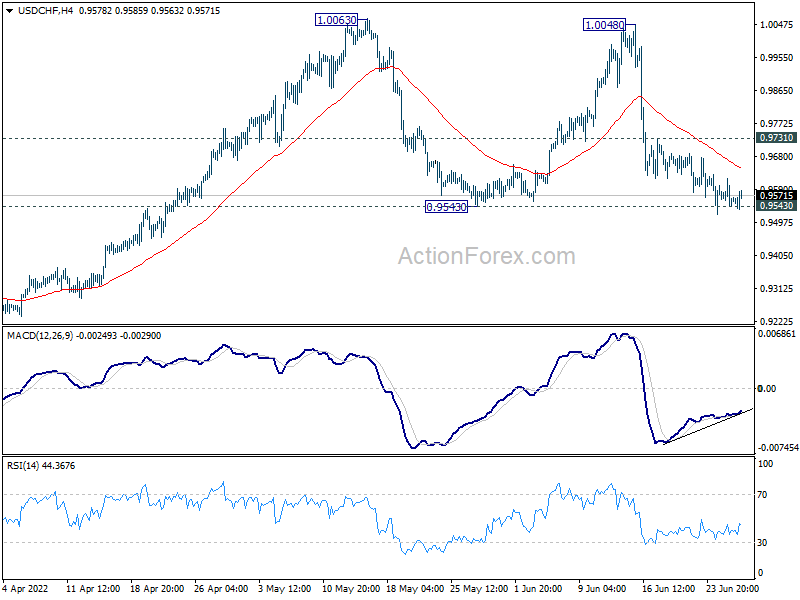
Intraday bias in USD/CHF remains neutral and outlook is unchanged. Fall from 1.0048 is still seen as the third leg of the consolidation pattern from 1.0063. Strong support should be seen around 0.9543 to bring rebound. On the upside, above 0.9731 minor resistance will turn bias back to the upside for retesting 1.0063 resistance. However, sustained break of 0.9543 will bring deeper fall back to 0.9459 resistance turned support.
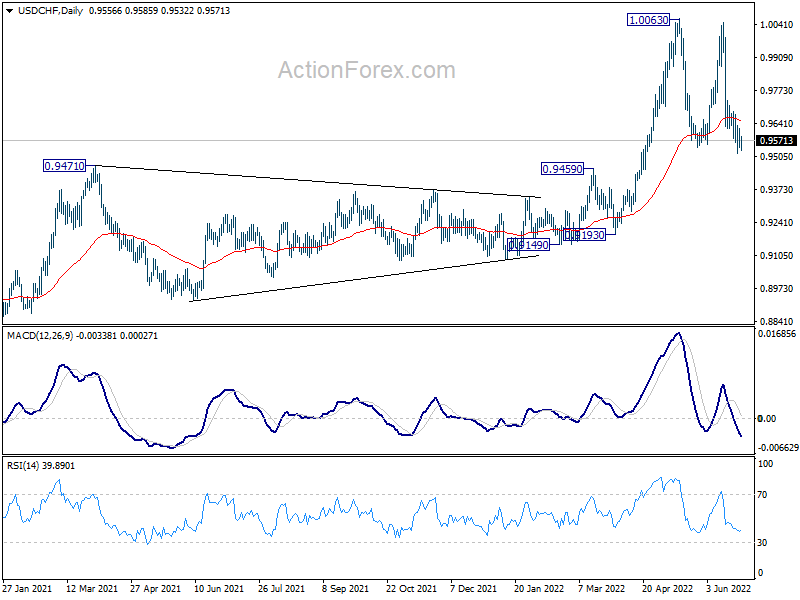
In the bigger picture, down trend from 1.0342 (2016 high) should have completed with three waves down to 0.8756 (2021 low) already. Rise from 0.8756 is likely a medium term up trend of its own. Next target is 1.0237/0342 resistance zone. This will remain the favored case as long as 0.9471 resistance turned support holds. However, sustained break of 0.9471 will extend long term range trading with another falling leg.
USD/JPY Mid-Day Outlook
Daily Pivots: (S1) 134.82; (P) 135.18; (R1) 135.85; More...
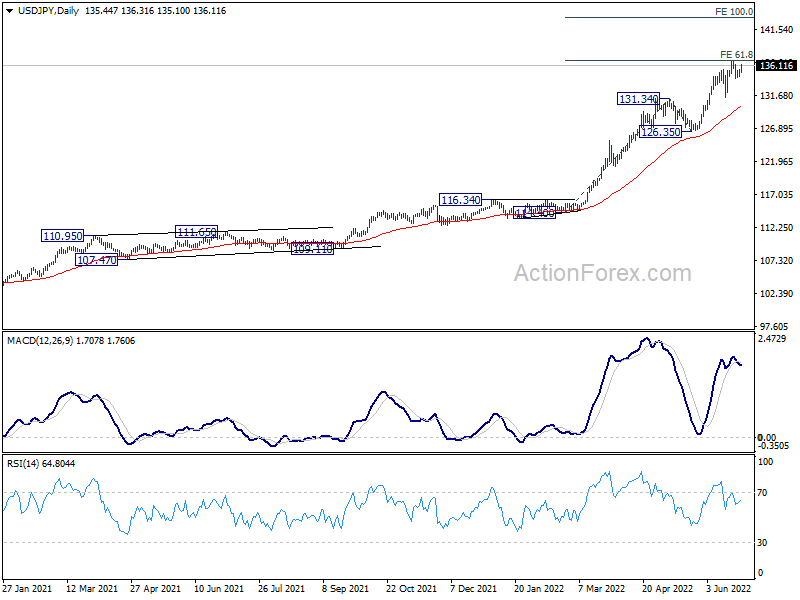
USD/JPY rebounds notably today but stays below 136.70 resistance. Intraday bias stay neutral first. On the upside, decisive break of break of 61.8% projection of 114.40 to 131.34 from 126.35 at 136.81 will extend larger uptrend. Next target is 100% projection at 143.29. On the downside, below 134.25 will extend the correction from 136.70 with another fall.
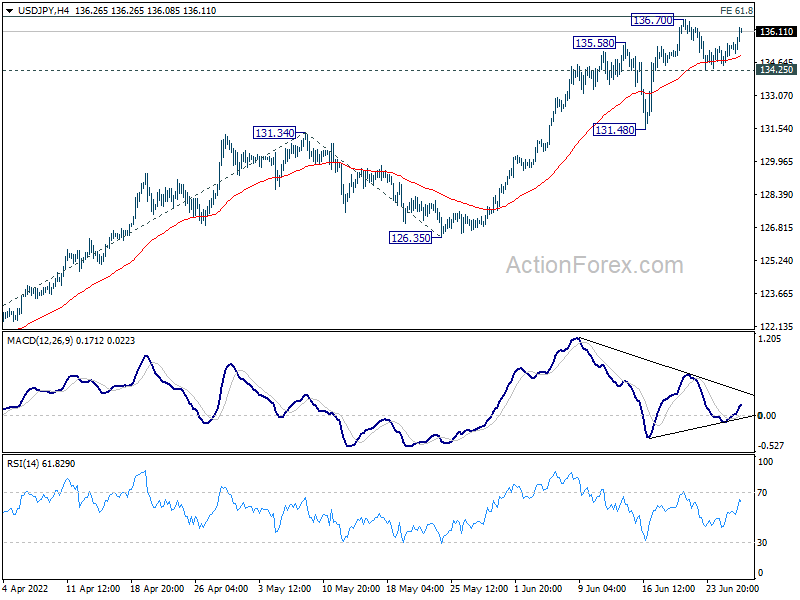
In the bigger picture, current rally is seen as part of the long term up trend from 75.56 (2011 low). Next target is 100% projection of 75.56 (2011 low) to 125.85 (2015 high) from 98.97 at 149.26, which is close to 147.68 (1998 high). This will remain the favored case as long as 126.35 support holds.
Yen Selling is Back, Dollar Attempting to Rally
Yen is back as the worst performer on improving risk sentiment and rising yields. Dollar is trying to rally in early US session following rise in treasury yields. But strength is mainly seen against European majors and Yen only. Canadian and Australian Dollars are resilient so far. In other markets, Gold is largely staying in familiar range. WT crude oil is extending recovery, back above 113 handle. European and US stock markets are likely extending near term rebound.
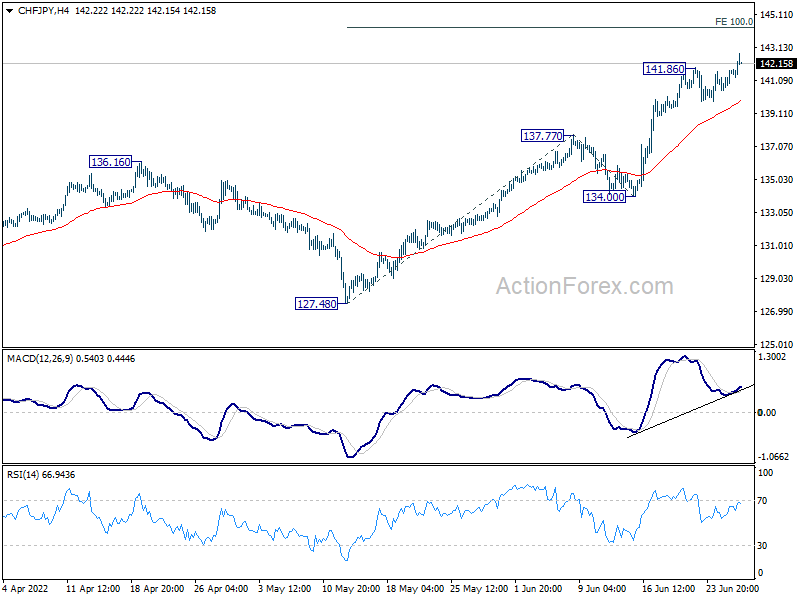
Technically, Yen crosses will come into focus today. CHF/JPY has already resumed recent up trend by breaking through 141.86 resistance. Next target is 100% projection of 127.48 to 137.77 from 134.00 at 144.29. EUR/JPY and USD/JPY could follow by breaking through 144.23 and 136.70 resistance levels respectively.
In Europe, at the time of writing, FTSE is up 1.23%. DAX is up 0.75%. CAC is up 1.16%. Germany 10-year yield is up 0.083 at 1.631. Earlier in Asia, Nikkei rose 0.66%. Hong Kong HSI rose 0.85%. China Shanghai SSE rose 0.89%. Singapore Strait Times rose 0.09%. Japan 10-year JGB yield dropped -0.0039 to 0.234.
US goods trade deficit narrowed to USD 104.3B in May
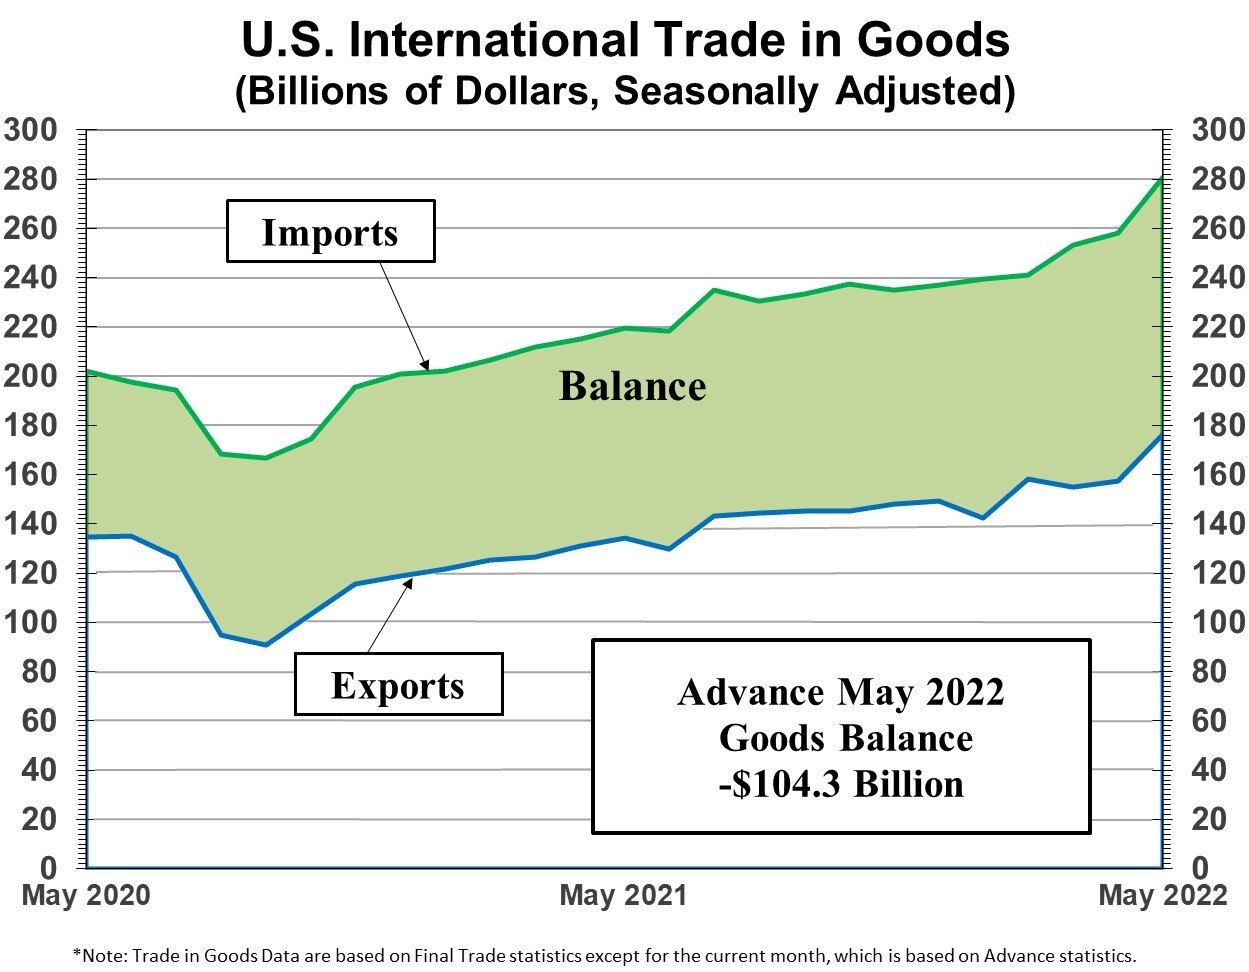
US goods exports rose USD 2B to USD 176.6B in May. Goods imports dropped USD -0.4B to USD 280.9B. Goods trade deficit narrowed from USD -106.7B to USD -104.3B, still above expectation of USD -101.7B.
Wholesale inventories rose 2.0% to USD 880.6B. Retail inventories rose 1.1% to USD 705.3B.
ECB Lagarde: Policy normalization will continue in a determined and sustained manner
ECB President Christine Lagarde said in a speech, "based on the overall outlook, the process of normalizing our monetary policy will continue in a determined and sustained manner." However, given the uncertainty, "the pace of interest rate normalization cannot be defined ex ante." She emphasized that the appropriate policy stance has to incorporate the "principles of gradualism and optionality".
As for policy moves ahead, Lagarde reiterated that ECB will end net asset purchases on July 1, then hike the three interest rates by 25bps at next meeting on July 21. Also, "a larger increment" would be appropriate at the September meeting, "if the medium-term inflation outlook persists or deteriorates".
Beyond September, the Governing Council has agreed that a "gradual but sustained" path of further rate increases will be appropriate. "The starting point at each meeting will be an assessment of the evolution of the shocks, their implications for the outlook and the degree of confidence we have in inflation converging to our medium-term target," she said.
ECB Kazaks: Frontloading rate hike a reasonable choice
ECB Governing Council member Martins Kazaks told BloombergTV today that if the central bank hikes by 25bps in July, then a 50bps hike might be needed in September. He argued that ECB might need to considering a 50bps hike in July instead.
"If we see that the situation has worsened, that inflation is high and we see negative news in terms of inflation expectations, then in my view front-loading the increase would be a reasonable choice," he said.
Germany Gfk consumer sentiment dropped to new record low, in a downward spiral
Germany Gfk consumer sentiment. for July dropped from -26.2 to -27.4, better than expectation of -27.7. But that's nonetheless another record low since 1991.
In June, economic expectations dropped from -9.3 to -11.7. Consumers continue to see a significant risk of recession in Germany. Income expectations dropped from -23.7 to -33.5, worst reading in almost 20 years. Propensity to buy dropped from -11.1 to -13.7, worst since 2008.
"The ongoing war in Ukraine and disruptions in supply chains are causing energy and food prices in particular to skyrocket, resulting in a gloomier consumer climate than ever before", explains Rolf Bürkl, GfK consumer expert. "Above all, the increase in the cost of living, which is almost eight percent at present, is weighing heavily on consumer sentiment and sending it into a downward spiral."
USD/JPY Mid-Day Outlook
Daily Pivots: (S1) 134.82; (P) 135.18; (R1) 135.85; More...
USD/JPY rebounds notably today but stays below 136.70 resistance. Intraday bias stay neutral first. On the upside, decisive break of break of 61.8% projection of 114.40 to 131.34 from 126.35 at 136.81 will extend larger uptrend. Next target is 100% projection at 143.29. On the downside, below 134.25 will extend the correction from 136.70 with another fall.
In the bigger picture, current rally is seen as part of the long term up trend from 75.56 (2011 low). Next target is 100% projection of 75.56 (2011 low) to 125.85 (2015 high) from 98.97 at 149.26, which is close to 147.68 (1998 high). This will remain the favored case as long as 126.35 support holds.
Economic Indicators Update
| GMT | Ccy | Events | Actual | Forecast | Previous | Revised |
|---|---|---|---|---|---|---|
| 06:00 | EUR | Germany Gfk Consumer Confidence Jul | -27.4 | -27.7 | -26 | -26.2 |
| 12:30 | USD | Goods Trade Balance (USD) May P | -104.3B | -101.7B | -106.7B | |
| 12:30 | USD | Wholesale Inventories May P | 2.00% | 2.20% | 2.20% | 2.30% |
| 13:00 | USD | S&P/Case-Shiller Home Price Indices Y/Y Apr | 21.20% | 21.00% | 21.20% | |
| 13:00 | USD | Housing Price Index M/M Apr | 1.60% | 1.00% | 1.50% | |
| 14:00 | USD | Consumer Confidence Jun | 100 | 106.4 |
US goods trade deficit narrowed to USD 104.3B in May
US goods exports rose USD 2B to USD 176.6B in May. Goods imports dropped USD -0.4B to USD 280.9B. Goods trade deficit narrowed from USD -106.7B to USD -104.3B, still above expectation of USD -101.7B.
Wholesale inventories rose 2.0% to USD 880.6B. Retail inventories rose 1.1% to USD 705.3B.
Dollar Index May Have Peaked, But Risks Remain for Europe, Japan
In the financial markets, the demand for risky assets has done its baby steps in recovery. The currency market recently has been moving in small increments, but straightforwardly, selling off the dollar against most developed country rivals.
Interestingly, this retreat is more measured than in the second half of May and is not supported by the dynamics of US bond yields. Yields on 10-years have been rising for the last three trading sessions, reaching 3.2%, failing to return to below 3%.
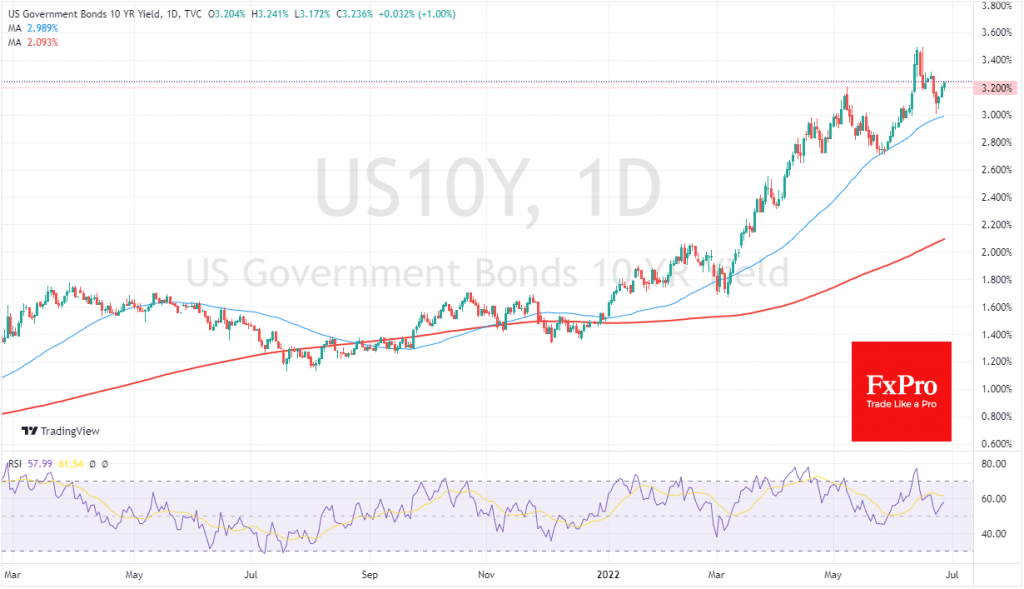
The dollar’s weakening against the background of rising yields reflects two processes. Firstly, there is some increased confidence that the US economy will be able to adjust to higher inflation. Secondly, the loss of upward momentum in the dollar – is the consequence that other central banks have gone out at the same pace of policy tightening, and the markets are starting to put a comparable rate of policy tightening with the Fed into quotations.
This behaviour of the dollar fits into historical patterns, with the average dollar’s momentum that lasts about one year in response to a policy reversal from a pause to a tightening.
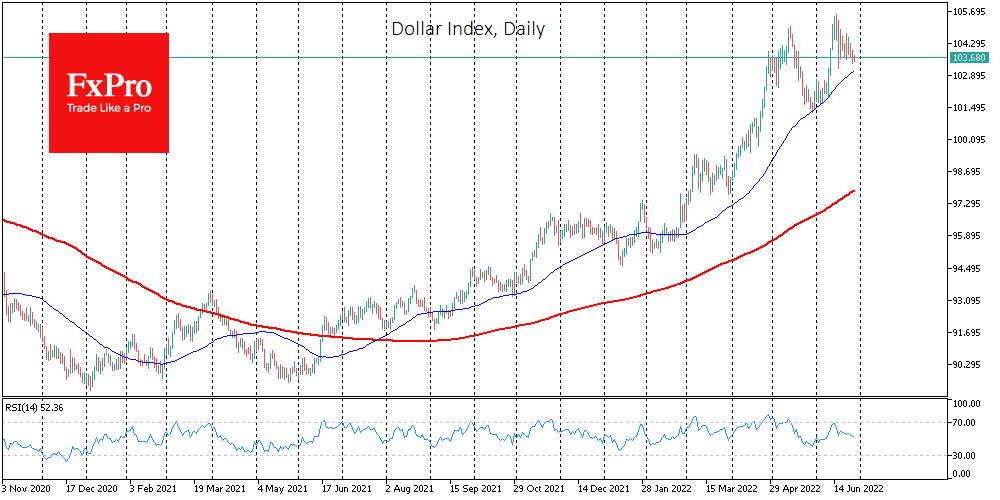
Such an approach suggests that the 17.7%-dollar rally that started in May 2021 is now over. The final chord was the rally in anticipation of a rate hike of 75 points on 15 June, which simultaneously led to a peak in the index.
However, it is also worth remembering the lessons of history not to be too bearish about the USD because the tighter financial conditions in the USA often end with aftershocks in other parts of the world. Such was the series of defaults by Asian countries in 1997 and Russia’s domestic debt default in 1998, triggering a series of local currency devaluations. After the global financial crisis, we saw the default of Greece with intense pressure and a loss of confidence in the euro.
In our view, investors now should again focus on the risks to the eurozone and Japan, not to mention the growing wave of problems in the middle emerging countries suffering from soaring food and energy prices. Investors and traders should pay close attention to these areas, lest they be trapped in overconfidence that the peak of market fear is over.
Aussie Rises ahead of Retail Sales
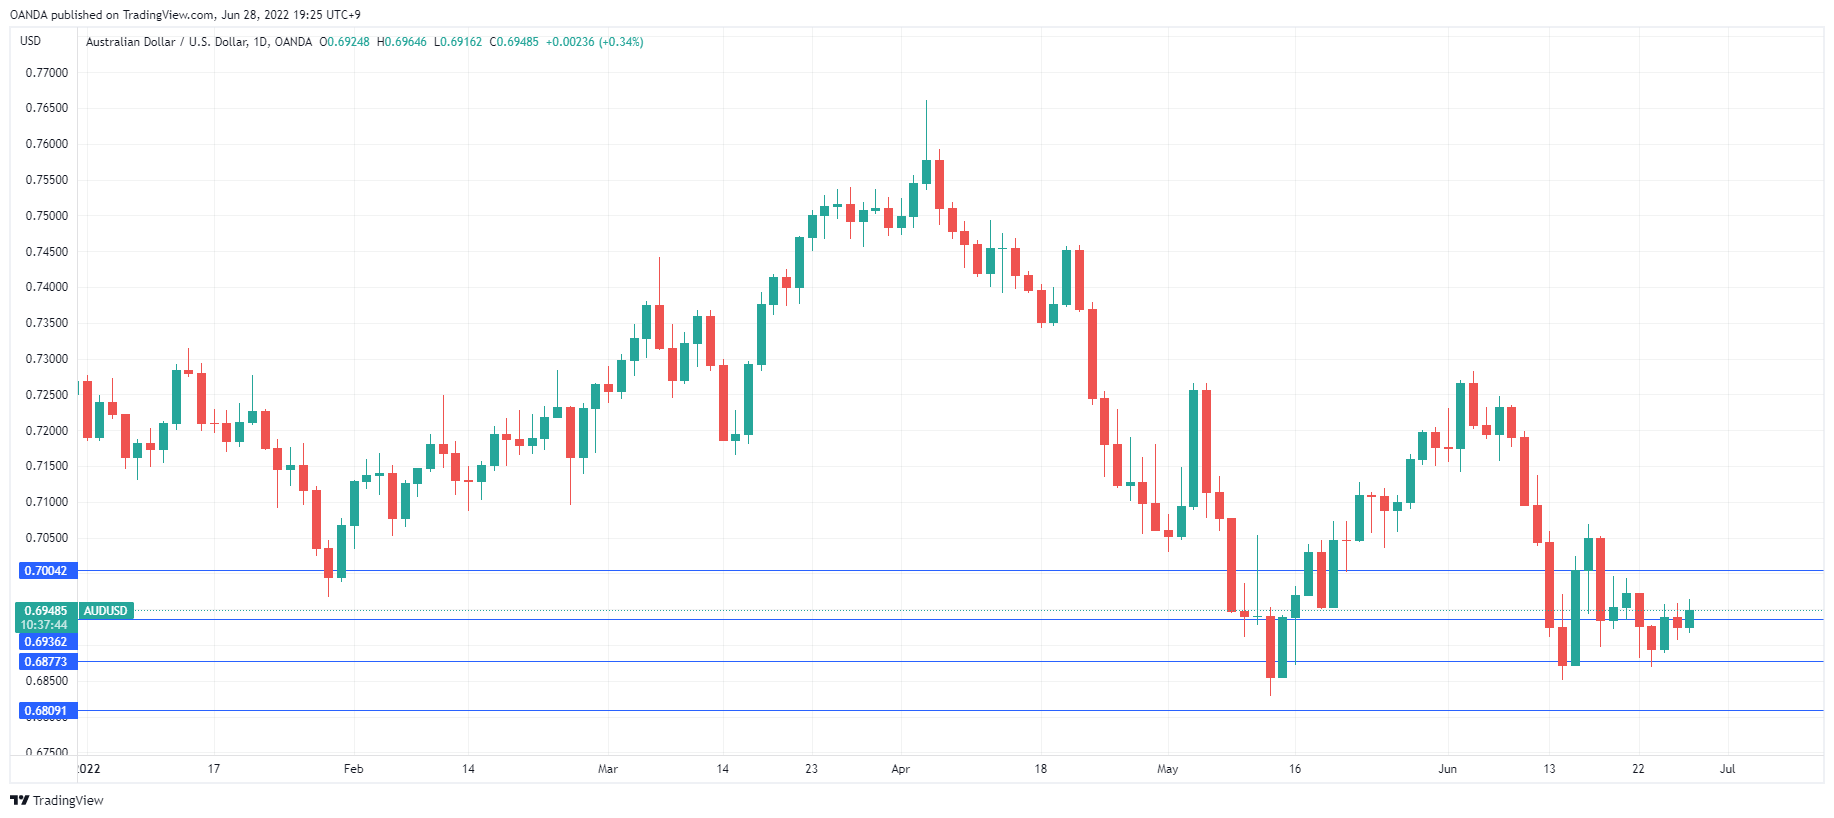
The Australian dollar is in positive territory on Tuesday. AUD/USD is trading at 0.6944 in European trade, up 0.28% on the day.
Retail sales expected to soften
Australia releases retail sales for May on Wednesday. Retail sales is the primary gauge of consumer spending, and the markets are braced for a weak reading of 0.3%, following a 0.9% gain in April. Consumers are holding tightly onto their purse strings, as interest rates are on the rise and the cost-of-living crisis is intensifying. A deceleration in retail sales could cause slowdown fears and push the Australian dollar lower.
The markets are already nervous about an economic slowdown, with the RBA in the midst of its rate-tightening cycle. The central bank surprised the markets with a super-size 0.50% hike earlier in June, and the RBA could deliver another 0.50% increase at next week’s meeting, or stick with a modest 0.25% rise. The cash rate is still relatively low at 0.85%, and the Bank will have to raise rates aggressively in order to curb soaring inflation.
On Friday, Governor Lowe stated that there were no plans to raise rates by a massive 0.75% hike at the upcoming meeting. This of course does not rule out the possibility of such a move at later meetings. Lowe suggested last week that wage growth should be about 3.5%, half of the 7% inflation rate that the RBA is projecting by year’s end. This would essentially mean a pay cut for workers and could be the recipe for labour unrest if workers demand higher wages to compensate for soaring inflation. Wage growth has been very modest and is not a cause of the jump in inflation; rather, the war in Ukraine and supply chain disruptions, notably in China, have been the primary drivers of inflation.
AUD/USD Technical
- AUD/USD is testing resistance at 0.6936, followed by resistance at 0.7004
- There is support at 0.6877 and 0.6809
EUR/USD: Thick Daily Ichimoku Cloud Continues to Limit Recovery
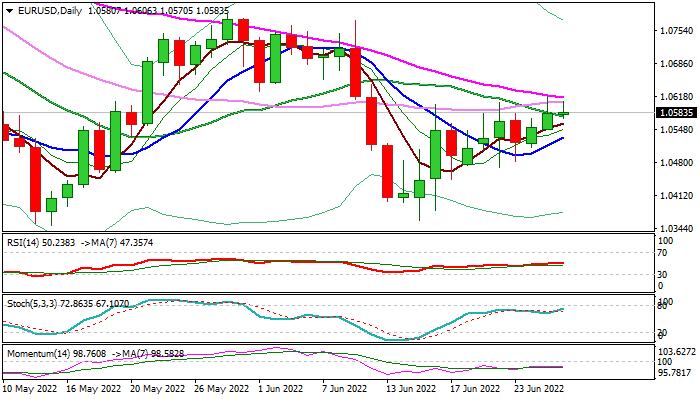
Although the Euro stands at the front foot and continues to attempt higher, the recovery remains questioned, as thick daily cloud continues to limit the action for the sixth straight day, while falling 55 DMA (1.0614) additionally weighs.
Technical studies on a daily chart show still strong bearish momentum and mixed setup of moving averages (5,10,20,55), while daily cloud, spanned between 1.0596 and 1.0767, continues to strongly pressure the action that adds to stall signals.
Expect initial negative signal on return and close below 10DMA (1.0533), with drop below1.0469/56 (June 22 spike low/Fibo 61.8% of 1.0358/1.0614) to confirm lower top and shift focus towards key supports at 1.0358/49/40 (lows of June 15/May 13/2017).
Only sustained break above 55DMA would strengthen near-term structure and generate initial signal of bullish continuation of recovery leg from 1.0358.
Res: 1.0614; 1.0623; 1.0685; 1.0700.
Sup: 1.0577; 1.0533; 1.0517; 1.0486.
Bitcoin’s Protracted Sideways Slide
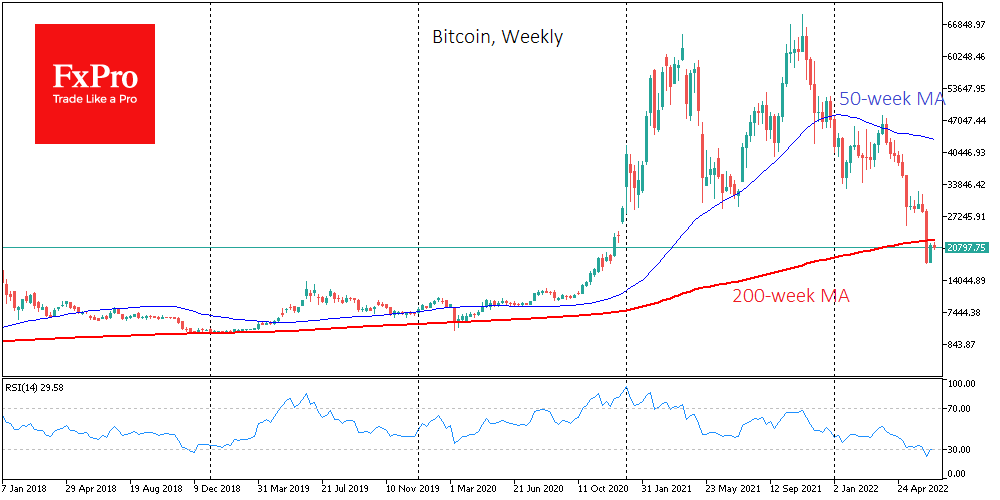
Bitcoin has lost 1.9% in the past 24 hours, trading near $20.8K on Tuesday morning. Ethereum lost 2.3% to $1190, while other leading altcoins fell from 1.4% (BNB) to 6.5% (Dogecoin).
Total cryptocurrency market capitalisation, according to CoinMarketCap, sank 1.8% overnight to $933bn. The cryptocurrency Fear and Greed Index was down 2 points to 10 by Tuesday and remains in “extreme fear” mode.
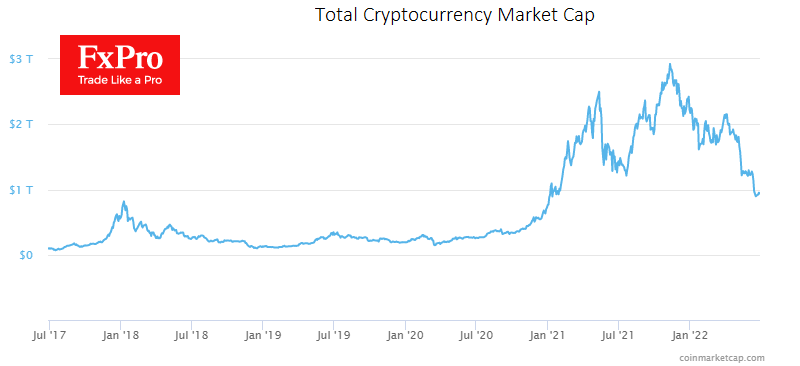
Bitcoin was down on Monday, echoing the behaviour of the US stock indices. However, the stock market, particularly the Nasdaq, showed a much sharper rebound last week.
The BTCUSD remains under its simple 200-week moving average. It needs a meaningful fundamental driver, which is not yet easy to find and overcome.
The inability to find a point for a quick recovery makes the current cycle like the previous two in 2014 and 2018, when the decline lasted a year, after which we saw about a year of sluggish momentum with a slight noticeable upward bias. If we do see a repeat of this pattern, the pressure on the first cryptocurrency and following it, the whole market could continue until the end of the year, and there is no point in rushing to buy right now in the hope of a V-shaped rebound.
Bitcoin is experiencing the worst bearish trend in its history, Glassnode believes, and most investors are selling the coin at a loss.
According to Bloomberg, the collapse of BTC put mining companies’ loans worth $4 billion at risk of default. BTC miners are now selling it and bucking the bearish trend: they have sold 20% of their volumes in the past two months. Their selling may continue in the third quarter if market conditions don’t improve, JPMorgan believes.
Galaxy Digital CEO Mike Novogratz believes the recession in the crypto market will last 18 months. Adverse market conditions will test crypto exchanges, and some may go bust, Kaiko admits.
A growing number of cryptocurrency hedge funds are selling the US dollar-linked stable coin Tether (USDT) amid the gloomy outlook for the crypto market. According to CoinGecko, Tether’s market capitalisation has fallen by more than $20 billion since mid-May.
The Bank for International Settlements published a report on several central banks’ experiments with digital currencies and concluded that the future of cross-border payments lies with state-owned Stablecoins.
GBPUSD in Wait-and-See Mode Within Downtrend
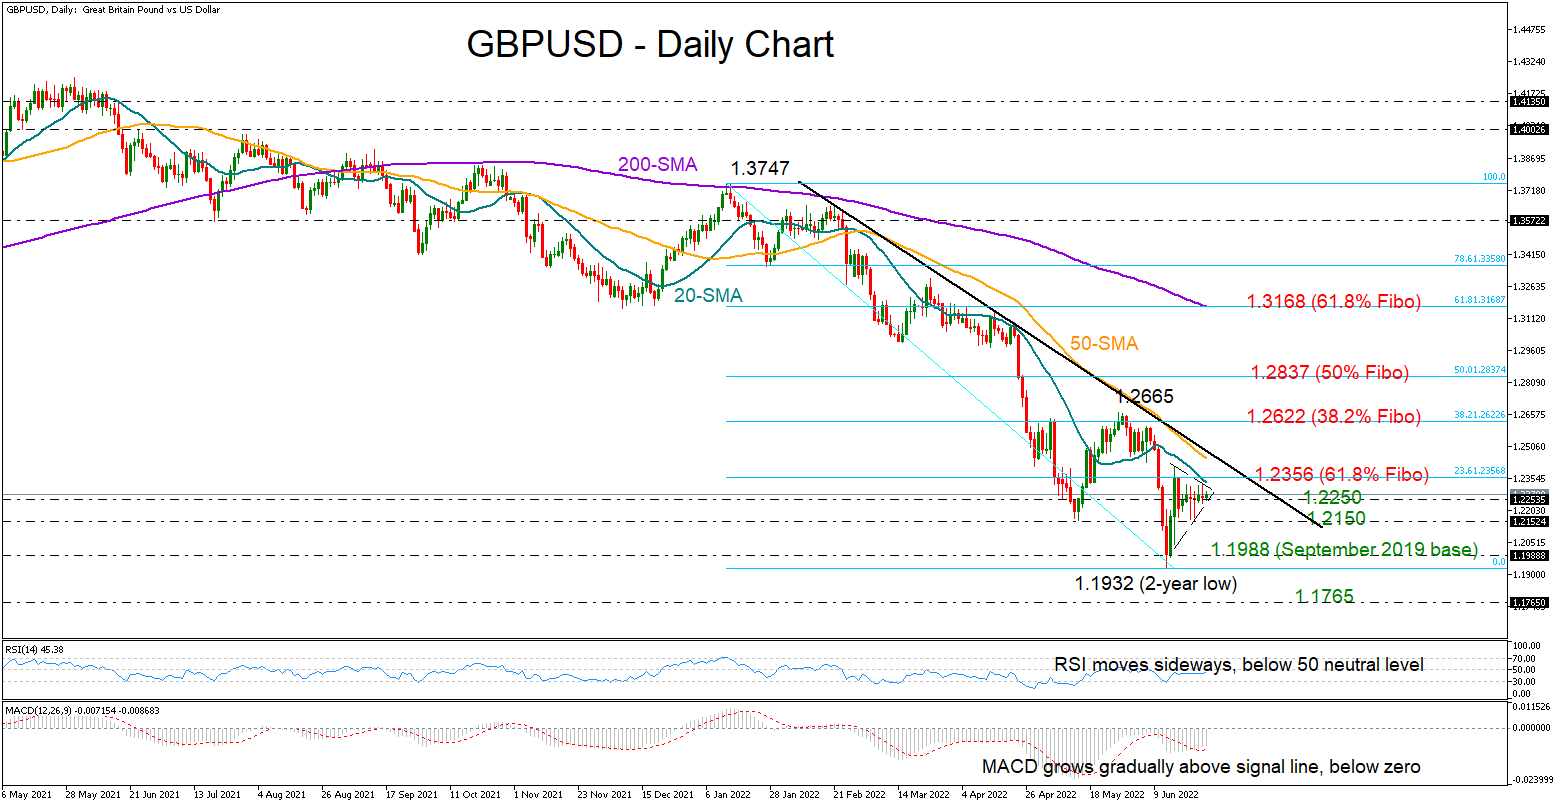
GBPUSD has been tip toeing sideways over the past week within the range of 1.2150 – 1.2356, unable to extend its recovery off two-year lows.
The momentum indicators are reflecting a neutral bias as the latest rebound in the RSI has stalled marginally below its 50 neutral mark, while the MACD continues to grow gradually within the negative region and barely above its red signal line.
As regards the market trend though, the picture remains bearish given the lower lows and lower highs formed below the descending trendline. The falling simple moving averages (SMA) are also promoting the negative direction in the market.
A close above the 20-day simple moving average (SMA) and the 23.6% Fibonacci retracement of the 1.3747 – 1.1932 downtrend at 1.2356 could immediately pause around the descending trendline at 1.2465. The 50-day SMA is positioned in the same area. Therefore, another bullish break at this point could confirm an extension towards the 38.2% Fibonacci of 1.2622, where June’s peak is also placed. Should upside pressures accelerate from here, violating the negative trend pattern, the spotlight will shift up to the 50% Fibonacci of 1.2837.
Looking for support levels, the 1.2250 region has been cooling downside forces over the past week. Should that floor collapse, the 1.2150 restrictive region may come to the rescue, preventing a continuation towards the crucial zone of 1.1988 – 1.1932. In case the downtrend resumes below the latter, a new lower low could be formed around 1.1765, taken from March 2020.
In the four-hour chart, the pair keeps trading within a triangle for the second consecutive week.
In summary, GBPUSD is holding a neutral-to-bearish status in the short-term picture. Failure to bounce above 1.2356, and more importantly beyond 1.2465, may shift attention back to the downside.
WTI Oil: Oil Price Rises on Renewed Supply Concerns
WTI oil advanced around $8 in a strong recovery that extends into third straight day, lifted by renewed supply concerns.
Growing worries that OPEC members Saudi Arabia and United Arab Emirates, the only two cartel-member countries with spare capacity available to cover up for lost Russian supply, are unlikely to significantly increase production, while unrest in Libya adds to supply concerns.
Higher oil prices add to already complicated economic situation on supporting high inflation, but fears that strong tightening of the monetary policies by the major central banks would lead to economic slowdown and subsequently towards recession, keeps lid on oil prices.
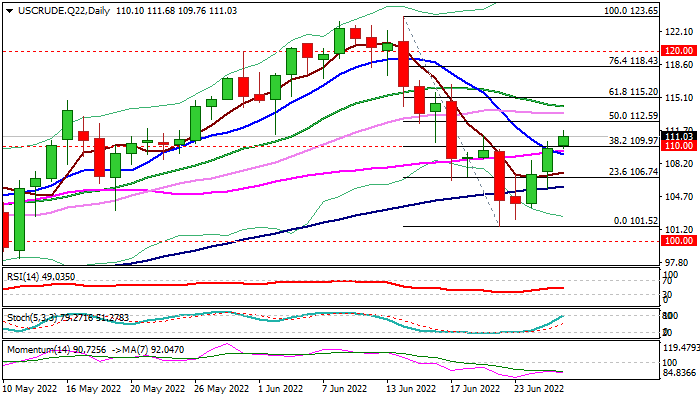
Fresh extension higher on Tuesday broke above important $110 barrier (psychological / Fibo 38.2% of $123.65/$101.52 fall) with sustained break higher to add to revived near-term bullish bias, but caution is required as rising negative momentum on daily chart and overbought stochastic, warn of recovery stall.
Bulls eye next pivotal barriers at $111.91 (Fibo 61.8%) and $112.59 (daily Kijun-sen), violation of which would improve near-term structure and allow for further recovery, but risk that these levels would cap current recovery, should be also considered.
Res: 111.91; 112.59; 113.46; 114.22
Sup: 110.00; 109.03; 108.28; 107.06