Sample Category Title
USD/CAD Daily Outlook
Daily Pivots: (S1) 1.2854; (P) 1.2885; (R1) 1.2906; More...
Break of 1.2859 minor support suggest that deeper correction is underway in USD/CAD. Intraday bias is back on the downside for 55 day EMA (now at 1.2789. Sustained break there will target 1.2516 support next. On the upside, break of 1.3077 and sustained trading above 1.3022 fibonacci level will carry larger bullish implications, and bring up trend resumption.
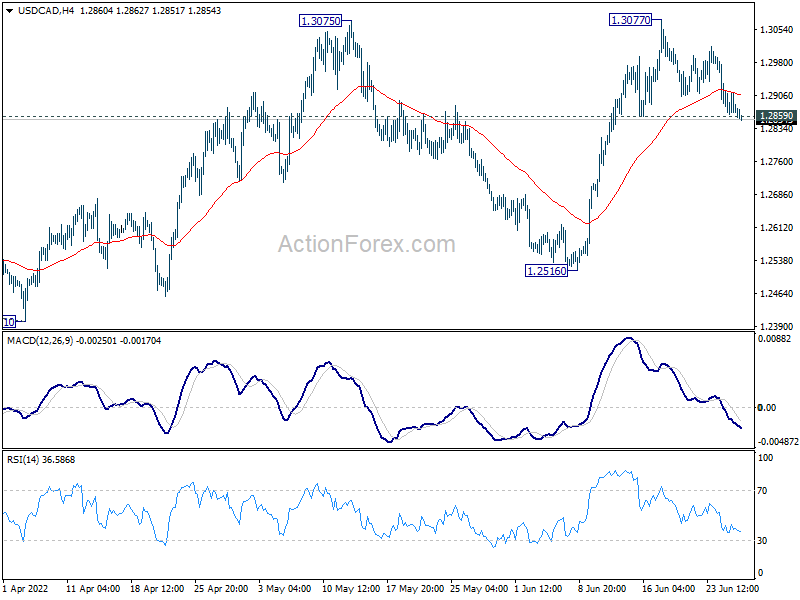
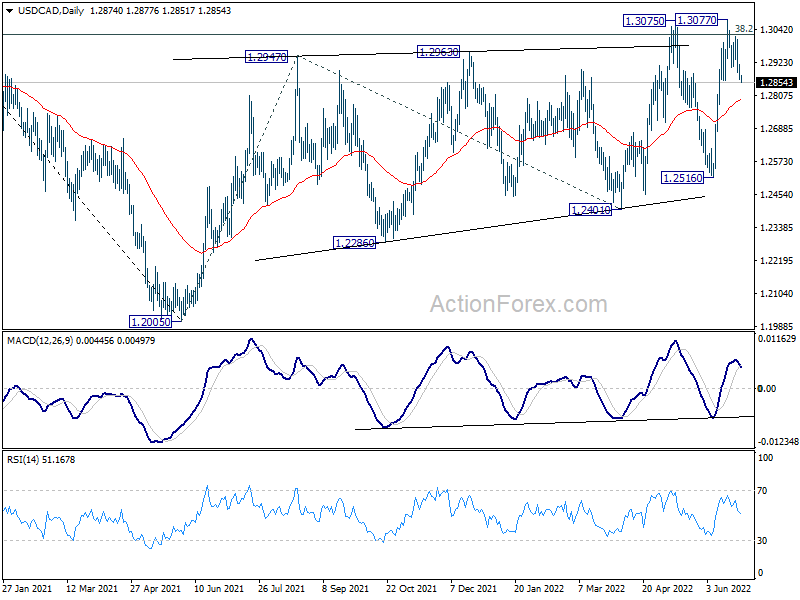
In the bigger picture, focus stays on 38.2% retracement of 1.4667 (2020 high) to 1.2005 (2021 low) at 1.3022. Sustained break there should confirm that the down trend from 1.4667 has completed after defending 1.2061 long term cluster support. Further rise would then be seen towards 61.8% retracement at 1.3650. However, rejection by 1.3022 will maintain medium term bearishness.
CAD Firmer in Subdued Trading, EUR Looks into ECB Forum
Canadian Dollar and Swiss Franc continue to be the stronger ones in subdued trading. Euro and Dollar and trailing for now. On the other hand, Aussie and Kiwi are still the underperformer, despite recovery attempt in Asian session. Stock markets are also sluggish while gold and oil are range bound. Focuses will turn to ECB forum today, with attention particularly on Chief Economist Philip Lane's session.
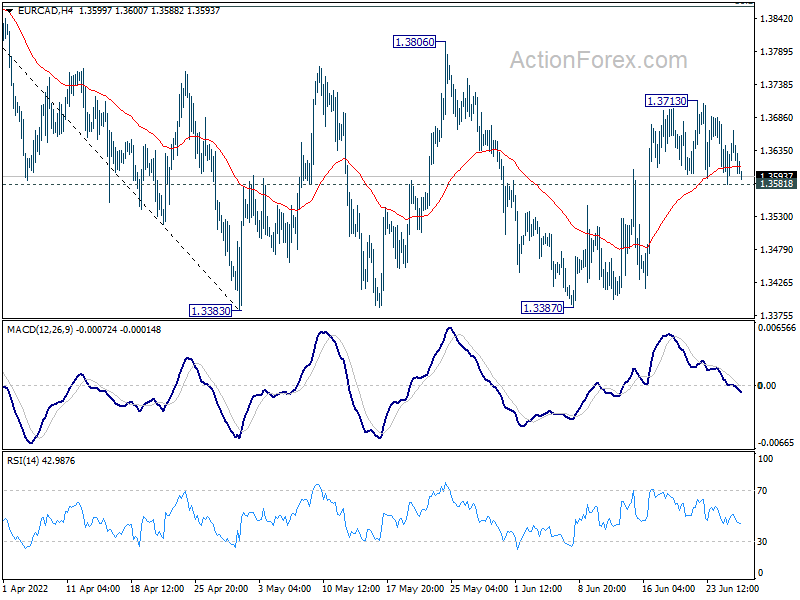
Technically, USD/CAD's breach of 1.2859 minor support now argues that it's at least in a deeper correction to rise from 1.2516. To gauge CAD's strength, eyes will also be on whether EUR/CAD would break through 1.3518 minor support, and head back towards 1.3383/3387 support zone.
In Asia, at the time of writing, Nikkei is up 0.34%. Hong Kong HSI is down -0.33%. China Shanghai SSE is up 0.31%. Singapore Strait Times is down -0.23%. Japan 10-year JGB yield is down -0.0018 at 0.236. Overnight, DOW dropped -0.20%. S&P 500 dropped -0.30%. NASDAQ dropped -0.72%. 10-year yield rose 0.0069 to 3.194.
GBP/CHF in downside acceleration as SNB halted intervention
Swiss Franc is trading as the strongest one for the month so far. It was boosted by SNB's surprised 50bps rate hike earlier. Also, latest data showed that total level of the central bank's sight deposits fell by CHF -3.37B to CHF 748.46B last week, the biggest drop since early 2012. That's seen as a sign that SNB had halted interventions in stopping Franc's appreciation.
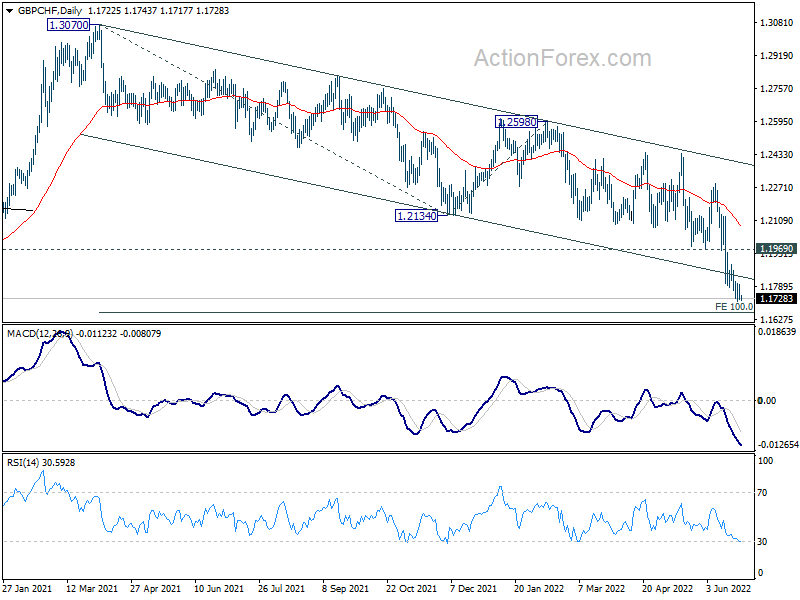
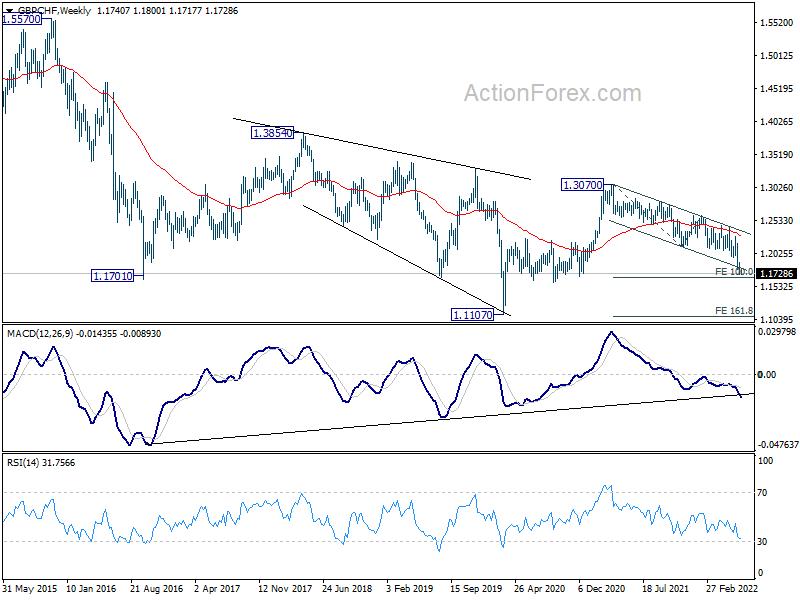
GBP/CHF extended the down trend from 1.3070 and hit as low as 1.1716 so far. The break of the near term channel support is a sign of downside acceleration. But the biggest test lies in 100% projection of 1.3070 to 1.2134 from 1.2598 at 1.1662. Sustained break there could prompt even steeper selloff towards 1.1107 (2020 low). In any case, risk will stay heavily on the downside as long as 1.1969 support turned resistance holds.
Bitcoin lacks momentum for rebound, 20k still vulnerable
While bitcoin stabilized after the selloff earlier this month, there is little momentum for a sustainable recovery. 20k handle is still looking vulnerable. The massive selling by miners are not giving bitcoin much help.
According to a Reuters report, the number of coins miners are sending to crypto exchanges has been steadily climbing since June 7. MacroHive's researchers noted that "miners have been increasingly liquidating their coins on exchanges." Also, according to Arcane Research, several publicly listed bitcoin miners collectively sold more than 100% of their entire output in May.
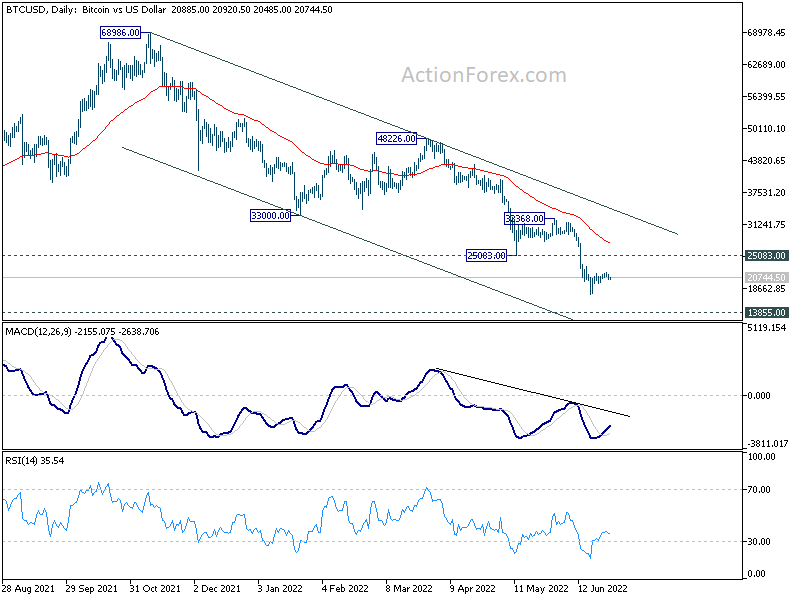
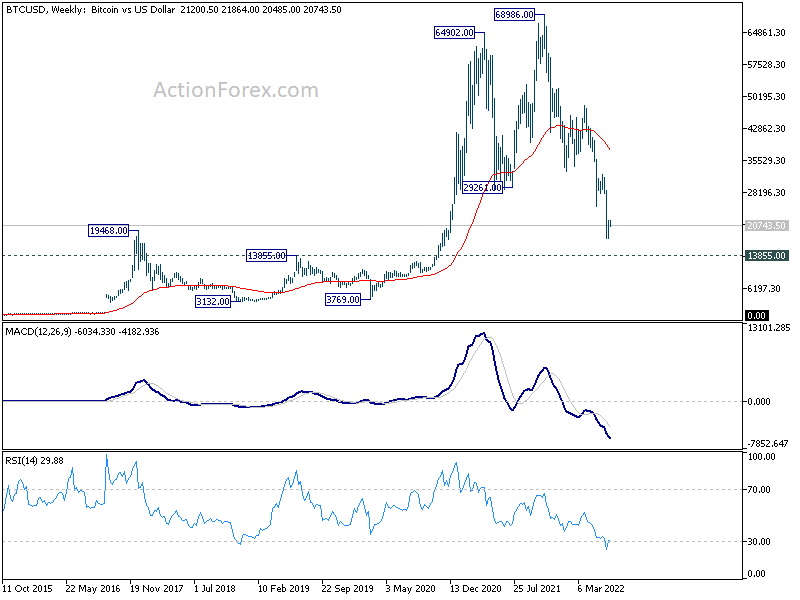
At this point, outlook in bitcoin will remain bearish as long as 25083 support turned resistance holds. Current medium term down trend could target 13855 long term support (2019 high), before forming a realistic bottom.
Looking ahead
Germany Gfk consumer confidence will be released in European session. Later in the day, US will release goods trade balance, house price index and consumer confidence.
USD/CAD Daily Outlook
Daily Pivots: (S1) 1.2854; (P) 1.2885; (R1) 1.2906; More...
Break of 1.2859 minor support suggest that deeper correction is underway in USD/CAD. Intraday bias is back on the downside for 55 day EMA (now at 1.2789. Sustained break there will target 1.2516 support next. On the upside, break of 1.3077 and sustained trading above 1.3022 fibonacci level will carry larger bullish implications, and bring up trend resumption.
In the bigger picture, focus stays on 38.2% retracement of 1.4667 (2020 high) to 1.2005 (2021 low) at 1.3022. Sustained break there should confirm that the down trend from 1.4667 has completed after defending 1.2061 long term cluster support. Further rise would then be seen towards 61.8% retracement at 1.3650. However, rejection by 1.3022 will maintain medium term bearishness.
Economic Indicators Update
| GMT | Ccy | Events | Actual | Forecast | Previous | Revised |
|---|---|---|---|---|---|---|
| 06:00 | EUR | Germany Gfk Consumer Confidence Jul | -27.7 | -26.0 | ||
| 12:30 | USD | Goods Trade Balance (USD) May P | -101.7B | -106.7B | ||
| 12:30 | USD | Wholesale Inventories May P | 2.20% | 2.20% | ||
| 13:00 | USD | S&P/Case-Shiller Home Price Indices Y/Y Apr | 21.00% | 21.20% | ||
| 13:00 | USD | Housing Price Index M/M Apr | 1.00% | 1.50% | ||
| 14:00 | USD | Consumer Confidence Jun | 100.0 | 106.4 |
GBP/CHF in downside acceleration as SNB halted intervention
Swiss Franc is trading as the strongest one for the month so far. It was boosted by SNB's surprised 50bps rate hike earlier. Also, latest data showed that total level of the central bank's sight deposits fell by CHF -3.37B to CHF 748.46B last week, the biggest drop since early 2012. That's seen as a sign that SNB had halted interventions in stopping Franc's appreciation.
GBP/CHF extended the down trend from 1.3070 and hit as low as 1.1716 so far. The break of the near term channel support is a sign of downside acceleration. But the biggest test lies in 100% projection of 1.3070 to 1.2134 from 1.2598 at 1.1662. Sustained break there could prompt even steeper selloff towards 1.1107 (2020 low). In any case, risk will stay heavily on the downside as long as 1.1969 support turned resistance holds.
Bitcoin lacks momentum for rebound, 20k still vulnerable
While bitcoin stabilized after the selloff earlier this month, there is little momentum for a sustainable recovery. 20k handle is still looking vulnerable. The massive selling by miners are not giving bitcoin much help.
According to a Reuters report, the number of coins miners are sending to crypto exchanges has been steadily climbing since June 7. MacroHive's researchers noted that "miners have been increasingly liquidating their coins on exchanges." Also, according to Arcane Research, several publicly listed bitcoin miners collectively sold more than 100% of their entire output in May.
At this point, outlook in bitcoin will remain bearish as long as 25083 support turned resistance holds. Current medium term down trend could target 13855 long term support (2019 high), before forming a realistic bottom.
Maxed Out
Markets stewed in their own juices overnight leaving equities and currencies and precious metals trading in noisy ranges, but ultimately finishing not too far from where they started. The big mover overnight was oil, which had another impressive rally, this time helped along by a Reuters story where France’s President Macron was overheard telling US President Macron at the G7 meeting, that a call to the UAE had informed him that both they and Saudi Arabia were maxed out on production capacity.
That is probably the last thing the world needs to hear right now, given that Saudi Arabia and the UAE are regarded as the world’s two available swing producers at the moment. The UAE released an official response stating that they were indeed near-maximum capacity, although this was crouched as within the context of its allowable OPEC+ quota. If true, President Biden’s upcoming cap-in-hand trip to Saudi Arabia may have lost one of its raisons d'etre.
The pain doesn’t stop there for energy markets. Along with reduced Russian gas flows to Europe, Libya also announced it may declare a force majeure on over half of its daily production shortly. Ecuador said over the weekend that it may cease production entirely due to domestic cost-of-living protests, something we’re going to see a lot more of frontier/emerging markets this year sadly. By my rough calculations, Ecuador and Libya will add up to around 1.1 million barrels per day. Not a deal-breaker normally, but much more so in these abnormal times. The reality that energy price inflation isn’t going anywhere anytime soon may partially explain the modest retreat by equities in the last 24 hours.
US data was mixed overnight. US Durable Goods surprised to the upside, rising by 0.70% MoM in May, well above the 0.10% rise forecast. Even the numbers ex-defence and transport (read Boeing), exceeded forecasts easily. In contrast, US Pending Home Sales came in worse at -13.60% YoY for May, while the June Dallas Fed Manufacturing Index slumped to -17.70. With US and German yields also rising overnight, the rally in oil prices, and the Durable Goods, in particular, forced the FOMO gnomes of Wall Street to reassess the lower terminal Fed Funds excuse to buy equities.
We could still see the equity bounce continue, though. Markets are in a schizophrenic frame of mind day-to-day, but underlyingly, are still desperately keen to buy this medium-term dip. Additionally, it is the month and quarter-end this week, and that will prompt no small amount of portfolio rebalancing by institutional investors globally. We should expect the back-and-forth chop-fest to continue this week in the equity space, and possibly, the currency space.
In Asia today, the calendar is as empty as I have seen it for a while. Japan’s 2-year JGB auction and Malaysian PPI are unlikely to move the needle. ECB President Lagarde and Chief Economist Lane both speak this afternoon, and we can expect their comments to be dissected for clues on both monetary policy direction and their anti-fragmentation tool to manage bond spreads between members. Fed Chairman Jerome Powell also speaks tomorrow at an ECB event, along with Ms Lagarde, which could up the ante on mid-week volatility.
In the US, most attention is likely to be on Wholesale Inventories and the Case-Shiller House Price Indexes. Markets are becoming nervous that corporate America may end up with lots of inventory they can’t sell, and the nerves around the US housing market are well known. Given the poor Dall Fed Manufacturing Index overnight, the Richmond Fed Manufacturing Index may garner more attention than usual as well, especially if it is week.
Overall, it looks like Asia will settle for a sideways session, with equities content to mirror Wall Streets' direction, and currencies, precious metals and cryptos staying comatose. A lack of data in Asia today leaves markets vulnerable to headline bombs on the news ticker.
Asian equities ease with Wall Street
A surprisingly robust US Durable Goods number prompted a few doubts around the lower terminal Fed Funds rate so buy equities strategy overnight. The soft US pending home sales and Dallas Fed manufacturing data may also have sparked recession isn’t good for equity's thoughts. With sentiment wavering, Wall Street lightened up some recent longs, sending the equity markets to a negative close. The S&P 500 eased 0.30% lower, the Nasdaq fell by 0.83%, and the Dow Jones fell by 0.20%. US futures are holding steady in Asia this morning.
Across Asia itself, markets appear content to follow Wall Street’s lead, as they have done recently, with markets locally moving lower in response, although not markedly so. Japan’s Nikkei 225 is unchanged, with South Korea’s Kospi down just 0.10%. In Mainland China, the Shanghai Composite and CSI 300 are 0.05% lower. In Hong Kong, the Nasdaq-following Hang Seng is down 0.75%, retracing some of yesterday’s rally.
In regional markets, Singapore is 0.20% lower, with Taipei slipping by 0.75%, reacting to an impending 8.40% increase in electricity prices announced yesterday. Kuala Lumpur is 0.10% lower, Jakarta had fallen by 0.60%, Bangkok is 0.15% lower, and Manila has eased just 0.10%.
Australian markets are bucking the trend by rising today. Although most sectors are lower, resources have rallied, perhaps on statements from Shanghai yesterday declaring victory over its latest Covid-19 outbreak. Less restrictive China equals they will buy more resources I suppose, until their next outbreak. The ASX 200 is 0.50% higher, while the All Ordinaries is 0.40% higher.
Europe has a mixed session overnight, modest gains with Scandinavian markets outperforming, Stockholm and Helsinki rising by over 3.0%. I am assuming that is because the leaders of Turkey, Sweden and Finland are meeting to thrash out their differences and open NATO membership for the latter two. With Asia in wait-and-see mode today and oil prices rising sharply overnight, Europe is probably going to start its session on the back foot. Month and quarter-end rebalancing flows will potentially distort the price action in both the US and Europe markets this afternoon and for the next couple of days.
US dollar mixed
A rise in US yields overnight boosted the USD/JPY slightly, but elsewhere, the greenback continued its modest retreat versus the G-20 space as currency markets showed very little reaction to the US data. The dollar index eased 0.17% lower to 103.95, where it remains in Asia. The charts do suggest the downward correction still has more to run, with a failure of 103.50 signalling a deeper correction. The dollar index has support at 1.0350 and 102.50, with resistance at 105.00 and 1.0570.
Elsewhere, currency markets are comatose in Asia, with both DM and Asian currencies almost unchanged from their overnight closes.
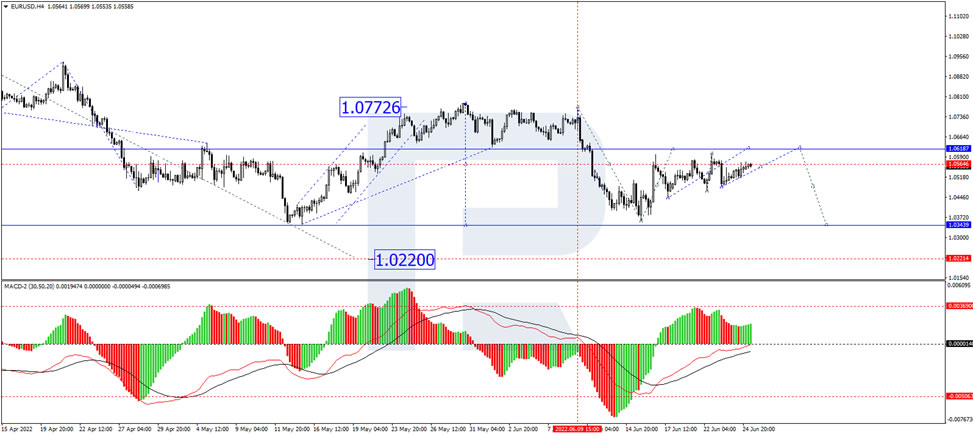
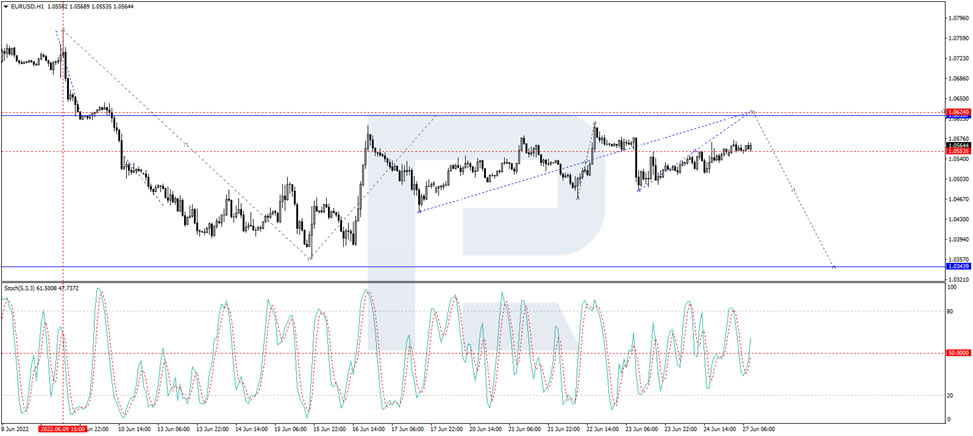
EUR/USD rose by 0.25% to 1.0580 overnight, where it remains in Asia. It continues showing resilience as the Russian natural gas exports to Europe situation deteriorates, but initial resistance at 1.0600 and 1.0650 remains challenging. Support is at 1.0450 and 1.0400. Sterling was unchanged at 1.2275 overnight once again, unmoved in Asia. GBP/USD has initial resistance at 1.2360 and 1.2400, with support at 1.2200, 1.2160, and then 1.1950.
USD/JPY edged 0.25% higher to 135.45 overnight as US yields moved slightly higher. It has fallen slightly to 135.30 in Asia. USD/JPY has support at 134.25 and 132.00, with resistance at 136.65 and 138.00. The short-term direction remains at the mercy of US yields, although a fall by the US 10-year through 3.0% could provoke an unwinding of USD/JPY longs.
Asian currencies continued to trade sideways overnight, mostly booking some small gains, but overall, remaining near recent lows versus the US Dollar. That suggests that the rise in investor sentiment in equity markets is yet to spill out into the broader EM complex. The Chinese Yuan has had zero reaction once again to another large liquidity injection by the PBOC this morning. Markets are clearly anticipating the PBOC draining all the liquidity via the repo next week after the quarter-end has passed. Reserves data suggests that Asian central banks have been busy selling US Dollars recently to smooth out currency volatility, but it looks like any consistent rally is going to need a big US Dollar move lower.
Oil prices rally on supply concerns
Oil prices rallied once again overnight, as the Reuters story outlined above over Saudi Arabia and UAE capacity constraints, as well as disruption of supplies from Libya and Ecuador, overrode US recession concerns. Another lesson is that markets ignore crude futures backwardation at their peril when trying to pick a top in oil prices. Brents's backwardation actually widened during the sell-off early last week.
Brent crude rose by 2.60% to $115.40 overnight, gaining another 0.90% to $116.300 a barrel in Asia today. WTI rose by 2.30% to $110.00 overnight, rallying another 0.80% higher to $110.70 a barrel in Asia. The rhetoric around declaring victory in Shanghai over omicron seems to be prompting Asian traders to continue buying this morning.
Notably, Brent crude tested and held its rising longer-term support line, today at $108.00, in the early part of last week. Nor was its 100-day moving average (DMA) tested either. That is a technical development that should be respected. Brent crude has support at 111.35, its 100-DMA at $109.40, and the six-month support line at $108.00. It is testing resistance here at $116.50, and a daily close above here would clear the way for a retest of $120.00 a barrel.
WTI’s technical picture has improved markedly overnight, regaining its rising 2022 support line, today at $107.50 a barrel and initial support. A close above $111.25 this evening clears the way for a larger rally to $116.00 a barrel.
Gold fades overnight
Gold attempted to rally overnight as the G-7 announced a ban on Russian gold imports. That was a rubber stamp exercise though, and although gold climbed intraday, it faded ahead of $1840.00 an ounce. It then proceeded to give back all those gains, finishing 0.25% lower at $1823.00 an ounce. Although US yields rose slightly, the US Dollar was generally slightly weaker overnight, making the price action by gold even more disappointing. It appears that the downside is increasingly gold’s path of least resistance.
Gold has resistance at $1840.00, $1860.00, and $1880.00, the latter appearing an insurmountable obstacle for now. Support is at $1805.00 and then $1780.00 an ounce. Failure of the latter sets in motion a much deeper correction, potentially reaching $1700.00 an ounce. On the topside, I would need to see a couple of daily closes above $1900.00 to get excited about a reinvigorated rally.
Technical Outlook and Review
DXY:
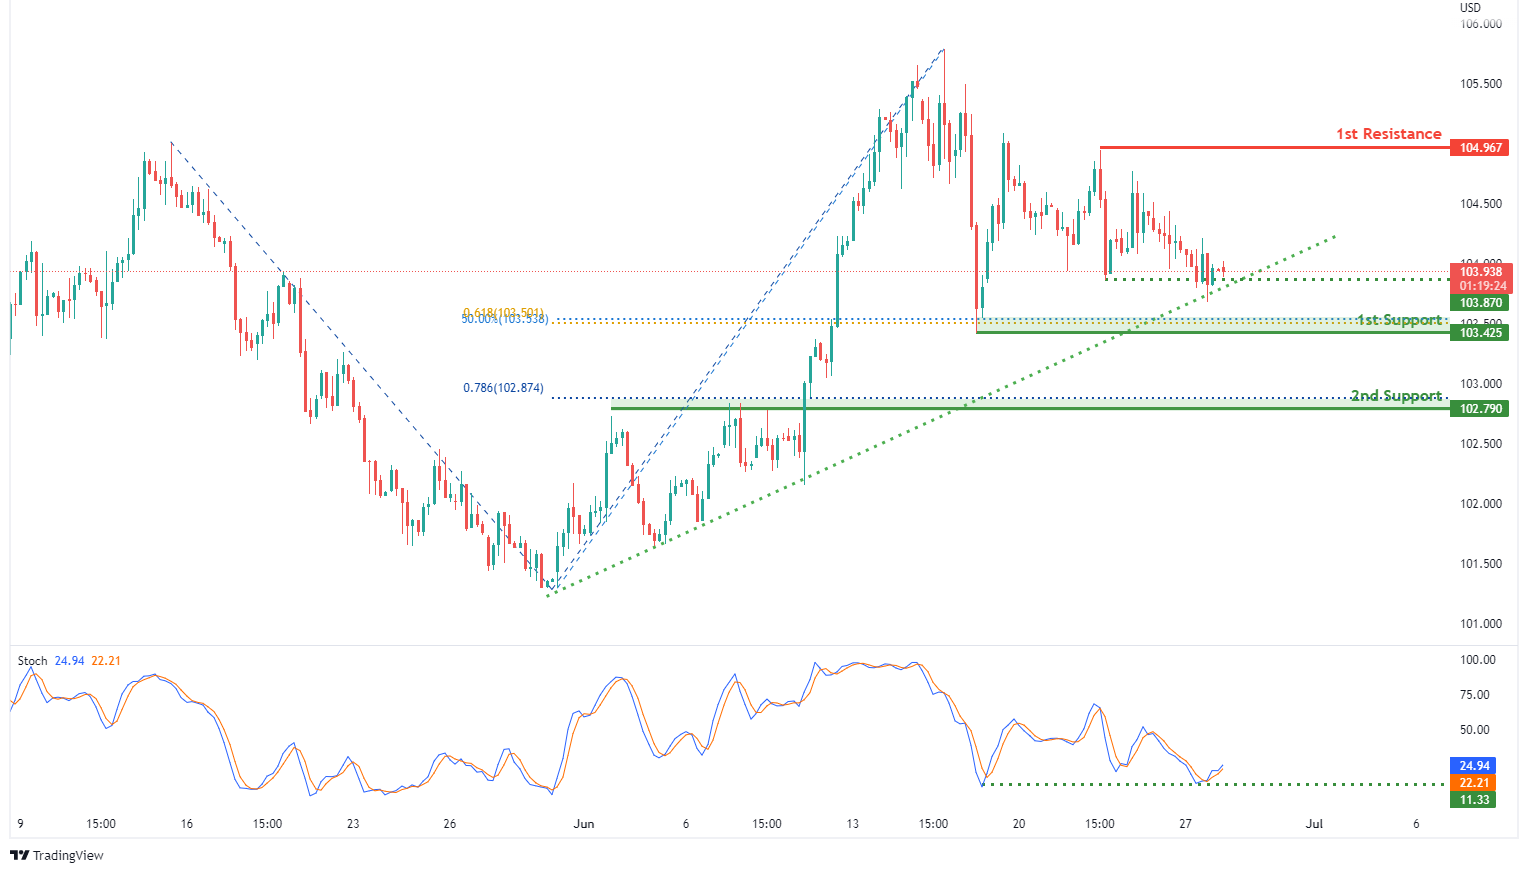
On the H4, with prices expected to bounce off stochastic support and prices moving along the ascending trendline, we have a bullish bias that bullish momentum will carry prices from our 1st support at 103.425 where the 61.8% fibonacci projection, 50% fibonacci retracement and swing low support are, after price has dropped to the 1st support level, to our 1st resistance at 104.967 in line with the horizontal swing high resistance. Take note of intermediate support at 103.425 where the swing low support is. Alternatively, price may break 1st support structure and head for 2nd support at 102.790 where the horizontal overlap support and 78.6% fibonacci projection are.
Areas of consideration:
- H4 time frame, 1st resistance at 104.967
- H4 time frame, 1st support at 103.425
XAU/USD (GOLD):
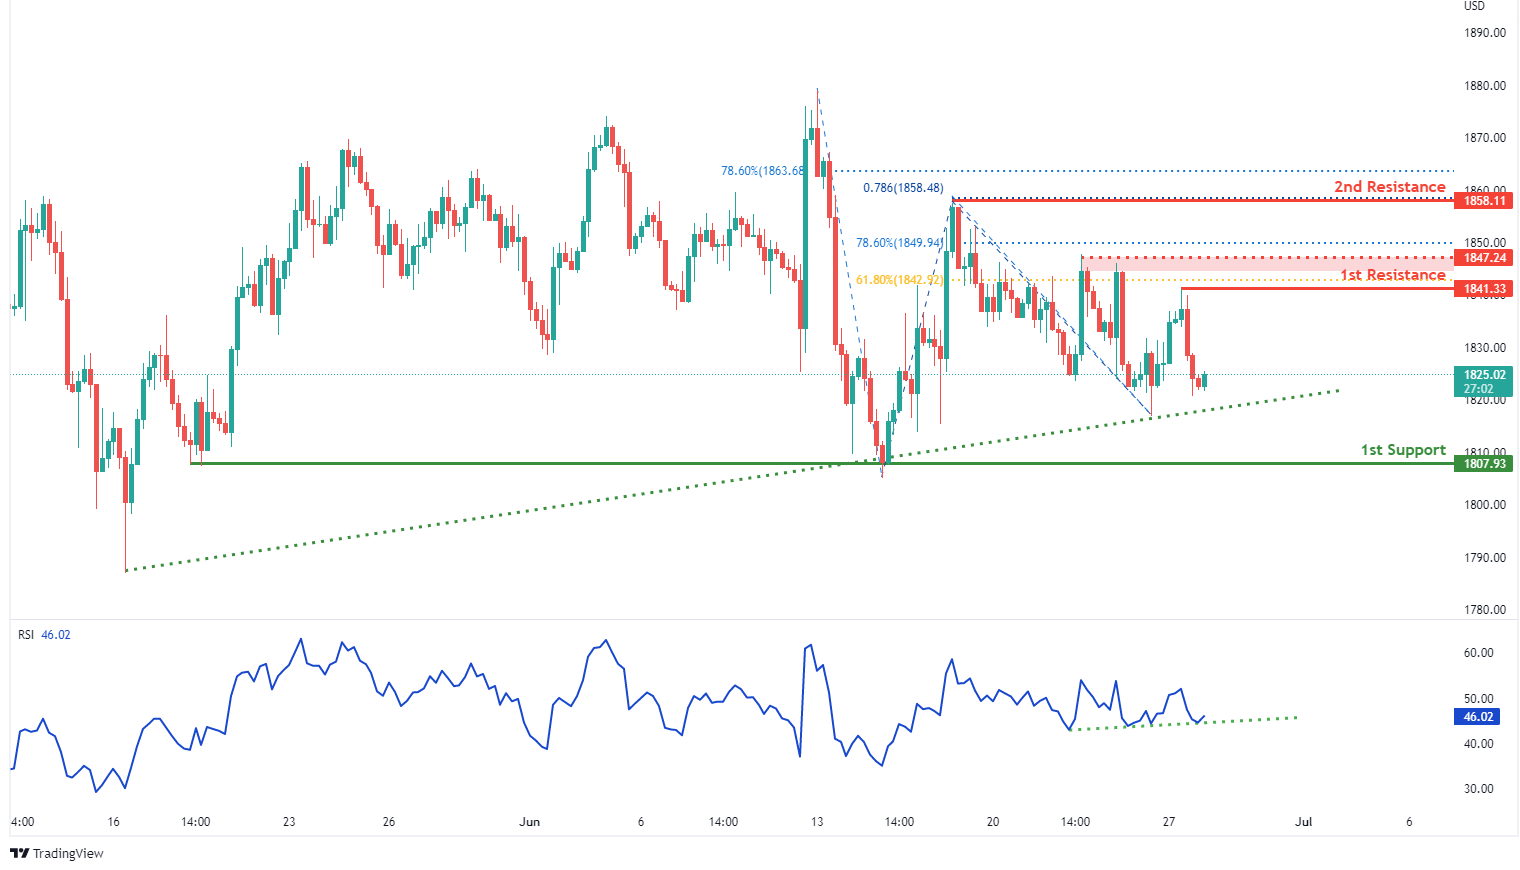
On the H4, with RSI moving in a bullish momentum and along an ascending trendline, we have a bullish bias that prices will rise from to our 1st resistance at 1841.33 where the horizontal swing high resistance and 61.8% fibonacci retracement. Once we have upside confirmation, we would expect bullish momentum to carry price to intermediate resistance level at 1847.24 in line with swing high resistance and 78.6% fibonacci retracement. Should price break through intermediate resistance, we would have a bullish bias that price will rise to 2nd resistance at 1858.11 in line with swing high resistance, 78.6% fibonacci projection and 78.6% fibonacci retracement. Alternatively, price could drop to our 1st support at 1807.93 in line with swing low support.
Areas of consideration:
- H4 time frame, 1st Resistance at 1841.33
- H4 time frame, 1st Support at 1807.93
GBP/USD:
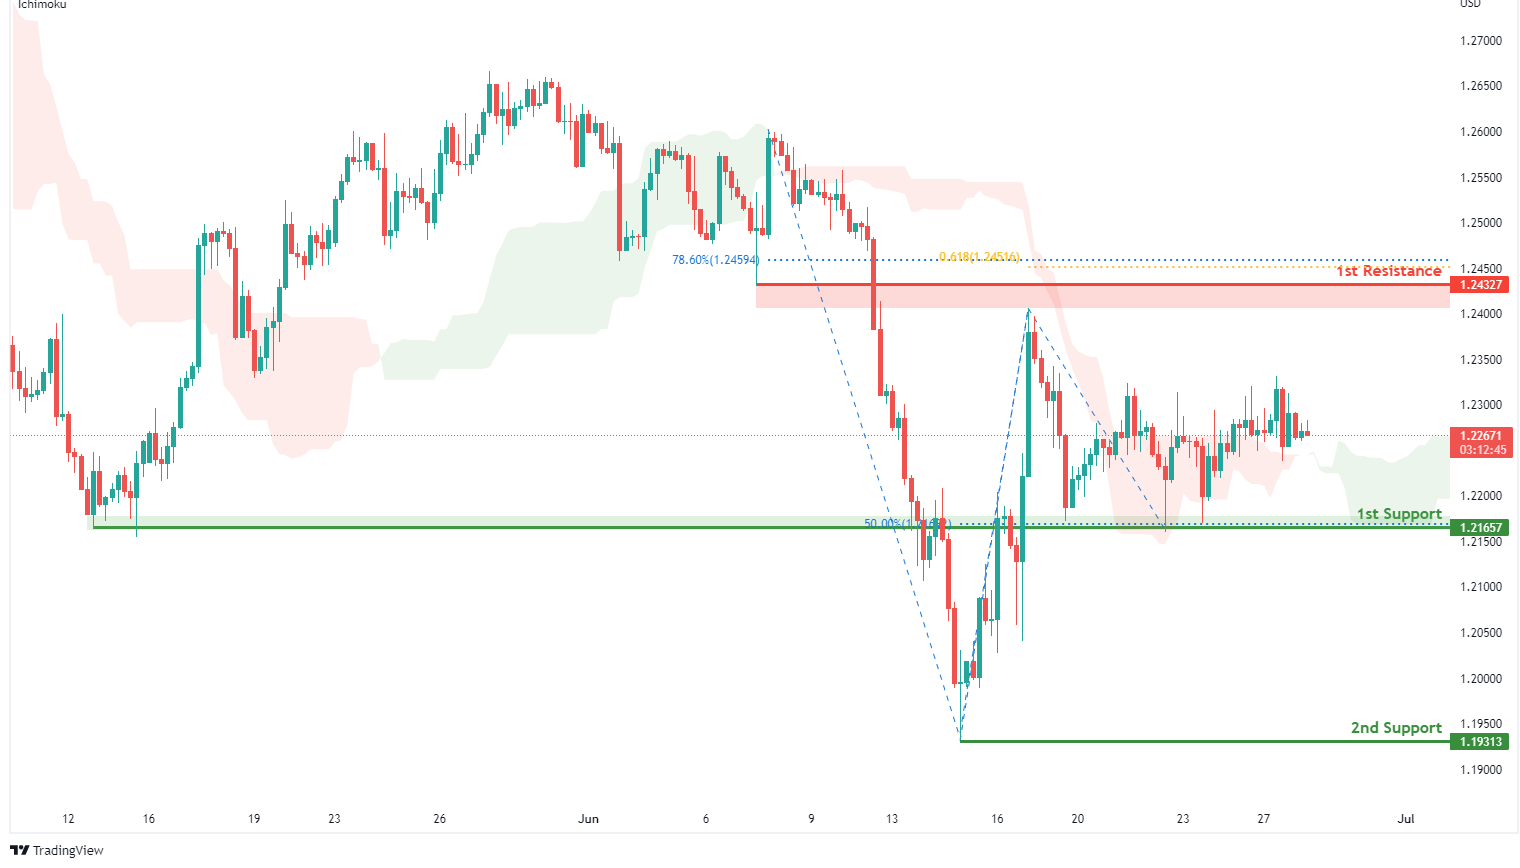
On the H4, with prices moving above the ichimoku indicator, we have a bullish bias that price will rise from our 1st support at 1.21657 where the horizontal overlap support and 50% fibonacci retracement are to our 1st resistance at 1.24327 in line with the 61.8% fibonacci projection, 78.6% fibonacci retracement and pullback resistance. Alternatively, price may break 1st support structure and head for 2nd support at 1.19313 where the horizontal swing low support is.
Areas of consideration:
- H4 1st resistance at 1.24327
- H4 1st support at 1.21846
USD/CHF:
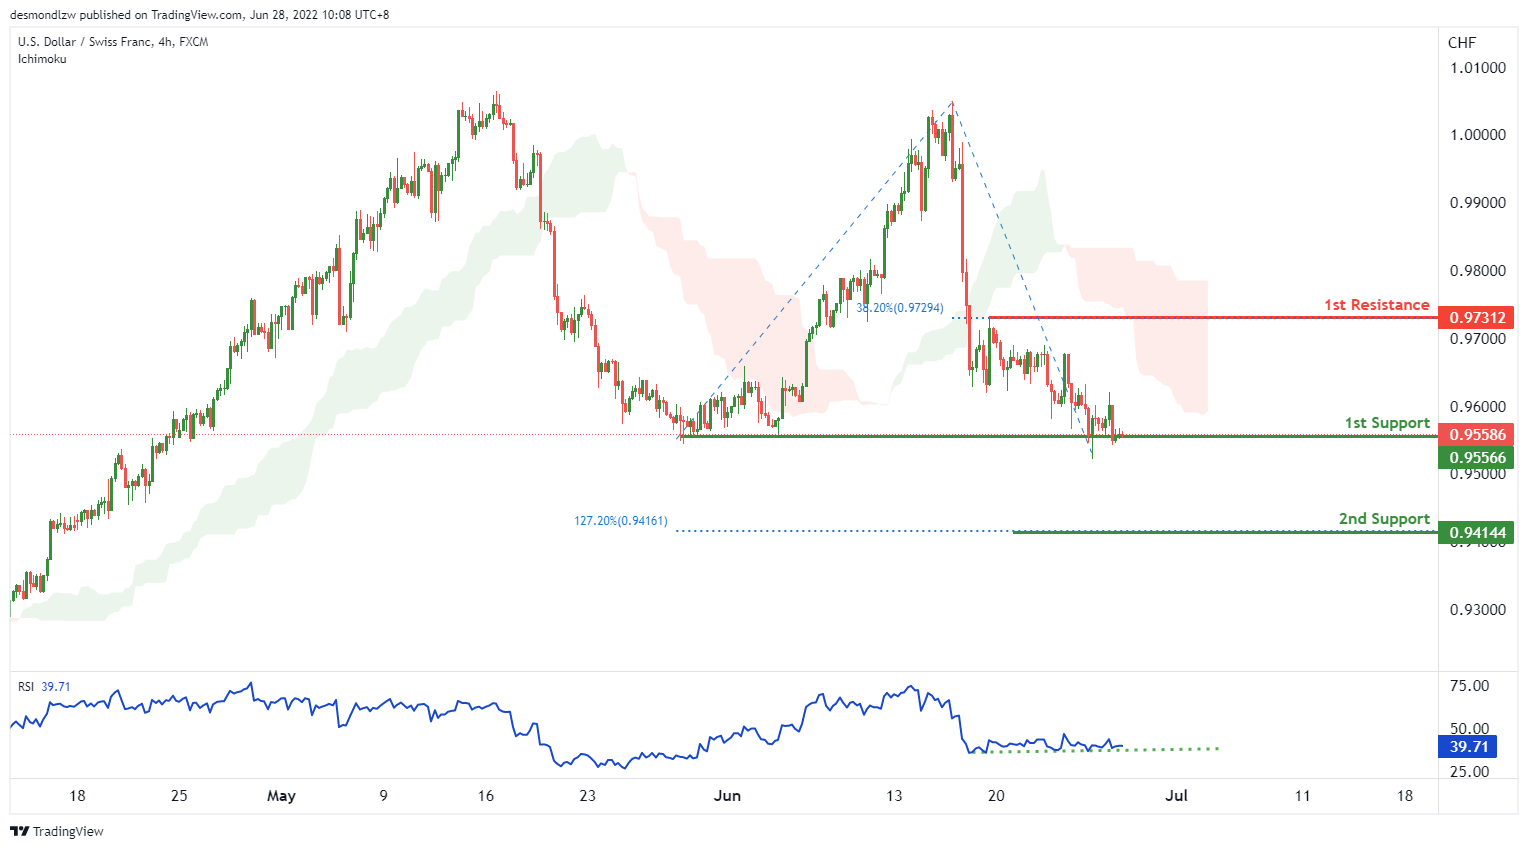
On the H4, with bullish divergence on the RSI, we have a bullish bias that price will rise from our 1st support at 0.95566 where the horizontal swing low support is to our 1st resistance at 0.97231 in line with the horizontal swing high resistance and 38.2% Fibonacci retracement. Alternatively, price may break structure and head for 2nd support where the 127.2% Fibonacci extension is.
Areas of consideration
- 1st support level at 0.95566
- 1st resistance level at 0.97231
EUR/USD :
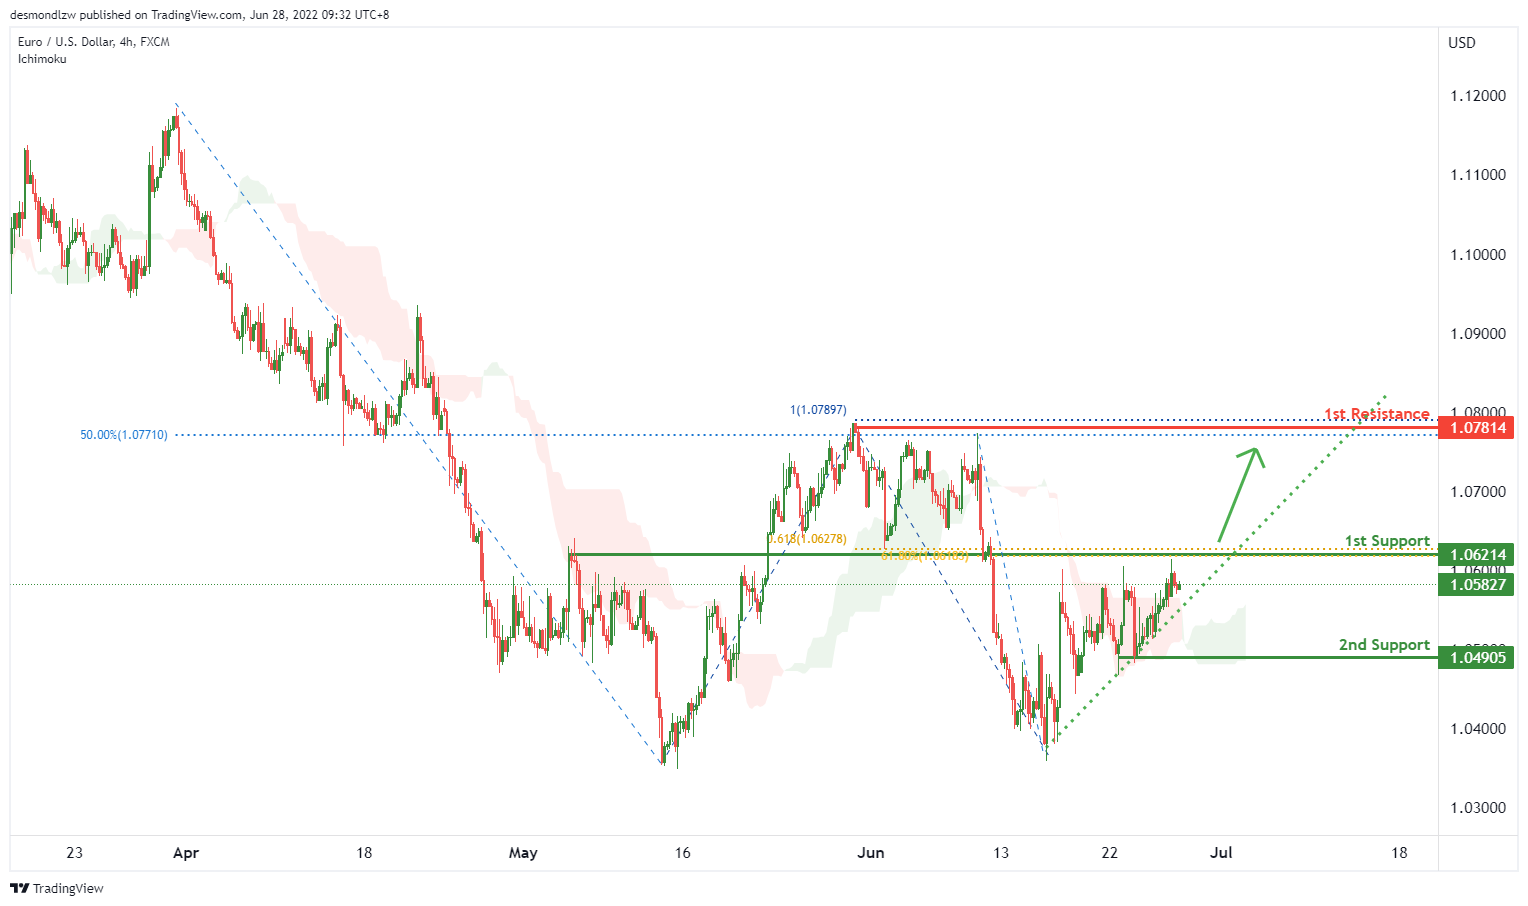
On the H4, with price moving in an ascending trendline and above the ichimoku cloud, if price breaks the 1st support at 1.06214, we have a bullish bias that price will continue to rise from the 1st support in line with the overlap support in line with two 61.8% fibonacci projections to the 1st resistance at 1.07814 at the swing high in line with the 100% fibonacci projection and 50% fibonacci retracement. Alternatively, price may drop from the 1st support to the 2nd support at 1.04905 at the swing low.
Areas of consideration :
- H4 1st resistance at 1.07814
- H4 1st support at 1.06214
USD/JPY:
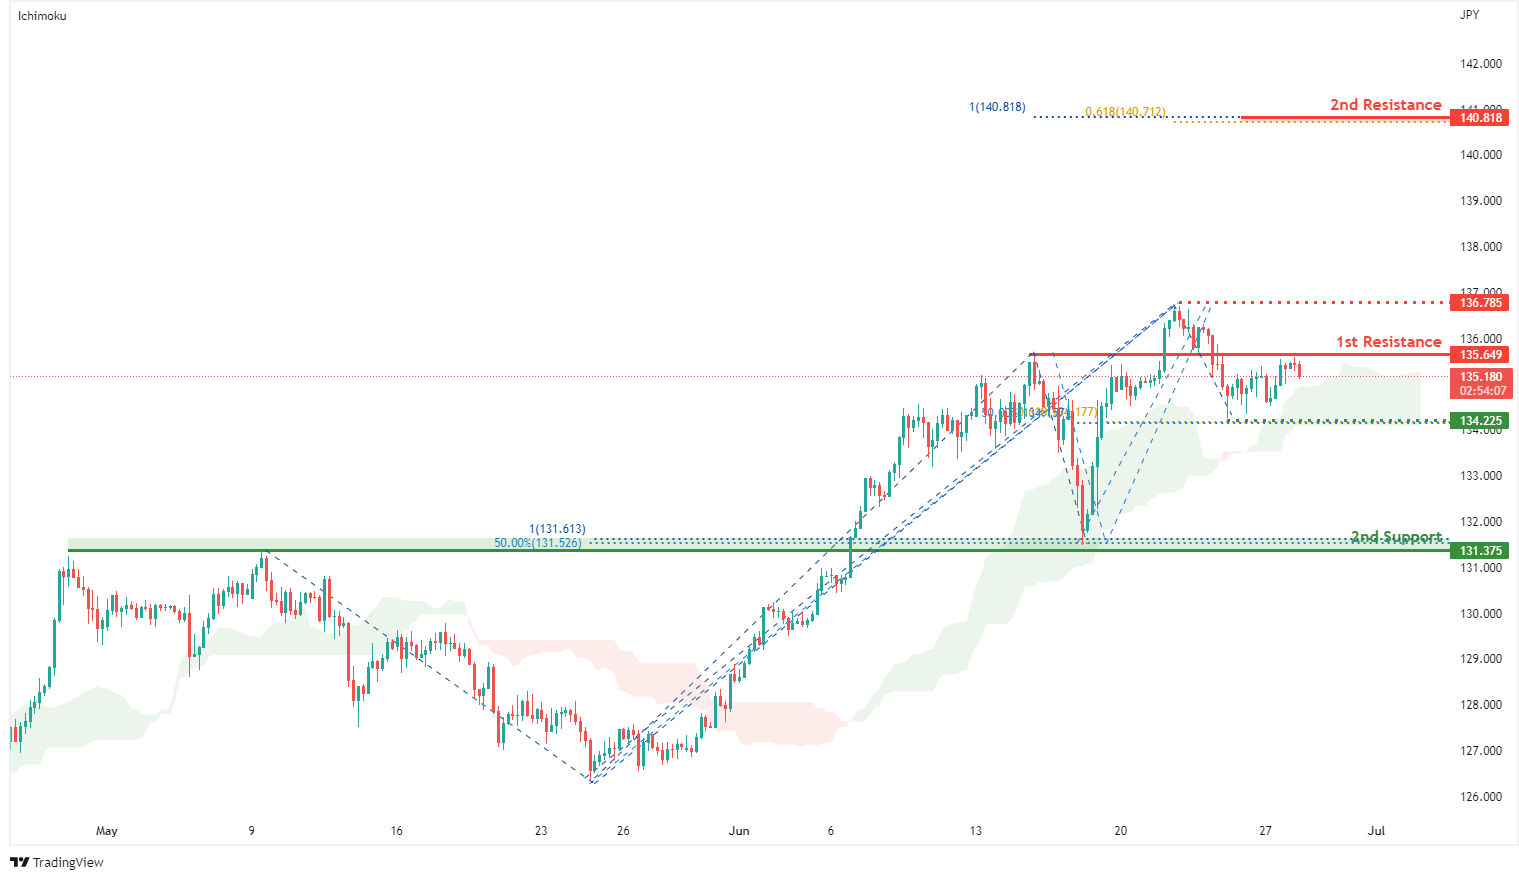
On the H4, with price moving above the ichimoku indicator, we have a bullish bias that price will rise to our 1st resistance at 135.649 where the pullback resistance is. Once there is upside confirmation, we would expect bullish momentum to carry price to our 2nd resistance at 140.818 where the 100% fibonacci projection and 61.8% fibonacci projection are .
Take note of the intermediate resistance level at 136.785 where the swing high resistance is. Alternatively, price may drop to 1st support at 131.540 in line with the swing low support, 100% fibonacci projection and 50% fibonacci retracement. Take note of the intermediate support at 134.225 in line with 50% fibonacci retracement and 61.8% fibonacci projection.
Areas of consideration:
- H4 time frame, 1st resistance at 135.649
- H4 time frame, 1st support at 131.540
AUD/USD:
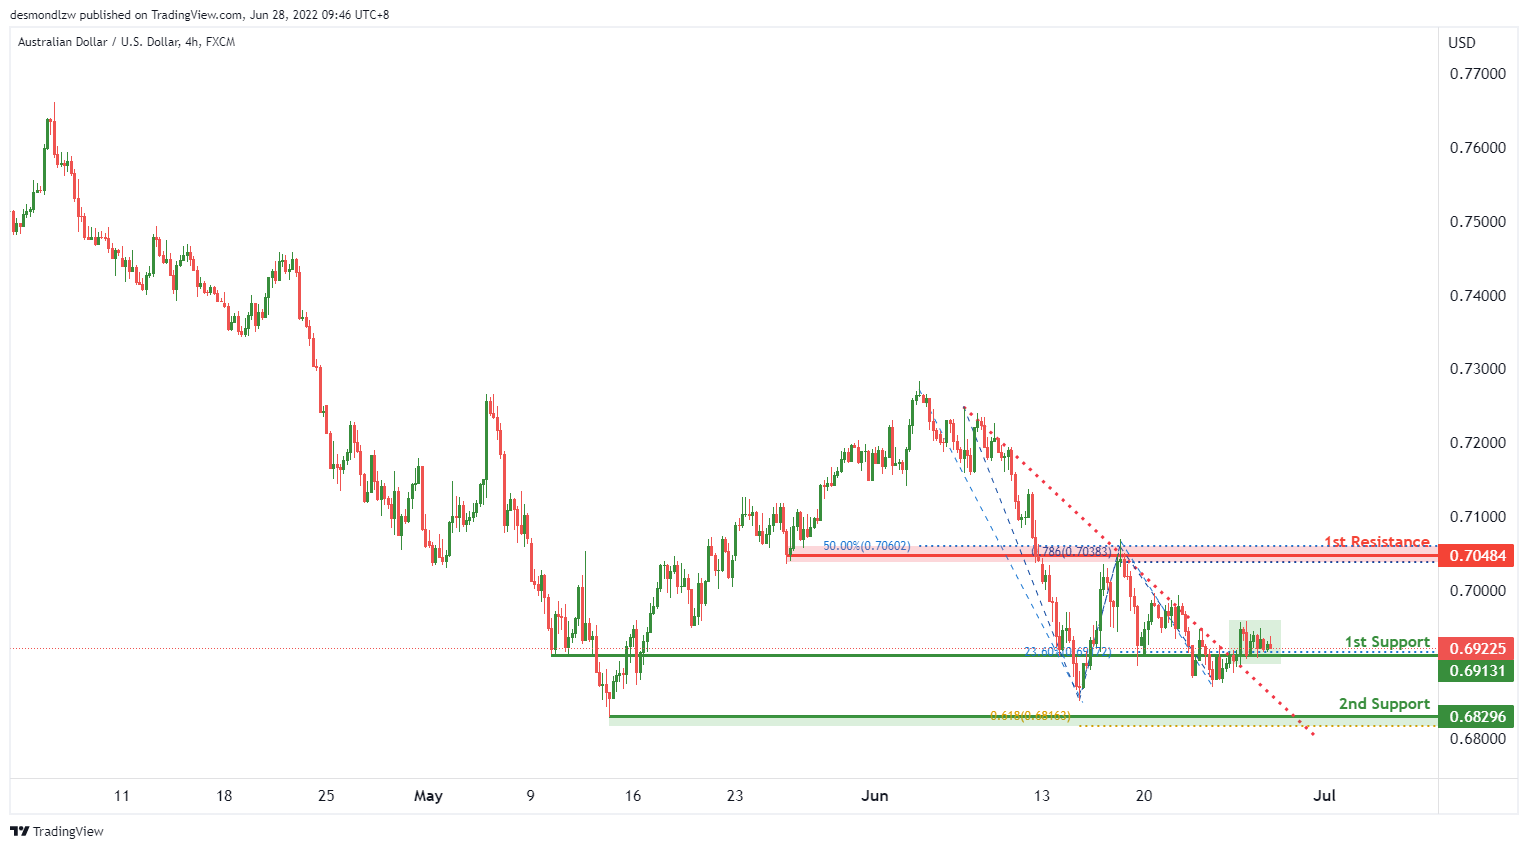
On the H4, with price breaking the descending trendline, we have a bullish bias that price will continue to rise from the 1st support at 0.69301 at the pullback support in line with the 23.6% fibonacci retracement to the 1st resistance at 0.70484 in line with the overlap resistance, 78.6% Fibonacci projection and 50% Fibonacci retracement. Alternatively, price may reverse off the 1st support and drop to the 2nd support at 0.68296 in line with the horizontal swing low and 61.8% Fibonacci projection.
Areas of consideration
- H4 1st resistance at 0.69846
- H4 1st support at 0.68323
NZD/USD:
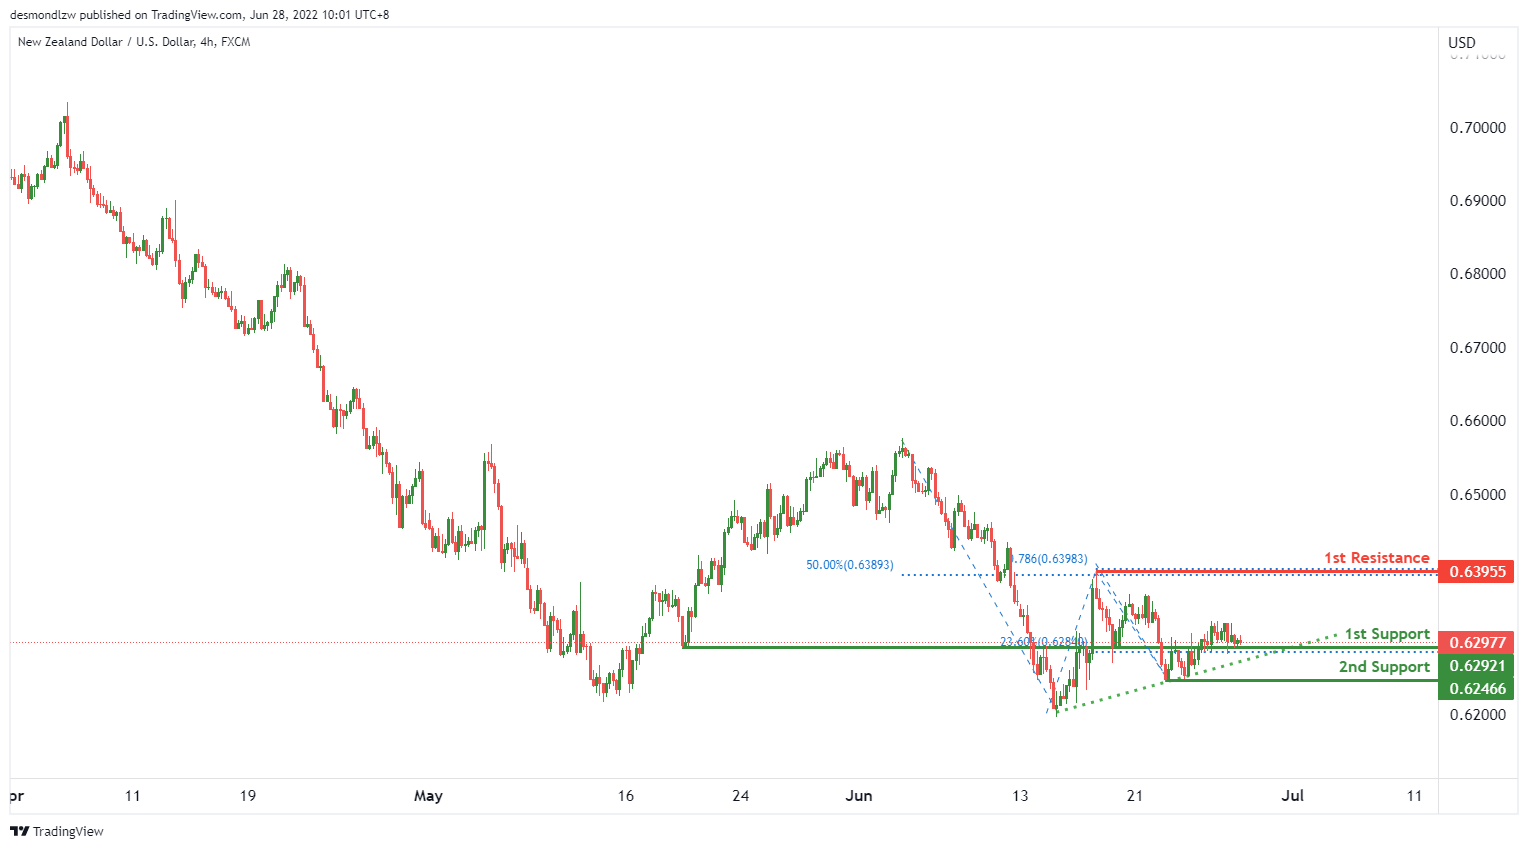
On the H4, with price moving in an ascending trendline, we have a bullish bias that price will continue to rise from the 1st support at 0.62921 in line with the pullback support and 23.6% fibonacci retracement to the 1st resistance at 0.63955 in line with the swing high and 50% fibonacci retracement and 78.6% fiboancci projection. Alternatively, price may reverse off the 1st support and drop to the 2nd support at 0.62466 at the swing low.
Areas of consideration:
- H4 time frame, 1st support at 0.62462
- H4 time frame, 1st resistance at 0.63955
USD/CAD:
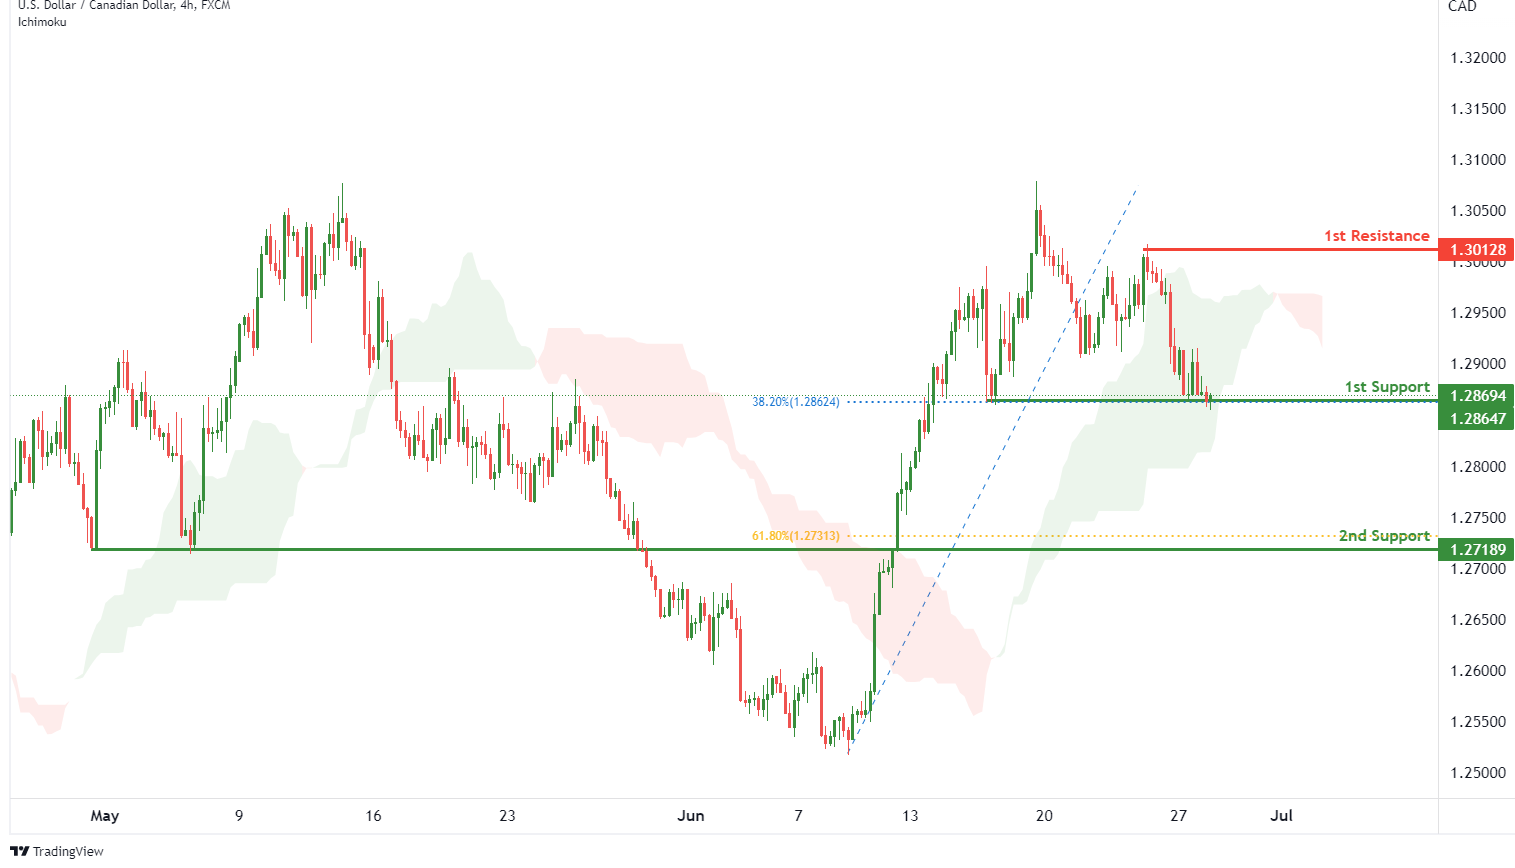
On the H4, with price expected to bounce off ichimoku support, we have a bullish bias that price will rise from our 1st support at 1.28647 where the horizontal swing low support and 38.2% Fibonacci retracement is to our 1st resistance at 1.30128 in line with the horizontal swing high resistance. Alternatively, price may break structure and head for 2nd support at 1.27189 where the horizontal pullback support and 61.8% Fibonacci retracement.
Areas of consideration:
- H4 time frame, 1st resistance at 1.30128
- H4 time frame, 1st support at 1.28647
OIL:
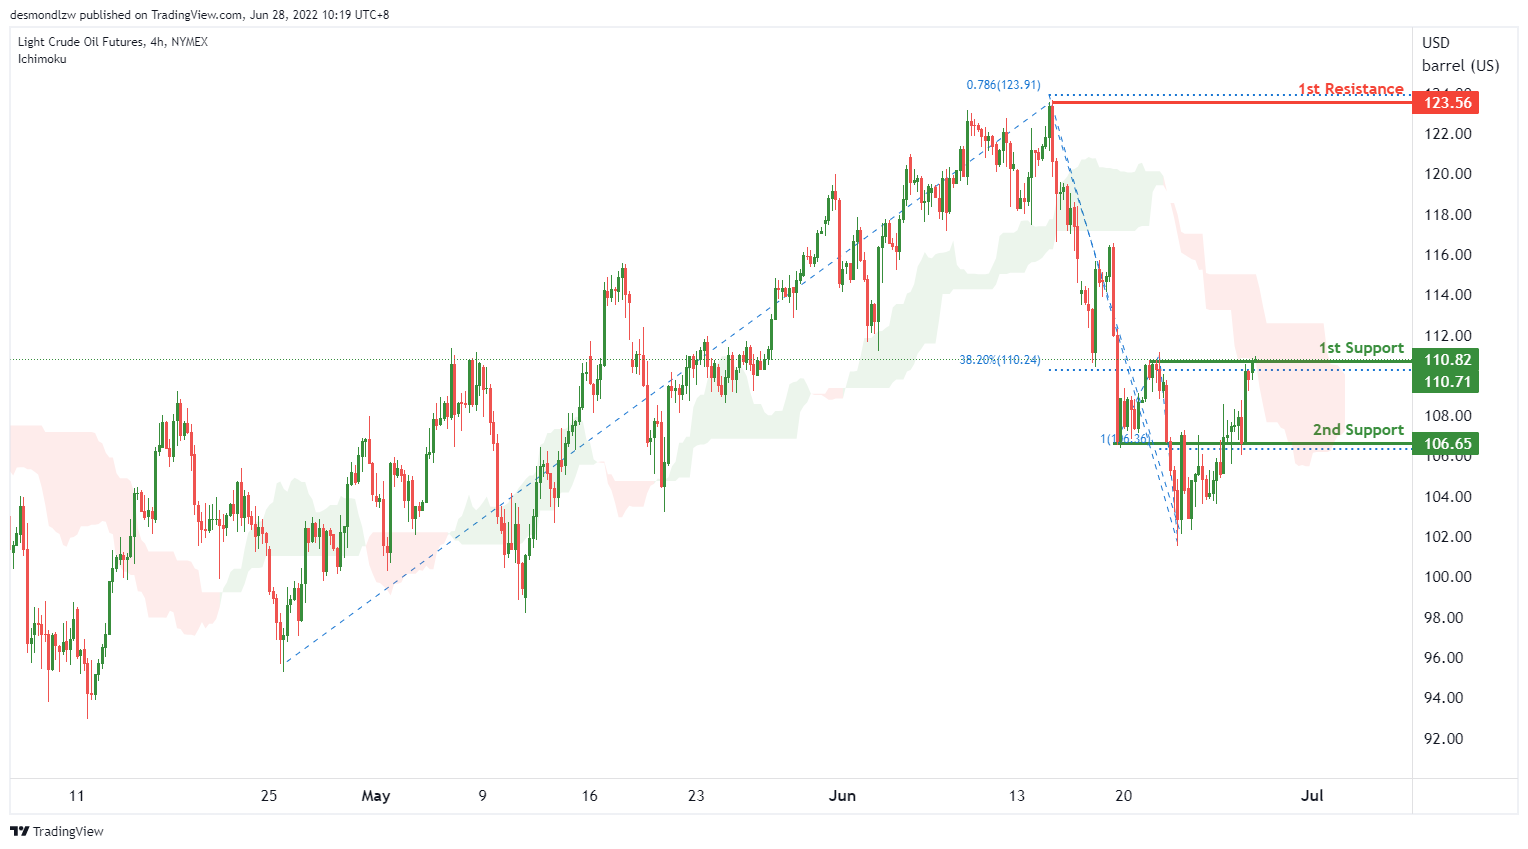
On the H4, with price bouncing off the ichimoku cloud, we have a bullish bias that price will continue to rise from the 1st support at 110.86 in line with the pullback support and 38.2% Fibonacci retracement to the 1st resistance at 123.56 at the horizontal swing high in line with the 78.6% Fibonacci projection. Alternatively, price may reverse off the 1st support and drop to the 2nd support at 106.65 in line with the pullback support and 100% Fibonacci projection.
Areas of consideration:
- H4 time frame, 1st resistance of 123.56
- H4 time frame, 1st support of 110.86
Dow Jones Industrial Average:
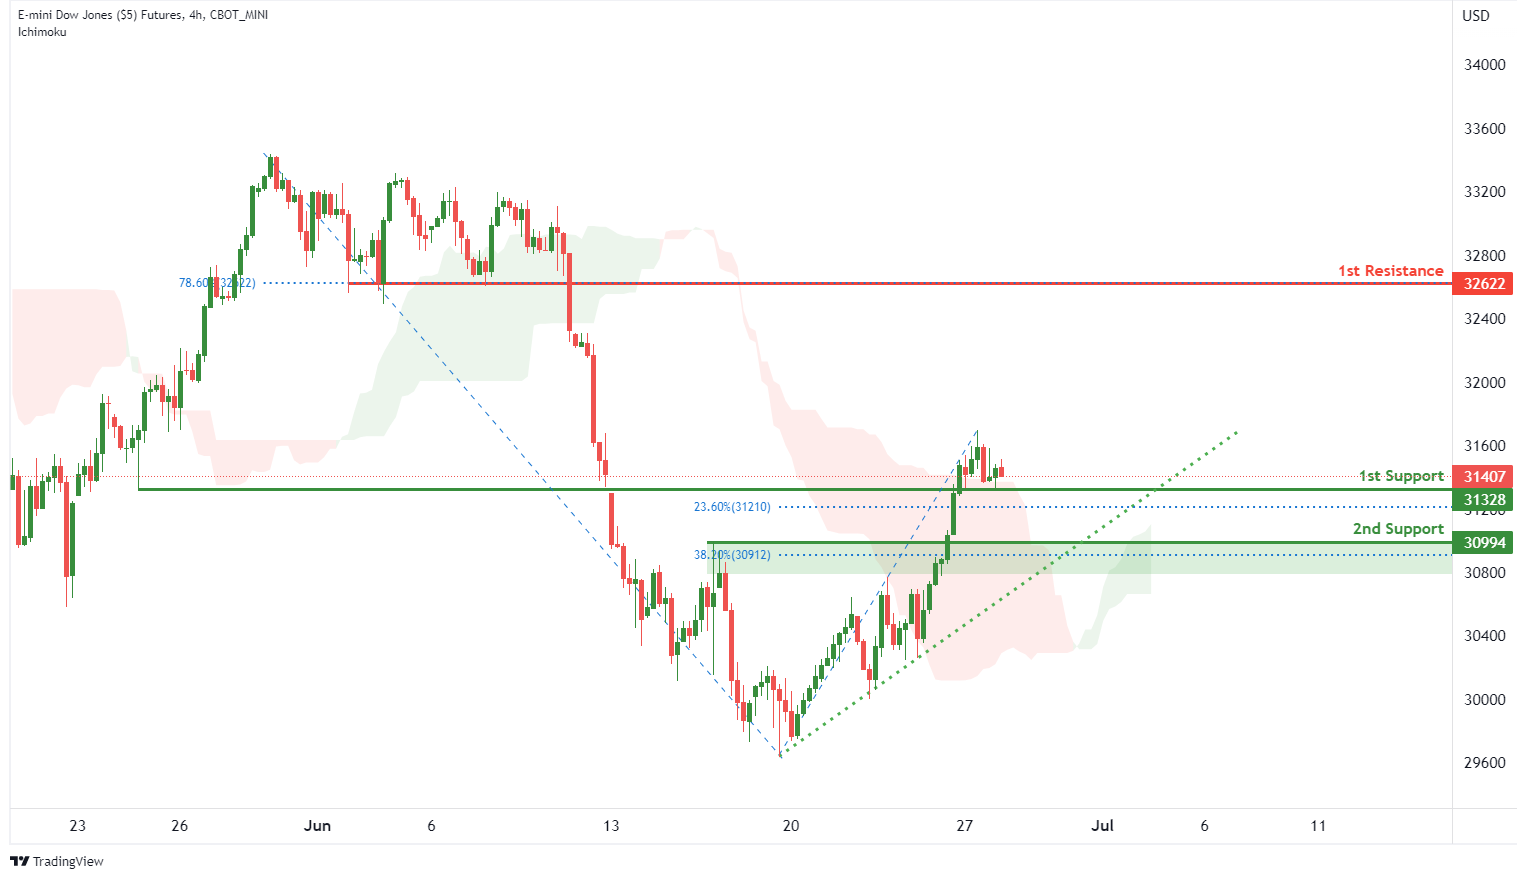
On the H4, with price moving above the ichimoku cloud and along an ascending trendline, we have a bullish bias that price will rise from our 1st support at 31328 where the horizontal pullback support and 23.6% Fibonacci retracement are to our 1st resistance at 32622 in line with the horizontal overlap resistance. Alternatively, price may break 1st support and head for 2nd support at 30994 where the horizontal pullback support and 38.2% fibonacci retracement are.
Areas of consideration:
- H4 time frame, 1st resistance of 32622
- H4 time frame, 1st support of 31328
Elliott Wave View: Nikkei Zigzag Rally Approaching Target
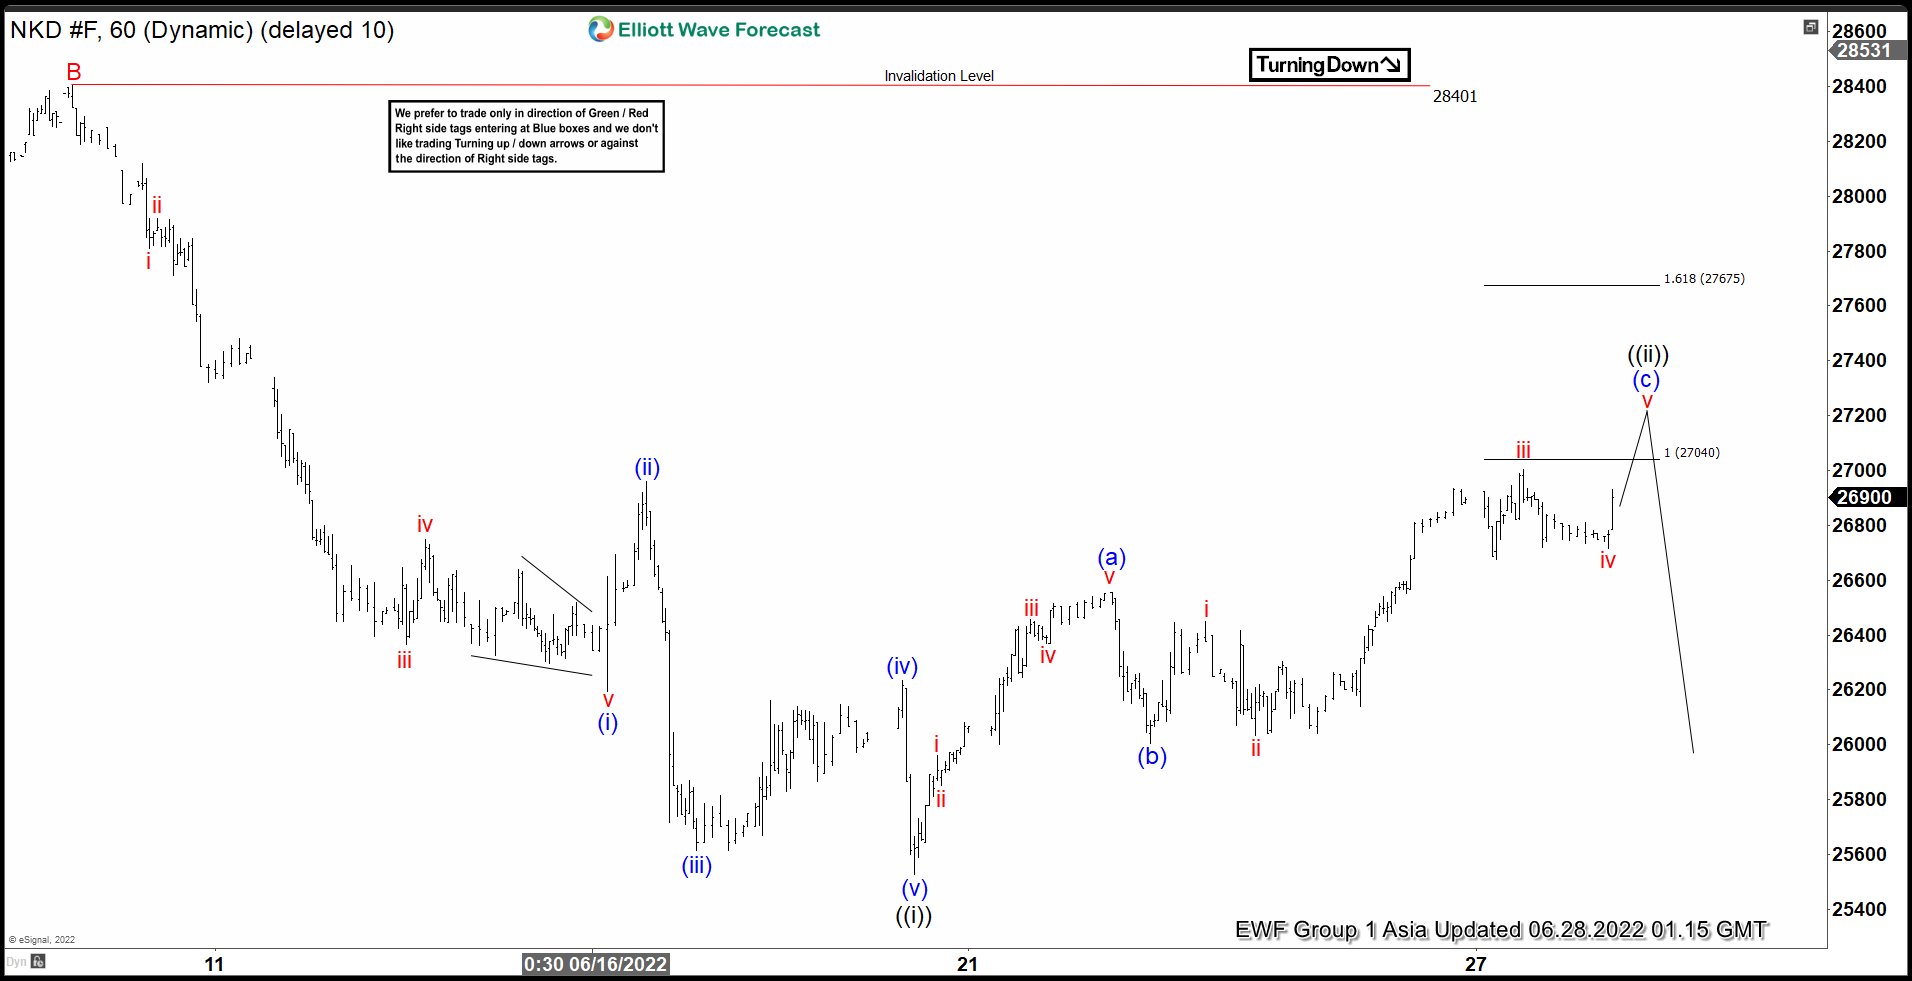
Short term Elliott Wave view in Nikkei suggests the decline from 3/29/2022 peak is unfolding as a zigzag Elliott Wave structure. A Zigzag is a corrective structure labelled as ABC with 5-3-5 subdivision. Down from 3/29/2022 peak, wave A ended at 25555 and rally in wave B ended at 28401. Wave C lower is in progress as a 5 waves impulse. Down from wave B, wave (i) ended at 26195 and rally in wave (ii) ended at 26960. Index then resumes lower in wave (iii) towards 25615, wave (iv) ended at 26235 and final wave (v) ended at 25525. This completed wave ((i)) of C. Wave ((ii)) of C is now in progress to correct cycle from 6/9/2022 high before the decline resumes.
Internal subdivision of wave ((ii)) is unfolding as a zigzag structure in lesser degree. Up from wave ((i)), wave (a) ended at 26555 and dips in wave (b) ended at 26005. Wave (c) higher is in progress to complete wave ((ii)) before the decline resumes. Potential target for wave ((ii)) is 100% – 161.8% fibonacci extension of wave (a) which comes at 27040 – 27675 area. Index should then resume lower or pullback in 3 waves at least. Near term, as far as pivot at 28401 high remains intact, expect rally to fail in 3, 7, or 11 swing for further downside.
Nikkei 60 Minutes Elliott Wave Chart
Eco Data 6/28/22
[php_everywhere instance="1"]
Crude Oil Is Consolidating
On Monday morning, the Brent price is balancing at $113 per barrel The commodity marker remains uncertain – the supply isn’t expanding as quick as it is expected to, and the demand might drop as well.
China is cancelling lockdowns but it does not necessarily mean that the country will start increasing its oil import right away. There are doubts about the Chinese economy’s ability to quickly and steadily expand at a time when the entire world is fighting inflation and afraid of recession.
OPEC+ members are working according to their earlier approved plan to increase oil production. This factor might have calmed down financial markets but Libya remains a mess and the Iranian oil won’t come to the commodity market in a while. Taken together, all these factors create a rather controversial basis.
In the H4 chart, having completed the correctional wave at 107.30, Brent continues growing towards 113.30 and may later consolidate there. After that, the instrument may break the range to the upside and form one more ascending wave with the target at 117.60. From the technical point of view, this scenario is confirmed by MACD Oscillator: its signal line is moving near the lows outside the histogram area, which means that it may grow to reach 0 and the uptrend in the price chart may continue.
As we can see in the H1 chart, after finishing the ascending wave at 113.30 along with the correction down to 110.15, Brent has rebounded from the latter level. Possibly, the asset may break 113.30 and then continue growing towards 117.70. Later, the market may correct to return to 113.30 and then form one more ascending structure with the first target at 119.50. From the technical point of view, this idea is confirmed by the Stochastic Oscillator: after rebounding from 50, its signal line is expected to continue moving towards 80.
EURCHF Wave Analysis
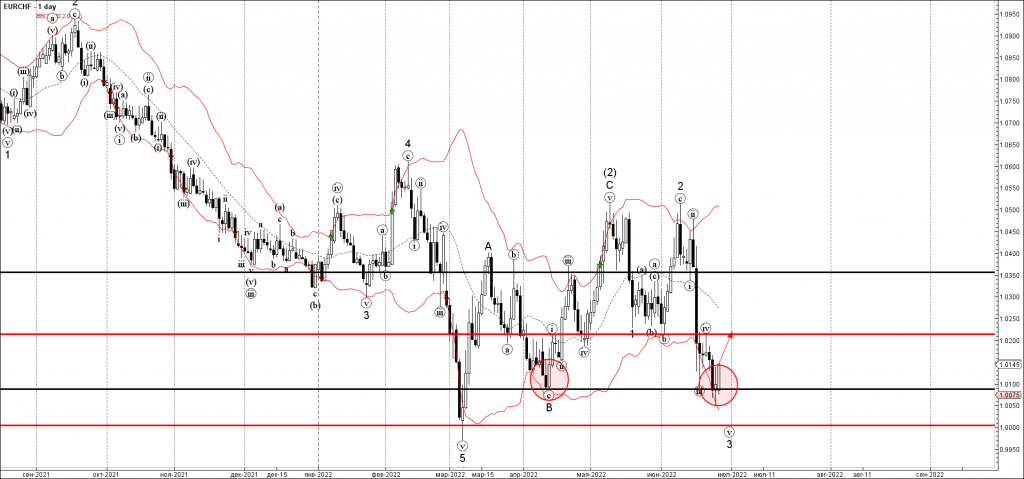
- EURCHF reversed from key support level 1.0090
- Likely to rise to resistance level 1.0215
EURCHF currency pair earlier reversed up from the key support level 1.0090 (the previous monthly low from April), strengthened by the lower daily Bollinger Band.
The upward reversal from the support level 1.0090 stopped the earlier minor impulse waves 3 and (v).
EURCHF can be expected to rise further toward the next resistance level 1.0215 (former strong support from May and June).