Sample Category Title
Rotation from Bitcoin to Altcoins?
Bitcoin gained 3.8% over the past week, ending around $21.4K, dropping slightly to $21.2K on Monday morning. Ethereum added 9.4%, while other top-ten altcoins gained between 4.6% (Cardano) and 19.3% (Dogecoin). The total capitalisation of the crypto market, according to CoinMarketCap, rose 8% over the week to $952bn. The Bitcoin Dominance Index slipped 0.9 points to 43.4% over the same period due to the outperforming recovery of altcoins.
The cryptocurrency fear and greed index went up to 12 points by Monday, from 9 a week earlier, but remained in the extreme fear zone.
Bitcoin has risen above 20K in the past week, although its recovery has been more subdued than the stock market. This performance of the first cryptocurrency may indicate that investors continue to sell off the first cryptocurrency on the rise, moving into altcoins.
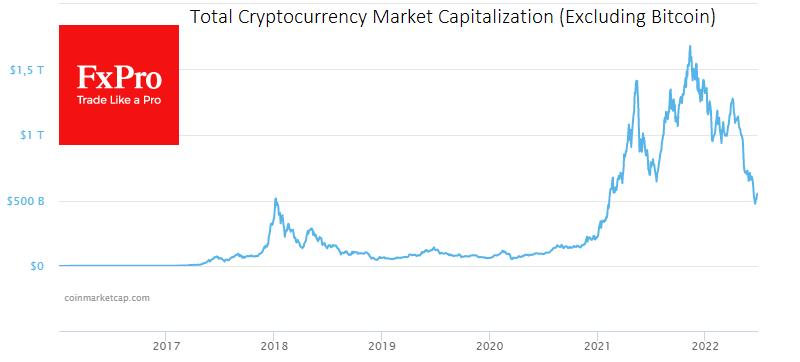
In the coming days or weeks, the important thing will be the performance of the crypto market capitalisation without BTC. Temporarily dipping below 2018 highs near $500B, the Crypto cap ex-BTC is showing a solid rebound, much more active than BTCUSD. However, it remains to be seen how sustainable this bounce will be.
CNBC broadcaster and author of the famous Mad Money programme, Jim Cramer, believes that bitcoin will be able to partially recoup its June losses in the coming months. However, aggressive long-term growth is unlikely. According to him, the rebound before another fall will provide good opportunities to sell previously bought assets.
Gary Gensler, head of the US Securities and Exchange Commission (SEC), is pushing for a single set of rules for cryptocurrencies that would bring together all regulators and strengthen industry regulation.
Cardano co-founder Charles Hoskinson told the US Congress that the SEC and CFTC would not be able to handle oversight of the cryptocurrency industry. In his view, it could self-regulate along the lines of the banking industry.
According to a Paxos survey of regular physical gold buyers, nearly one-third of respondents see bitcoin as a better alternative to that precious metal.
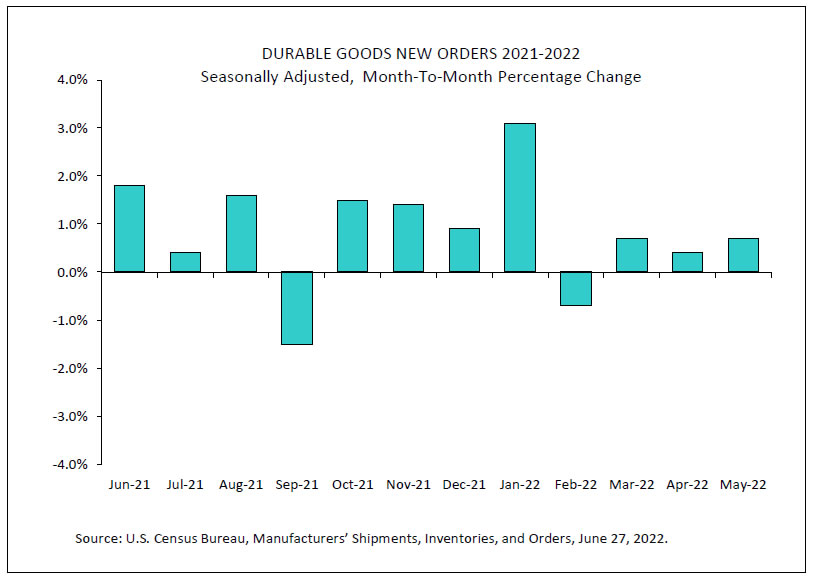
US durable goods orders rose 0.7% mom in May, ex-transport orders up 0.7% mom
US durable goods orders rose 0.7% mom to USD 267.2B in May, above expectation of 0.1% mom. It's up seven of the last eight months. Ex-transport orders rose 0.7% mom, above expectation of 0.4% mom. Ex-defense orders rose 0.6% mom. Transportation orders up two consecutive months, led the rise by 0.8% mom.
China PBoC made biggest daily cash injection in nearly three months
China's PBoC made its biggest daily cash injection into the banking system in nearly three months today. CNY 100B worth of seven-day reverse repos were injected. The central bank said the operation was to keep " maintain stable liquidity levels at half-year end".
Separately, PBoC Governor Yi Gang said, "This year, we face some downward pressures of growth due to COVID-19 and external shocks, and the monetary policy will continue to be accommodative to support economic recovery in aggregate sense."
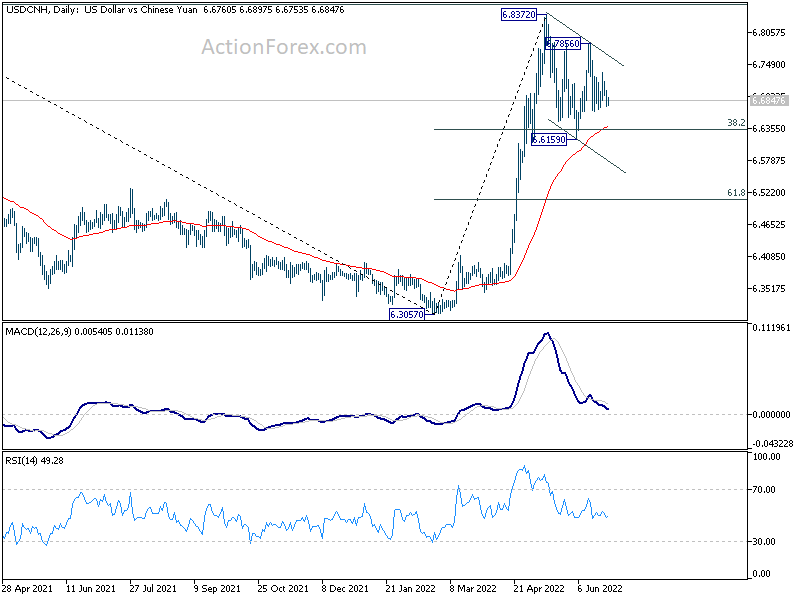
USD/CNH is staying in sideway trading below 6.8237 (May's top). Structure of the prices actions are clearly corrective, indicate that that rise from 6.3057 is now over. Strong support is likely to be seen around 55 day EMA (now at 6.6379) to contain any downside attempt. Break through 6.8372 is expected as a later stage.
XAU/USD: Signals of New Western Sanctions on Russian Gold Imports Lift the Price
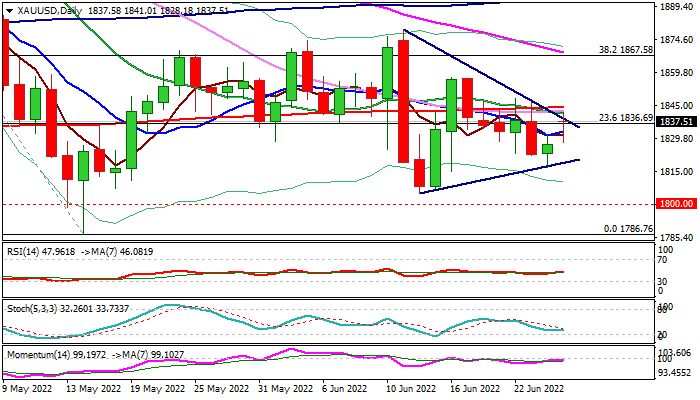
Spot gold opened with a gap higher and edged higher on Monday, lifted by signals that some Western nations are planning to officially ban imports of gold from Russia, in extension to the package of sanctions already imposed.
The technical structure on daily chart remains weak that suggests limited and short-lived upside action, as strong negative signal was generated by a multiple failure at 200DMA resistance ($1844) and weekly close below this indicator.
In addition, the 14-d momentum stays in the negative territory and falling daily cloud continues to weigh on gold price that supports the notion.
Near-term action is expected to remain biased lower while holding below 200DMA, with violation of triangle support line ($1818) to risk test of $1805/00 zone (June 14 trough / psychological) and May 16 low at $1786.
Alternatively, sustained break above 200DMA would ease downside risk, however, much more work at the upside (lift above $1879, June 13 high) would be required to sideline larger bears.
Res: 1844; 1848; 1859; 1857.
Sup: 1828; 1818; 1805; 1800.
AUD/USD Technical Analysis 27th June 2022
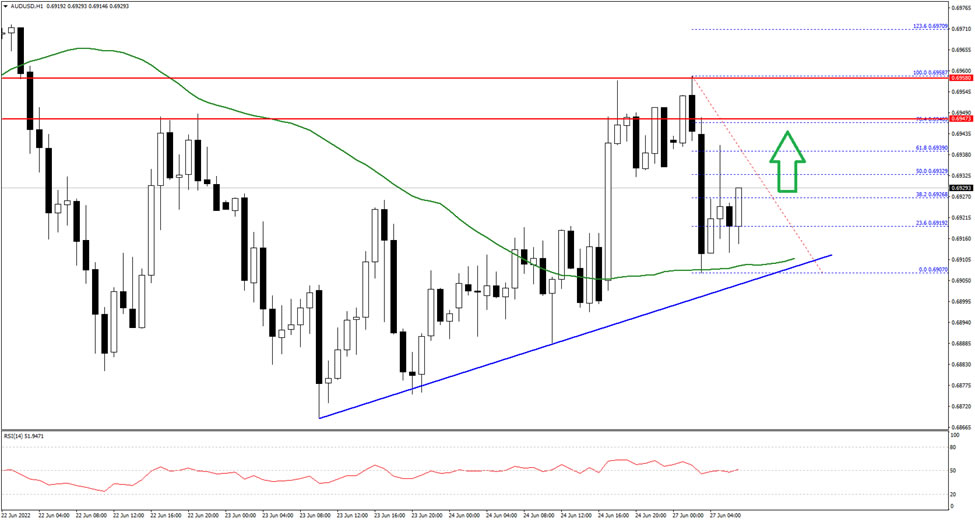
The Aussie Dollar started a fresh decline from the 0.7050 zone against the US Dollar. The AUD/USD pair tested the 0.6880 zone where the bulls took a stand.
The pair is now correcting losses and trading above the 0.6900 level on FXOpen. It is placed above the 0.6920 level and the 50 hourly simple moving average. There is also a connecting bullish trend line with support near 0.6915 on the hourly chart.
On the upside, the first key resistance is near the 0.6945 level. If there is an upside break above the 0.6945 level, the pair could rise steadily towards the 0.7000 level in the near term. Any more gains could send the pair towards 0.7050.
An immediate support on the downside is near the 0.6915 level. The next key support is near the 0.6900 level. A downside break below the 0.6900 support could lead the pair towards the 0.6870 support.
Natural Gas is Trading in a Higher Degree Correction
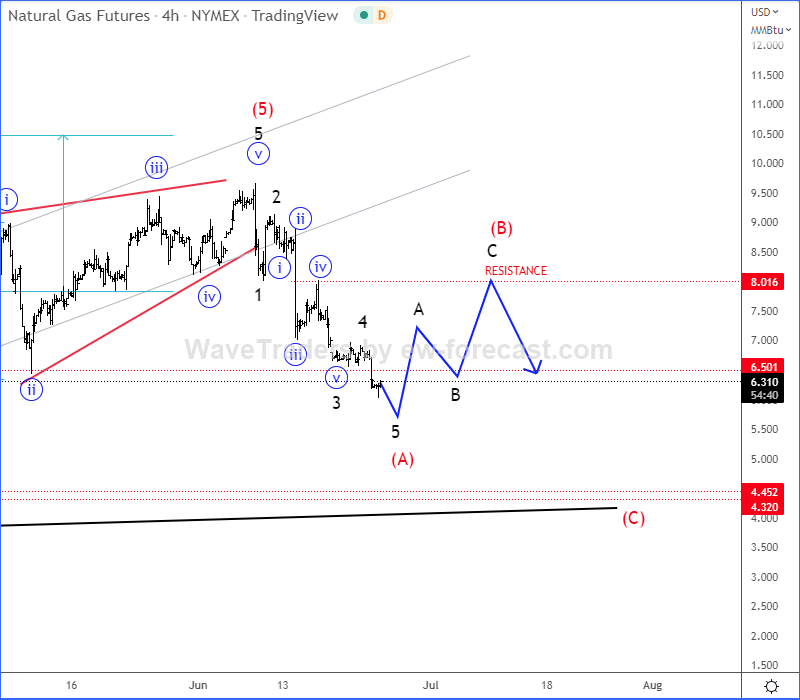
From Elliott wave perspective, an impulsive five-wave drop from the highs suggests temporary top and new, higher degree three-wave (A)-(B)-(C) corrective pullback called a zig-zag correction. Currently we can see it finishing wave (A), so after a corrective recovery in wave (B) be aware of further weakness within wave (C).
From a technical point of view, we will ideally see bounce and recovery here around 6.0 level and back to 8.0 resistance area, from where we can expect another sell-off down to projected strong 4.0 support zone.
GER 40 Attempts Comeback
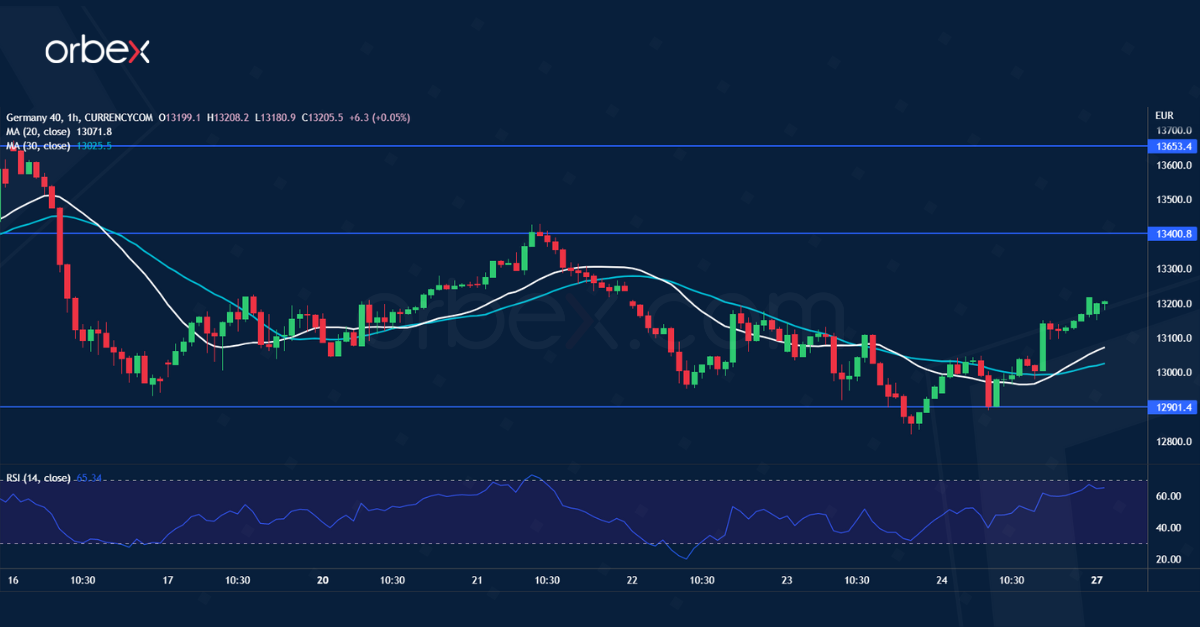
The Dax 40 bounces back as falling commodity prices ease inflation fears. Sentiment remains downbeat after the index fell through May’s low at 13300. However, a break above 13400 may prompt sellers to lift their feet off the pedal. The bulls will need to push past 13650 before the relief rally could gain traction. Otherwise, most buyers may be wary of going in with both hands for fear of catching a falling knife. On the downside, a fall below 12900 would trigger a new round of liquidation to March’s bottom next to 12500.
XAG/USD Bounces Off Major Floor
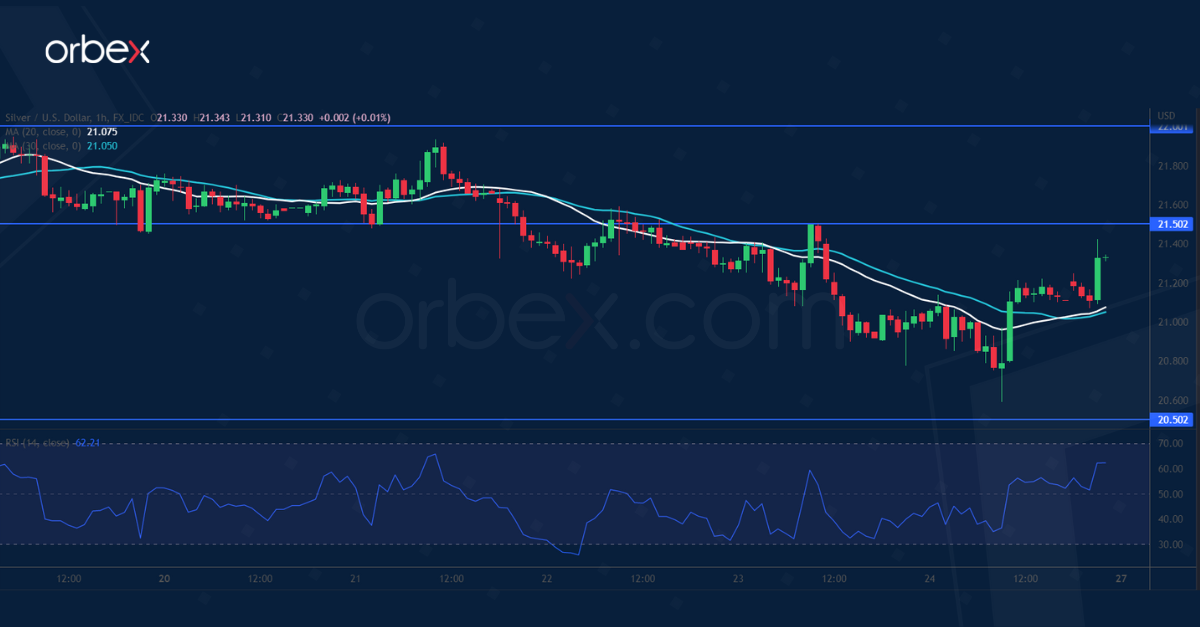
Silver recoups some losses as the US dollar takes a breather. On the daily chart, the price has struggled to lift offers around the 30-day moving average, suggesting prevailing selling interest. A drop below 20.90 has invalidated the mid-June rally. As buyers seek to bail out, the path of least resistance could be down. May’s low at 20.50 is the last support and its breach could trigger a broader sell-off towards 19.00. On the upside, 21.50 is the closest resistance and the triple top (22.00) a major level before a recovery could happen.
EUR/GBP Tests Support
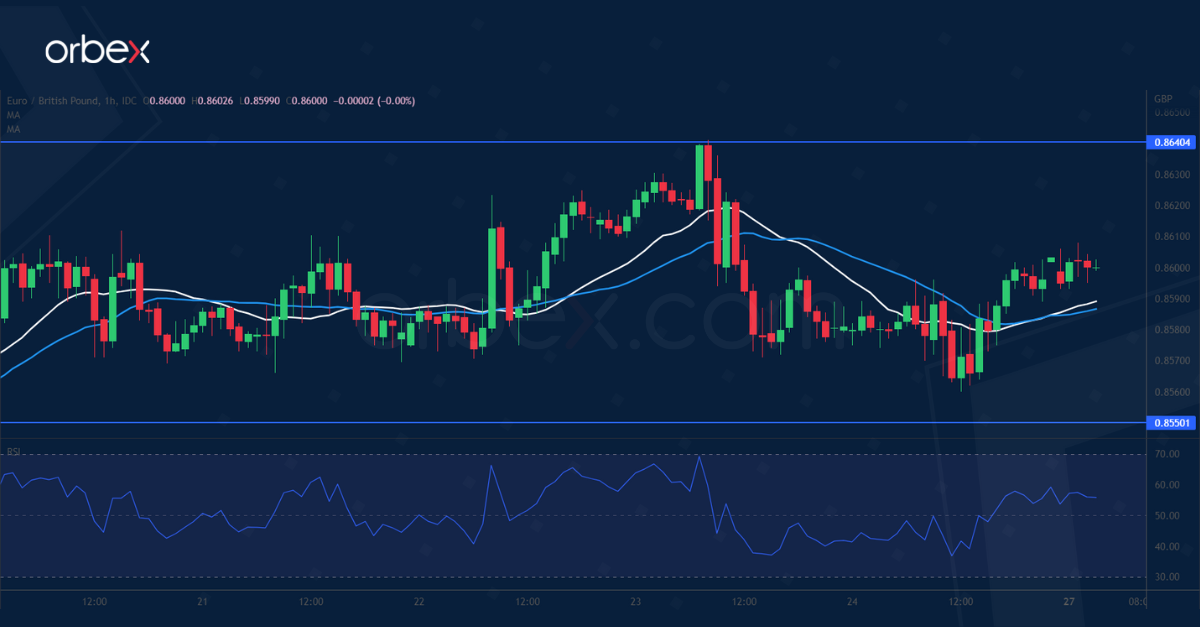
The pound inched higher as Britain’s retail sales showed a smaller-than-expected contraction in May. The euros came under pressure at 0.8640 for lack of momentum. The bulls have sought support in the demand zone between 0.8550 and 0.8570. A close above the said resistance could extend the rally to the recent peak at 0.8720, a step closer to a sustainable recovery in the medium-term. A bearish breakout though would send the euro to 0.8490 which is a key level to keep the two-month long recovery intact.
EURUSD Tests Key Resistance Trendline; Bias Neutral-to-Bearish
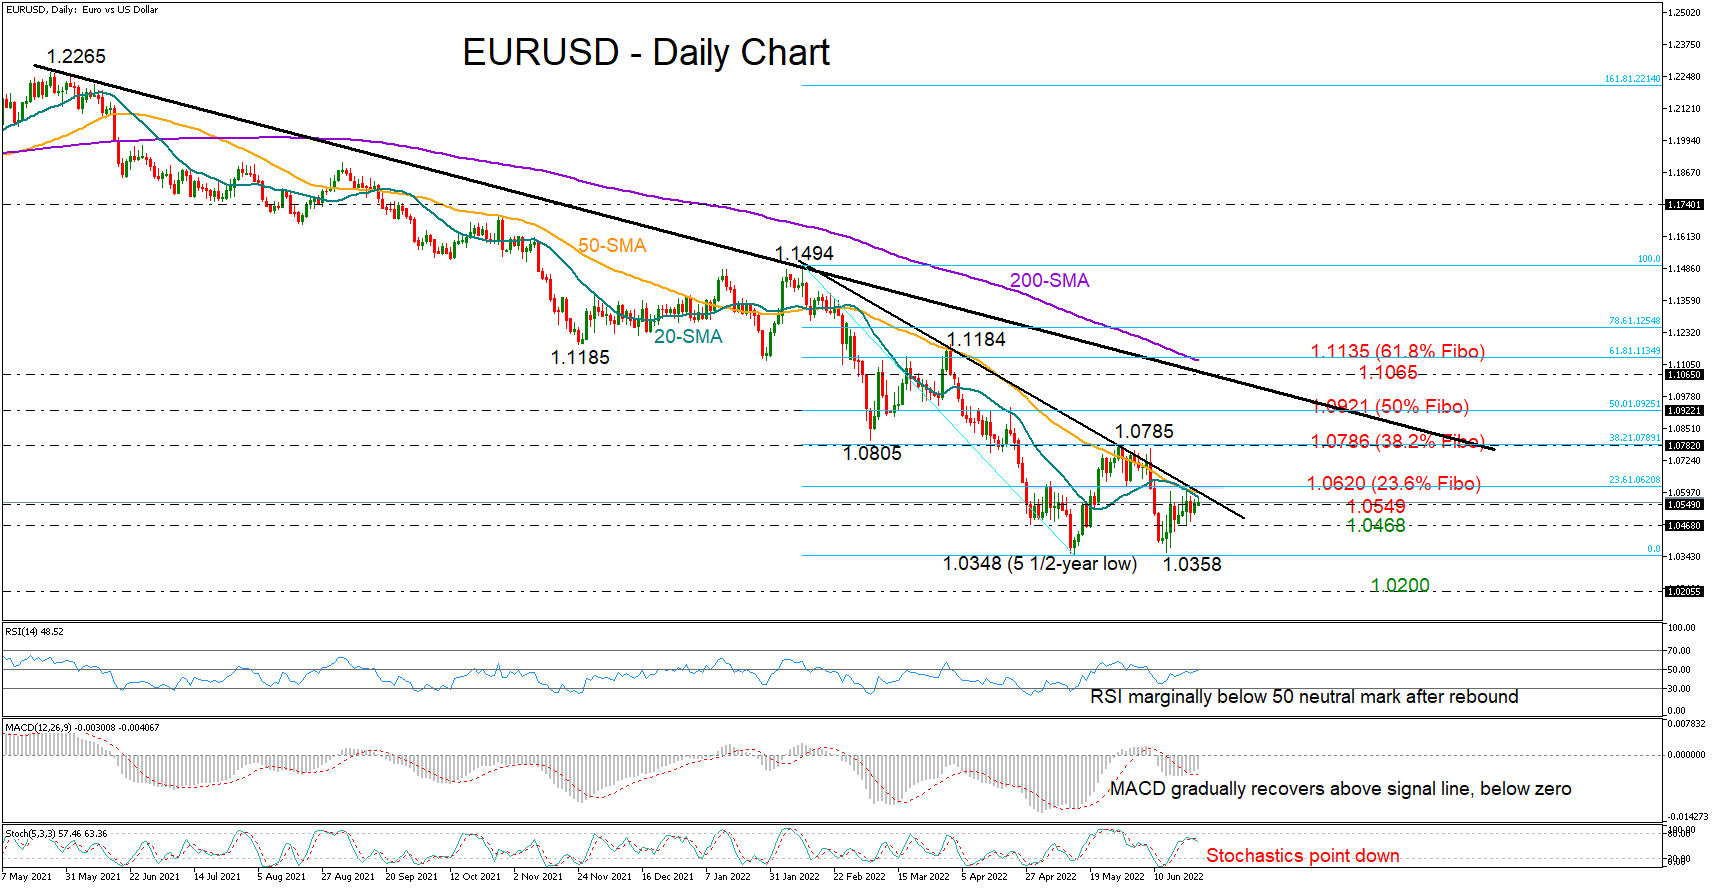
EURUSD opened the week with a muted tone, consolidating its rebound off 5½-year lows marginally below the tough resistance trendline drawn from the 1.1494 high and its shorter-term simple moving averages (SMAs) around 1.0580.
The upside reversal in the RSI and the MACD’s slow improvement above its red signal line is sending some positive vibes about short-term trading, though as long as the indicators hover in the bearish area, downside risks remain intact. The stochastics are setting a bearish intersection following their latest upleg, mirroring fading buying appetite as well.
Slightly above the trendline, the 23.6% Fibonacci retracement of the 1.1494 – 1.0348 downleg might prove another struggle for the bulls at 1.0620. Therefore, traders may wait for a durable extension above that bar before targeting the 38.2% Fibonacci of 1.0789 and May’s swing high. Running higher, the pair will need to claim the 50% Fibonacci of 1.0925 to gain direct access to the longer-term trendline at 1.1065 and the 61.8% Fibonacci of 1.1135. Strikingly, the falling 200-day SMA is located within the same region.
Alternatively, should the pair lose the battle at 1.0549 and correct lower, it could immediately find some footing around the 1.0459 restrictive area. Failure to bounce here would bring the double bottom around 1.0348 next into consideration. Any violation at this point is expected to extend the more-than-a-year old series of lower lows towards the 1.0200 psychological level.
In brief, EURUSD is reflecting a neutral-to- bearish bias in the short-term picture. A move above 1.0620 or below 1.0459 could navigate the market accordingly.