Sample Category Title
Commodity Currencies Soft Despite Positive Sentiment, But Canadian Resilient
The forex markets are rather quiet in Asian session today, even though risk sentiment is positive. Most major pairs and crosses are staying inside Friday's range, even though Yen is slightly stronger with Swiss Franc and Euro. Commodity currencies are generally soft, except Canadian, which is indeed trading notably higher against Aussie and Kiwi.
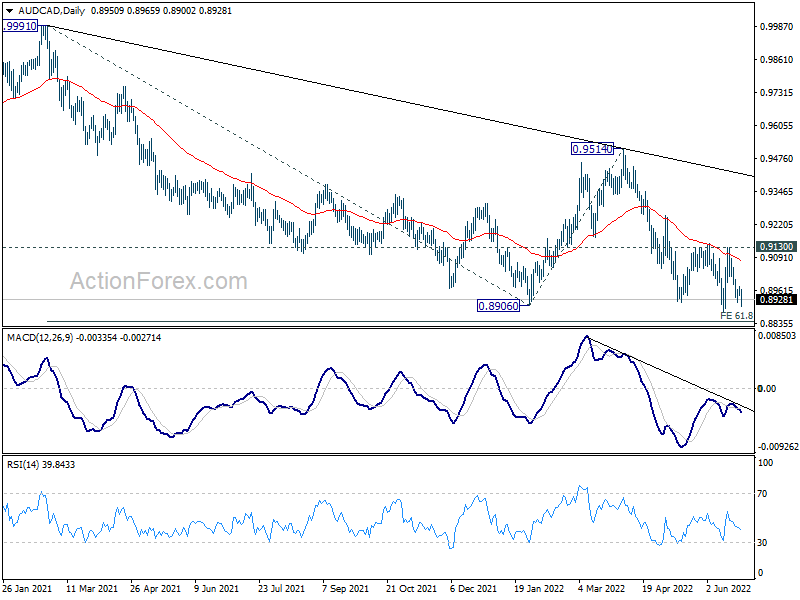
Technically, AUD/CAD looks set to resume medium term down trend from 0.9991 after multiple rejection by 55 day EMA. Deeper fall is expected as long as 0.9130 resistance holds. Main focus is indeed on 61.8% projection of 0.9991 to 0.8906 from 0.9514 at 0.8843. Sustained break there could prompt steeper selling and downside acceleration.
In Asia, at the time of writing, Nikkei is up 1.49%. Hong Kong HSI is up 2.18%. China Shanghai SSE is up 0.75%. Singapore Strait Times is up 0.49%. Japan 10-year JGB yield is up 0.0005 at 0.235.
BoJ opinions: Necessary to persistently continue with monetary easing
In the Summary of Opinions at the June 16-17 meeting, BoJ noted, "in order to achieve the price stability target, accompanied by wage increases, in a sustainable and stable manner, the Bank needs to conduct monetary easing while examining economic and financial developments, for which uncertainties have been extremely high."
While price increases has "broadened", "it cannot be said that the price stability target has been achieved amid a virtuous cycle." Output gap remained "negative for more than two year", Japan has not reached a situation to "accelerate a rise in wages". It is "necessary to "persistently continue with monetary easing and thereby support the economy."
There was no discussion on tweaking the 0.25% cap on 10-year JGB yield.
Hong Kong breaks April's high on improving sentiment
Asian markets trade broadly higher today, following the strong rebound in US stocks on Friday. Hong Kong HSI is additionally lifted by news of easing pandemic restrictions in Shanghai. China's industrial profit dropped -6.5% yoy in May, improved from April's -8.5% yoy.
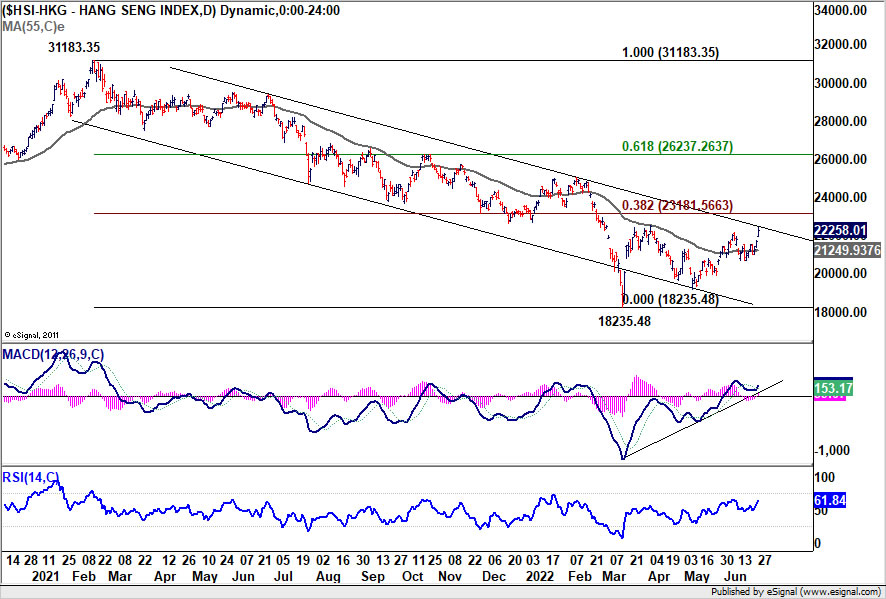
Technically, HSI breaks 22523.64 resistance (April's high) to resume the rebound from 18235.48. Further rally is in favor as the index is moving away from 55 day EMA, with daily MACD back above signal line. Real test for the near term lies in 38.2% retracement of 31183.35 to 18235.48 at 23181.56. Sustained break there should confirm medium term bottoming and set the stage for stronger rebound to 61.8% retracement at 26237.26, even as a corrective move.
Some more CPI, consumer confidence and spending data
Focuses will stay on inflation and its impact on consumers globally. Data to watch include US consumer confidence, personal income and spending and PCE inflation,. Eurozone CPI flash, Germany Gfk consumer sentiment and retail sales, Japan and Australia retail sales could trigger some volatility. Also, Canada will release GDP and China will release PMIs. BoJ summary of opinions should maintain a dovish tone.
Here are some highlights for the week:
- Monday: BoJ summary of opinions. US durable goods orders, pending home sales.
- Tuesday: Germany Gfk consumer climate; US trade balance, house price index, consumer confidence.
- Wednesday: Japan retail sales, consumer confidence; Australia retail sales; Germany CPI flash; Swiss Credit Suisse economic expectations, Eurozone M3; US GDP final.
- Thursday: New Zealand ANZ business confidence; Japan industrial production, housing starts; China PMIs; Germany import prices, retail sales, unemployment; UK GDP final, current account; Swiss retail sales, KOF economic barometer; France consumer spending; Eurozone unemployment rate; Canada GDP; US jobless claims, personal income and spending, Chicago PMI.
- Friday: Australia AiG manufacturing index; New Zealand building permit; Japan Tokyo CPI, unemployment rate, Tankan survey, PMI manufacturing final; China Caixin PMI manufacturing; Swiss PMI manufacturing; Eurozone PMI manufacturing final, CPI flash; UK PMI manufacturing final; US ISM manufacturing, construction spending.
USD/CAD Daily Outlook
Daily Pivots: (S1) 1.2855; (P) 1.2931; (R1) 1.2973; More...
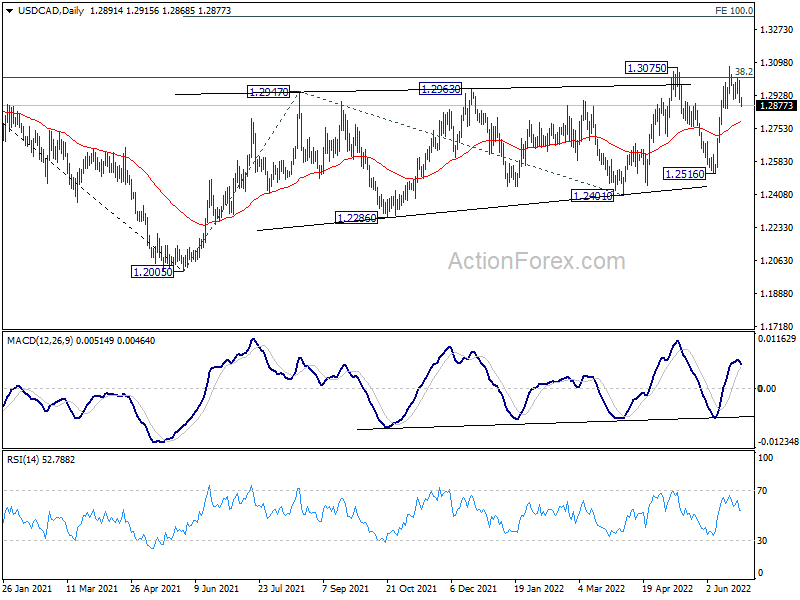
Intraday bias in USD/CAD remains neutral at this point, further rally is mildly in favor with 1.2859 support intact. On the upside, break of 1.3077 and sustained trading above 1.3022 fibonacci level will carry larger bullish implications. Next target is 100% projection of 1.2005 to 1.2947 from 1.2401 at 1.3343. However, break of 1.2859 minor support will turn bias back to the downside for 1.2516 support instead.
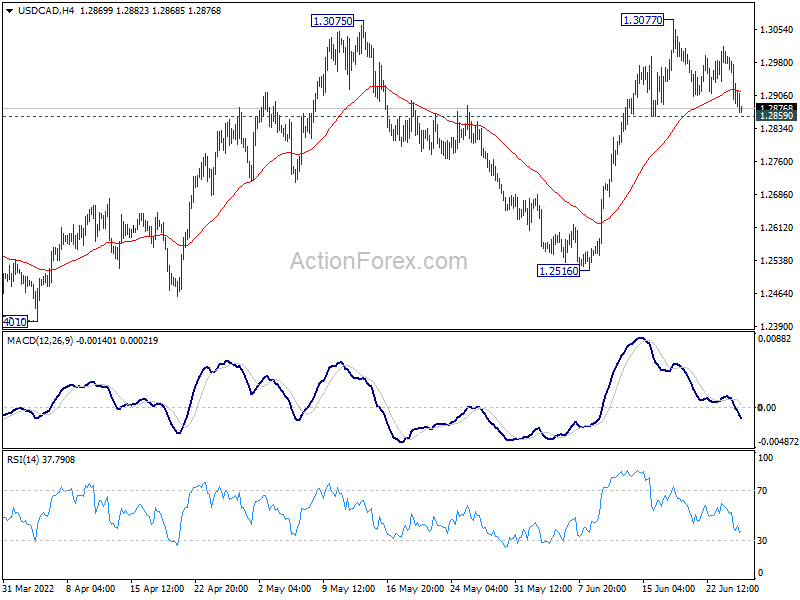
In the bigger picture, focus stays on 38.2% retracement of 1.4667 (2020 high) to 1.2005 (2021 low) at 1.3022. Sustained break there should confirm that the down trend from 1.4667 has completed after defending 1.2061 long term cluster support. Further rise would then be seen towards 61.8% retracement at 1.3650. However, rejection by 1.3022 will maintain medium term bearishness.
Economic Indicators Update
| GMT | Ccy | Events | Actual | Forecast | Previous | Revised |
|---|---|---|---|---|---|---|
| 23:50 | JPY | BoJ Summary of Opinions | ||||
| 12:30 | USD | Durable Goods Orders May | 0.10% | 0.50% | ||
| 12:30 | USD | Durable Goods Orders ex Transportation May | 0.40% | 0.40% | ||
| 14:00 | USD | Pending Home Sales M/M May | -3.50% | -3.90% |
The Risk Rebound Continues
Markets continue to price that the worst is over for US bond markets and that the end of Fed rate hikes will occur sooner as the economy in the US, and elsewhere, slow sharply in H2 2022. US stock markets had a banner week based on that theory, which continued Friday with Wall Street posting another day of sharp gains.
It is not just US yields that have retreated sharply over the last week, oil retreated, and this month, industrial metals have taken a beating as well. I’ll not argue with the slow-down predictions although they’re not alone. China has already had one, Europe and the UK are going through one, New Zealand is going to have one, and from Ecuador to Peru, Sri Lanka, and plenty of points in between, emerging markets are feeling some serious pain from inflation and the stagflation shock and disruption to staple supplies like food and energy.
The backwardation in oil futures markets has widened, not lessened, suggesting that despite least weeks' price falls, energy supplies are as tight as ever. Europe is suffering from reduced Russian natural gas flows; Ecuadorean oil production is expected to go completely offline this week due to cost-of-living protests, and I’m guessing in the US, Honda Civics (a hybrid of course) are this season’s new automotive black as American’s face the reality of owning and running a 10-litre pickup truck. And don’t get me started on the downstream impacts of high natural gas and oil prices on the manufacturing of fertilisers, exacerbated by Russian and Belarus sanctions.
We are already seeing winters of discontent sweeping the UK and Europe and places elsewhere as workers strike over pay increases. None of this adds up to a reason to be piling into equity markets in my mind, because even if bond yields from early hikers start topping out with the US, the real world where companies sell their products isn’t looking too special for H2.
Still, one of the wisest sayings an investor can ever listen to is from John Maynard Keynes. He said that “the market can stay irrational longer than you can stay solvent.” Nary a truer word has been said and as such one should always respect the short-term momentum is that’s the space you play in, and it seems that many do in this gamified investment day and age. The stock market rally could run for another couple of weeks, US yields and the Dollar could continue falling, and even USD/JPY might make it back to 130.00 if US 10-years fall back below 3.0%.
Helping the bounce in sentiment on Friday were US New Homes surprising to the upside, rising by 11% in April. The consensus seems to be that this is an outlier in a downward trend though. On the negative side, Michigan Consumer Sentiment for June fell to a record low of 50.0, with the only tenuous positive being that Inflation Expectations held steady at 5.30% and didn’t move higher.
This week, we have the Fed’s Powell, ECB’s Lagarde, and BOE’s Bailey, all speaking on Wednesday at an economic policy panel discussion at the ECB junket, I mean forum in Portugal. We may well get some tasty snippets to generate short-term vol. Otherwise, data is heavily skewed towards the end of the week. The highlights will be China and US PMI readings released over Thursday and Friday, German Retail Sales on Thursday, and US Personal Income and Expenditure, also on Thursday.
Barring a chock fall in US Personal Income and Expenditure, I can’t see any of that moving the dial on the global risk sentiment rebound. It is clear the market wants to buy the dip, and it's best to let them get it out of their system. Next week’s JOLTs Job-Opening data and the US Non-Farm Payrolls will provide a sterner test. Tonight’s US Durable Goods may also give the FOMO gnomes an early stress test.
In Asia this week, the ongoing G-7 meeting could be the most relevant one in a decade with Ukraine and Russia at the centre of the agenda. China has already released Industrial Profits this morning, which fell by 6.50% YoY in May, a slight improvement over April. The official and Caixin PMIs at the end of the week are what matter though. Australian Retail Sales on Wednesday are always good for some intra-day AUD vol, but both AUD and NZD are slaves to global sentiment perception, and Australian stock markets are just cost-tailing Wall Street right now. Friday also sees a slew of Manufacturing PMIs released from across Asia, which are usually a decent short-term directional play for local equity markets.
South Korea releases Industrial Production, Manufacturing Production and Retail Sales on Thursday. Retail Sales will remain under pressure as the cost of living increases bite. Industrial Production and Manufacturing should hold steady, but weaker data may see renewed pressure on the Won and other Asian currencies on slowdown fears.
Japan has a packed calendar. Retail Sales and Consumer Confidence should continue to improve as the reopening momentum domestically continues. A weaker yen should help Thursday’s Industrial Production data, but Friday’s Tankan Large Manufacturing Index has downside risks. Arguably the most closely watched item will be Friday’s Tokyo CPI data where June Inflation YoY could breach above 2.0%. It’s a strange old world when markets get excited about 2.0% inflation anywhere but especially in Japan. Although I believe after over two decades, the Bank of Japan has no intention of altering monetary policy, a CPI reading above 2.0% could see temporary pressure on 10-year JGBs and the USD/JPY. That’s all it's likely to be, temporary.
Finally, it's Monday so I suppose I have to talk about cryptos for a little bit in their role as a “tradeable asset,” instead of an “investable asset.” Thanks to the rebound in US stock markets and the fall in US yields, Bitcoin looks to have traced out a low of around $18,000.00 for now. From a technical perspective, a rise above $22,000.00 looks possible, extending onwards to $24,000.00. However, in the medium-term, Bitcoin remains in the danger zone, and only a rise above $28,000.00 negates.
Asian equities rally with Wall Street
Wall Street had an impressive session on Friday, rallying powerfully once again as markets priced in a US recession meaning US interest rate hikes would end sooner than expected. That perverse logic saw the S&P 500 jump 3.07%, the Nasdaq rally 3.34% higher, while the Dow Jones gained 2.70%. Much the same pattern is playing out in US futures in Asia. S&P 500 have added 0.35%, Nasdaq futures have jumped by 0.85%, while Dow futures have gained 0.10% as the FOMO gnomes of Wall Street go hard on growth over value.
That sees Asian stock markets coat-tailing New York higher today. The Nikkei 225 has risen by 1.20%, with South Korea’s Kospi rallying by 1.80%. Mainland China’s Shanghai Composite is 0.90% higher, and the CSI 300 has risen by 1.25%. China stocks benefiting additionally from a large CNY 90 billion liquidity injection ahead of the quarter-end vis the 7-day reverse repo. The ever-effervescent Hong Kong market has seen the Hang Seng making an outsized 3.30% gain today.
Regionally, Singapore is up by 0.70%, the tech-centric Taipei by 1.90%, Kuala Lumpur by 0.25%, and Jakarta has fallen by 0.75%. Bangkok has added 0.75%, and Manila is down slightly by 0.15%. Australian markets are slavishly following the S&P 500 and Nasdaq as well, very much their want of late. The All Ordinaries have rallied by 1.90%, with the ASX 200 rallying by 1.95%.
The G-7 meeting probably has potentially a much greater bearing on Europe right now, than other areas, thanks to the Ukraine/Russia war. European markets piled into the buy-side with the US on Friday after a very mixed week, and with the G-7 springing no surprises thus far, we can expect a positive opening from European markets this afternoon.
US Dollar edges lower with US yields
The US Dollar moved slightly lower on Friday as investor confidence ended the week on a high as the street priced in an earlier end to interest rate hikes, and US yields held steady. The dollar index continued grinding lower, falling 0.27% to 104.12, where it remains in another dead Asian session. The dollar index has support at 1.0350 and 102.50, with resistance now distant at 1.0570.
EUR/USD rose by 0.33% to 1.055 on Friday, where it remains in Asia, as investor sentiment continued rebounding. It continues showing resilience as the Russian natural gas exports to Europe situation deteriorates, but initial resistance at 1.0600 and 1.0650 remains challenging. Support is at 1.0450 and 1.0400. Sterling was unchanged at 1.2275 on Friday, not moving in Asia. GBP/USD has initial resistance at 1.2360 and 1.2400, with support at 1.2200, 1.2160, and then 1.1950.
USD/JPY finished sideways at 135.25 on Friday as US bond yields remained steady. It has fallen 0.40% to 134.80 in Asia and it rising investor sentiment pushes US 10-year yields back below 3.0%, a sharp move lower to 132.00 cannot be ruled out. USD/JPY has support at 134.25 and 132.00, with resistance at 136.65 and 138.00.
AUD/USD and NZD/USD booked decent gains on Friday as the stock market rally spilt over into the Australasians. However, today, both have moved sharply lower slightly to 0.6920 and 0.6305, and it looks like some decent-sized AUD/JPY and NZD/JPY selling has gone through the market. The outlook remains negative for AUD/USD while it holds under 0.7000. Support is at 0.6850.
Asian currencies traded sideways on Friday, booking some small gains, but overall, remaining near recent lows versus the US Dollar. That suggests that the rise in investor sentiment in equity markets is yet to spill out into the broader EM complex. The weakest of the pack has been the Philippine Peso with USD/PHP rising above 55.00 this morning to 55.12. The inauguration of the new Marcos President this week, and a dovish rate hike last week are likely the contributing factors. The Chinese Yuan has had zero reaction to the liquidity injection via the reverse repo this morning, or weekend news that a Yuan liquidity pool has been created at the BIS.
Oil prices bounce
Oil prices rose on Friday and Brent crude and WTI has unwound most of early last week’s losses. The futures curves remain in very firm backwardation and in the real world, supplies are as tight as ever with increasing risks around Russia and European natural gas exports. As I said last week, we are unlikely to see Brent crude below $100.00 in this environment, whatever noise we are hearing from other asset classes. OPEC should be a non-event this week, having increased production slightly last month. A potential full loss of Ecuadorian production is having no impact on markets today.
Brent crude rose by 2.55% to $112.40 on Friday, gaining 0.75% to $113.30 a barrel in Asia. WTI rose by 3.45% to $107.50 on Friday, edging 0.15% higher to $107.70 a barrel in Asia.
Notably, Brent crude tested and held its rising longer-term support line, today at $107.70, in the early part of last week. It did not reach the 100-day moving average DMA either. That is a technical development that should be respected and talk emerging from the G-& about a cap on Russian oil prices, is likely to be more supportive of Brent crude over WTI.
WTI’s technical picture continues to look the more vulnerable. Having closed below its rising 2022 support line and its 100-DMA last week, the rally on Friday has only lifted it back to this region today. The support line is at $107.10, with the 100-DMA at 105.85 a barrel. Although the worst may be over for the WTI sell-off as well, we can’t rule out more corrections lower this week. It has resistance at $110.00 a barrel.
Gold rises on Russian gold ban
Gold rose with general investor sentiment on Friday, as the US Dollar eased. It ground out a modest 0.25% gain to $1827.50 an ounce, adding another 0.45% to $1835.50 an ounce in Asia today. The gains today have been driven by a G-& announcement of a formal ban on Russian gold imports. In reality, this is a mere rubber-stamping exercise of unofficial policies already in place and is unlikely to meaningfully change the outlook for gold. It remains adrift in month-long $1800.00 to $1880.00 range.
Gold has resistance at $1860.00 and $1880.00, the latter appearing an insurmountable obstacle for now. Support is at $1805.00 and then $1780.00 an ounce. Failure of the latter sets in motion a much deeper correction, potentially reaching $1700.00 an ounce. On the topside, I would need to see a couple of daily closes above $1900.00 to get excited about a reinvigorated rally.
Hong Kong breaks April’s high on improving sentiment
Asian markets trade broadly higher today, following the strong rebound in US stocks on Friday. Hong Kong HSI is additionally lifted by news of easing pandemic restrictions in Shanghai. China's industrial profit dropped -6.5% yoy in May, improved from April's -8.5% yoy.
Technically, HSI breaks 22523.64 resistance (April's high) to resume the rebound from 18235.48. Further rally is in favor as the index is moving away from 55 day EMA, with daily MACD back above signal line. Real test for the near term lies in 38.2% retracement of 31183.35 to 18235.48 at 23181.56. Sustained break there should confirm medium term bottoming and set the stage for stronger rebound to 61.8% retracement at 26237.26, even as a corrective move.
BoJ opinions: Necessary to persistently continue with monetary easing
In the Summary of Opinions at the June 16-17 meeting, BoJ noted, "in order to achieve the price stability target, accompanied by wage increases, in a sustainable and stable manner, the Bank needs to conduct monetary easing while examining economic and financial developments, for which uncertainties have been extremely high."
While price increases has "broadened", "it cannot be said that the price stability target has been achieved amid a virtuous cycle." Output gap remained "negative for more than two year", Japan has not reached a situation to "accelerate a rise in wages". It is "necessary" to "persistently continue with monetary easing and thereby support the economy."
There was no discussion on tweaking the 0.25% cap on 10-year JGB yield.
Technical Outlook and Review
DXY:
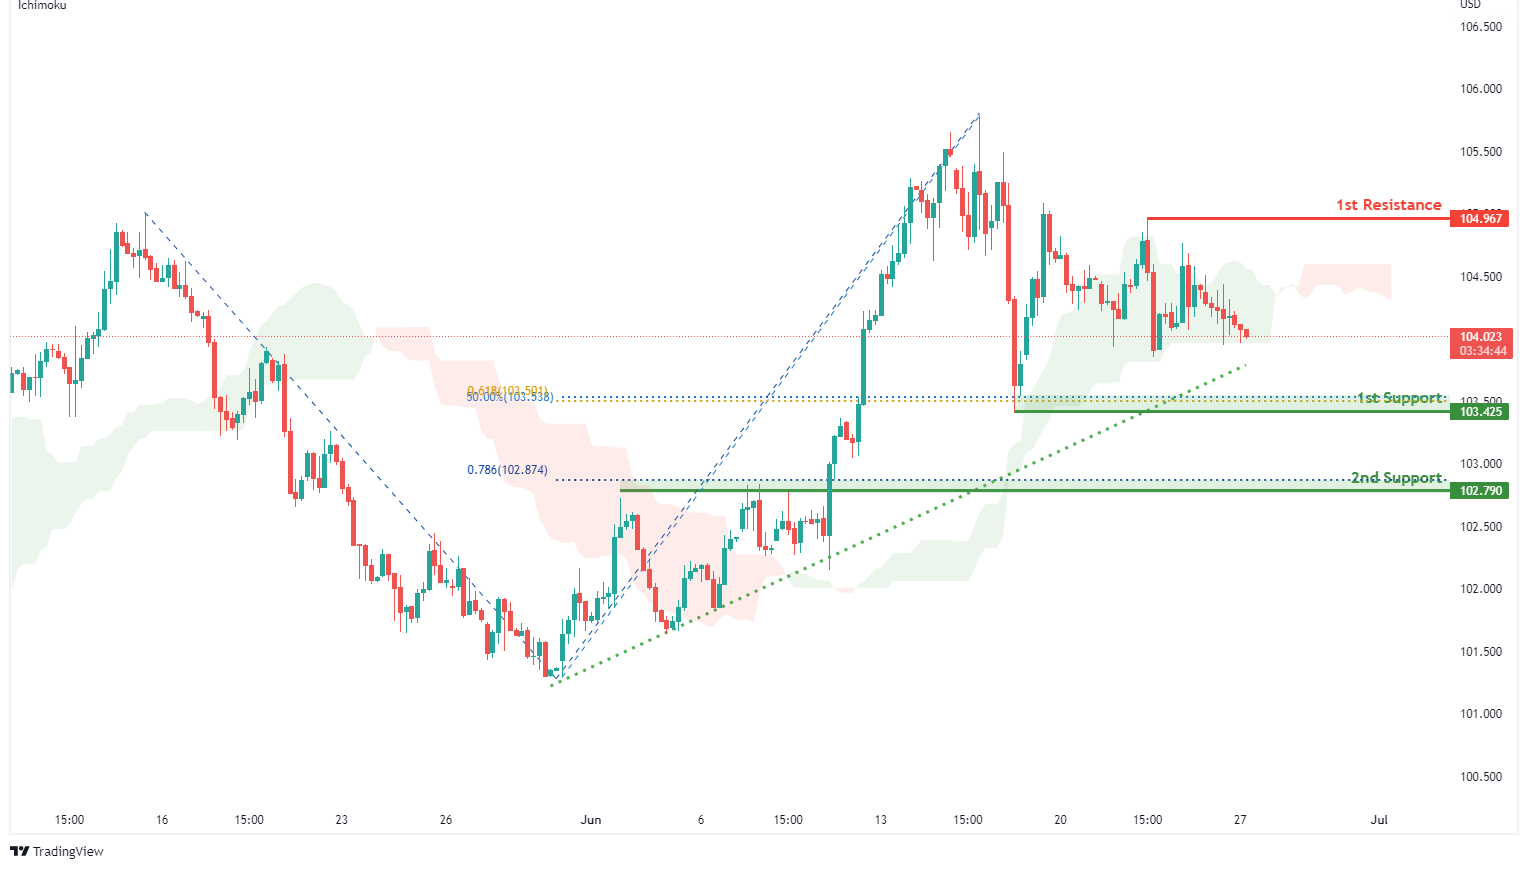
On the H4, with prices expected to bounce off ichimoku support and prices moving along the ascending trendline, we have a bullish bias that bullish momentum will carry prices from our 1st support at 103.425 where the 61.8% fibonacci projection, 50% fibonacci retracement and swing low support are to our 1st resistance at 104.967 in line with the horizontal swing high resistance. Alternatively, price may break 1st support structure and head for 2nd support at 102.790 where the horizontal overlap support and 78.6% fibonacci projection.
Areas of consideration:
- H4 time frame, 1st resistance at 104.967
- H4 time frame, 1st support at 103.425
XAU/USD (GOLD):
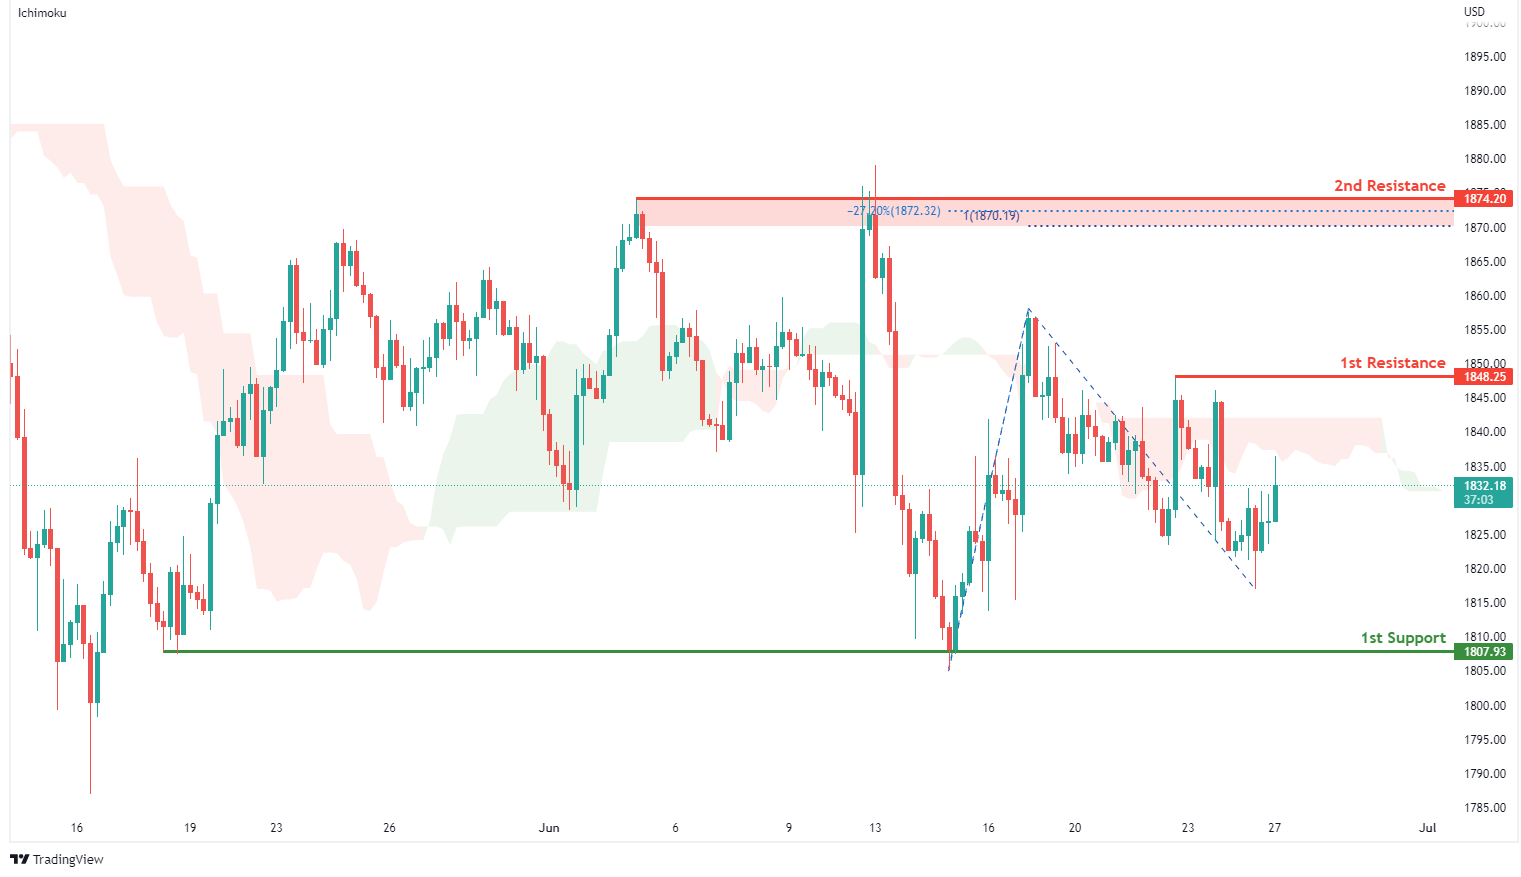
On the H4, with prices moving below the ichimoku indicator, we have a bearish bias that prices will drop from our 1st resistance at 1848.25 where the horizontal swing high resistance is to our 1st support at 1807.93 in line with swing low support. Alternatively, price may break 1st resistance structure and head for 2nd resistance at 1874.20 in line with swing high resistance, -27.2% fibonacci expansion and 100% fibonacci projection.
Areas of consideration:
- H4 time frame, 1st Resistance at 1848.25
- H4 time frame, 1st Support at 1807.93
GBP/USD:
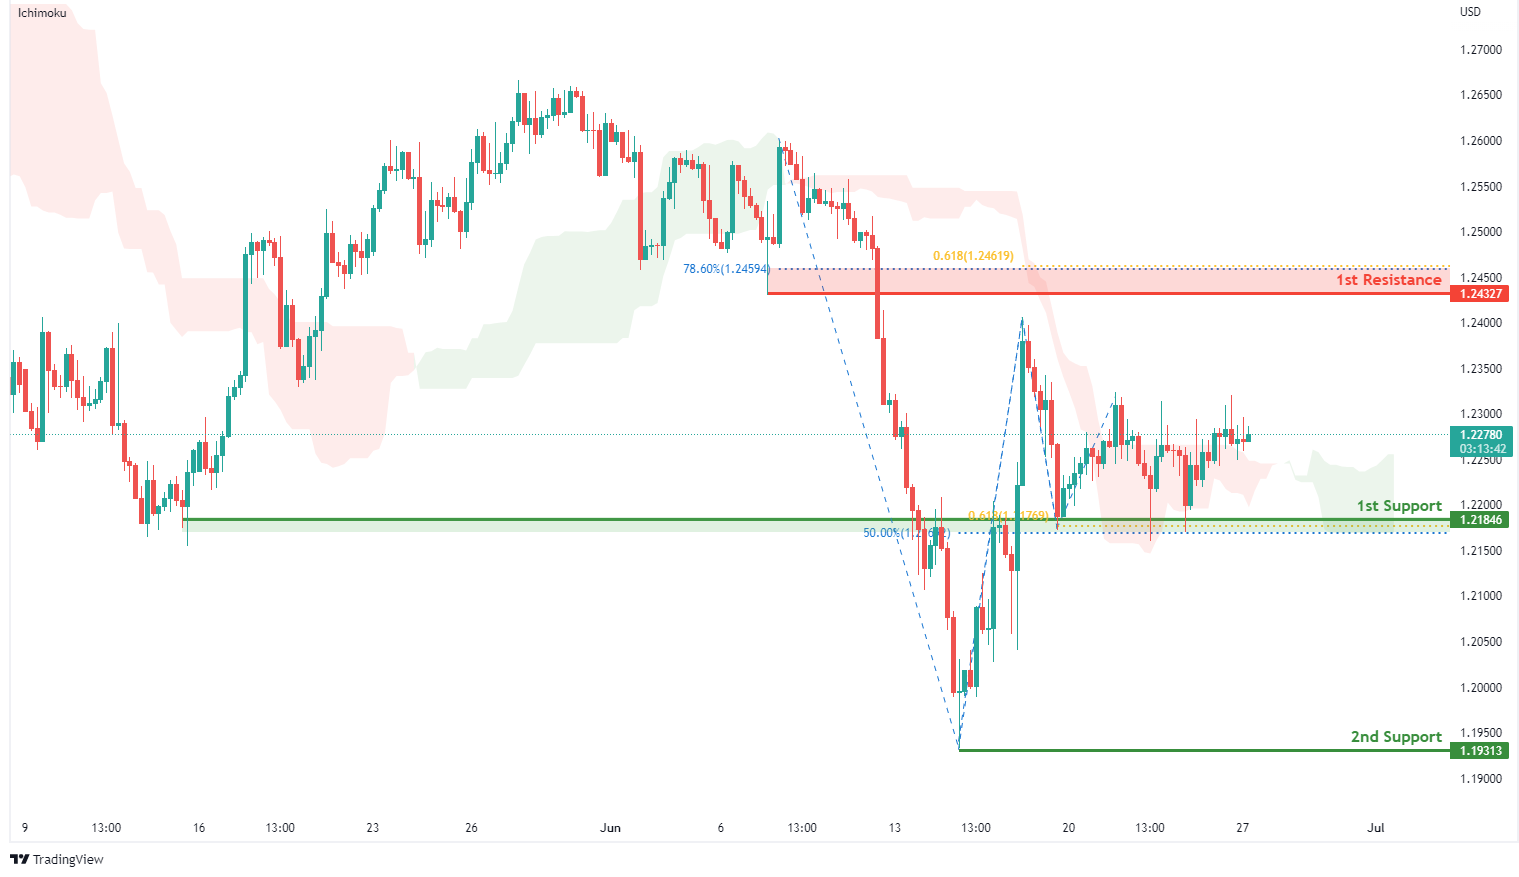
On the H4, with prices moving above the ichimoku indicator, we have a bullish bias that price will rise from our 1st support at 1.21846 where the horizontal overlap support,50% fibonacci retracement and 61.8% fibonacci projection to our 1st resistance at 1.24327 in line with the 61.8% fibonacci projection, 78.6% fibonacci retracement and pullback resistance. Alternatively, price may break 1st support structure and head for 2nd support at 1.19313 where the horizontal swing low support is.
Areas of consideration:
- H4 1st resistance at 1.24327
- H4 1st support at 1.21846
USD/CHF:
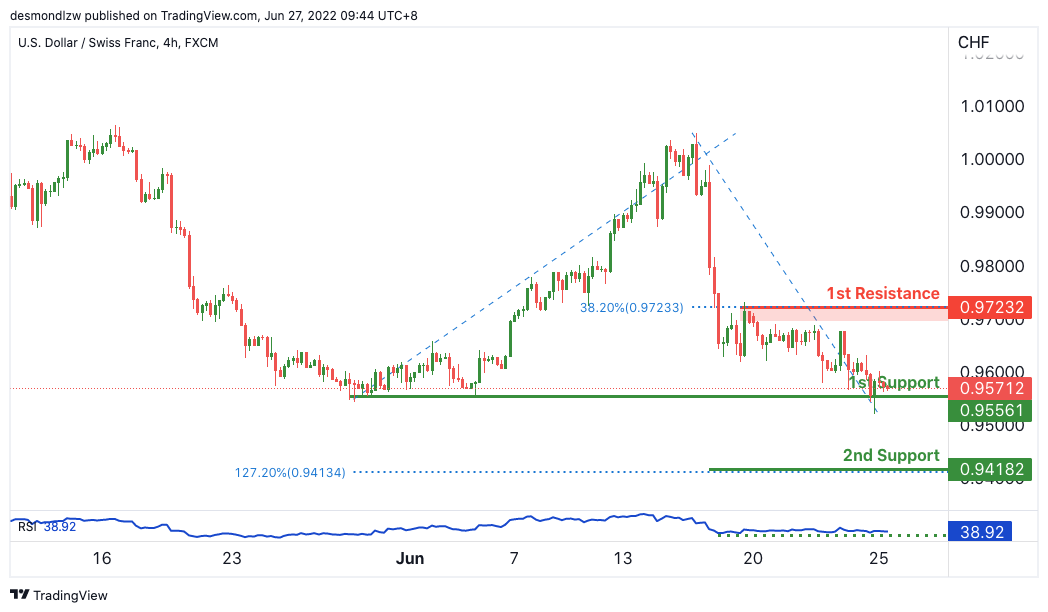
On the H4, with price expected to bounce off the stochastics indicator, we have a bullish bias that price will rise from our 1st support at 0.95561 where the horizontal swing low support is to our 1st resistance at 0.97232 in line with the horizontal swing high resistance and 38.2% Fibonacci retracement. Alternatively, price may break structure and head for 2nd support where the 127.2% Fibonacci extension is.
Areas of consideration
- 1st support level at 0.95561
- 1st resistance level at 0.97232
EUR/USD :
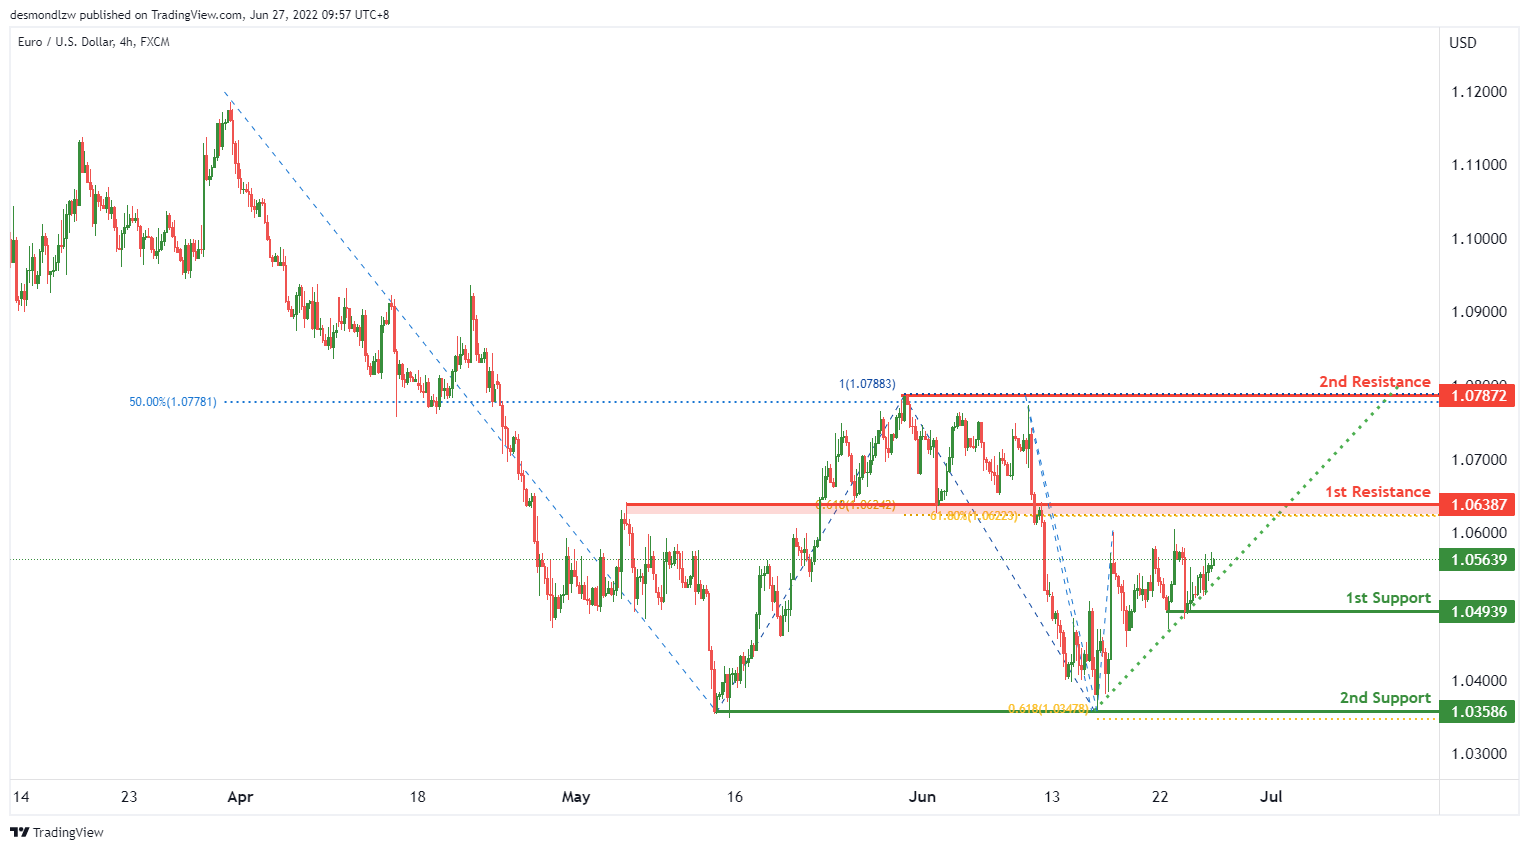
On the H4, with price moving in an ascending trendline and above the ichimoku cloud, we have a bullish bias that price will continue to rise from the 1st support at 1.05652 in line with the pullback support to the 1st resistance at 1.07859 at the swing high in line with the 100% fibonacci projection and 50% fibonacci retracement. Alternatively, price may drop from the 1st support to the 2nd support at 1.03586 at the horizontal swing lows in line with the 61.8% fibonacci projection.
Areas of consideration :
- H4 1st resistance at 1.07859
- H4 1st support at 1.05652
USD/JPY:
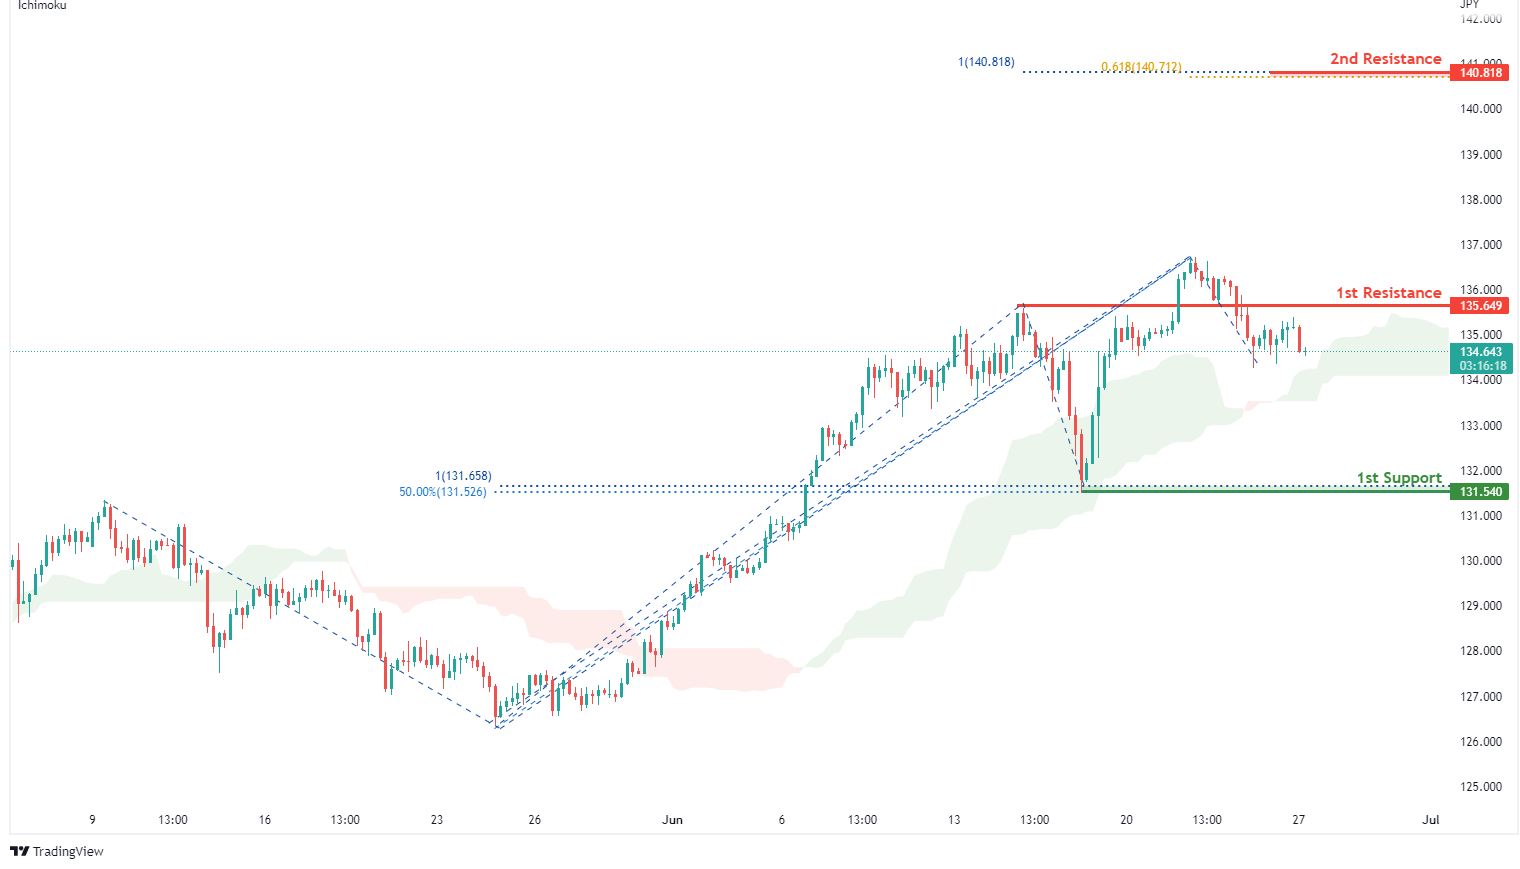
On the H4, with price moving above the ichimoku indicator, we have a bullish bias that price will rise to our 1st resistance at 135.649 where the pullback resistance is. Once there is upside confirmation, we would expect bullish momentum to carry price to our 2nd resistance at 140.818 where the 100% fibonacci projection and 61.8% fibonacci projection are . Alternatively, price may drop to 1st support at 131.540 in line with the swing low support, 100% fibonacci projection and 50% fibonacci retracement.
Areas of consideration:
- H4 time frame, 1st resistance at 135.649
- H4 time frame, 1st support at 131.540
AUD/USD:
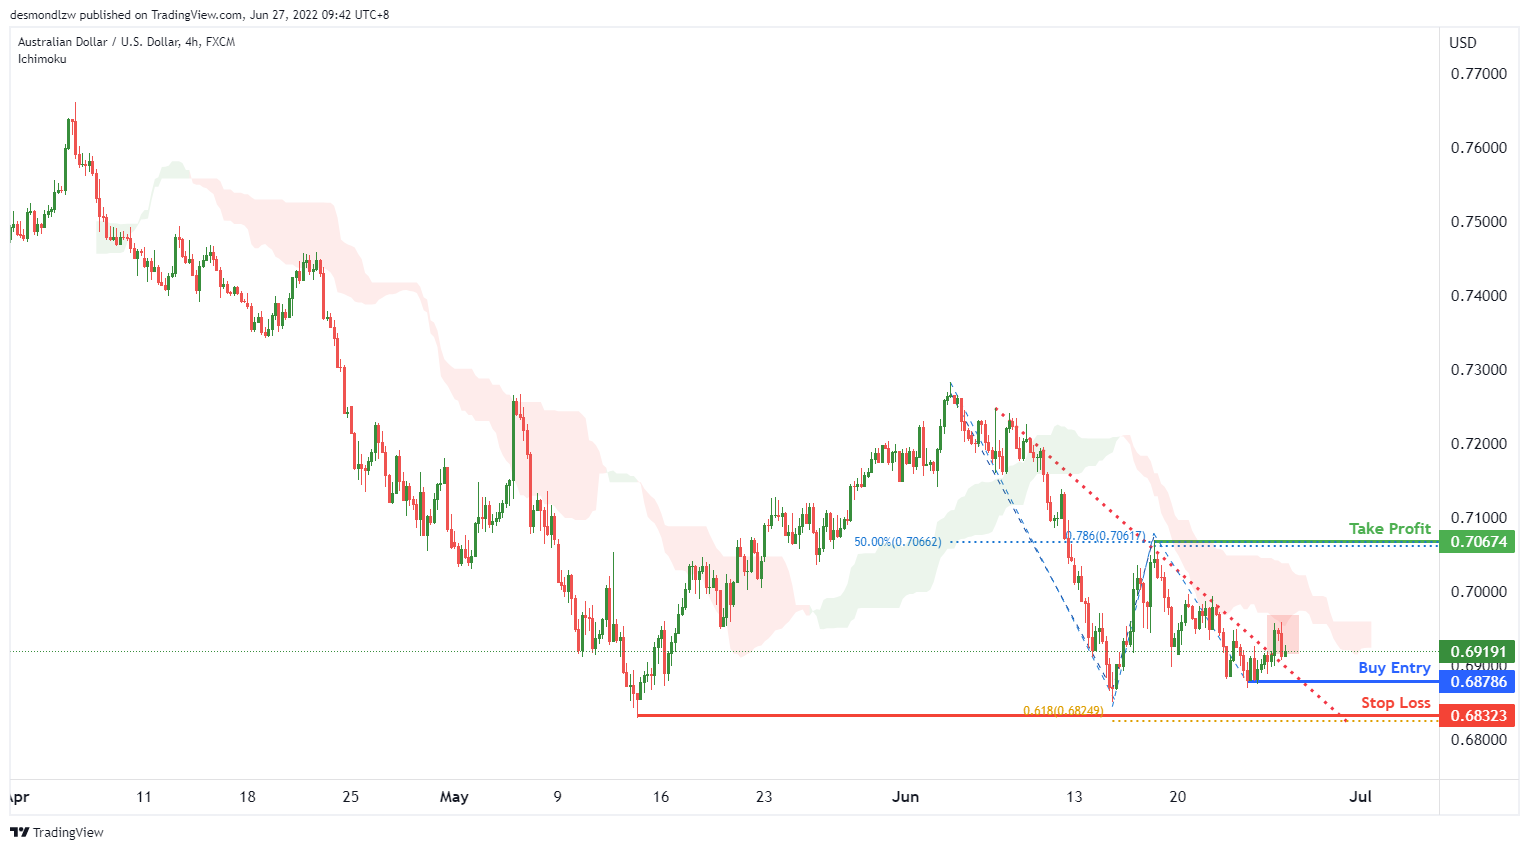
On the H4, with price breaking the descending trendline, we have a bullish bias that price will continue to rise from the 1st support at 0.68786 at the swing low to the 1st resistance at 0.70674 in line with the swing high and 78.6% Fibonacci projection and 50% Fibonacci retracement. Alternatively, price may reverse off the 1st support and drop to the 2nd support at 0.68323 in line with the horizontal swing low and 61.8% Fibonacci projection.
Areas of consideration
- H4 1st resistance at 0.69846
- H4 1st support at 0.68323
NZD/USD:
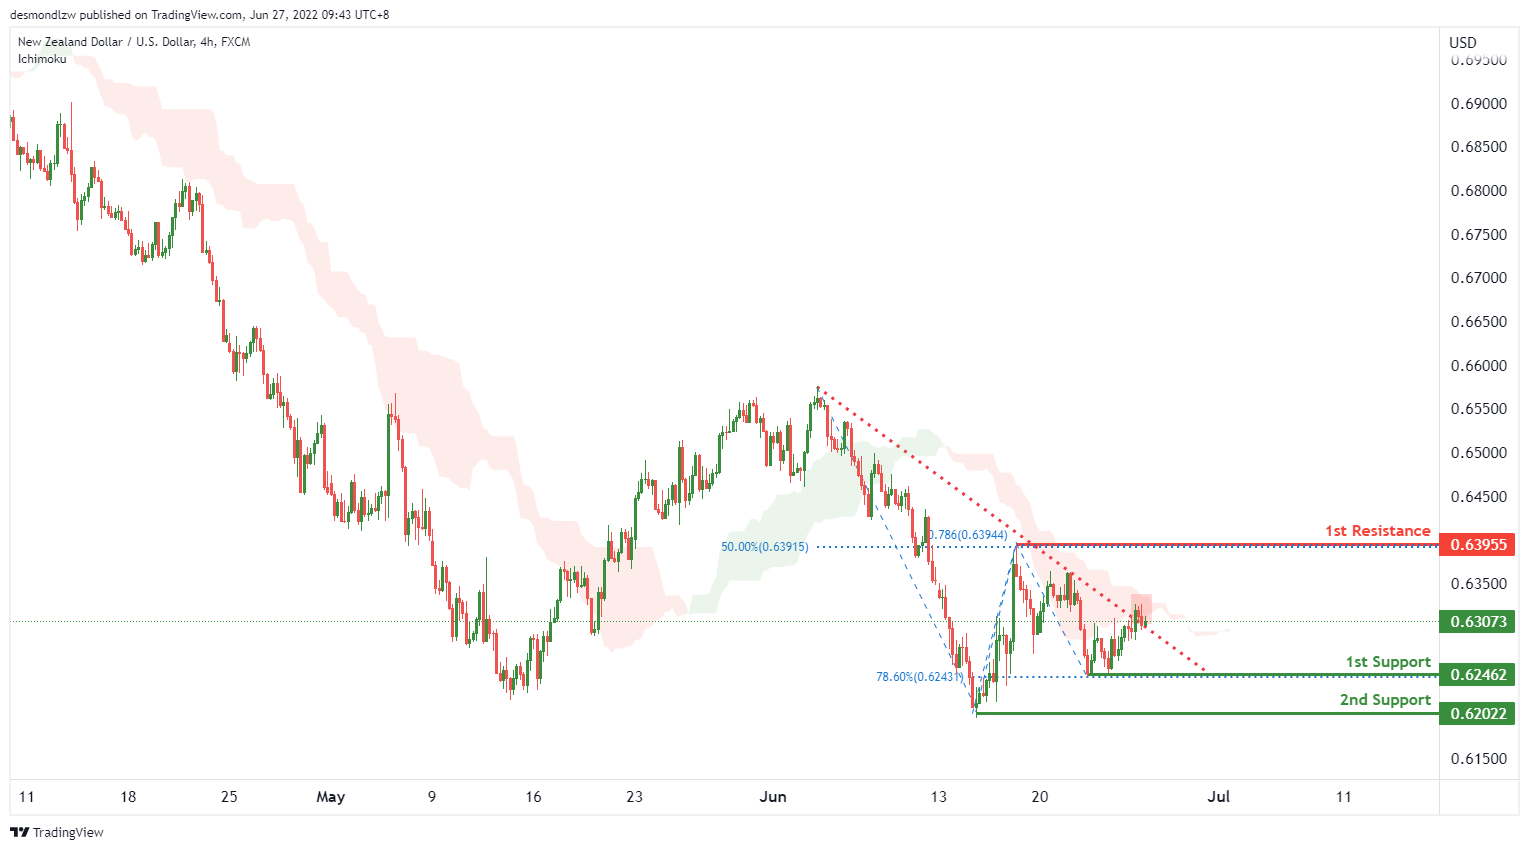
On the H4, with price breaking the descending trendline, we have a bullish bias that price will continue to rise from the 1st support at 0.62462 in line with the pullback support and 78.6% fibonacci retracement to the 1st resistance at 0.63955 in line with the swing high and 50% fibonacci retracement and 78.6% fiboancci projection. Alternatively, price may reverse off the 1st support and drop to the 2nd support at 0.62022 at the horizontal swing low.
Areas of consideration:
- H4 time frame, 1st support at 0.62462
- H4 time frame, 1st resistance at 0.63955
USD/CAD:
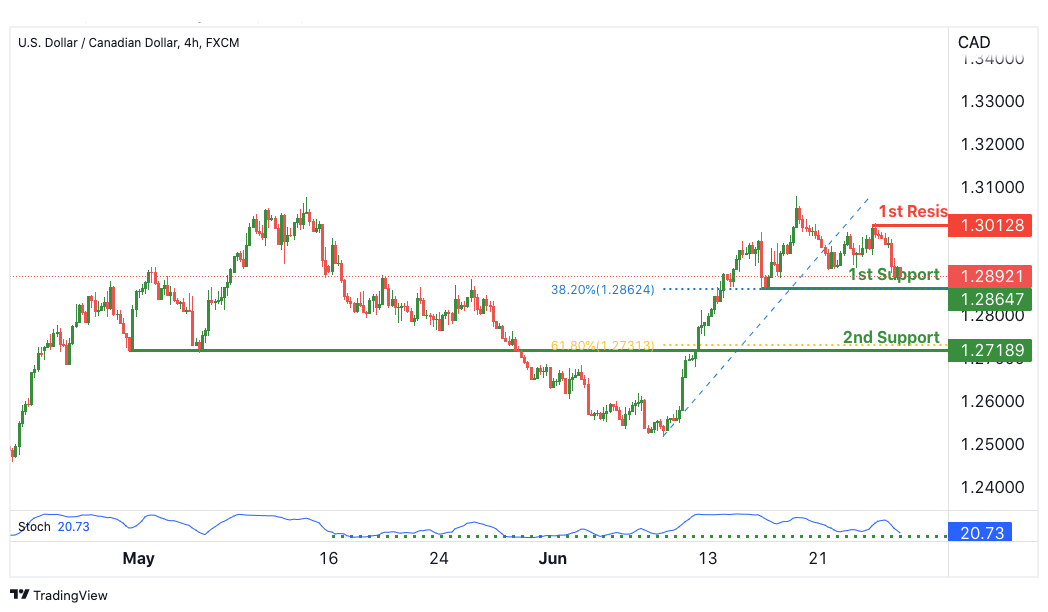
On the H4, with price expected to bounce off the stochastics indicator, we have a bullish bias that price will rise from our 1st support at 1.28647 where the horizontal swing low support and 38.2% Fibonacci retracement is to our 1st resistance at 1.30128 in line with the horizontal swing high resistance. Alternatively, price may break structure and head for 2nd support where the horizontal pullback support and 61.8% Fibonacci retracement.
Areas of consideration:
- H4 time frame, 1st resistance at 1.30128
- H4 time frame, 1st support at 1.28647
OIL:
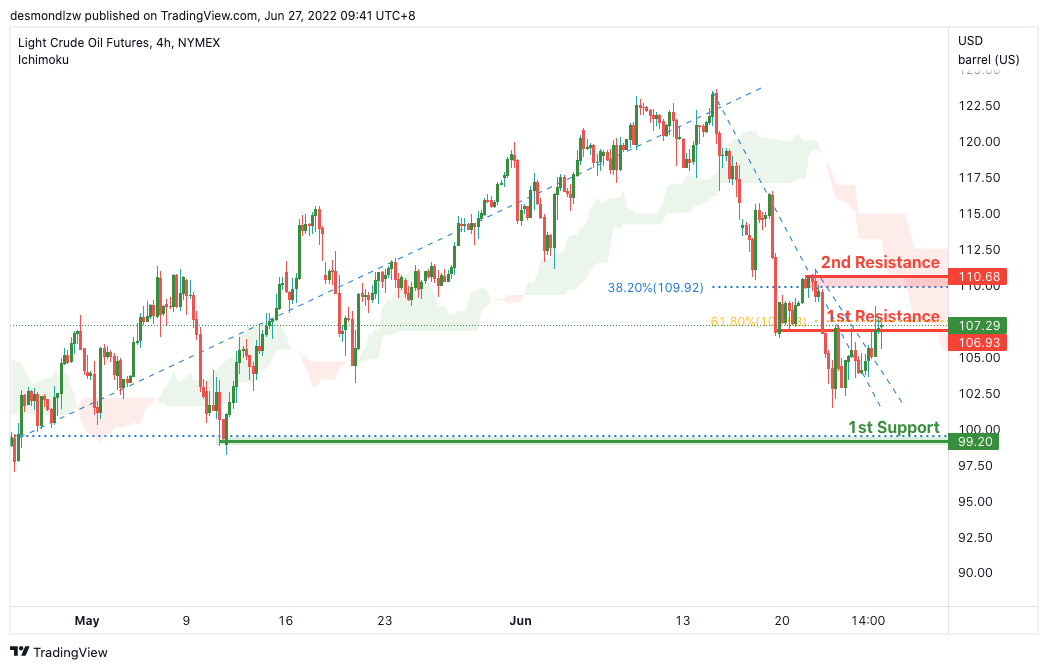
On the H4, with price moving below the ichimoku cloud, we have a bearish bias that price will rise from our 1st resistance where the horizontal pullback resistance and 61.8% Fibonacci retracement is to our 1st support in line with the horizontal swing low support. Alternatively, price may head for 2nd resistance where the horizontal pullback resistance is. Take note that we are waiting for the break of 1st resistance to confirm the bearish continuation.
Areas of consideration:
- H4 time frame, 1st resistance of 106.93
- H4 time frame, 1st support of 99.00
Dow Jones Industrial Average:
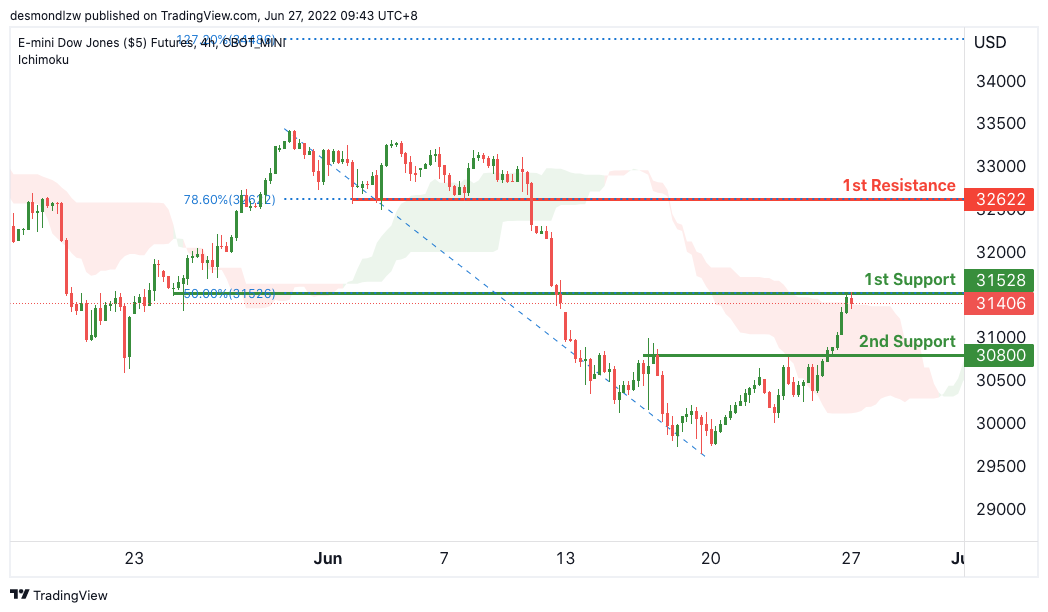
On the H4, with price breaking the ichimoku cloud, we have a bullish bias that price will rise from our 1st support at 31528 where the 50% Fibonacci retracement is to our 1st resistance at 32622 in line with the horizontal pullback resistance and 78.6% Fibonacci retracement. Alternatively, price may break structure and head for 2nd support where the horizontal pullback support.
Areas of consideration :
- H4 time frame, 1st resistance at 32622
- H4 time frame, 1st support at 31528
Oil Breaks Below Trendline; Just a Setback or a Shift in Outlook?
It’s been a stellar year for commodities as geopolitical turmoil and the pandemic have sparked a global supply crunch in industrial, energy and agricultural commodities. But whilst higher industrial commodity prices are a headache for manufacturers and the astronomical jump in food prices is worrisome, it is energy prices that are causing the most pain, especially for policymakers. However, there finally seems to be some reprieve as oil prices have pulled back substantially from this month’s peaks, threatening the upward formation that started in December. So is this just another dramatic correction, or is the tide finally turning for the oil rally?
Geopolitical tensions have been good for oil prices
There can be no question that the war in Ukraine and subsequent sanctions on Russian energy exports have been a boon for oil. The market was already tight enough as it is. OPEC has been easing its supply curbs extremely gradually, while the recovery in demand from economies around the world re-opening has exceeded expectations. With many OPEC members struggling to meet the higher output quotas due to various production constraints, the ban on Russian oil by Western nations couldn’t have come at a worst time.
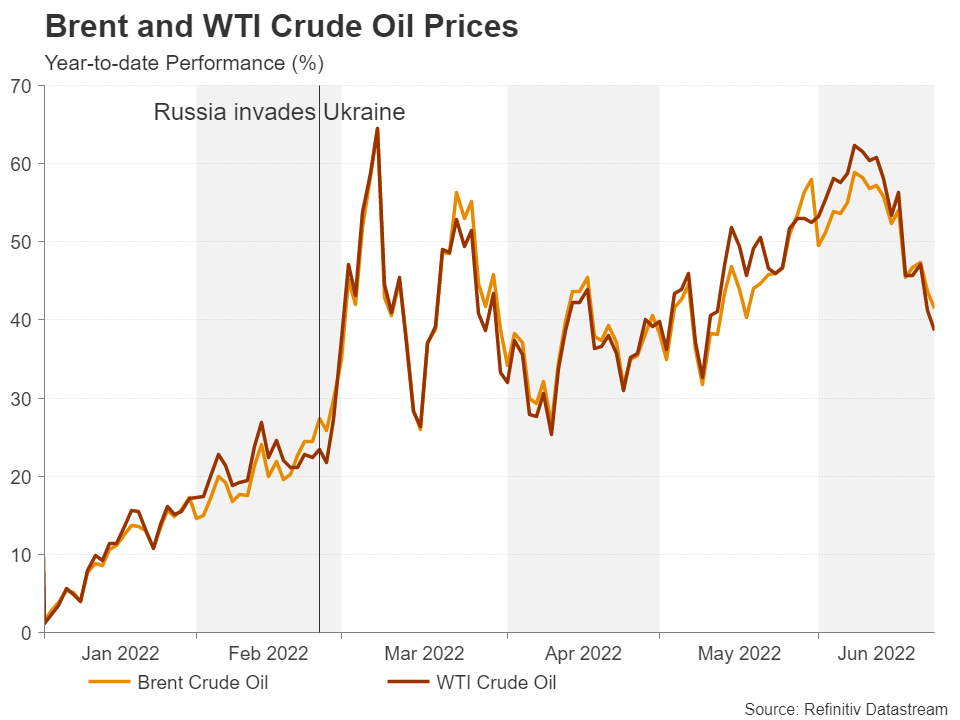
Oil prices have rallied by an incredible 40% so far in 2022, even after the recent dip. The gains stood at more than 75% at one point in March at the height of the Ukraine crisis. But this was followed by a sharp correction before prices began to head higher again. Up until now, the ascending trendline taken from the December low has successfully defended the rally, acting as a strong support, particularly in April and May when it was tested several times. And this is what’s different about the latest selloff.
A bearish signal?
WTI futures have broken below this crucial trendline, casting doubt about the rally’s prospects, at least in the short term. The broader uptrend that goes all the way back to the April 2020 crash is still intact. The question is, how far south will the current slide go?
After weeks of rising concern about oil shortages and supply likely getting even tighter, the outlook has unexpectedly started to deteriorate. Fears that central banks will tip their economies into a recession as they strive to get inflation under control are intensifying.
Demand outlook has become foggier
Inflation is skyrocketing everywhere and continues to surprise on the upside, defying predictions that it would have peaked by now. The surge in oil prices is mostly to blame for this, although the ongoing supply-chain disruptions are also a big factor.
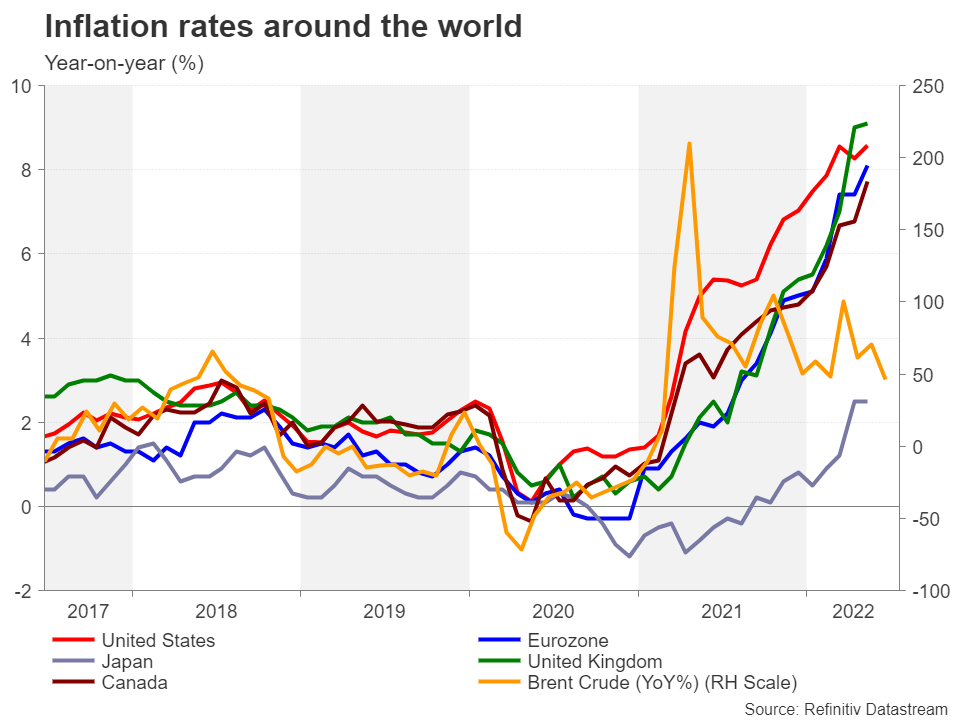
With consumers feeling the squeeze not just from higher fuel prices but increasingly from price hikes across a broad range of goods and services, the International Energy Agency’s forecast that demand for oil would exceed pre-pandemic levels in 2023 might have been a little on the optimistic side. Should economies in Europe and North America end up in a recession before the year-end, the hit to demand would likely be even more significant.
All the talk of a recession alone is proving to be quite a drag on oil prices. But another headwind – a potentially bigger one - for the commodity is investors re-evaluating how tight the market really is. Although a raft of countries have imposed either restrictions or an outright ban on Russian crude, several large importers of energy are still buying from Russia.
Russian sanctions might not be working
Countries such as India and China are importing more oil from Russia than ever before, and Moscow has been rerouting its shipments to further afield in the face of embargos from its European neighbours. This adds an entirely different dimension to the thinking that millions of barrels of Russian oil would be taken off the market by Western sanctions. The picture that is emerging is that several Asian nations are switching to discounted Russian oil and buying less from Middle East producers, which in turn are now selling more to Europe, substituting the imports from Russia.
If recession risks continue to weigh on sentiment and more investors come to the realisation that the oil sanctions have only had a modest impact on global supply, the latest downside correction could go a lot deeper.
Is there more downside on the way?
WTI futures are hovering around the 38.2% Fibonacci retracement of the December-March uptrend at the moment. Another tumble would see the $100 a barrel mark being breached and the price would then test the defensive barrier formed by the 200-day moving average and the longer-term ascending trendline. If this support is broken too, the bullish structure would be eroded and the outlook would almost certainly turn neutral.
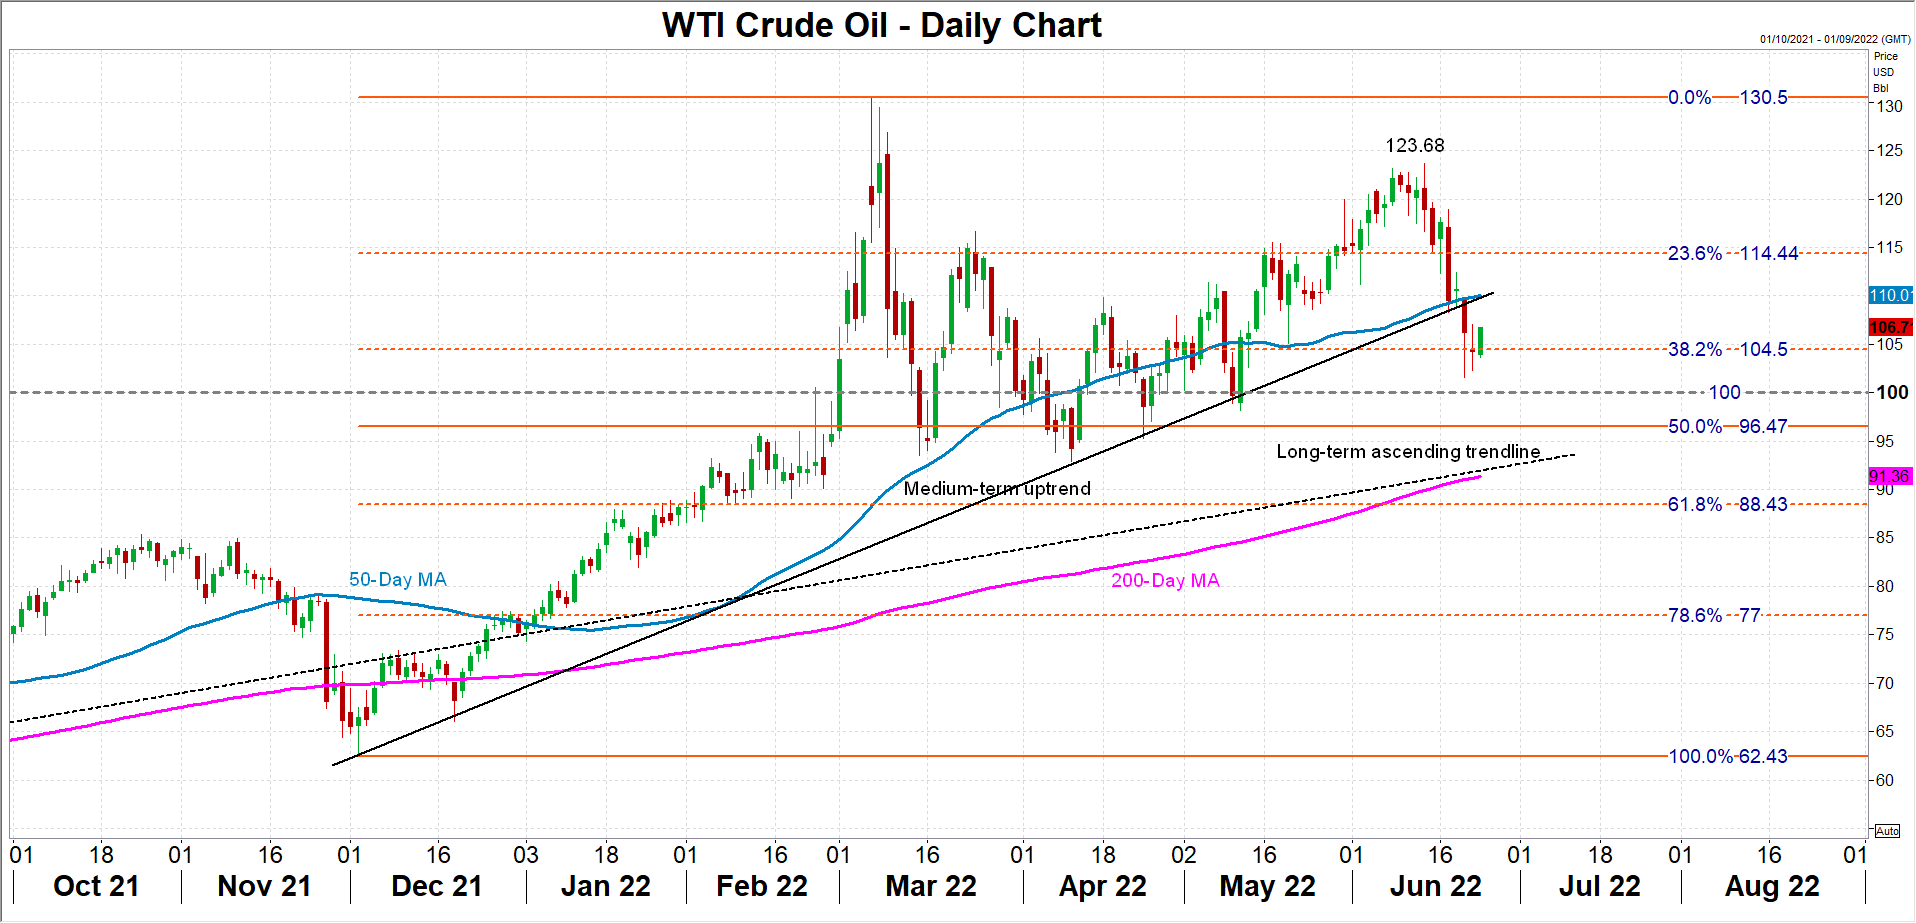
But oil has made a comeback before when it’s violated trend lines. The current upward stretch took off from the lows reached after the price fell beneath below the long-term uptrend line in late November. In the event of a rebound, the price is likely to stumble near $110 where the 50-day moving average is converging with the medium-term ascending line. Successfully overcoming this resistance would clear the path towards the June top of $123.68 and reinforce the positive outlook.
Recession worries vs supply constraints
There are several factors that could shift the oil narrative back to being about supply tightness. The White House is piling pressure on US producers to do more to boost output and President Joe Biden will be travelling to Saudi Arabia next month to convince his counterpart to do the same. If these efforts prove to be in vain, and moreover, fears of a recession do not materialize, the prospect for oil would be very bullish.
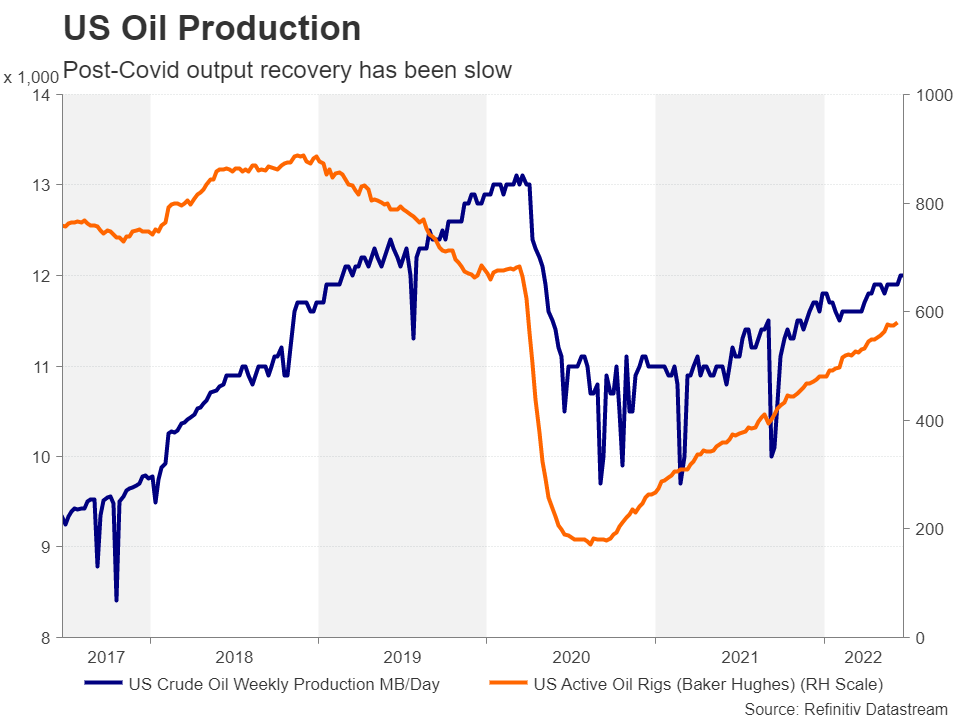
But as things stand, the negative risks are slightly greater. Slowly but surely, global oil production is returning to pre-pandemic levels, even with the sanctions on Russia and the absence of an Iranian nuclear deal, and near-term demand is being disrupted by China’s zero-Covid policy as well as the travel chaos in the airline industry due to staff shortages.
It’s worth pointing out that the situation in Ukraine remains highly volatile and a fresh crisis could easily trigger another jump in energy prices. But unless recession jitters start to recede over the coming weeks or months, it will be difficult for oil prices to hold onto their post-Covid upward trajectory and the chances of a new consolidative phase would increase.
Eco Data 6/27/22
[php_everywhere instance="1"]
Forex and Cryptocurrency Forecast
EUR/USD: Just a Calm Week
The last week was quite calm for the EUR/USD pair. It moved along the Pivot Point 1.0500, and the maximum range of fluctuations was less than 140 points (1.0468-1.0605), which is quite small for today.
President Joe Biden's appeal to the US Congress, with the exception of a proposal to introduce a tax holiday on fuel for 3 months, was, in fact, about nothing. And the federal tax on gasoline is only 18 cents per gallon, which is less than 4%. So, in such a short period of time, this measure will not have any effect on the economy, much less tame inflation.
As for the Fed, its head Jerome Powell, speaking in Congress, did not say anything new either. He only confirmed that, despite the threat of a recession, his organization will continue to fight inflation by tightening monetary policy. These intentions were also confirmed by Powell's colleague Michelle Bowman, a member of the Fed's Board of Governors, who stated that raising the key rate by 0.75% in July and by at least 0.50% at the next few meetings of the FOMC (Federal Open Market Committee) is not only appropriate, but also necessary.
There were no surprises in the words of both officials, and the markets, apparently, have already included this increase in their quotes for a long time. However, the yield on 10-year US bonds corrected against this backdrop to the lowest level in the last two weeks, falling from 3.5% to 3%. Stock Markets (S&P500, Dow Jones and Nasdaq), as well as other risky assets, on the contrary, grew slightly. This was facilitated by the absence of any significant events on the Ukrainian-Russian front and the associated decline in prices for natural energy resources. So, for example, the cost of oil has decreased by about 10-13% over the past 10 days.
The macro statistics released on Thursday, June 23, although caused an increase in volatility initially, eventually returned the EUR/USD pair to the equilibrium point like a swing. The reason is that business activity in both the EU and the US turned out to be noticeably worse than expected. In the Eurozone, the index of business activity in the manufacturing sector, according to the forecast, should have decreased from 54.6 to 54.0, but actually fell to 52.0 points. The index of business activity in the services sector has similar indicators: it fell from 56.1 to 52.8 instead of the expected 55.8 points. Thus, the composite index Markit lost 2.9 points instead of 0.6, falling from 54.8 to 51.9 (forecast 54.2).
Following the European one, the similar American statistics came out, which turned out to be no less disappointing. Thus, the index of business activity in the manufacturing sector fell by as much as 4.6 points to 52.4 (previous value 57.0, forecast 56.0). A similar indicator in the service sector turned out to be slightly better: a drop from 53.4 to 51.6 points (forecast 53.0). As a result, the composite index of business activity decreased from 53.6 to 51.2 points, instead of the forecasted 52.8 points.
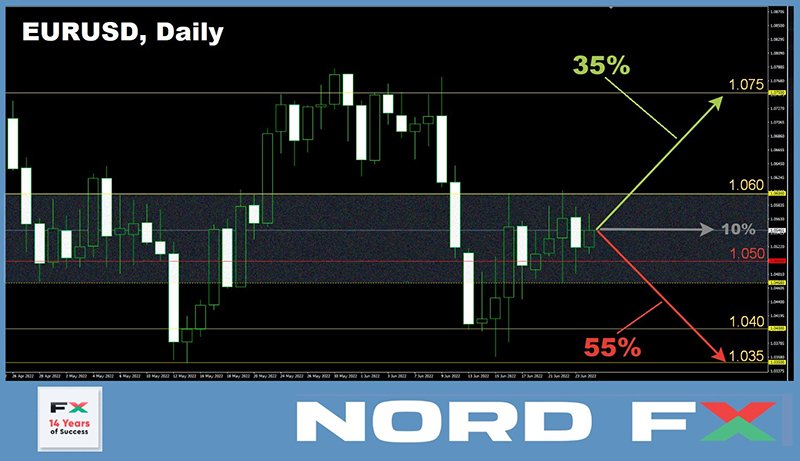
EUR/USD ended the trading session at 1.0555. At the time of writing the review, on the evening of June 24, the votes of experts are divided as follows: 35% side with the bulls, 55% - with the bears, and 10% cannot decide on the forecast. The readings of the indicators on D1 look quite chaotic. Among the oscillators, 35% are colored red, 25% are green and 40% are neutral gray. Among the trend indicators, 60% are red and 40% are green. The nearest strong resistance is located in the 1.0600 zone, if successful, the bulls will try to break through the 1.0640 resistance and rise to the 1.0750-1.0770 zone, the next target is 1.0800. Apart from 1.0500, the number 1 task for the bears is to break through the support around 1.0470, and then update the May 13 low at 1.0350. If successful, they will move on to storm the 2017 low of 1.0340, there is only support from 20 years ago below.
As for the upcoming week, data on the US consumer market will be released on Monday June 27, the German consumer market data on June 29 and 30, and Eurozone consumer prices (CPI) on Friday July 01. The value of the US Manufacturing PMI will be published on July 01 as well. In addition, it is worth paying attention to the data on US GDP (Q1), which will become known on June 29. In addition, a whole series of speeches by the head of the ECB, Christine Lagarde, is scheduled for the week: she will speak on June 27, 28 and 29. There will also be a performance by her overseas colleague Jerome Powell, but only one, on Wednesday, June 29.
GBP/USD: Looking for Drivers
Having started the five-day period at 1.2216, the GBP/USD pair ends it at 1.2280. And if in the period from June 13 to June 17, the maximum range of fluctuations exceeded 470 points, it was 3 times less last week, keeping within just 160 points. This lull was caused largely by the absence of high-profile macroeconomic events. However, it also suggests that the market cannot decide what to do with the pound, and is looking for drivers that can move the pair in one direction or another.
According to some analysts, the strengthening of the British currency is hindered by political instability. Prime Minister Boris Johnson already survived a vote of no confidence in June, with several lawmakers from his own Conservative Party voting against him. In addition, after the by-elections, the party lost two seats in the UK Parliament.
In terms of the national economy, retail sales fell 0.5% m/m in May according to the Office for National Statistics. This turned out to be slightly better than market expectations, which predicted a decline of 0.7%. But it did not help the British currency much, as the annual figure reached 9.1%, updating the 40-year high. The main contribution to the growth of inflation was made by the increase in prices for fuel and food products.
According to some experts, inflation in the United Kingdom will continue to grow and may exceed 11% by November. It is clear that this causes discontent among the population, as it reduces the level of income, depreciates savings, and also undermines the current purchasing power. To combat this evil, the Bank of England (BOE) raised its key rate from 1.00% to 1.25% on June 16. As a result, the British currency gained 365 points in just a few hours. But can the regulator, just like the US Federal Reserve, not be afraid of the economy slipping into recession and continue to regularly increase the cost of borrowing? Many traders and investors doubt this.
At the moment, 40% of experts believe that the GBP/USD pair will try to test the resistance of 1.2400 again in the near future, 25%, on the contrary, are waiting for a support test in the 1.2170-1.2200 area, the remaining 35% of analysts have taken a neutral position.
Among the trend indicators on D1, the balance of power is 75-25% in favor of the reds. There is no such clear advantage among oscillators: only 45% are pointing to a fall, 25% are looking in the opposite direction, and the remaining 30% are looking east. Supports are located at levels 1.2170-1.2200, then 1.2075 and 1.2040. The pair's strong foothold lies at the psychologically important 1.2000 level, followed by the June 14 low at 1.1932. In case of growth, the pair will meet resistance in the zones and at the levels of 1.2300-1.2325, 1.2400-1.2430, 1.2460, then the targets in the area of 1.2500 and 1.2600 follow.
As for the macroeconomic events of the coming week regarding the United Kingdom, we can highlight the publication of data on the country's GDP for the Q1 2022 on Thursday, June 30. The speech of the Governor of the Bank of England Andrew Bailey, which will take place the day before, on Wednesday, June 29, may also be of interest. And the business activity index (PMI) in the UK manufacturing sector will be published at the very end of the working week, on Friday, July 01.
USD/JPY: "Head" and "Shoulders" Are Visible. What's next?
The USD/JPY formed a classic technical analysis head and shoulders pattern over the past week. Starting from 134.95, it rose to the height of 136.70, then rolled back to the local low of 134.25, and finished at 135.20.
The divergence between the monetary policies of the Bank of Japan and the US Federal Reserve helped to update the 24-year high once again, having risen to 136.70 on Wednesday, June 22. We have already written about this many times. As for the subsequent rollback down, the reason is most likely the June decline in world prices for mineral fuels, on which the country's economy is highly dependent, as well as the fall in the yield of 10-year US Treasuries.
It is common knowledge that there is a direct correlation between 10-year US Treasury bills and the USD/JPY currency pair. And if the yield of these securities falls, the yen shows growth against the dollar, and the USD/JPY pair forms a downtrend. This is what we observed in the second half of the week, when the yield on government bonds fell to 3%.
Reuters reported that Japan's annual core consumer inflation in May exceeded the central bank's target of 2% in May for the second consecutive month. Which is a signal of increasing pressure on the fragile Japanese economy due to rising world prices for raw materials.
A number of experts believe that the forecast of the Bank of Japan (BOJ) about the temporary nature of price growth is incorrect. Hence, the "super-dove" monetary policy of the regulator is wrong. Rising fuel and food prices driven by Russia's invasion of Ukraine and a weak yen that pushes up the cost of imports could keep inflation above the Bank of Japan's target for much of 2022, these analysts said.
Japanese officials do not deny this problem. Thus, the Government and the Bank of Japan issued a joint statement on June 17 stating that they are concerned about the sharp fall in the national currency. Seiji Kihara, Deputy Chief Cabinet Secretary of Japan, also said that the impact of inflation on consumer sentiment will be closely monitored. However, according to Masayoshi Amamiya, Deputy Governor of the Japanese Central Bank, the country's economy is gaining momentum, so the BOJ will continue to adhere to a relaxed monetary credit policy.
Considering the above, the general fundamental background remains on the side of the USD/JPY bulls, and its current decline can be regarded as a correction from the previous multi-year highs, which was caused by lower fuel prices and a drop in Treasury yields.
Most analysts (50%) expect the correction to continue at least to the level of 133.00-133.50. 30% of experts have voted for the fact that the pair will once again try to renew the high and rise above 137.00, and 20% believe that the pair will take a breather, moving in a sideways trend. For indicators on D1, the picture is very different from the opinion of experts. 85% of the oscillators are colored green (of which 10% are in the overbought zone), the remaining 15% have taken a neutral position. For trend indicators, 85% point north and only 15% look south. The nearest support is located at 134.40, followed by zones and levels at 134.00, 133.50, 133.00, 132.30, 131.50, 129.70-130.30, 128.60 and 128.00. Apart from breaking the immediate resistance at 135.40 and the June 22 high at 136.70, further targets for the bulls are difficult to determine. Most often, such round levels as 137.00, 140.00 and 150.00 appear in the forecasts. And if the pair's growth rates remain the same as in the last 3 months, it will be able to reach the 150.00 zone in late August or early September.
As for the calendar for the coming week, we can mark Friday, July 01, when Tankan (Q2) sentiment indexes of large manufacturers and large non-manufacturing companies in Japan will be published.
CRYPTOCURRENCIES: BTC Forecast from the President of El Salvador
We called the last review "Bloodbath or $20,000 Battle". As for the past week, there was not much blood this time, but the battle for $20,000, as predicted, did not subside. The week's low was fixed at $17,597, the maximum at $21,667, and the BTC/USD pair met Saturday, June 25, at $21,350. At this point, the total crypto market capitalization was $0.960 trillion ($0.895 trillion a week ago). The Crypto Fear & Greed Index is still not going to leave the Extreme Fear zone and is at around 11 points out of 100 possible (7 points a week ago).
The general mood of the market is fully consistent with this Extreme Fear. The Internet is talking again about the death of bitcoin. According to Google Trends, the number of search queries on this topic has returned to its maximum levels, close to December 2017. Recall that at that moment, approaching the coveted $20,000, the main cryptocurrency turned around and flew down, losing more than 40% of its value in a few days. The only difference with that long-standing situation is that bitcoin was approaching the $20,000 level from below then, and it is from above now. And the market was looking for a top then, and for a bottom now. Moreover, according to a number of influencers, it is not at all necessary that the bottom is at this particular mark.
So, according to Peter Schiff, Euro Pacific Capital President, a well-known cryptocurrency critic, "so far, there are no signs of surrender, which usually forms the bottom of the bearish market". According to this gold supporter, the $20,000 mark will be the same "bull trap" as the $30,000 level was before. "Nothing falls in a straight line. It's actually a very ordered crash in slow motion," Schiff said. Recall that he predicted back in May that bitcoin would test $8,000. And he suggested in mid-June that the minimum could be even lower, around $5,000.
According to the president of Euro Pacific Capital, the collapse of the cryptocurrency market will be good for the economy. Kevin O'Leary, co-host of the business TV show Shark Tank, made a similar point. He believes that one should not be afraid of the bankruptcy of large companies during the crypto winter. "This is good for all other companies as they will learn from this. I think we will soon see a wave of bankruptcies in the cryptocurrency market. I don't know who it will be. Later you will recognize those who have taken a high-risk position. But I assure you I have seen this before. They have been destroyed, and that's good," said the millionaire.
The InvestAnswers crypto channel, in turn, named 3 possible catalysts for a further market collapse. The BTC price may fall even more if MicroStrategy CEO Michael Saylor decides to sell the bitcoins in the company's reserves. In addition, the potential collapse of the stablecoin Tether (USDT) and the problems of the cryptocurrency hedge fund Three Arrows Capital may also contribute to further capitulation of BTC. According to InvestAnswers, we should not forget about the possible sale of crypto assets by Tesla.
MicroStrategy reported a $1.2 billion loss last week due to the fall of bitcoin. As for the Three Arrows Capital fund, it now has about $2.4 billion left in assets out of $18 billion.
Big problems are experienced not only by investors, but also by miners. Due to the fall in the price of BTC and the increase in computational complexity, the total return from mining is now 65% lower than the average for the year. At the same time, the efficiency of the Antminer S19 ASIC from Bitmain is 80% worse than the level of November 2021, and the popular S9 model has lost profitability altogether. This situation has led to the fact that mining companies are forced to sell their BTC holdings in order to pay off loans and cover current operating costs, which puts pressure on the market. Their remaining reserves are estimated at 46,000 coins (about $920 million). In the event that these bitcoins are also thrown into sale, quotes will certainly fall further down.
An analyst aka Capo, who had correctly predicted the collapse of the cryptocurrency market this year, updated his forecast. In his opinion, BTC expects a decline to $16,200, and ETH to $750. According to Capo, investors are fooling themselves into believing that a short-term rally means bitcoin is bottoming the cycle: "Bull trap. Funds from altcoins flow into BTC, which will also be sold, but a little later. There is no bottom yet," he said.
According to another specialist, crypto strategist Kevin Svenson, bitcoin has a chance to bottom in the $17,000-18,000 range, after which a short-term rally to above $30,000 may occur. At the same time, although Svenson expects this short-term growth, he does not see the prerequisites for launching a new bull market in the near future: "Overcoming the main downward resistance is the main obstacle and the process may last until the end of the year." According to the strategist, after the breakthrough of the diagonal resistance, bitcoin can trade in a narrow range for several months and start a new uptrend only by 2024 year.
Despite the low current rate of bitcoin, many participants in the crypto industry believe in its future growth. For example, there is a belief that BTC could reach $100,000 by 2025. One of those who supported such optimism was an analyst called PlanB, who built his forecasts based on the Stock-to-Flow (S2F) model. This model worked well for three years until March 2022, after which it failed.
The Daily Gwei creator Anthony Sassano and Ethereum co-founder Vitalik Buterin have recently criticized S2F, advising PlanB to delete their account.
The analyst reacted to criticism with restraint. He said that in the aftermath of the crash, many are looking for scapegoats, including leaders. PlanB then presented a graph of five different BTC price prediction models. According to the illustration, the most accurate picture is given by estimates based on the complexity and cost of mining the first cryptocurrency. The S2F model, in turn, offers an overly optimistic view.
Another expert, Benjamin Cowen, proposed his bitcoin bottoming model. He believes that the bottom can be predicted based on the correlation of inflation, the S&P 500 stock index and the BTC price. The analyst argues that the S&P 500 index does not historically sink to the very bottom until inflation peaks and reverses. Accordingly, BTC cannot reach the bottom for the same reason. "Macroeconomic indicators look incredibly bleak at the moment. If you go back to the 1970s, you'll see a very similar type of move where the S&P bottomed just as inflation hit its first peak. By this point, the S&P was down about 50%," writes Cowen.
And to conclude the review, one more "prediction model", which we put in our humorous crypto life hacks section. It was presented by the President of El Salvador, Nayib Bukele. "My advice is to stop looking at charts and enjoy your life. If you have invested in BTC, your investment is safe, its value will rise immeasurably after the end of the bear market. The main thing is patience," he wrote. For reference, there are 2,301 BTC in El Salvador's public bitcoin fund, purchased at an average price of $43,900. Thus, at the moment, the loss on them is about 55%. But, according to the "model" of Nayiba Bukele, this "trifle" should not be paid attention to. The main thing is to get the most out of life!
EUR/USD Weekly Outlook
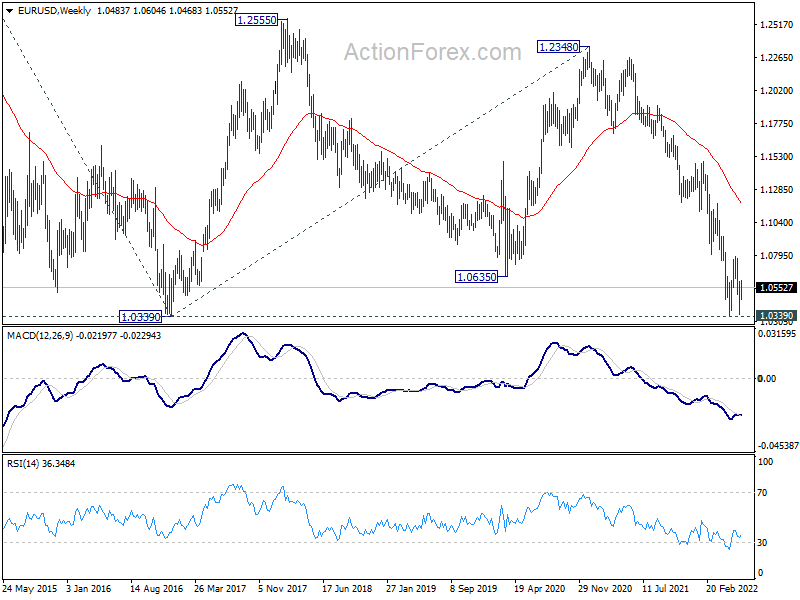
EUR/USD stayed in range of 1.0348/0786 last week and outlook is unchanged. Initial bias remains neutral this week first. Further fall is in favor with 1.0786 resistance intact. On the downside, sustained break of 1.0339/48 will resume larger down trend. Next target is long term projection level at 1.0090.
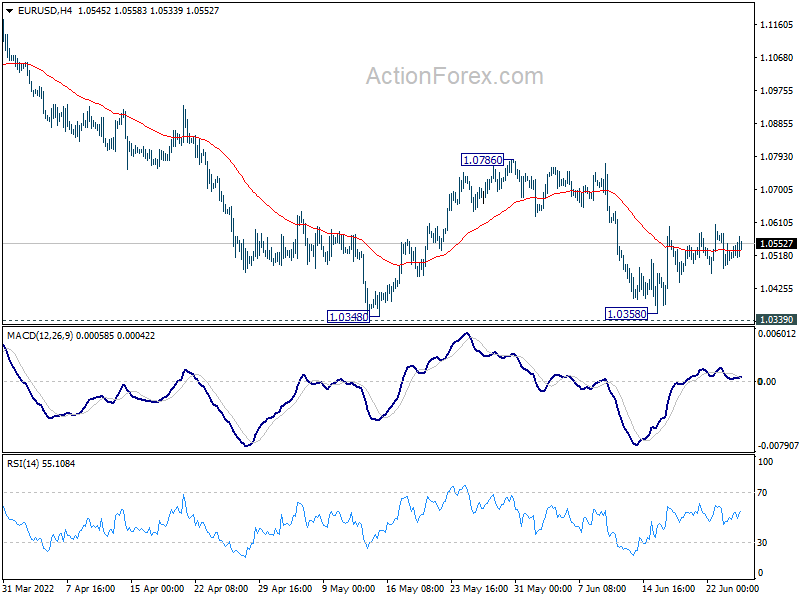
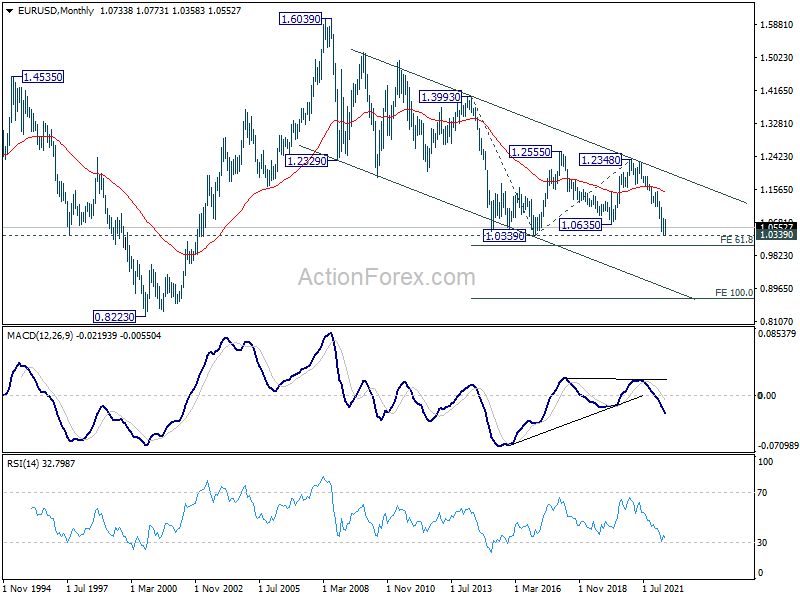
In the bigger picture, focus stays on 1.0339 long term support (2017 low). Decisive break there will resume whole down trend from 1.6039 (2008 high). Next target is 61.8% projection of 1.3993 to 1.0339 from 1.2348 at 1.0090. However, firm break of 1.0805 support turned resistance will delay this bearish case, and bring stronger rebound first.
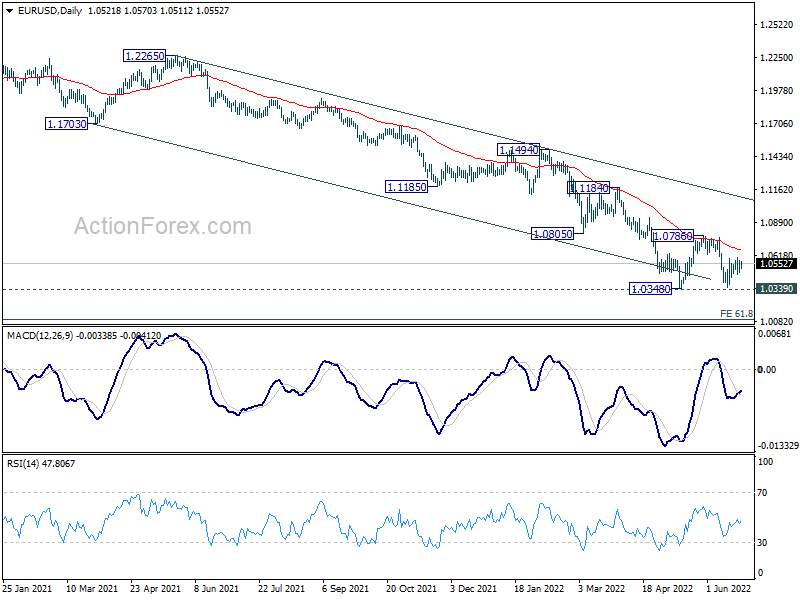
In the long term picture, current development suggests that long term down trend from 1.6039 (2008 high) is ready to resume. Break of 1.0339 will target 61.8% projection of 1.3993 to 1.0339 from 1.2348 at 1.0090. Decisive break there could bring downside acceleration towards 100% projection at 0.8694.
USD/JPY Weekly Outlook
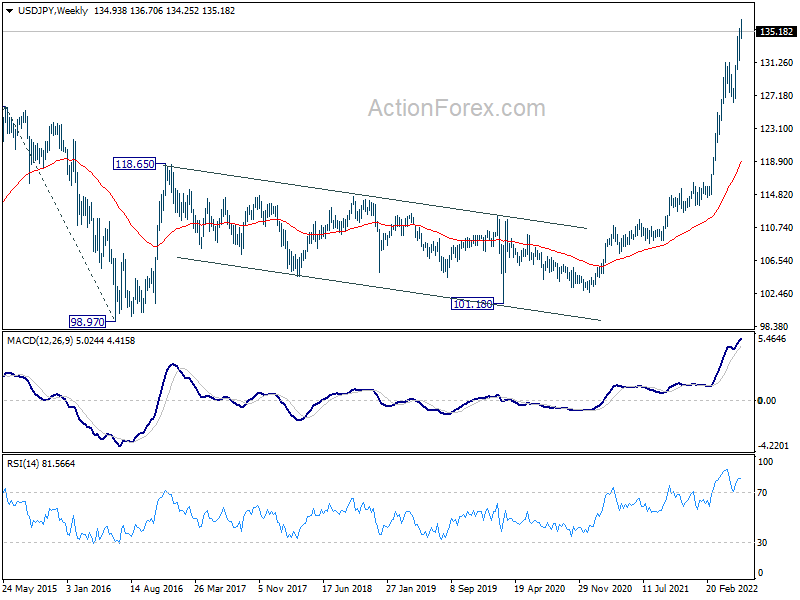
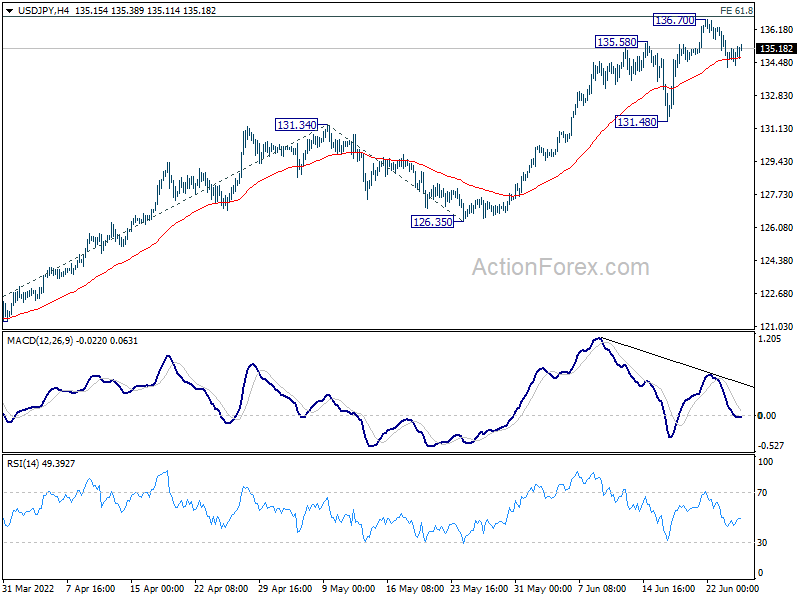
USD/JPY's up trend resumed last week and rose to 136.70, but retreated since then. Initial bias remains neutral this week for consolidations. Downside of retreat should be contained above 131.48 support to bring rebound. On the upside, break of 61.8% projection of 114.40 to 131.34 from 126.35 at 136.81 will target 100% projection at 143.29.
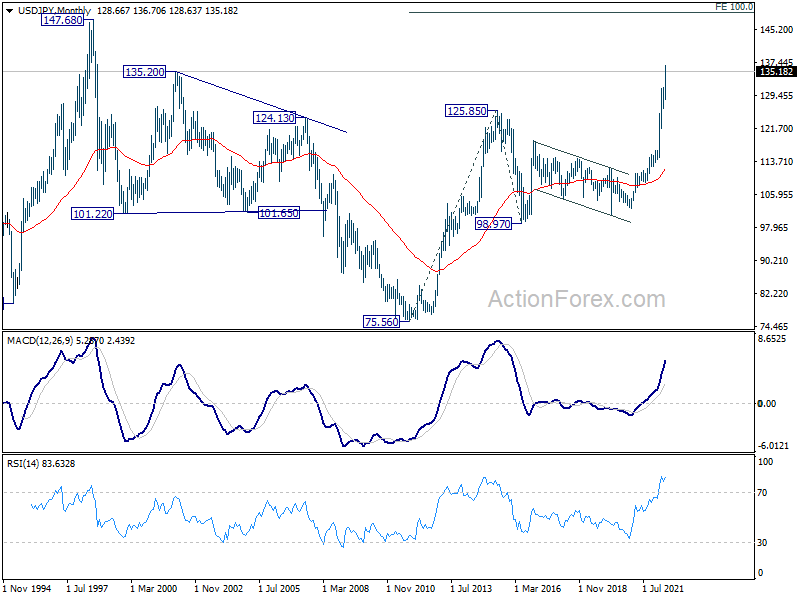
In the bigger picture, current rally is seen as part of the long term up trend from 75.56 (2011 low). Next target is 100% projection of 75.56 (2011 low) to 125.85 (2015 high) from 98.97 at 149.26, which is close to 147.68 (1998 high). This will remain the favored case as long as 126.35 support holds.
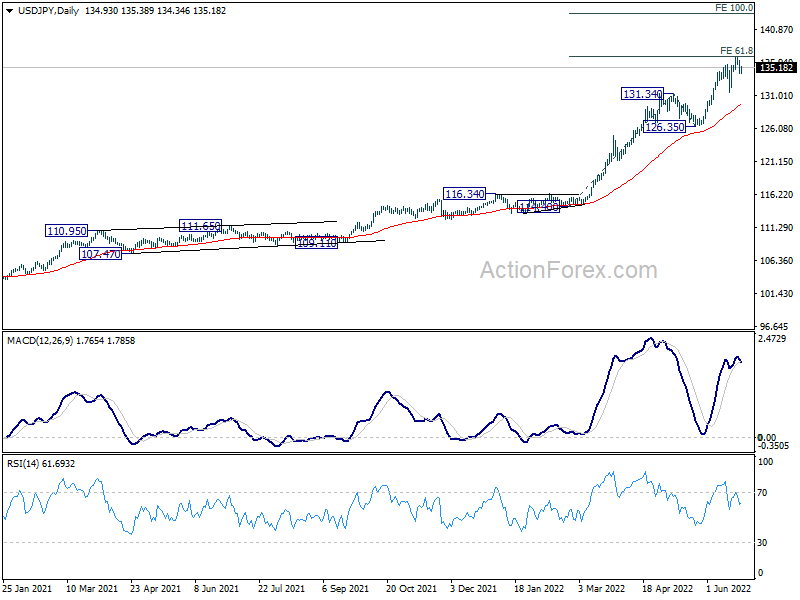
In the long term picture, the up trend from 75.56 (2011 low) long term bottom to 125.85 (2015 high) has just resumed. Next target is 100% projection of 75.56 (2011 low) to 125.85 (2015 high) from 98.97 at 149.26, which is close to 147.68 (1998 high).