Sample Category Title
GBP/USD Daily Outlook
Daily Pivots: (S1) 1.2236; (P) 1.2278; (R1) 1.2316; More...
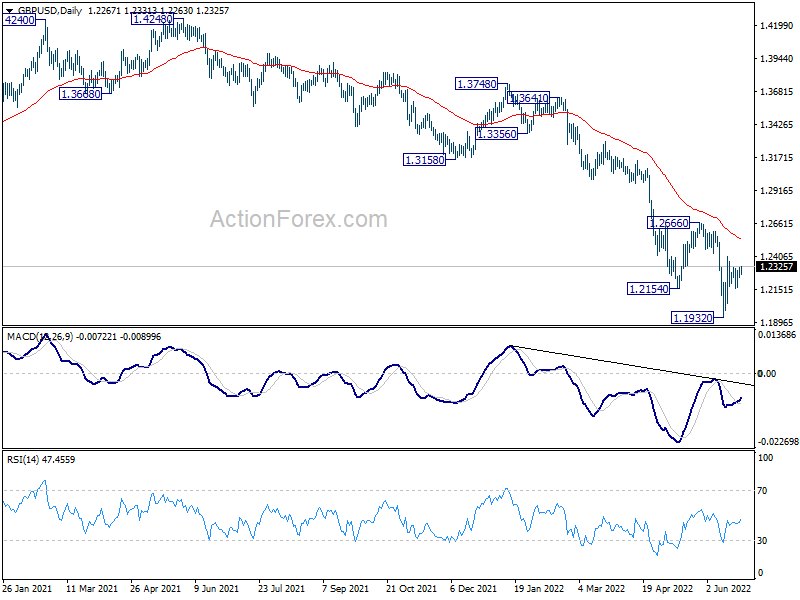
Range trading continues in GBP/USD and intraday bias remains neutral. Outlook stays bearish as long as 1.2666 resistance holds. On the downside, break of 1.1932 will resume larger down trend from 1.4248. However, firm break of 1.2666 will suggest medium term bottoming and bring stronger rebound back towards 1.3158 support turned resistance.
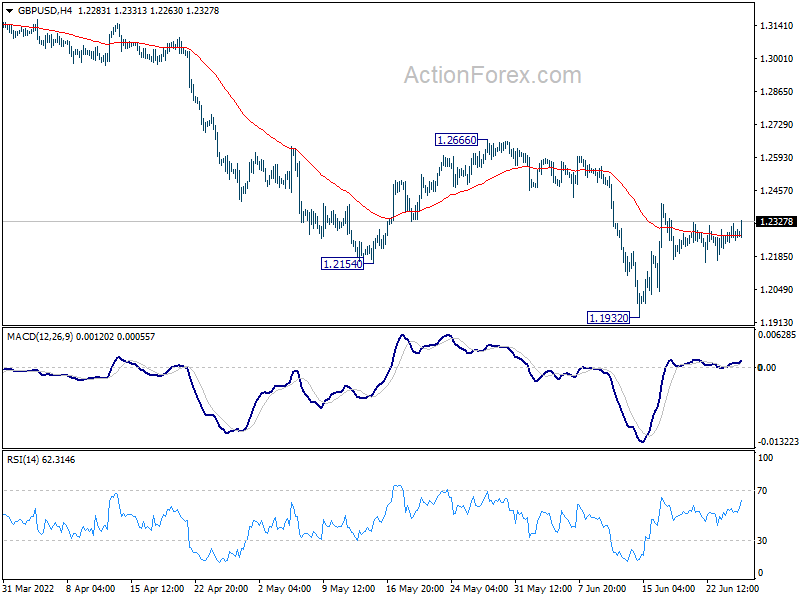
In the bigger picture, fall from 1.4248 (2018 high) could be a leg inside the pattern from 1.1409 (2020 low), or resuming the longer term down trend. Deeper decline is expected as long as 1.2666 resistance holds. Next target is 1.1409 low. However, firm break of 1.2666 will bring stronger rise back to 55 week EMA (now at 1.3140).
USD/CHF Daily Outlook
Daily Pivots: (S1) 0.9523; (P) 0.9578; (R1) 0.9634; More...
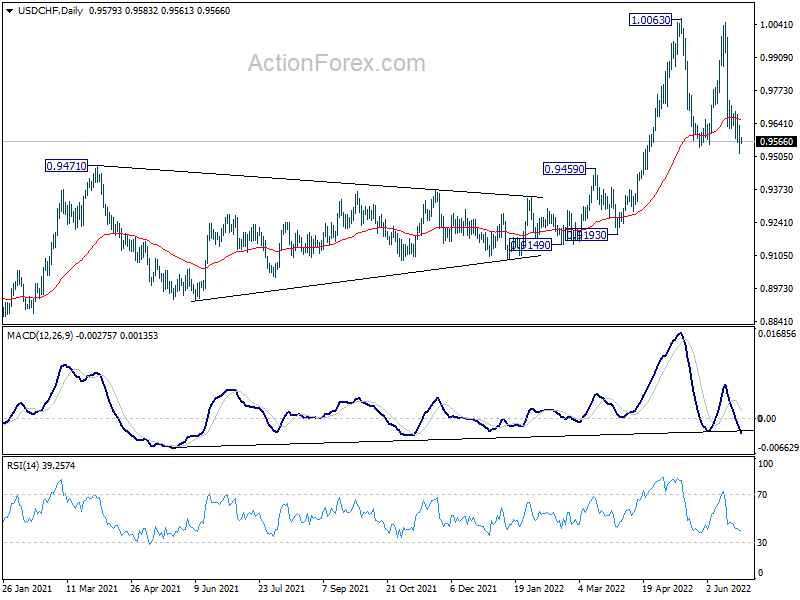
No change in the view that fall from 1.0048 is still seen as the third leg of the consolidation pattern from 1.0063. Strong support should be seen around 0.9543 to bring rebound. On the upside, above 0.9731 minor resistance will turn bias back to the upside for retesting 1.0063 resistance. However, sustained break of 0.9543 will bring deeper fall back to 0.9459 resistance turned support.
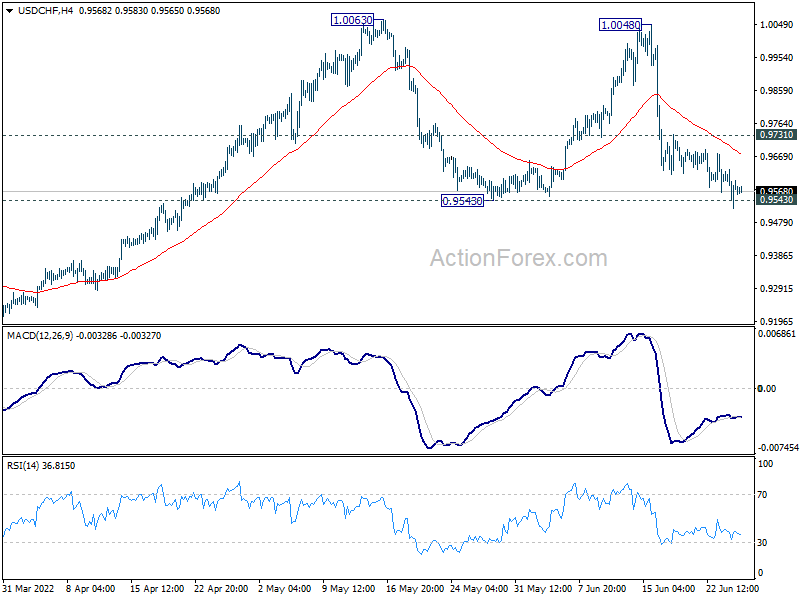
In the bigger picture, down trend from 1.0342 (2016 high) should have completed with three waves down to 0.8756 (2021 low) already. Rise from 0.8756 is likely a medium term up trend of its own. Next target is 1.0237/0342 resistance zone. This will remain the favored case as long as 0.9471 resistance turned support holds. However, sustained break of 0.9471 will extend long term range trading with another falling leg.
USD/JPY Daily Outlook
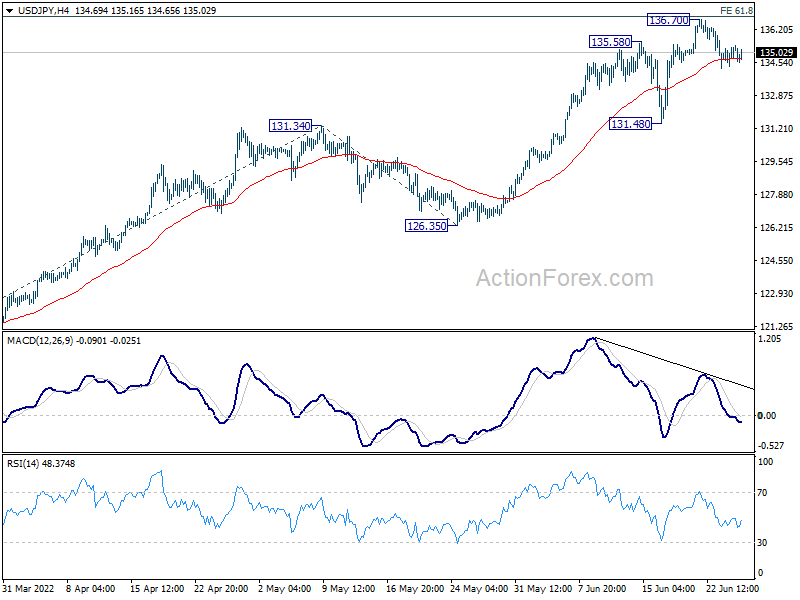
Daily Pivots: (S1) 134.59; (P) 134.99; (R1) 135.63; More...
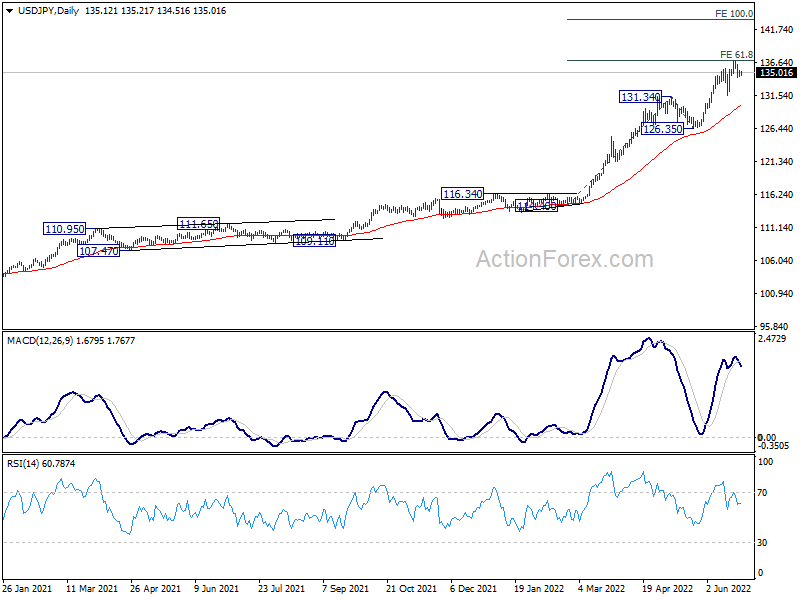
Intraday bias in USD/JPY remains neutral for consolidation below 136.70. Deeper retreat could be seen, but downside should be contained above 131.48 support to bring rebound. On the upside, break of 61.8% projection of 114.40 to 131.34 from 126.35 at 136.81 will target 100% projection at 143.29.
In the bigger picture, current rally is seen as part of the long term up trend from 75.56 (2011 low). Next target is 100% projection of 75.56 (2011 low) to 125.85 (2015 high) from 98.97 at 149.26, which is close to 147.68 (1998 high). This will remain the favored case as long as 126.35 support holds.
AUD/USD Daily Report
Daily Pivots: (S1) 0.6902; (P) 0.6930; (R1) 0.6972; More...
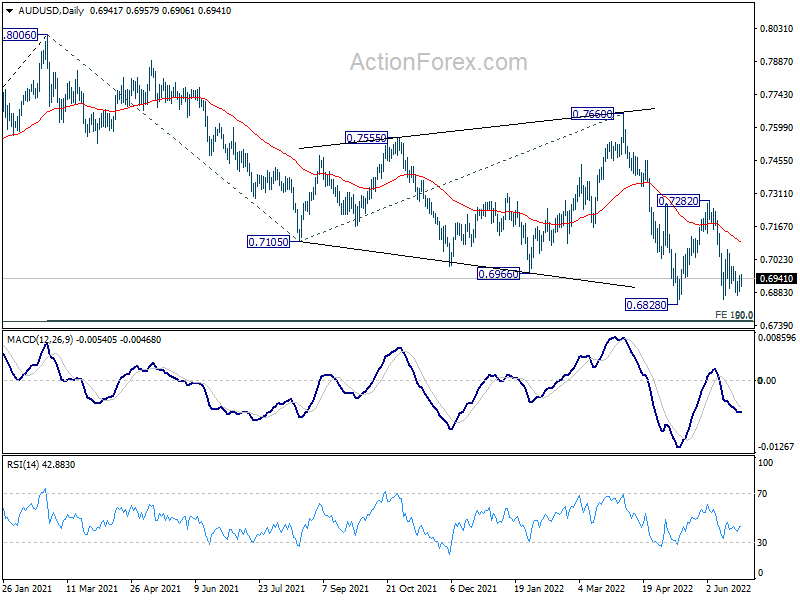
Sideway trading continues in AUD/USD and intraday bias remains neutral. On the downside, firm break of 0.6828 support will resume larger fall from 0.8006. Next target is 0.6756/60 cluster support. On the upside, above 0.7068 minor resistance will bring stronger rebound to 0.7282 resistance first. Firm break there will be a sign of bullish reversal and bring stronger rebound to 0.7666 resistance.
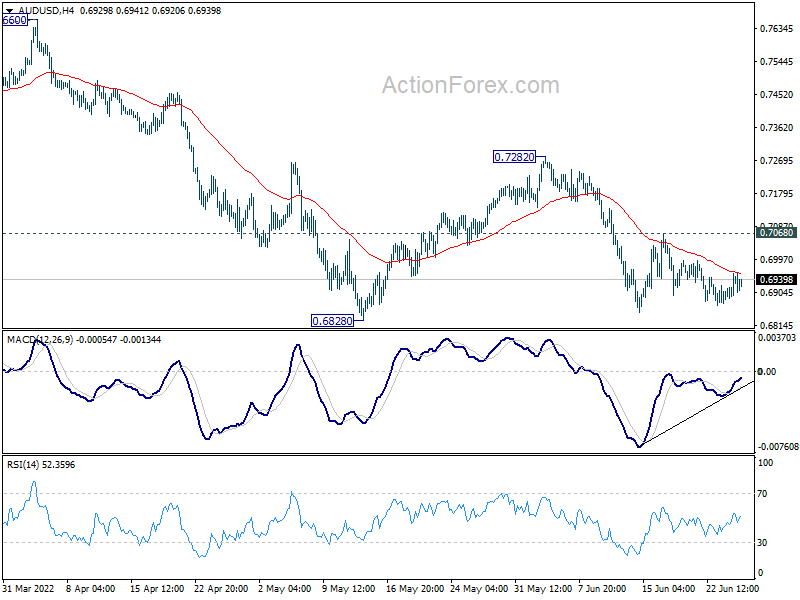
In the bigger picture, price actions from 0.8006 are seen as a corrective pattern to rise from 0.5506 (2020 low). Deeper fall could still be seen to 50% retracement of 0.5506 to 0.8006 at 0.6756. This coincides with 100% projection of 0.8006 to 0.7105 from 0.7660 at 0.6760. Strong support is expected from 0.6756/60 cluster to contain downside to complete the correction. Meanwhile, firm break of 0.7660 resistance will confirm that such corrective pattern has completed, and larger up trend is ready to resume.
Russia Defaulted on its Foreign Sovereign Debt for the First Time in Over a Century
Markets
The short squeeze on bond markets stopped on Friday. US Treasuries underperformed German Bunds during the WS risk rally (+3%). US yields rose by 4 bps (5-yr) to 5.9 bps (30-yr). German yields ended narrowly higher on the day. EUR/USD gained slightly ground, from 1.0523 to 1.0553, but first resistance at 1.0627/42 was never in danger. EUR/GBP sticks with the 0.86 big figure. UK FM Truss in an opinion piece in the FT adds weight to the UK’s decision to push through with a bill to change the Northern Ireland protocol. The UK wants to fix problems in four areas: customs and agri-food checks, regulation, subsidy control and VAT and governance. The EU started legislative action against the UK for this infringement against the withdrawal agreement. New brexit struggles add to our bearish views on sterling medium to long term.
Last week’s move brought a little more balance in a unidirectional (bond) market focused on central bank’s inflation fight. Some future downside growth risks and their potential impact on the normalization cycle are now discounted. It doesn’t change the near term trajectory of expected policy rate paths though. We stick to our view that July and September meetings are priced in, leaving scope for consolidation over Summer. September forecasts by the ECB and Fed will be decisive on the continuation of the core bond sell-off medium term, which remains our favored scenario as we don’t see scope to halt tightening cycles any time soon.
The first days of the trading week could see a continuation of last week’s trends (improved risk sentiment, correction/status quo on bond markets, dollar slightly in the defensive). The ECB forum on central banking in Sintra will grab a lot of attention, but we expect Lagarde and co to stick to the views spelled out at the June 9 policy meeting and at the June 15 extraordinary meeting. It’s probably too early to get additional details on the proposed ECB tool to avoid unwarranted market fragmentation. Today’s eco calendar only contains May US durable goods orders. Later this week, we’ll get US consumer confidence, Richmond Fed manufacturing, EC confidence numbers, US PCE deflators (lagging on CPI), US manufacturing ISM and especially June EMU inflation numbers on Friday. The monthly dynamic is expected to stay high, resulting in a new record high Y/Y outcome. EMU core CPI might even push through the 4% Y/Y barrier. Such readings could tilt the growth vs inflation scale again a little bit more if favour of the latter.
News Headlines
Russia has defaulted on its foreign sovereign debt for the first time in over a century. The 30-day grace period that kicked in on May 27, when Western sanctions made it unable to pay about $100 million interest payments, ended on Sunday. Seeking to avoid it, Russia announced last week it would switch to servicing its $40bn of outstanding sovereign debt in rubles, citing a “force-majeure” situation created by the West. The last time Russia defaulted on foreign debt was in 1918. During the financial crisis and ruble collapse in 1998, then president Yeltsin’s government failed to pay on $40bn of its local debt. Bondholders are now expected to keep a wait-and-see approach. Their claims only become void three years from the payment data.
The Bank of International Settlements in its annual report said the leading economies are closing in on the tipping point into a world where rapid price increases are (perceived) normal, more synchronized, dominate daily life and are difficult to quell. It recommended its central bank members to be decisive and not to be shy of inflicting short-term pain and even recessions to prevent moving into such a scenario. “The overriding priority is to avoid falling behind the curve, which would ultimately entail a more abrupt and vigorous adjustment. This would amplify the economic and social costs of bringing inflation under control.”, it concluded.
Gold Finds Resistance Around the 200-day SMA Within Upward Sloping Channel
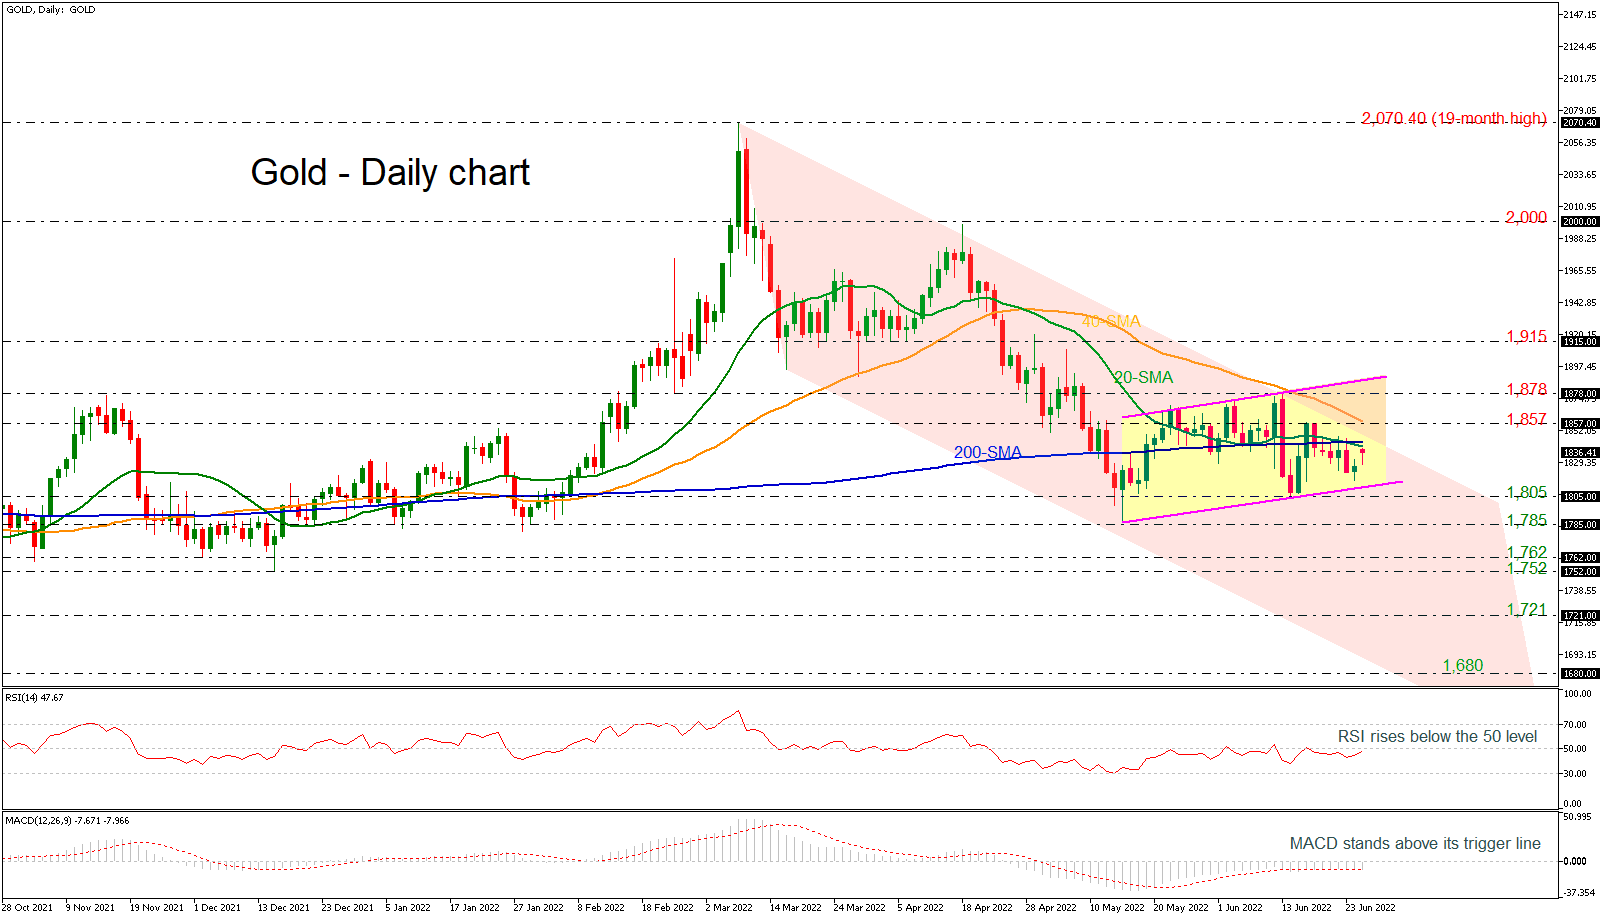
Gold have developing slightly higher over the last five weeks, holding within an upwardly sloping channel.
The price opened with a positive gap earlier in the day, remaining marginally below the 200-day simple moving average (SMA), while the RSI and the MACD provide little direction about the next move in the price as the former is heading up below its 50 neutral mark and the latter remains stable within the negative territory.
If buyers break through the 1,857 barrier and the 50-day SMA, the next challenge could come from the area between the 1,878 barrier and the top of the short-term bullish channel. Notably, the upper limit of the medium-term bearish channel is in the same area. So, any move up from there could be important for getting close to the 1,915 barrier. Even higher, the ascent may stop between the 2,000 round number.
On the other hand, if the price closes below $1,810, it may stay stable around the uptrend line ahead of the 1,805 support. Moving lower, the market may reach the 1,785 level, causing a sharper drop towards 1,752-1,762.
Overall, gold is still neutral in the short term, and traders are waiting for a long-term move above 1,890 or below 1,805 to give the market a new direction.
Daily Technical Analysis
EUR/USD
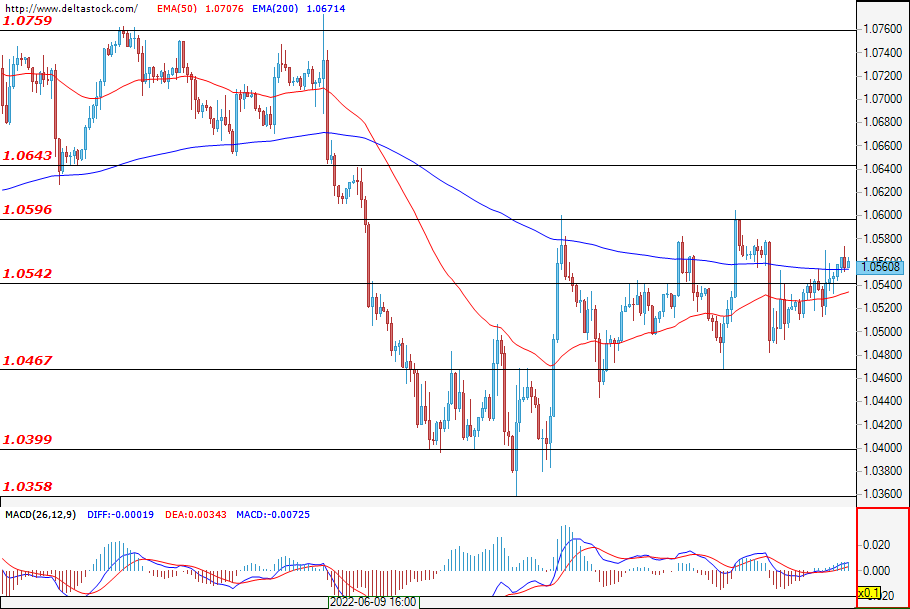
Although no key resistance was overcome during the last trading session, the bulls managed to score some gains. The bulls’ fight to the top will first have to overcome the key resistances at 1.060 and at 1.064. If the bears manage to "show their teeth" instead and reverse the market movement, then they will have to deal with the support at 1.0467 first. Today, traders will focus their attention on the news on durable goods orders (11:30 GMT) and the data on planned sales of ready-made homes (14:00 GMT).
USD/JPY
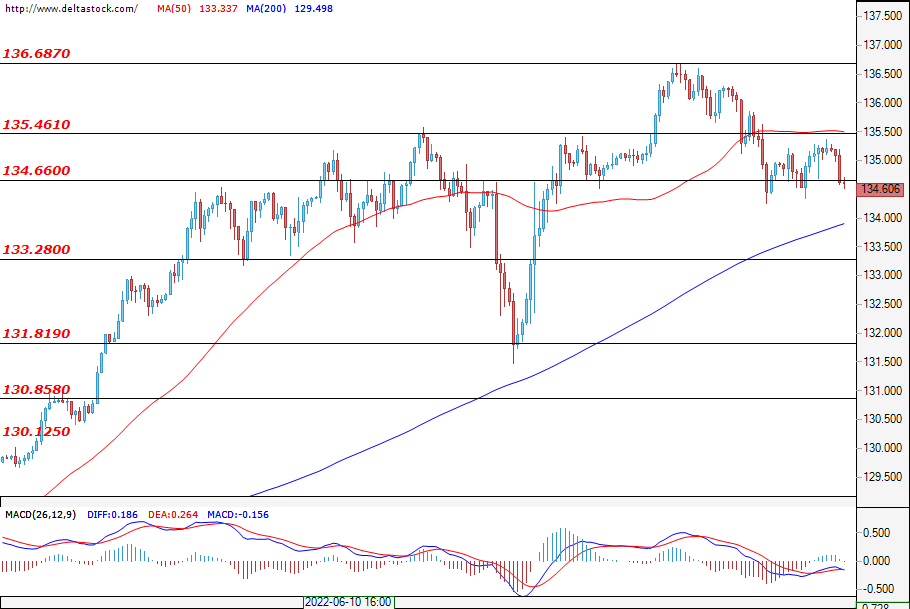
The Ninja’s trading session begins with the bears testing the support at 134.66. If they manage to overcome it, then the next key support for them would be 133.28. If the yen continues to lose ground against the U.S. dollar, then the bulls will have to deal with the resistances at 135.46 and at 136.68. This week, no macroeconomic news from Japan are expected to have a strong effect on the market.
GBP/USD
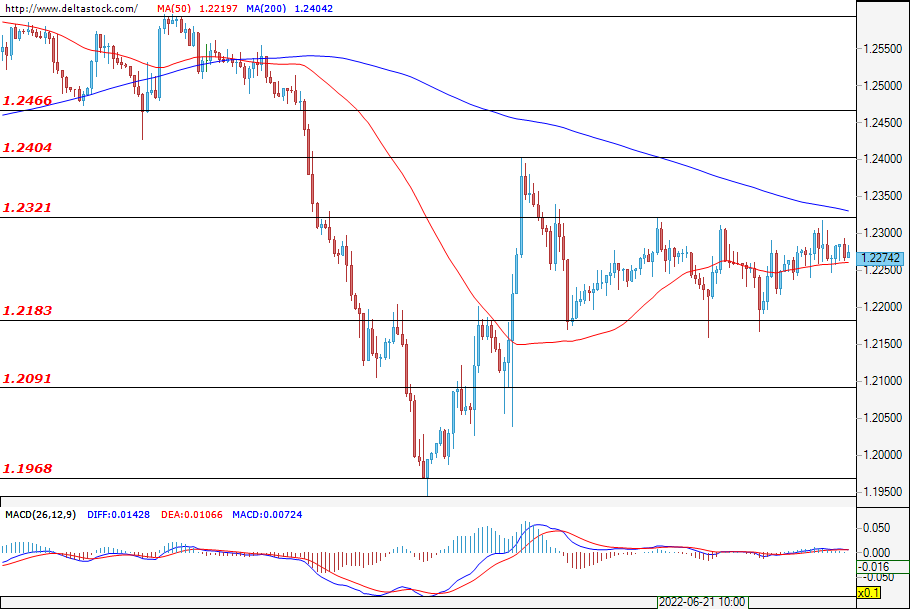
During the last trading session, the Sterling continued to consolidate between the range of 1.2183 and 1.2321. If the bears manage to breach the lower limit of the range, then the next support in front of them would be that at 1.2091. If the bulls manage to gain momentum instead and overcome the upper limit of the range, then they could meet resistance at 1.2404.
EUGERMANY40
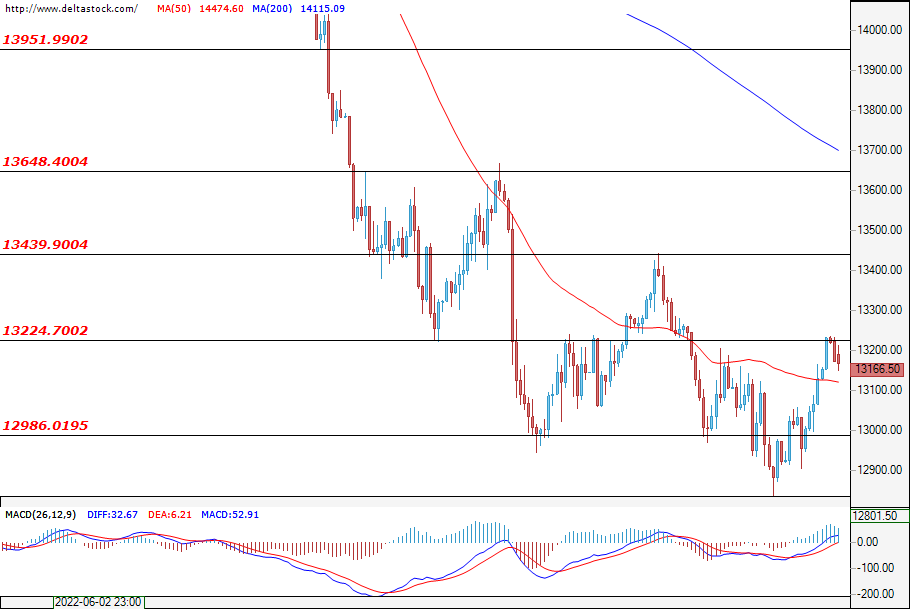
The early hours of today's trading session were marked by the bulls testing the resistance at 13224. While initially they failed to do so, if the next test attempt is successful, then traders will have to deal with the resistance prior to the level of 13439. On the other hand, if the bears regain their positions, then the key support in front of them would be located at 12986.
US30
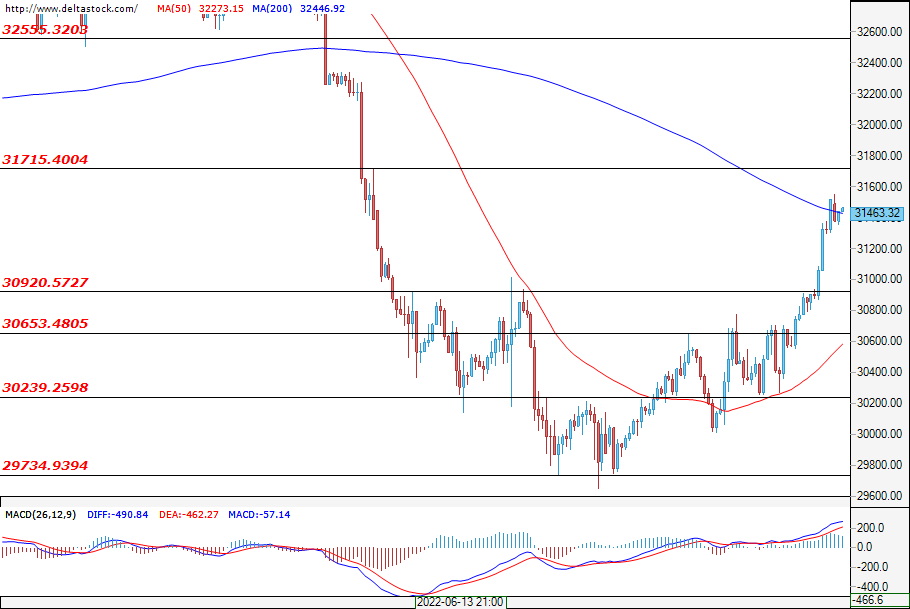
It looks like the bulls’ most resounding success during today's trading session can be observed with the American blue-chip index. As soon as the opening bell rang, investors with positive attitudes headed towards the resistance at 31715. If they keep the momentum going and overcome the above-mentioned resistance, then they will have to face the next one at 32555. However, if the bears manage to overshadow the bulls’ ambitions, then they will have to breach the support at 30930.
Lower Inflation Expectations Support Risk Sentiment
Market movers today
The ECB's Sintra Forum kicks off today, but key speeches from policymakers will probably not come until tomorrow. We'll also look out for more headlines from the G7 summit in Germany amid ongoing discussions on how to resolve the global food crisis and a possible "price cap" on Russian oil.
Norwegian retail sales should show a moderate decrease in May amid high energy prices eroding purchasing power.
Later this week, the Riksbank meeting and Chinese PMIs on Thursday and euro area inflation figures on Friday will be in focus.
The 60 second overview
Lower inflation expectations: University of Michigan long-term inflation expectations were revised down to 3.1% from earlier 3.3% in the final report released on Friday. The big jump in the preliminary report from 3.0% to 3.3% was a key reason why the Fed hiked by 75bp and not 50bp, so the probability of another 75bp in July has probably declined on the back of the downward revision. Currently, the market is pricing a 50/50 probability of another 75bp hike next month relative to a 50bp hike. That said, inflation is still key for the Fed and the problem is that there are upside risks to long-term inflation expectations as long as actual inflation stays high given that economic agents often have adaptive inflation expectations.
Risk appetite: The incipient signs that the inflation picture is improving supported risk appetite on Friday with equities higher, cyclical currencies higher, tighter credit spreads, and higher crypto.
Russia default on foreign debt: Russia defaulted on their foreign-currency sovereign debt Sunday, as due to the financial sanctions Russia did not manage to pay the USD 100m in delayed interest payments. Yesterday, the 30 days grace period expired for the interest payments originally due May 27. We should expect a formal declaration from the rating agencies this morning. However, Russia has already been transformed into a financial, political and economic pariah state and as such the expected default will only have symbolic importance and will not impact sentiment in global financial markets today.
Oil: Oil prices reversed some of the recent declines on Friday as risk appetite improved. The leaders at the G7 meeting discussed over the weekend how to impose a price cap on Russian oil. However, that it probably easier said than done. But apparently the G7 will try to link the cap to shipping and insurance of Russian oil. Note that Russian Ural oil is already trading with a 30 USD a barrel discount to Brent.
This week the oil market report from the EIA might attract some market attention. There is some tentative evidence that demand is slowing (e.g. PMIs around 50 now) and some tentative evidence that oil inventories may be on the rise. In light of this, should the key market report show oil inventories (incl. SPR) are still being drawn down, we may very well see a new upward move in oil.
Equities: The gloomy week ended with a bear market rally, as inflation worries faded (yet replaced by increasing recession worries). Bond- and equity markets in tune once again, with yields and equities higher. However, real yields have dropped continuously over the last week which has fuelled the outperformance in growth-, quality- and defensive stocks. The gain was broad based on Friday but long duration cyclicals such as tech, consumer discretionary and communication services best performing. Hence, defensives and cyclicals traded on par last week, despite the dreadful PMI reading. S&P500 surged by 3.1%, Nasdaq 3.3%, Russell 2000 3.2% and Dow 2.7%.
FI: Friday's trading session was rather choppy but in the end, markets were broadly unchanged on the day across the board, amid a noteworthy revision of the University of Michigan inflation expectations to 3.1% from 3.3%, which we believe was a key reason why Fed hiked 75bp. The choppy session briefly pushed BTPs-Bund spread above 200bp, before settling around 196bp, as markets naturally still focus on how an anti-fragmentation could be structured.
FX: Cyclically sensitive currencies ended last week on a very strong footing with most notably NOK and ZAR gaining more than 1% vs the USD in Friday's session. USD and JPY were among the underperformers while EUR was in the middle of the pack leaving EUR/USD north of the 1.05 mark.
Another Dead Cat Bounce?
Asian stocks kicked off the week on a bullish note to catch up with the American session gains on Friday. Softening oil and commodity prices, combined with the softening University of Michigan expectations on five-year inflation survey helped explaining a part gains in US equities.
Besides the softer energy prices and encouraging inflation expectations, a part of last week’s rally is explained by high volatility, and perhaps a quarterly rebalancing of portfolios where investors bought more equities to keep the proportion of equities stable as the sharp decline in equity prices lead to a relatively underweight equities in portfolios.
The S&P500 jumped 3% on Friday, and 6.5% over the week, while Nasdaq rallied 3.50% on Friday and closed the week 7.5% higher.
BUT, the size of the rebound remains worrying, as a 3-4% jump in stocks is a sign that the market volatility remains high, the conditions are choppy, and the gains may not last long.
Escalation in Ukraine
Russia bombed Kiev this weekend, as a sign of a renewed escalation in the Ukraine war. G7 leaders hinted at more sanctions against Russia. Meanwhile, Russia defaulted on its foreign bond, not because it didn’t have money to service its debt, but it couldn’t process the payment because of sanctions.
News of further escalation between Russia and the West is pushing oil prices higher this morning. The barrel of US crude is about the test the $110pb mark at the time of writing.
However, the upside potential could remain limited, as the recession talk will likely keep the oil bulls relatively on the sidelines. Prices above $120pb weigh on demand prospects and have an immediate cooling effect on prices.
OPEC meets on June 29 and 30, and is expected to stick to its plan to boost output by around 650’000 barrels a day. But even if OPEC pumps more, the refining capacity remains limited, which means that higher oil supply will not necessarily lead to lower oil prices in the medium run.
Attention to shift to earnings
We had a couple of rough weeks, that started with a US inflation print which showed that inflation in the US made a U-turn and printed a fresh 40-year high, which then led to a 75bp hike in the US, which also triggered a set of unexpected, and surprise rate hikes from the central banks around the world. Then, Jerome Powell hinted at the possibility that the US may not make a soft landing as the Federal Reserve (Fed) is stepping on gas to fight back the soaring inflation. The mix of bad macro news pushed the global yields higher, and the stocks lower.
Investor attention will slowly start shifting to the second quarter earnings to give a better idea on how the Fed tightening and the persistent inflation impacted the company earnings in the latest quarter.
Nike and Micron will be in focus this week, as US banks are due to release earnings in about two weeks.
USD/CAD Daily Outlook
Daily Pivots: (S1) 1.2855; (P) 1.2931; (R1) 1.2973; More...
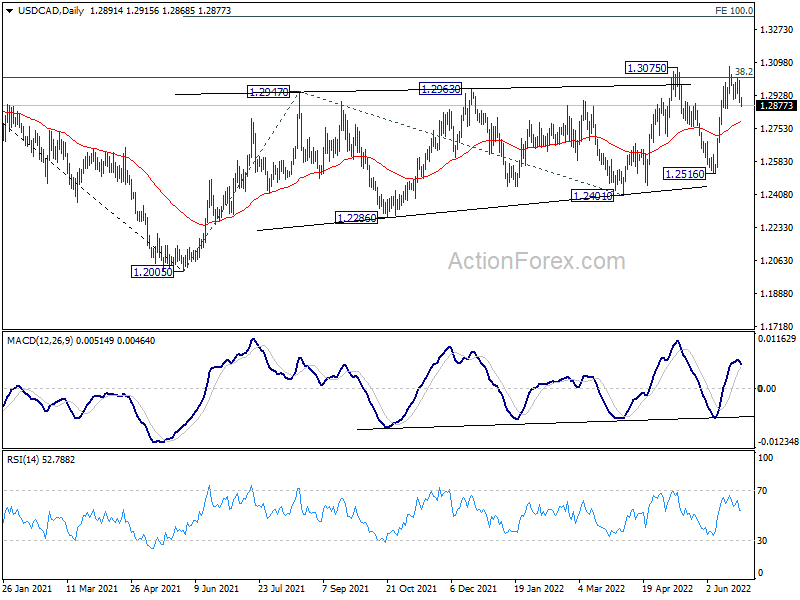
Intraday bias in USD/CAD remains neutral at this point, further rally is mildly in favor with 1.2859 support intact. On the upside, break of 1.3077 and sustained trading above 1.3022 fibonacci level will carry larger bullish implications. Next target is 100% projection of 1.2005 to 1.2947 from 1.2401 at 1.3343. However, break of 1.2859 minor support will turn bias back to the downside for 1.2516 support instead.
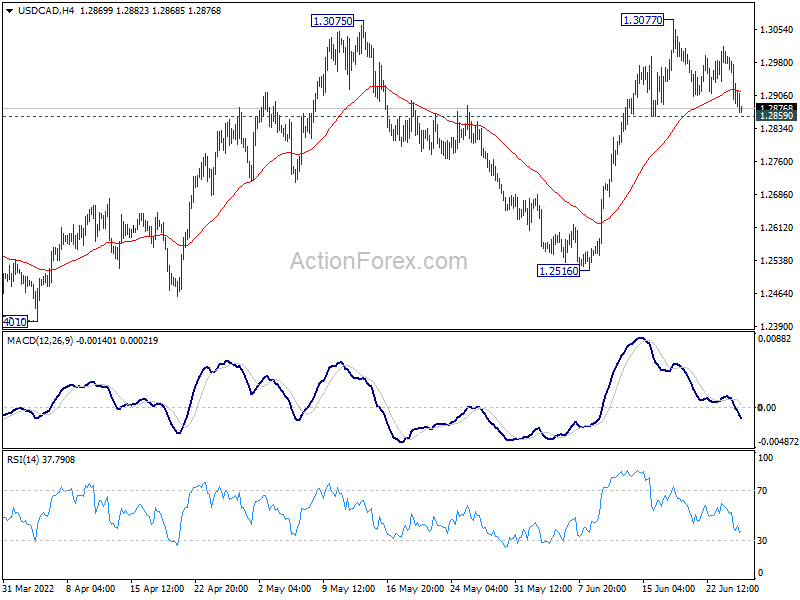
In the bigger picture, focus stays on 38.2% retracement of 1.4667 (2020 high) to 1.2005 (2021 low) at 1.3022. Sustained break there should confirm that the down trend from 1.4667 has completed after defending 1.2061 long term cluster support. Further rise would then be seen towards 61.8% retracement at 1.3650. However, rejection by 1.3022 will maintain medium term bearishness.